Explore
 Validate
 Learn
Learn Western blot
 Immunocytochemistry
Antibody data
- Antibody Data
- Antigen structure
- References [2]
- Comments [0]
- Validations
- Immunocytochemistry [1]
- Immunohistochemistry [2]
- Flow cytometry [4]
- Other assay [2]
Submit
Validation data
Reference
Comment
Report error
- Product number
- 711778 - Provider product page

- Provider
- Invitrogen Antibodies
- Product name
- IDO Recombinant Superclonal™ Antibody
- Antibody type
- Other
- Antigen
- Other
- Description
- This antibody is predicted to react with Monkey, Pig, Horse, Goat Recombinant rabbit Superclonal™ antibodies are unique offerings from Thermo Fisher Scientific. They are comprised of a selection of multiple different recombinant monoclonal antibodies, providing the best of both worlds - the sensitivity of polyclonal antibodies with the specificity of monoclonal antibodies - all delivered with the consistency only found in a recombinant antibody. While functionally the same as a polyclonal antibody - recognizing multiple epitope sites on the target and producing higher detection sensitivity for low abundance targets - a recombinant rabbit Superclonal™ antibody has a known mixture of light and heavy chains. The exact population can be produced in every lot, circumventing the biological variability typically associated with polyclonal antibody production. Note: Formerly called “Recombinant polyclonal antibody”, this product is now rebranded as “Recombinant Superclonal™ antibody”. The physical product and the performance remain unchanged.
- Reactivity
- Human
- Host
- Rabbit
- Isotype
- IgG
- Vial size
- 100 μg
- Concentration
- 0.5 mg/mL
- Storage
- Store at 4°C short term. For long term storage, store at -20°C, avoiding freeze/thaw cycles.
Submitted references Stromal-like Wilms tumor cells induce human Natural Killer cell degranulation and display immunomodulatory properties towards NK cells.
Recovery of Renal Function following Kidney-Specific VEGF Therapy in Experimental Renovascular Disease.
Cantoni C, Serra M, Parisi E, Azzarone B, Sementa AR, Nasto LA, Moretta L, Candiano G, Bottino C, Ghiggeri GM, Spaggiari GM
Oncoimmunology 2021 Mar 8;10(1):1879530
Oncoimmunology 2021 Mar 8;10(1):1879530
Recovery of Renal Function following Kidney-Specific VEGF Therapy in Experimental Renovascular Disease.
Engel JE, Williams ML, Williams E, Azar C, Taylor EB, Bidwell GL, Chade AR
American journal of nephrology 2020;51(11):891-902
American journal of nephrology 2020;51(11):891-902
No comments: Submit comment
Supportive validation
- Submitted by
- Invitrogen Antibodies (provider)
- Main image
- Experimental details
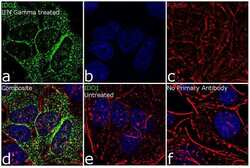
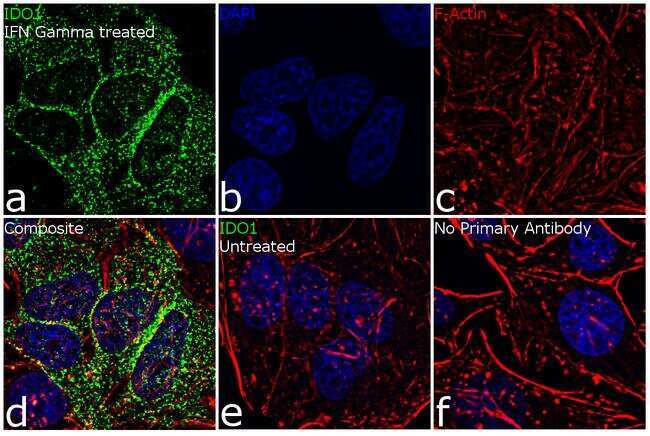
- For immunofluorescence analysis, IFN gamma (50 ng/mL 24h) treated HeLa cells were fixed and permeabilized for detection of endogenous IDO1 using Anti-IDO1 Recombinant Rabbit Monoclonal Antibody (Product # 711778, 2 µg/mL) and labeled with Goat anti-Rabbit IgG (Heavy Chain) Superclonal™ Secondary Antibody, Alexa Fluor® 488 conjugate (Product # A27034, 1:2000). Panel a) shows representative cells that were stained for detection and localization of IDO1 protein (green), Panel b) is stained for nuclei (blue) using SlowFade® Gold Antifade Mountant with DAPI (Product # S36938). Panel c) represents cytoskeletal F-actin staining using Rhodamine Phalloidin (Product # R415, 1:300). Panel d) is a composite image of Panels a, b and c clearly demonstrating cytoplasmic localisation of IDO1. Panel e) shows no signal in untreated cells. Panel f) represents control cells with no primary antibody to assess background.
Supportive validation
- Submitted by
- Invitrogen Antibodies (provider)
- Main image
- Experimental details
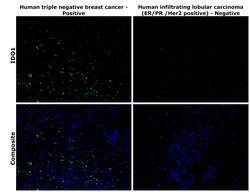
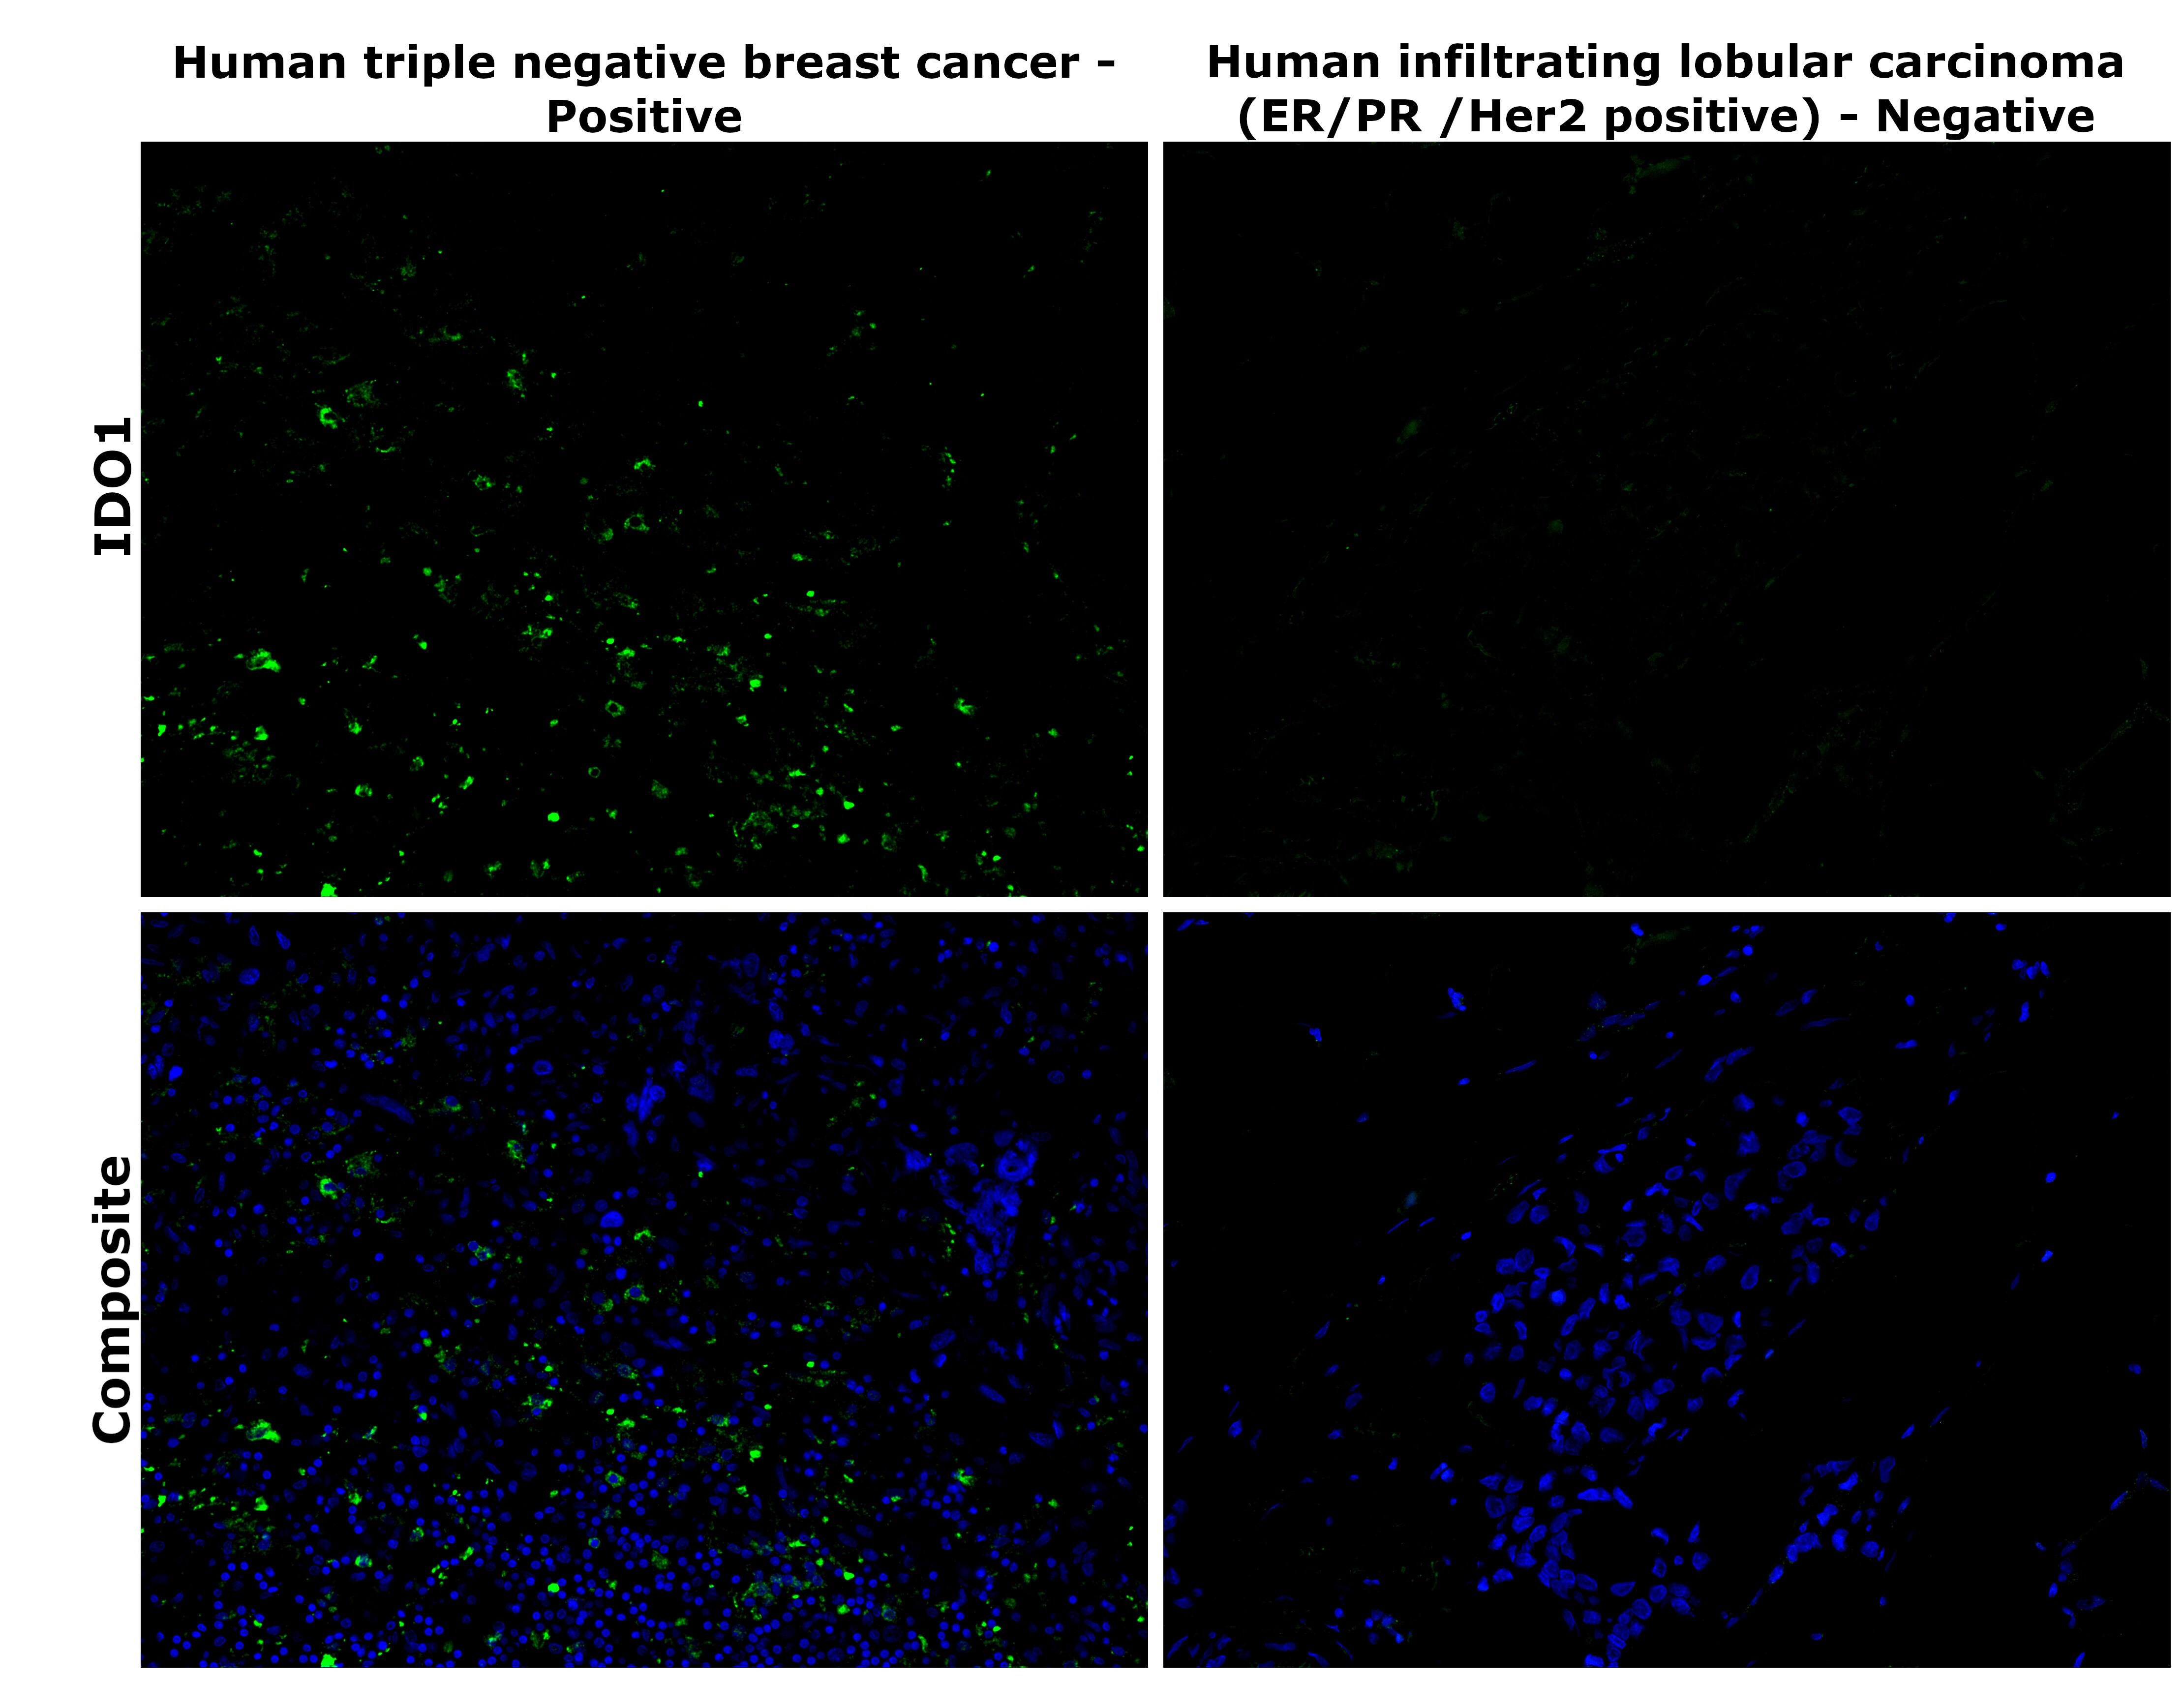
- Immunohistochemical analysis of IDO1 was performed using formalin-fixed paraffin-embedded human cancer (triple negative breast cancer) and human cancer (infiltrating lobular carcinoma - ER/PR/Her2 positive) tissue sections. To expose the target protein, heat-induced epitope retrieval was performed on de-paraffinized sections using eBioscience™ IHC Antigen Retrieval Solution - Low pH (10X) (Product # 00-4955-58) diluted to 1X solution in water in a decloaking chamber at 110 degree Celsius for 15 minutes. Following antigen retrieval, the sections were blocked with 3% H2O2 for 1 hour at room temperature followed by 2% normal goat serum in 1X PBS for 45 minutes at room temperature and then probed with IDO Recombinant Rabbit Superclonal™ Antibody (Product # 711778) at 1 µg/mL in 0.1% normal goat serum overnight at 4 degree Celsius in a humidified chamber. Detection was performed using Alexa Fluor™ 488 Tyramide SuperBoost™ Kit, goat anti-rabbit IgG (Product # B40922). Nuclei were stained with DAPI (Product # D1306) and the sections were mounted using ProLong™ Glass Antifade Mountant (Product # P36984). The images were captured on EVOS™ M7000 Imaging System (Product # AMF7000) at 20X magnification and externally deconvoluted.
- Submitted by
- Invitrogen Antibodies (provider)
- Main image
- Experimental details
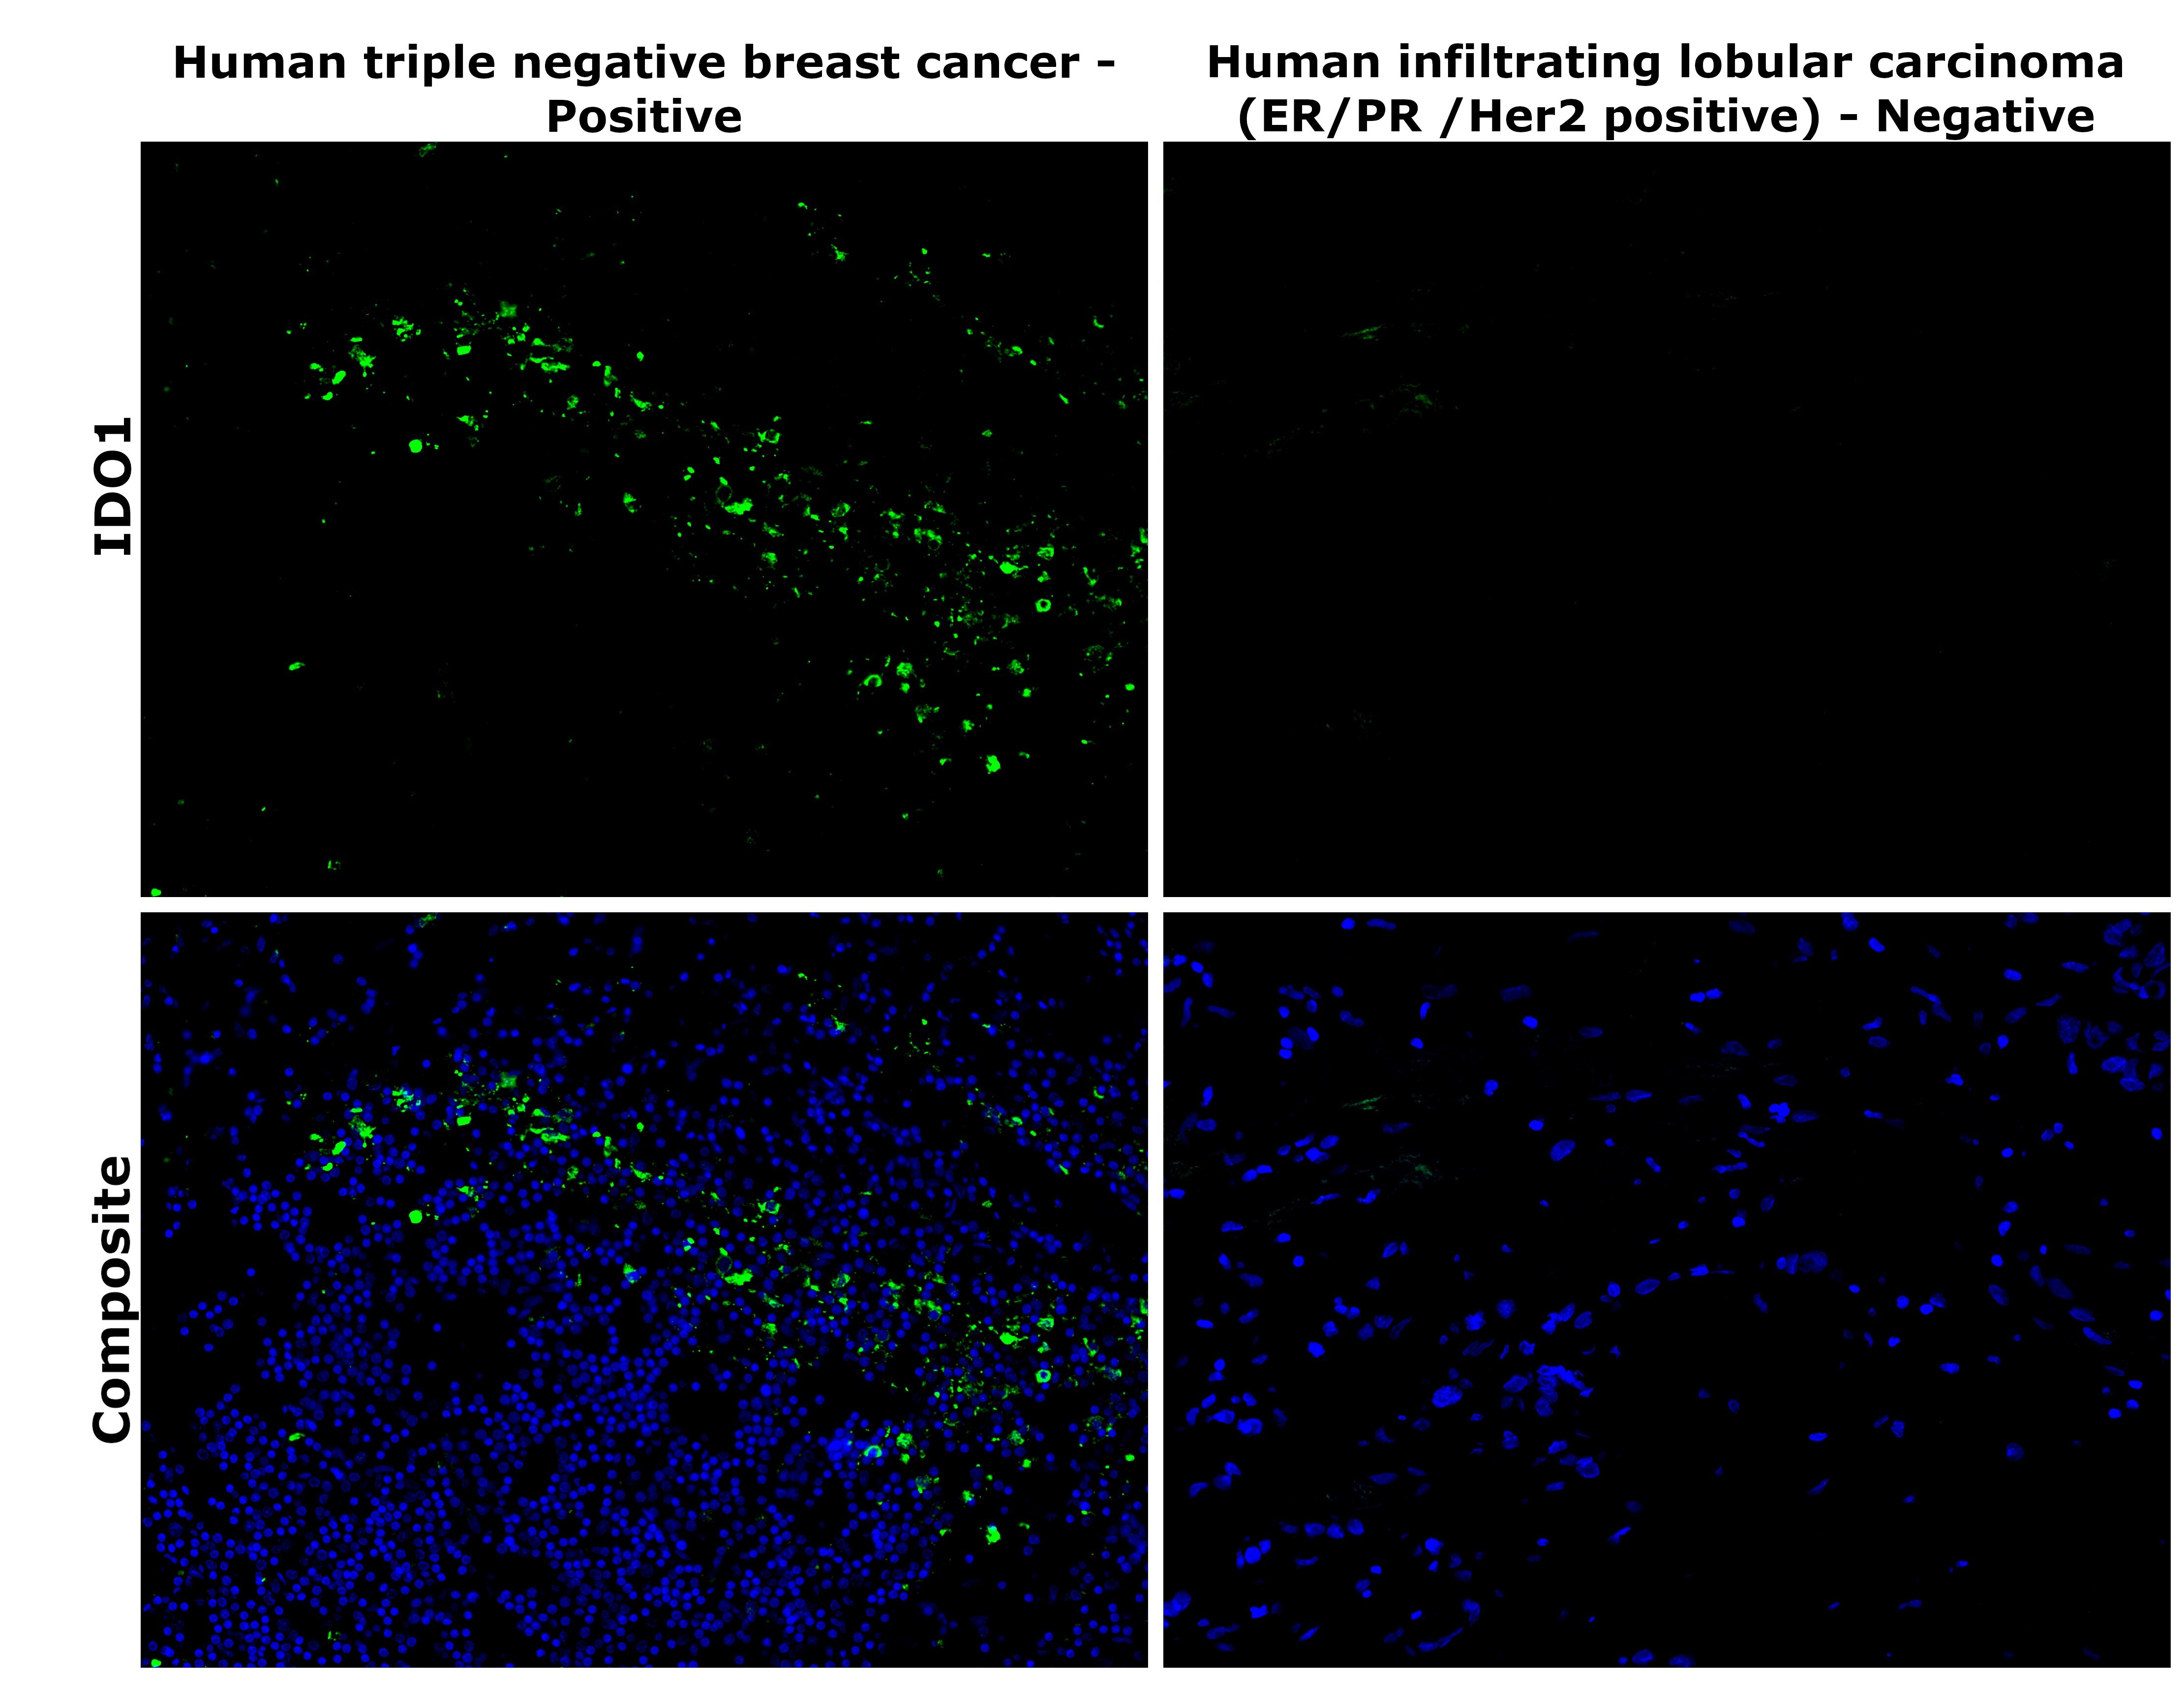
- Immunohistochemical analysis of IDO1 was performed using formalin-fixed paraffin-embedded human cancer (triple negative breast cancer) and human cancer (infiltrating lobular carcinoma - ER/PR/Her2 positive) tissue sections. To expose the target protein, heat-induced epitope retrieval was performed on de-paraffinized sections using eBioscience™ IHC Antigen Retrieval Solution - Low pH (10X) (Product # 00-4955-58) diluted to 1X solution in water in a decloaking chamber at 110 degree Celsius for 15 minutes. Following antigen retrieval, the sections were blocked with 3% H2O2 for 1 hour at room temperature followed by 2% normal goat serum in 1X PBS for 45 minutes at room temperature and then probed with IDO Recombinant Rabbit Superclonal™ Antibody (Product # 711778) at 1 µg/mL in 0.1% normal goat serum overnight at 4 degree Celsius in a humidified chamber. Detection was performed using Alexa Fluor™ 488 Tyramide SuperBoost™ Kit, goat anti-rabbit IgG (Product # B40922). Nuclei were stained with DAPI (Product # D1306) and the sections were mounted using ProLong™ Glass Antifade Mountant (Product # P36984). The images were captured on EVOS™ M7000 Imaging System (Product # AMF7000) at 20X magnification and externally deconvoluted.
Supportive validation
- Submitted by
- Invitrogen Antibodies (provider)
- Main image
- Experimental details
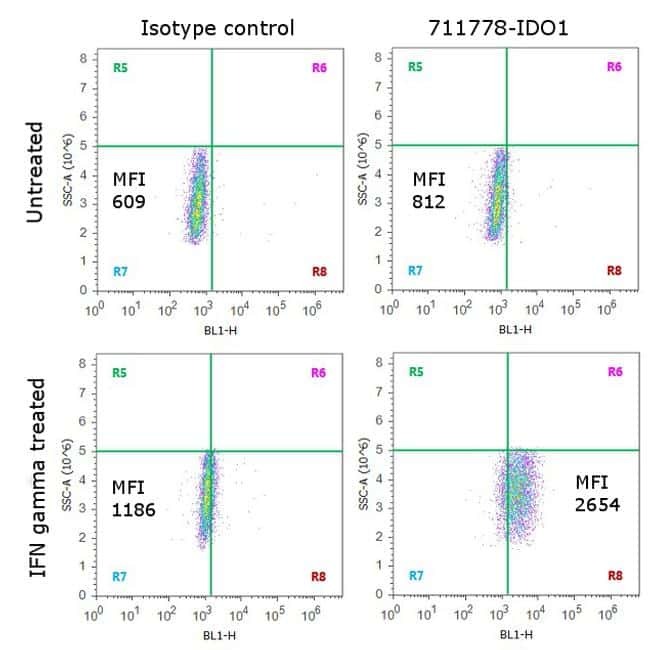
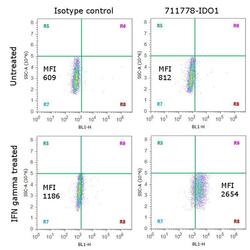
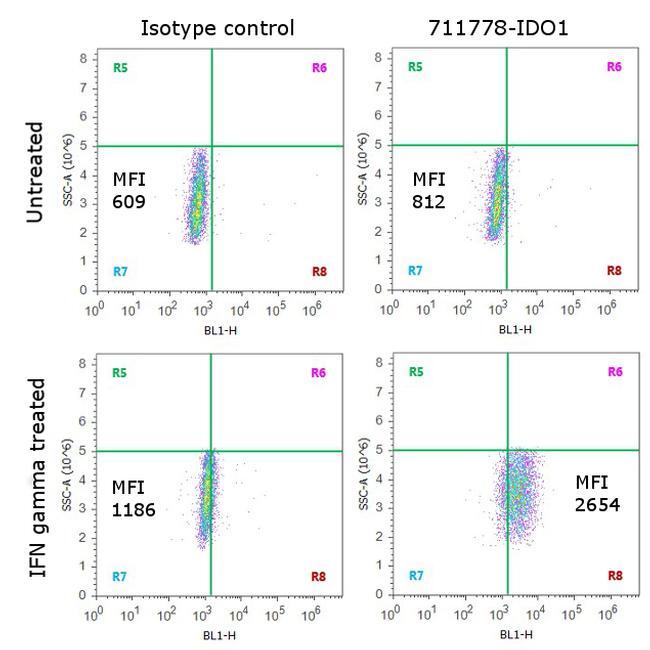
- Flow Cytometry analysis of endogenous IDO1 in bone marrow derived mesenchymal stem cells was performed out using Anti-IDO Recombinant Rabbit Polyclonal Antibody (Product # 711778). Cells were either untreated or treated with 10 ng/mL IFN gamma for 40 hours, labeled with Anti-IDO1 Recombinant Rabbit Polyclonal Antibody (Product # 711778, 5 µg/ 1M cells) followed by detection with Goat anti-Rabbit IgG (H+L) Superclonal™ Secondary Antibody, (Alexa Fluor® 488 conjugate, Product # A27034, 0.4 µg/mL, 1:2500). Rabbit IgG was used as the isotype control to determine nonspecific binding. A representative of 10,000 cells were acquired and analyzed for each sample using an Attune® Acoustic Focusing Cytometer (Product # 4468770).
- Submitted by
- Invitrogen Antibodies (provider)
- Main image
- Experimental details
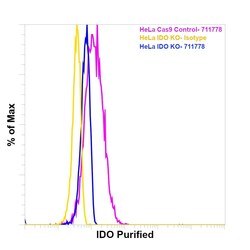
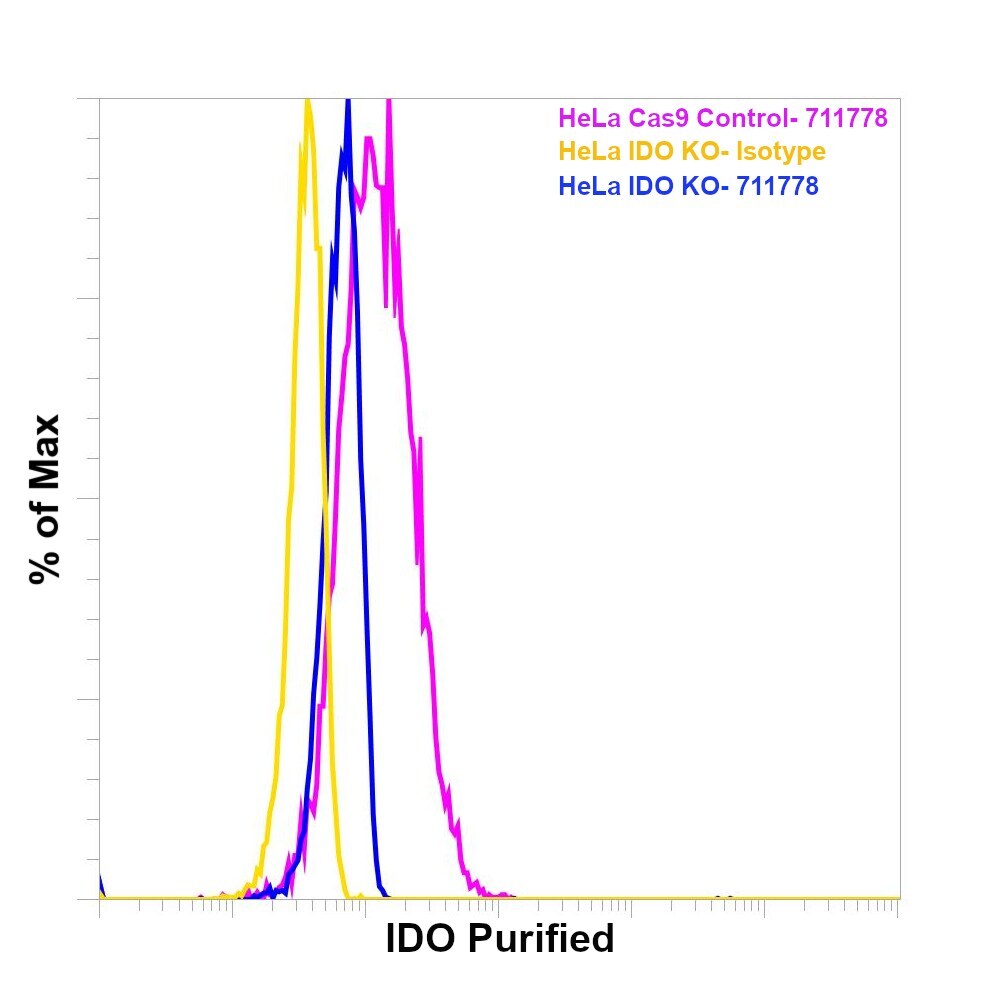
- Knockout of IDO was achieved by CRISPR-Cas9 genome editing using LentiArray™ Lentiviral sgRNA (Product # A32042, Assay ID CRISPR864924_LV) and LentiArray Cas9 Lentivirus (Product # A32064). For Flow cytometry analysis, IDO Knock out cells were treated with 50 ng/mL IFN gamma for 24hrs and stained intracellularly using the intracellular Fixation & Permeabilization Buffer Set (Product # 88-8824-00) and protocol, with 2 µg/mL IDO Recombinant Polyclonal Antibody (Product # 711778, blue histogram) or with the 2 µg/mL Rabbit IgG Isotype Control (RbNP15), eBioscience™ (14-4616-82, yellow histogram) followed by Goat anti-Rabbit IgG (Heavy chain), Superclonal™ Recombinant Secondary Antibody, Alexa Fluor™ Plus 488 (Product # A55053, 1:1000). IFN gamma treated HeLa Cas9 control cells were also stained with the 2 µg/mL IDO Recombinant Polyclonal Antibody (Product # 711778, pink histogram) followed by the secondary antibody. Lossof signal was observed in the IDO KOcells stained with IDO antibody but not in the control Cas9cells. Viable cells were used for analysis, as determined by Fixable Viability Dye eFluor™780 (Product # 65-0865-18).
- Submitted by
- Invitrogen Antibodies (provider)
- Main image

- Experimental details
- Knockout of IDO was achieved by CRISPR-Cas9 genome editing using LentiArray™ Lentiviral sgRNA (Product # A32042, Assay ID CRISPR864924_LV) and LentiArray Cas9 Lentivirus (Product # A32064). For Flow cytometry analysis, IDO Knock out cells were treated with 50 ng/mL IFN gamma for 24hrs and stained intracellularly using the intracellular Fixation & Permeabilization Buffer Set (Product # 88-8824-00) and protocol, with 2 µg/mL IDO Recombinant Rabbit Superclonal™ Antibody (Product # 711778, blue histogram) or with the 2 µg/mL Rabbit IgG Isotype Control (RbNP15), eBioscience™ (14-4616-82, yellow histogram) followed by Goat anti-Rabbit IgG (Heavy chain), Superclonal™ Recombinant Secondary Antibody, Alexa Fluor™ Plus 488 (Product # A55053, 1:1000). IFN gamma treated HeLa Cas9 control cells were also stained with the 2 µg/mL IDO Recombinant Rabbit Superclonal™ Antibody (Product # 711778, pink histogram) followed by the secondary antibody. Lossof signal was observed in the IDO KOcells stained with IDO antibody but not in the control Cas9cells. Viable cells were used for analysis, as determined by Fixable Viability Dye eFluor™780 (Product # 65-0865-18).

- Submitted by
- Invitrogen Antibodies (provider)
- Main image
- Experimental details
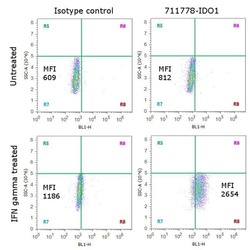
- Flow Cytometry analysis of endogenous IDO1 in bone marrow derived mesenchymal stem cells was performed out using Anti-IDO Recombinant Rabbit Superclonal™ Antibody (Product # 711778). Cells were either untreated or treated with 10 ng/mL IFN gamma for 40 hours, labeled with Anti-IDO1 Recombinant Rabbit Superclonal™ Antibody (Product # 711778, 5 µg/ 1M cells) followed by detection with Goat anti-Rabbit IgG (Heavy Chain) Superclonal™ Secondary Antibody, (Alexa Fluor® 488 conjugate, Product # A27034, 0.4 µg/mL, 1:2500). Rabbit IgG was used as the isotype control to determine nonspecific binding. A representative of 10,000 cells were acquired and analyzed for each sample using an Attune® Acoustic Focusing Cytometer (Product # 4468770).
Supportive validation
- Submitted by
- Invitrogen Antibodies (provider)
- Main image
- Experimental details
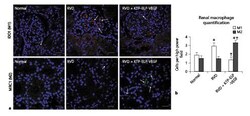
- Fig. 3. Representative immunostaining ( a ) and quantification ( b ) of M1 and M2 macrophages using the M1 marker IDO1 (red), the M2 marker MRC1 (green), and the nuclear counterstain DAPI (blue) in normal, RVD, and RVD + KTP-ELP-VEGF pigs after 10 weeks of observation. Untreated RVD pigs showed significantly increased macrophage infiltration which was markedly skewed towards inflammatory M1 polarization. Pigs treated with KTP-ELP-VEGF showed similar overall macrophage infiltration which was shifted in favor of anti-inflammatory M2s. Scale bar represents 20 mum; n = 6 per group. * p < 0.05 versus normal; + p < 0.05 versus RVD (single-way ANOVA and Tukey). IDO1, indoleamine-2,3-dioxygenase; MRC1, mannose receptor c-type 1; RVD, renovascular disease; KTP, kidney-targeting peptide; ELP, elastin-like polypeptide; VEGF, vascular endothelial growth factor.
- Submitted by
- Invitrogen Antibodies (provider)
- Main image
- Experimental details
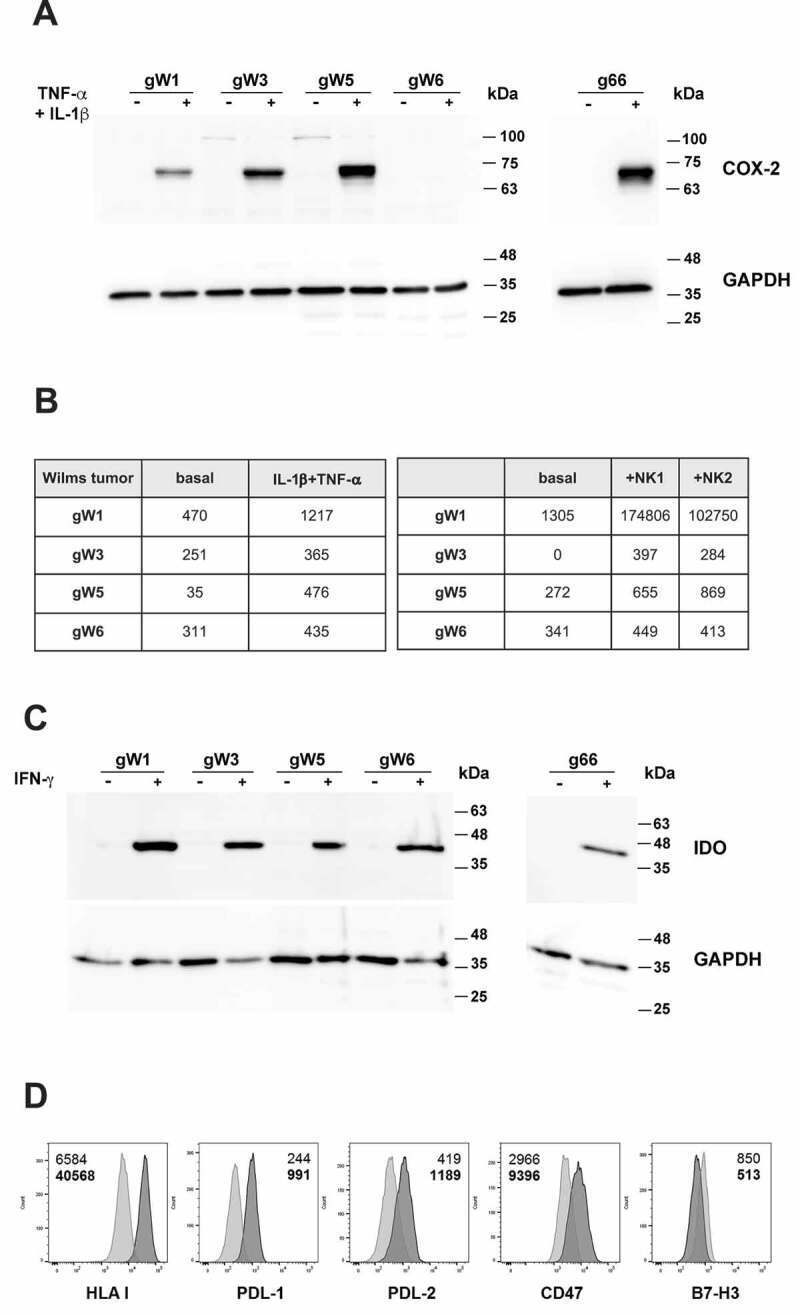
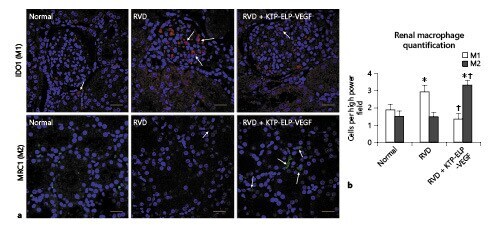
- Figure 5. Str-WT cells up-regulate inhibitory factors on exposure to inflammatory cytokines. (a) Western blot analysis of COX-2 expression in str-WT cells, and in g66 MSC, either unstimulated or stimulated with IL-1beta + TNF-alpha for 48 h. GAPDH expression was analyzed as positive control. Molecular weight (MW) markers (kDa) are indicated on the right. A representative experiment of three is shown. (b) Production of PGE2 by str-WT cells cultured alone (basal), stimulated by IL-1beta + TNF-alpha, or co-cultured with NK cells derived from two different healthy donors (NK1 and NK2). Culture supernatants were collected after 48 h (for cytokine stimulation experiments) or after 72 h (for co-culture experiments) and analyzed by ELISA assay. Data refer to the levels of PGE2 expressed as pg/ml. (c) Western blot analysis of IDO expression in str-WT cells and in g66 MSC, either unstimulated or stimulated with IFN-gamma for 48 h. GAPDH expression was analyzed as positive control. Molecular weight (MW) markers (kDa) are indicated on the right. A representative experiment of two is shown. (d) gW1 cells were stimulated with IFN-gamma and analyzed by flow cytometry for the expression of HLA-class I and the indicated immune checkpoint molecules. Light and dark gray histograms represent unstimulated and IFN-gamma-astimulated cells, respectively. Upper numbers represent MFI of unstimulated cells, while bold lower numbers refer to MFI of stimulated cells