Explore
 Validate
 Learn
Learn Western blot
 Immunocytochemistry
Antibody data
- Antibody Data
- Antigen structure
- References [36]
- Comments [0]
- Validations
- Immunocytochemistry [2]
- Flow cytometry [2]
- Other assay [41]
Submit
Validation data
Reference
Comment
Report error
- Product number
- 48-0319-42 - Provider product page

- Provider
- Invitrogen Antibodies
- Product name
- CD31 (PECAM-1) Monoclonal Antibody (WM-59 (WM59)), eFluor™ 450, eBioscience™
- Antibody type
- Monoclonal
- Antigen
- Other
- Description
- Description: The WM59 monoclonal antibody reacts with human CD31, also known as platelet-endothelial cell adhesion molecule-1 (PECAM-1) and gpIIa. This 130-140 kDa surface protein is expressed by endothelial cells and at low levels on leukocytes and platelets. It has been reported that CD38 binds to CD31. Homotypic interaction of CD31 is important in adhesion, cell-cell and cell-matrix interaction, and signal transduction. Applications Reported: This WM-59 (WM59) antibody has been reported for use in flow cytometric analysis. Applications Tested: This WM-59 (WM59) antibody has been pre-titrated and tested by flow cytometric analysis of normal human peripheral blood cells. This can be used at 5 µL (0.125 µg) per test. A test is defined as the amount (µg) of antibody that will stain a cell sample in a final volume of 100 µL. Cell number should be determined empirically but can range from 10^5 to 10^8 cells/test. eFluor™ 450 is an alternative to Pacific Blue™. eFluor™ 450 emits at 445 nm and is excited with the Violet laser (405 nm). Please make sure that your instrument is capable of detecting this fluorochome. Excitation: 405 nm; Emission: 445 nm; Laser: Violet Laser. Filtration: 0.2 µm post-manufacturing filtered.
- Reactivity
- Human
- Host
- Mouse
- Isotype
- IgG
- Antibody clone number
- WM-59 (WM59)
- Vial size
- 100 Tests
- Concentration
- 5 μL/Test
- Storage
- 4°C, store in dark, DO NOT FREEZE!
Submitted references Injectable hydrogel with MSNs/microRNA-21-5p delivery enables both immunomodification and enhanced angiogenesis for myocardial infarction therapy in pigs.
Expression and role of interleukin-1β and associated biomarkers in deep vein thrombosis.
Simultaneously targeting cancer-associated fibroblasts and angiogenic vessel as a treatment for TNBC.
Down-Regulated Exosomal MicroRNA-221 - 3p Derived From Senescent Mesenchymal Stem Cells Impairs Heart Repair.
The antifibrotic adipose-derived stromal cell: Grafted fat enriched with CD74+ adipose-derived stromal cells reduces chronic radiation-induced skin fibrosis.
Placental endovascular extravillous trophoblasts (enEVTs) educate maternal T-cell differentiation along the maternal-placental circulation.
Pro-Fibrotic CD26-Positive Fibroblasts Are Present in Greater Abundance in Breast Capsule Tissue of Irradiated Breasts.
PF-127 hydrogel plus sodium ascorbyl phosphate improves Wharton's jelly mesenchymal stem cell-mediated skin wound healing in mice.
Matrine inhibits the development and progression of ovarian cancer by repressing cancer associated phosphorylation signaling pathways.
Mesenchymal stromal cells lower platelet activation and assist in platelet formation in vitro.
CRISPR/Cas9‑mediated hypoxia inducible factor‑1α knockout enhances the antitumor effect of transarterial embolization in hepatocellular carcinoma.
Comprehensive human cell-type methylation atlas reveals origins of circulating cell-free DNA in health and disease.
Expansion of functional personalized cells with specific transgene combinations.
Prostaglandin E(2) Is Required for BMP4-Induced Mesoderm Differentiation of Human Embryonic Stem Cells.
Spatial and Single-Cell Transcriptional Profiling Identifies Functionally Distinct Human Dermal Fibroblast Subpopulations.
Increased infiltration and tolerised antigen-specific CD8(+) T(EM) cells in tumor but not peripheral blood have no impact on survival of HCMV(+) glioblastoma patients.
Targeted Disruption of TCF12 Reveals HEB as Essential in Human Mesodermal Specification and Hematopoiesis.
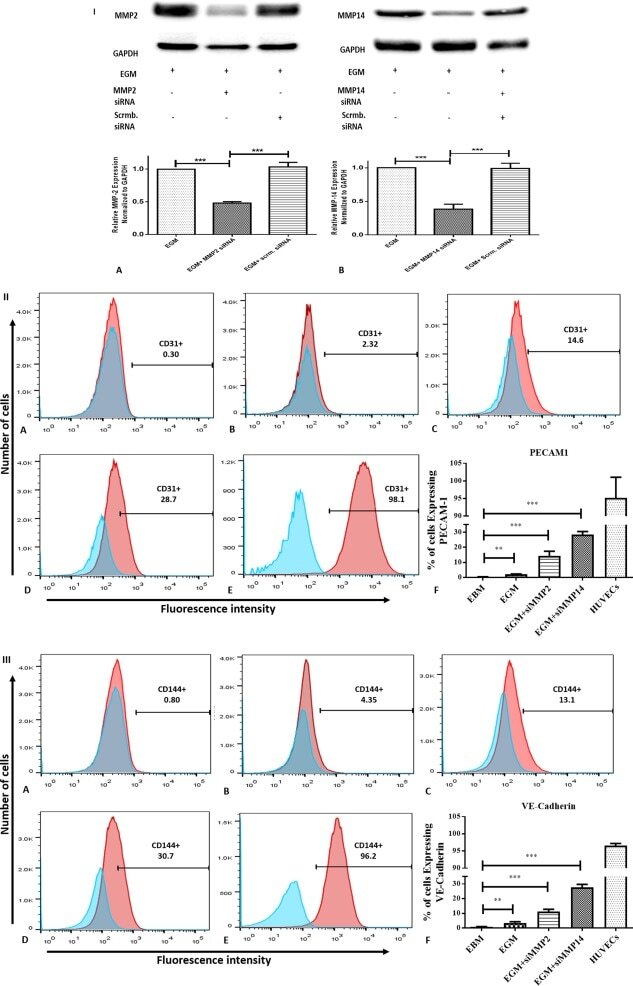
MMP-2 and MMP-14 Silencing Inhibits VEGFR2 Cleavage and Induces the Differentiation of Porcine Adipose-Derived Mesenchymal Stem Cells to Endothelial Cells.
ERK signaling is required for VEGF-A/VEGFR2-induced differentiation of porcine adipose-derived mesenchymal stem cells into endothelial cells.
Endothelial and smooth muscle cells derived from human cardiac explants demonstrate angiogenic potential and suitable for design of cell-containing vascular grafts.
TGF-β reduces DNA ds-break repair mechanisms to heighten genetic diversity and adaptability of CD44+/CD24- cancer cells.
Rotator cuff tear state modulates self-renewal and differentiation capacity of human skeletal muscle progenitor cells.
Oxidized macrophage migration inhibitory factor is a potential new tissue marker and drug target in cancer.
CXCL12/CXCR4 activation by cancer-associated fibroblasts promotes integrin β1 clustering and invasiveness in gastric cancer.
Acidic pH reduces VEGF-mediated endothelial cell responses by downregulation of VEGFR-2; relevance for anti-angiogenic therapies.
Human esophageal myofibroblasts secrete proinflammatory cytokines in response to acid and Toll-like receptor 4 ligands.
Activation of the Wnt/planar cell polarity pathway is required for pericyte recruitment during pulmonary angiogenesis.
Mesenchymal stromal cells form vascular tubes when placed in fibrin sealant and accelerate wound healing in vivo.
Hepatitis C virus infection induces autocrine interferon signaling by human liver endothelial cells and release of exosomes, which inhibits viral replication.
Reprogramming human endothelial cells to haematopoietic cells requires vascular induction.
Vascular progenitors from cord blood-derived induced pluripotent stem cells possess augmented capacity for regenerating ischemic retinal vasculature.
Hypoxia-cultured human adipose-derived mesenchymal stem cells are non-oncogenic and have enhanced viability, motility, and tropism to brain cancer.
Efficient and simultaneous generation of hematopoietic and vascular progenitors from human induced pluripotent stem cells.
Cells expressing the C/EBPbeta isoform, LIP, engulf their neighbors.
Efficient direct reprogramming of mature amniotic cells into endothelial cells by ETS factors and TGFβ suppression.
Isolation of an adult blood-derived progenitor cell population capable of differentiation into angiogenic, myocardial and neural lineages.
Li Y, Chen X, Jin R, Chen L, Dang M, Cao H, Dong Y, Cai B, Bai G, Gooding JJ, Liu S, Zou D, Zhang Z, Yang C
Science advances 2021 Feb;7(9)
Science advances 2021 Feb;7(9)
Expression and role of interleukin-1β and associated biomarkers in deep vein thrombosis.
Pai RZ, Fang Q, Tian G, Zhu B, Ge X
Experimental and therapeutic medicine 2021 Dec;22(6):1366
Experimental and therapeutic medicine 2021 Dec;22(6):1366
Simultaneously targeting cancer-associated fibroblasts and angiogenic vessel as a treatment for TNBC.
Sharma M, Turaga RC, Yuan Y, Satyanarayana G, Mishra F, Bian Z, Liu W, Sun L, Yang J, Liu ZR
The Journal of experimental medicine 2021 Apr 5;218(4)
The Journal of experimental medicine 2021 Apr 5;218(4)
Down-Regulated Exosomal MicroRNA-221 - 3p Derived From Senescent Mesenchymal Stem Cells Impairs Heart Repair.
Sun L, Zhu W, Zhao P, Zhang J, Lu Y, Zhu Y, Zhao W, Liu Y, Chen Q, Zhang F
Frontiers in cell and developmental biology 2020;8:263
Frontiers in cell and developmental biology 2020;8:263
The antifibrotic adipose-derived stromal cell: Grafted fat enriched with CD74+ adipose-derived stromal cells reduces chronic radiation-induced skin fibrosis.
Borrelli MR, Patel RA, Adem S, Diaz Deleon NM, Shen AH, Sokol J, Yen S, Chang EY, Nazerali R, Nguyen D, Momeni A, Wang KC, Longaker MT, Wan DC
Stem cells translational medicine 2020 Nov;9(11):1401-1413
Stem cells translational medicine 2020 Nov;9(11):1401-1413
Placental endovascular extravillous trophoblasts (enEVTs) educate maternal T-cell differentiation along the maternal-placental circulation.
Ma Y, Yang Q, Fan M, Zhang L, Gu Y, Jia W, Li Z, Wang F, Li YX, Wang J, Li R, Shao X, Wang YL
Cell proliferation 2020 May;53(5):e12802
Cell proliferation 2020 May;53(5):e12802
Pro-Fibrotic CD26-Positive Fibroblasts Are Present in Greater Abundance in Breast Capsule Tissue of Irradiated Breasts.
Borrelli MR, Irizzary D, Patel RA, Nguyen D, Momeni A, Longaker MT, Wan DC
Aesthetic surgery journal 2020 Mar 23;40(4):369-379
Aesthetic surgery journal 2020 Mar 23;40(4):369-379
PF-127 hydrogel plus sodium ascorbyl phosphate improves Wharton's jelly mesenchymal stem cell-mediated skin wound healing in mice.
Deng Q, Huang S, Wen J, Jiao Y, Su X, Shi G, Huang J
Stem cell research & therapy 2020 Apr 3;11(1):143
Stem cell research & therapy 2020 Apr 3;11(1):143
Matrine inhibits the development and progression of ovarian cancer by repressing cancer associated phosphorylation signaling pathways.
Zhang X, Hou G, Liu A, Xu H, Guan Y, Wu Y, Deng J, Cao X
Cell death & disease 2019 Oct 10;10(10):770
Cell death & disease 2019 Oct 10;10(10):770
Mesenchymal stromal cells lower platelet activation and assist in platelet formation in vitro.
Mendelson A, Strat AN, Bao W, Rosston P, Fallon G, Ohrn S, Zhong H, Lobo C, An X, Yazdanbakhsh K
JCI insight 2019 Aug 22;4(16)
JCI insight 2019 Aug 22;4(16)
CRISPR/Cas9‑mediated hypoxia inducible factor‑1α knockout enhances the antitumor effect of transarterial embolization in hepatocellular carcinoma.
Liu Q, Fan D, Adah D, Wu Z, Liu R, Yan QT, Zhang Y, Du ZY, Wang D, Li Y, Bao SY, Liu LP
Oncology reports 2018 Nov;40(5):2547-2557
Oncology reports 2018 Nov;40(5):2547-2557
Comprehensive human cell-type methylation atlas reveals origins of circulating cell-free DNA in health and disease.
Moss J, Magenheim J, Neiman D, Zemmour H, Loyfer N, Korach A, Samet Y, Maoz M, Druid H, Arner P, Fu KY, Kiss E, Spalding KL, Landesberg G, Zick A, Grinshpun A, Shapiro AMJ, Grompe M, Wittenberg AD, Glaser B, Shemer R, Kaplan T, Dor Y
Nature communications 2018 Nov 29;9(1):5068
Nature communications 2018 Nov 29;9(1):5068
Expansion of functional personalized cells with specific transgene combinations.
Lipps C, Klein F, Wahlicht T, Seiffert V, Butueva M, Zauers J, Truschel T, Luckner M, Köster M, MacLeod R, Pezoldt J, Hühn J, Yuan Q, Müller PP, Kempf H, Zweigerdt R, Dittrich-Breiholz O, Pufe T, Beckmann R, Drescher W, Riancho J, Sañudo C, Korff T, Opalka B, Rebmann V, Göthert JR, Alves PM, Ott M, Schucht R, Hauser H, Wirth D, May T
Nature communications 2018 Mar 8;9(1):994
Nature communications 2018 Mar 8;9(1):994
Prostaglandin E(2) Is Required for BMP4-Induced Mesoderm Differentiation of Human Embryonic Stem Cells.
Zhang B, He L, Liu Y, Zhang J, Zeng Q, Wang S, Fan Z, Fang F, Chen L, Lv Y, Xi J, Yue W, Li Y, Pei X
Stem cell reports 2018 Mar 13;10(3):905-919
Stem cell reports 2018 Mar 13;10(3):905-919
Spatial and Single-Cell Transcriptional Profiling Identifies Functionally Distinct Human Dermal Fibroblast Subpopulations.
Philippeos C, Telerman SB, Oulès B, Pisco AO, Shaw TJ, Elgueta R, Lombardi G, Driskell RR, Soldin M, Lynch MD, Watt FM
The Journal of investigative dermatology 2018 Apr;138(4):811-825
The Journal of investigative dermatology 2018 Apr;138(4):811-825
Increased infiltration and tolerised antigen-specific CD8(+) T(EM) cells in tumor but not peripheral blood have no impact on survival of HCMV(+) glioblastoma patients.
Bahador M, Gras Navarro A, Rahman MA, Dominguez-Valentin M, Sarowar S, Ulvestad E, Njølstad G, Lie SA, Kristoffersen EK, Bratland E, Chekenya M
Oncoimmunology 2017;6(8):e1336272
Oncoimmunology 2017;6(8):e1336272
Targeted Disruption of TCF12 Reveals HEB as Essential in Human Mesodermal Specification and Hematopoiesis.
Li Y, Brauer PM, Singh J, Xhiku S, Yoganathan K, Zúñiga-Pflücker JC, Anderson MK
Stem cell reports 2017 Sep 12;9(3):779-795
Stem cell reports 2017 Sep 12;9(3):779-795
MMP-2 and MMP-14 Silencing Inhibits VEGFR2 Cleavage and Induces the Differentiation of Porcine Adipose-Derived Mesenchymal Stem Cells to Endothelial Cells.
Almalki SG, Llamas Valle Y, Agrawal DK
Stem cells translational medicine 2017 May;6(5):1385-1398
Stem cells translational medicine 2017 May;6(5):1385-1398
ERK signaling is required for VEGF-A/VEGFR2-induced differentiation of porcine adipose-derived mesenchymal stem cells into endothelial cells.
Almalki SG, Agrawal DK
Stem cell research & therapy 2017 May 12;8(1):113
Stem cell research & therapy 2017 May 12;8(1):113
Endothelial and smooth muscle cells derived from human cardiac explants demonstrate angiogenic potential and suitable for design of cell-containing vascular grafts.
Zakharova IS, Zhiven' MK, Saaya SB, Shevchenko AI, Smirnova AM, Strunov A, Karpenko AA, Pokushalov EA, Ivanova LN, Makarevich PI, Parfyonova YV, Aboian E, Zakian SM
Journal of translational medicine 2017 Mar 3;15(1):54
Journal of translational medicine 2017 Mar 3;15(1):54
TGF-β reduces DNA ds-break repair mechanisms to heighten genetic diversity and adaptability of CD44+/CD24- cancer cells.
Pal D, Pertot A, Shirole NH, Yao Z, Anaparthy N, Garvin T, Cox H, Chang K, Rollins F, Kendall J, Edwards L, Singh VA, Stone GC, Schatz MC, Hicks J, Hannon GJ, Sordella R
eLife 2017 Jan 16;6
eLife 2017 Jan 16;6
Rotator cuff tear state modulates self-renewal and differentiation capacity of human skeletal muscle progenitor cells.
Thomas KA, Gibbons MC, Lane JG, Singh A, Ward SR, Engler AJ
Journal of orthopaedic research : official publication of the Orthopaedic Research Society 2017 Aug;35(8):1816-1823
Journal of orthopaedic research : official publication of the Orthopaedic Research Society 2017 Aug;35(8):1816-1823
Oxidized macrophage migration inhibitory factor is a potential new tissue marker and drug target in cancer.
Schinagl A, Thiele M, Douillard P, Völkel D, Kenner L, Kazemi Z, Freissmuth M, Scheiflinger F, Kerschbaumer RJ
Oncotarget 2016 Nov 8;7(45):73486-73496
Oncotarget 2016 Nov 8;7(45):73486-73496
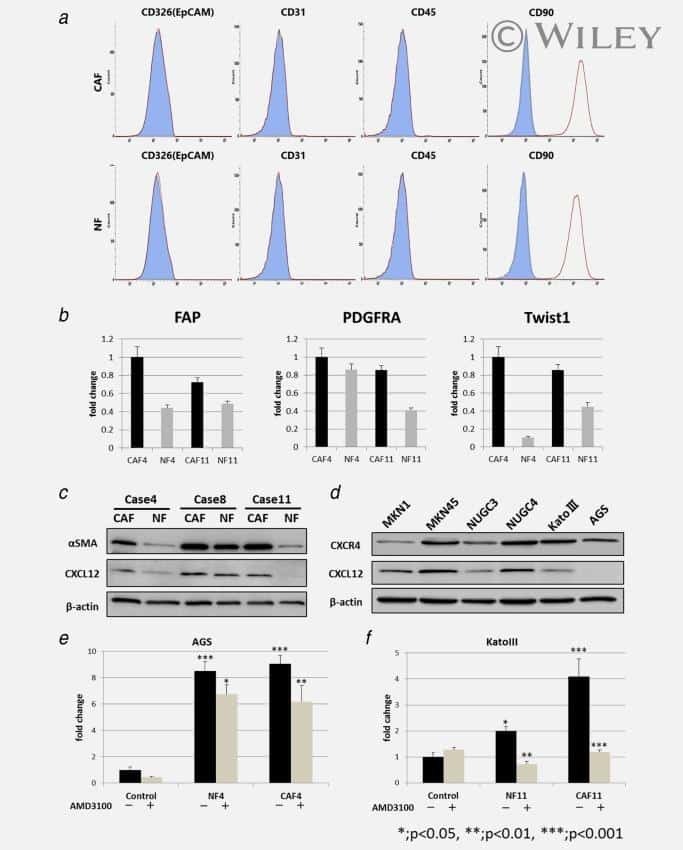
CXCL12/CXCR4 activation by cancer-associated fibroblasts promotes integrin β1 clustering and invasiveness in gastric cancer.
Izumi D, Ishimoto T, Miyake K, Sugihara H, Eto K, Sawayama H, Yasuda T, Kiyozumi Y, Kaida T, Kurashige J, Imamura Y, Hiyoshi Y, Iwatsuki M, Iwagami S, Baba Y, Sakamoto Y, Miyamoto Y, Yoshida N, Watanabe M, Takamori H, Araki N, Tan P, Baba H
International journal of cancer 2016 Mar 1;138(5):1207-19
International journal of cancer 2016 Mar 1;138(5):1207-19
Acidic pH reduces VEGF-mediated endothelial cell responses by downregulation of VEGFR-2; relevance for anti-angiogenic therapies.
Faes S, Uldry E, Planche A, Santoro T, Pythoud C, Demartines N, Dormond O
Oncotarget 2016 Dec 27;7(52):86026-86038
Oncotarget 2016 Dec 27;7(52):86026-86038
Human esophageal myofibroblasts secrete proinflammatory cytokines in response to acid and Toll-like receptor 4 ligands.
Gargus M, Niu C, Vallone JG, Binkley J, Rubin DC, Shaker A
American journal of physiology. Gastrointestinal and liver physiology 2015 Jun 1;308(11):G904-23
American journal of physiology. Gastrointestinal and liver physiology 2015 Jun 1;308(11):G904-23
Activation of the Wnt/planar cell polarity pathway is required for pericyte recruitment during pulmonary angiogenesis.
Yuan K, Orcholski ME, Panaroni C, Shuffle EM, Huang NF, Jiang X, Tian W, Vladar EK, Wang L, Nicolls MR, Wu JY, de Jesus Perez VA
The American journal of pathology 2015 Jan;185(1):69-84
The American journal of pathology 2015 Jan;185(1):69-84
Mesenchymal stromal cells form vascular tubes when placed in fibrin sealant and accelerate wound healing in vivo.
Mendez JJ, Ghaedi M, Sivarapatna A, Dimitrievska S, Shao Z, Osuji CO, Steinbacher DM, Leffell DJ, Niklason LE
Biomaterials 2015 Feb;40:61-71
Biomaterials 2015 Feb;40:61-71
Hepatitis C virus infection induces autocrine interferon signaling by human liver endothelial cells and release of exosomes, which inhibits viral replication.
Giugliano S, Kriss M, Golden-Mason L, Dobrinskikh E, Stone AE, Soto-Gutierrez A, Mitchell A, Khetani SR, Yamane D, Stoddard M, Li H, Shaw GM, Edwards MG, Lemon SM, Gale M Jr, Shah VH, Rosen HR
Gastroenterology 2015 Feb;148(2):392-402.e13
Gastroenterology 2015 Feb;148(2):392-402.e13
Reprogramming human endothelial cells to haematopoietic cells requires vascular induction.
Sandler VM, Lis R, Liu Y, Kedem A, James D, Elemento O, Butler JM, Scandura JM, Rafii S
Nature 2014 Jul 17;511(7509):312-8
Nature 2014 Jul 17;511(7509):312-8
Vascular progenitors from cord blood-derived induced pluripotent stem cells possess augmented capacity for regenerating ischemic retinal vasculature.
Park TS, Bhutto I, Zimmerlin L, Huo JS, Nagaria P, Miller D, Rufaihah AJ, Talbot C, Aguilar J, Grebe R, Merges C, Reijo-Pera R, Feldman RA, Rassool F, Cooke J, Lutty G, Zambidis ET
Circulation 2014 Jan 21;129(3):359-72
Circulation 2014 Jan 21;129(3):359-72
Hypoxia-cultured human adipose-derived mesenchymal stem cells are non-oncogenic and have enhanced viability, motility, and tropism to brain cancer.
Feng Y, Zhu M, Dangelmajer S, Lee YM, Wijesekera O, Castellanos CX, Denduluri A, Chaichana KL, Li Q, Zhang H, Levchenko A, Guerrero-Cazares H, Quiñones-Hinojosa A
Cell death & disease 2014 Dec 11;5(12):e1567
Cell death & disease 2014 Dec 11;5(12):e1567
Efficient and simultaneous generation of hematopoietic and vascular progenitors from human induced pluripotent stem cells.
Park TS, Zimmerlin L, Zambidis ET
Cytometry. Part A : the journal of the International Society for Analytical Cytology 2013 Jan;83(1):114-26
Cytometry. Part A : the journal of the International Society for Analytical Cytology 2013 Jan;83(1):114-26
Cells expressing the C/EBPbeta isoform, LIP, engulf their neighbors.
Abreu M, Sealy L
PloS one 2012;7(7):e41807
PloS one 2012;7(7):e41807
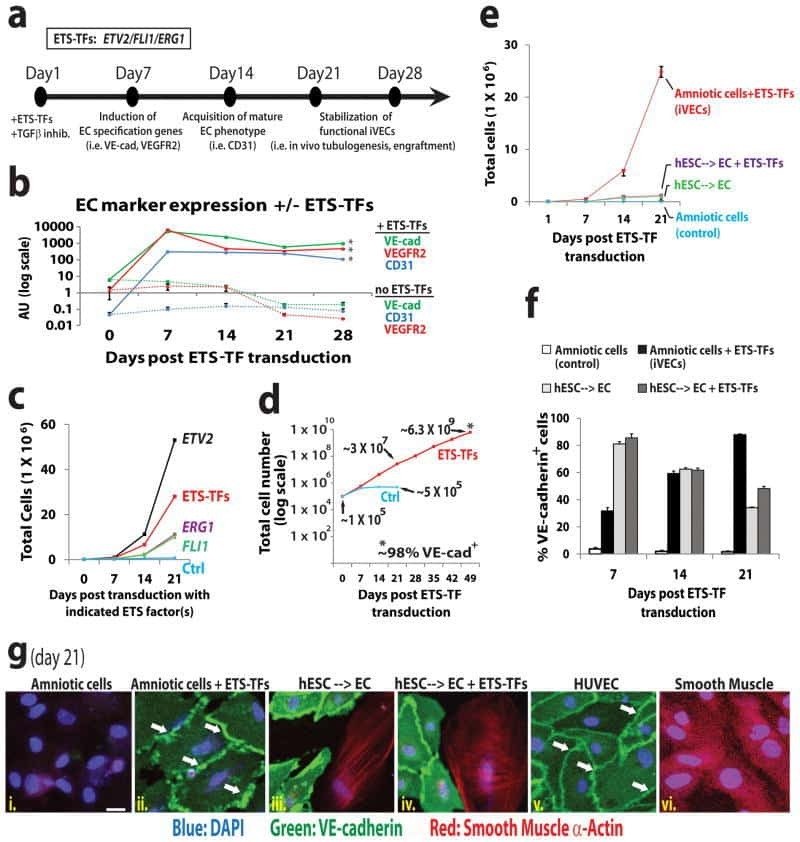
Efficient direct reprogramming of mature amniotic cells into endothelial cells by ETS factors and TGFβ suppression.
Ginsberg M, James D, Ding BS, Nolan D, Geng F, Butler JM, Schachterle W, Pulijaal VR, Mathew S, Chasen ST, Xiang J, Rosenwaks Z, Shido K, Elemento O, Rabbany SY, Rafii S
Cell 2012 Oct 26;151(3):559-75
Cell 2012 Oct 26;151(3):559-75
Isolation of an adult blood-derived progenitor cell population capable of differentiation into angiogenic, myocardial and neural lineages.
Porat Y, Porozov S, Belkin D, Shimoni D, Fisher Y, Belleli A, Czeiger D, Silverman WF, Belkin M, Battler A, Fulga V, Savion N
British journal of haematology 2006 Dec;135(5):703-14
British journal of haematology 2006 Dec;135(5):703-14
No comments: Submit comment
Supportive validation
- Submitted by
- Invitrogen Antibodies (provider)
- Main image

- Experimental details
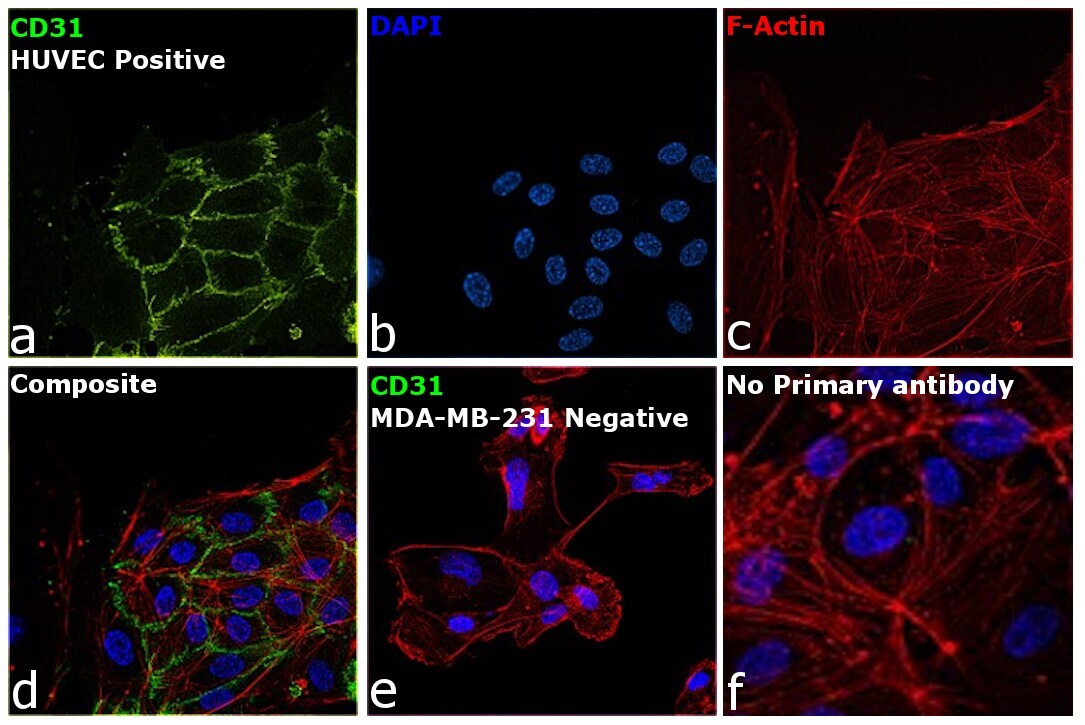
- Immunofluorescence analysis of Platelet endothelial cell adhesion molecule was performed using 70% confluent log phase HUVEC cells. The cells were fixed with 4% paraformaldehyde for 10 minutes, permeabilized with 0.1% Triton™ X-100 for 15 minutes, and blocked with 2% BSA for 45 minutes at room temperature. The cells were labeled with CD31 (PECAM-1) Monoclonal Antibody (WM-59 (WM59)), eFluor 450, eBioscience™ (Product # 48-0319-41, 48-0319-42) at 5 µg/mL in 0.1% BSA, incubated at 4 degree celsius overnight and then labeled with Donkey anti-Mouse IgG (H+L) Highly Cross-Adsorbed Secondary Antibody, Alexa Fluor Plus 488 (Product # A32766), (1:2000 dilution), for 45 minutes at room temperature (Panel a: Green). Nuclei (Panel b: Blue) were stained with ProLong™ Diamond Antifade Mountant with DAPI (Product # P36962). F-actin (Panel c: Red) was stained with Rhodamine Phalloidin (Product # R415, 1:300 dilution). Panel d represents the merged image showing Cell Junctional localization. Panel e represents no expression in MDA-MB-231. Panel f represents control cells with no primary antibody to assess background. The images were captured at 60X magnification.
- Submitted by
- Invitrogen Antibodies (provider)
- Main image

- Experimental details
- Immunofluorescence analysis of Platelet endothelial cell adhesion molecule was performed using 70% confluent log phase HUVEC cells. The cells were fixed with 4% paraformaldehyde for 10 minutes, permeabilized with 0.1% Triton™ X-100 for 15 minutes, and blocked with 2% BSA for 45 minutes at room temperature. The cells were labeled with CD31 (PECAM-1) Monoclonal Antibody (WM-59 (WM59)), eFluor 450, eBioscience™ (Product # 48-0319-41, 48-0319-42) at 5 µg/mL in 0.1% BSA, incubated at 4 degree celsius overnight and then labeled with Donkey anti-Mouse IgG (H+L) Highly Cross-Adsorbed Secondary Antibody, Alexa Fluor Plus 488 (Product # A32766), (1:2000 dilution), for 45 minutes at room temperature (Panel a: Green). Nuclei (Panel b: Blue) were stained with ProLong™ Diamond Antifade Mountant with DAPI (Product # P36962). F-actin (Panel c: Red) was stained with Rhodamine Phalloidin (Product # R415, 1:300 dilution). Panel d represents the merged image showing Cell Junctional localization. Panel e represents no expression in MDA-MB-231. Panel f represents control cells with no primary antibody to assess background. The images were captured at 60X magnification.

Supportive validation
- Submitted by
- Invitrogen Antibodies (provider)
- Main image

- Experimental details
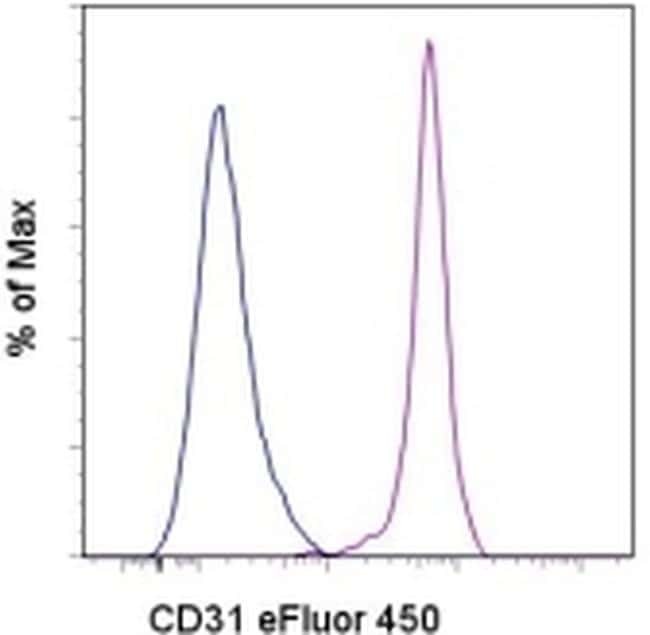
- Staining of normal human peripheral blood cells with Mouse IgG1 K Isotype Control eFluor® 450 (Product # 48-4714-82) (blue histogram) or Anti-Human CD31 (PECAM-1) eFluor® 450 (purple histogram). Cells in the monocyte gate were used for analysis.
- Submitted by
- Invitrogen Antibodies (provider)
- Main image
- Experimental details
- Staining of normal human peripheral blood cells with Mouse IgG1 K Isotype Control eFluor® 450 (Product # 48-4714-82) (blue histogram) or Anti-Human CD31 (PECAM-1) eFluor® 450 (purple histogram). Cells in the monocyte gate were used for analysis.

Supportive validation
- Submitted by
- Invitrogen Antibodies (provider)
- Main image
- Experimental details
- NULL
- Submitted by
- Invitrogen Antibodies (provider)
- Main image
- Experimental details
- NULL
- Submitted by
- Invitrogen Antibodies (provider)
- Main image

- Experimental details
- NULL
- Submitted by
- Invitrogen Antibodies (provider)
- Main image
- Experimental details
- NULL
- Submitted by
- Invitrogen Antibodies (provider)
- Main image
- Experimental details
- NULL
- Submitted by
- Invitrogen Antibodies (provider)
- Main image
- Experimental details
- NULL

- Submitted by
- Invitrogen Antibodies (provider)
- Main image
- Experimental details
- NULL
- Submitted by
- Invitrogen Antibodies (provider)
- Main image
- Experimental details
- NULL
- Submitted by
- Invitrogen Antibodies (provider)
- Main image

- Experimental details
- NULL
- Submitted by
- Invitrogen Antibodies (provider)
- Main image
- Experimental details
- NULL
- Submitted by
- Invitrogen Antibodies (provider)
- Main image
- Experimental details
- NULL
- Submitted by
- Invitrogen Antibodies (provider)
- Main image
- Experimental details
- NULL
- Submitted by
- Invitrogen Antibodies (provider)
- Main image
- Experimental details
- NULL

- Submitted by
- Invitrogen Antibodies (provider)
- Main image
- Experimental details
- NULL
- Submitted by
- Invitrogen Antibodies (provider)
- Main image

- Experimental details
- NULL
- Submitted by
- Invitrogen Antibodies (provider)
- Main image
- Experimental details
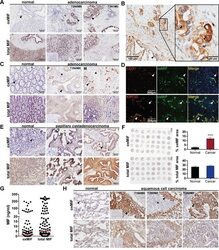
- Figure 2 OxMIF occurs specifically in malignant tissue and can be detected in primary tumors and in metastases of different solid tumors A. OxMIF and total MIF staining of pancreas tissue with normal morphology and pancreatic adenocarcinoma tissue (tumors were staged according to the tumor node metastasis (TNM) system). B. Ten and 40 fold (inset) original magnification of pancreatic adenocarcinoma stained for oxMIF, arrows indicate location of staining (invasion front, membrane, cytoplasm and nucleus, respectively). C. OxMIF and total MIF staining of colon tissue with normal morphology and colorectal adenocarcinoma tissue, red arrows indicate vessel like structures described in D. D. Top panels show immunofluorescence staining of the blood vessel marker CD31 (red) and oxMIF (green). The overlay reveals no co-localization (white arrow) of these markers in CRC metastasis obtained from the liver. Bottom panels show immunofluorescence staining of the colon epithelial cell marker cytokeratin 20 (KRT20, red) and oxMIF (green). The merge with DAPI nuclear counterstain reveals co-localization (white arrow) of these markers. Scale bar 200 mum. E. OxMIF and total MIF staining of ovarian tissue with normal morphology and ovarian papillary cystadenocarcinoma tissue. F. The left panels show a low magnification image of a tissue micro array consisting of 37 sections of ovarian cancer tissue and 3 adjacent normal tissues, stained for oxMIF and total MIF. Scale bar 2 mm. This microarray has
- Submitted by
- Invitrogen Antibodies (provider)
- Main image
- Experimental details
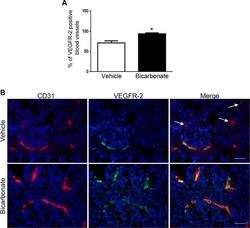
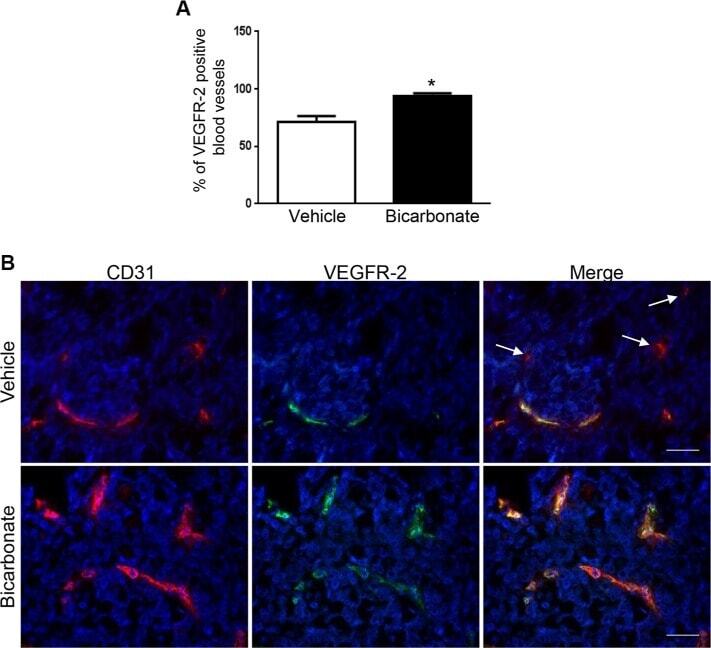
- Figure 5 Sodium bicarbonate increases the percentage of VEGFR-2 positive blood vessels in HT29 tumor xenografts ( A ) Mean percentage +- 1 SD of VEGFR-2 positive blood vessels in HT29 tumor xenografts grown in nude mice left untreated (vehicle) or receiving sodium bicarbonate in the drinking water (bicarbonate; 200 mmol/L). ( B ) Dual immunofluorescent staining for CD31 (red) and VEGFR-2 (green) in HT29 tumor xenografts harvested from nude mice that were untreated (vehicle) or received sodium bicarbonate (bicarbonate). Arrows: example of CD31 positive, VEGFR-2 negative blood vessels. Scale bars, 50 muM.
- Submitted by
- Invitrogen Antibodies (provider)
- Main image
- Experimental details
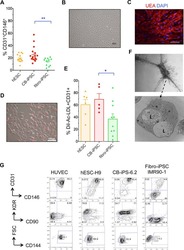
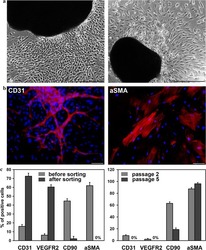
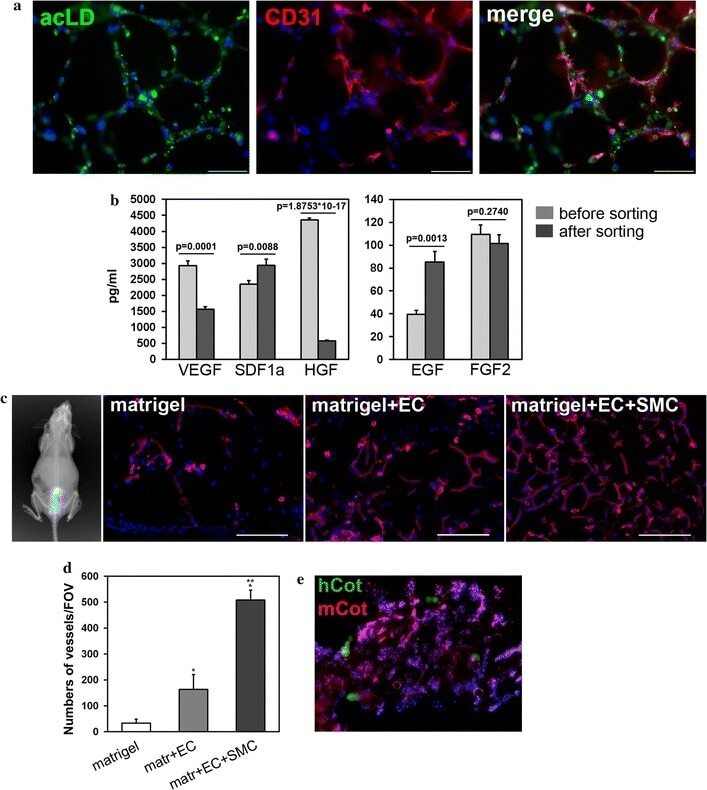
- Fig. 1 Cells isolated from cardiac explants in culture. a Morphology of primary cells migrated from cardiac explants. Phase contrast images of cells cultivated in an endothelial growth medium ( left panel ) and cells derived in a smooth muscle growth medium ( right panel ). Scale bar 100 mum. b CD31-positive endothelial ( left panel ) and alphaSMA-positive smooth muscle ( right panel ) cells were detected by immunofluorescent staining of primary cardiac explant cultures growing in endothelial or smooth muscle medium, respectively. Scale bar 100 mum. c Flow cytometric analysis of surface markers. Comparison of cells cultivated in endothelial growth medium before and after MACS separation ( left panel ). Comparison of cells cultivated in smooth muscle cell growth medium at the second and fifth passages ( right panel )
- Submitted by
- Invitrogen Antibodies (provider)
- Main image
- Experimental details
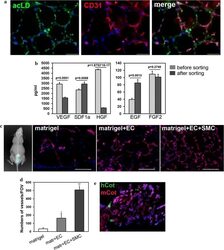
- Fig. 4 Functional properties of cardiac explant-derived cells. a Endothelial cells form capillary-like structures in Matrigel, uptake acLDL ( left ) and demonstrate a CD31-positive phenotype ( middle ). A merged image is represented in the picture on the right . Scale bar 100 mum. b Angiogenic cytokine profiles of conditioned medium obtained from cardiac explant-derived cells before and after MACS separation of CD31-positive cells. Wilcoxon test. c Evaluation of functional properties of CD31-positive endothelial cells in vivo. Visualization of injected mix (Matrigel + cells with the vital dye MitoTracker Deep Red FM) after 14 days with a Kodak In-Vivo Multispectral Imaging System device ( left ). Vasculature in cryosections of the Matrigel plug at day 14 after injection of Matrigel only, Matrigel + endothelial cells and Matrigel + endothelial + smooth muscle cells is detected by isolectin B4 Alexa 594 conjugate staining. Scale bar 100 mum. d A diagram representing the number of vessels positive for isolectin B4 Alexa 594 conjugate staining ( red colour ) as determined under a fluorescence microscope in 10 random fields of view. Wilcoxon test with Bonferroni correction. * vs Matrigel only, p = 0.0005; ** vs Matrigel + endothelial cells, p = 0.00003. e Fluorescent in situ hybridization of human and mouse DNA probes (hCot and mCot, respectively) to cryosection of Matrigel + EC + SMC. Human probes ( green ) are distributed evenly over the nuclei, whereas mouse probes ( red ) are
- Submitted by
- Invitrogen Antibodies (provider)
- Main image
- Experimental details
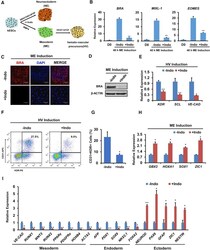
- Figure 2 De Novo Synthesis of PGE 2 Is Required for BMP4-Induced Mesoderm Specification of hESCs (A) Schematic of different induction methods. Indo, indomethacin. (B) qPCR analysis of mesodermal marker gene expression levels in hESCs with BMP4 induction plus DMSO (-Indo) or indomethacin (+Indo) for 48 hr. ** p < 0.01 compared with -Indo group. n >= 3 independent experiments. (C and D) Immunostaining (C) and western blotting (D) analysis for BRA in hESCs with BMP4 induction plus DMSO (-Indo) or indomethacin (+Indo) for 48 hr. Scale bars represent 50 mum. (E) hemato-vascular precursors (HV) marker gene expression levels in hESCs with BMP4 induction plus DMSO (-Indo) or indomethacin (+Indo) for 48 hr and hemato-vascular precursors induction (SFDM + 50 ng/mL VEGF + 50 ng/mL bFGF) for 4 days. * p < 0.05, ** p < 0.01 compared with -Indo group. n = 3 independent experiments. (F and G) Flow cytometry analysis of the percentage of KDR + CD31 + cells after hemato-vascular induction. * p < 0.05 compared with -Indo group. n = 3 independent experiments. (H) Neuroectoderm (NE) marker gene expression levels in hESCs with BMP4 induction plus DMSO (-Indo) or indomethacin (+Indo) for 48 hr. * p < 0.05 compared with -Indo group. n = 3 independent experiments. (I) qPCR analysis of tissue-specific gene expression levels in different engrafts. * p < 0.05, ** p < 0.01 compared with -Indo group. n = 3 independent experiments. Error bars indicate SD. See also Figure S2 .

- Submitted by
- Invitrogen Antibodies (provider)
- Main image
- Experimental details
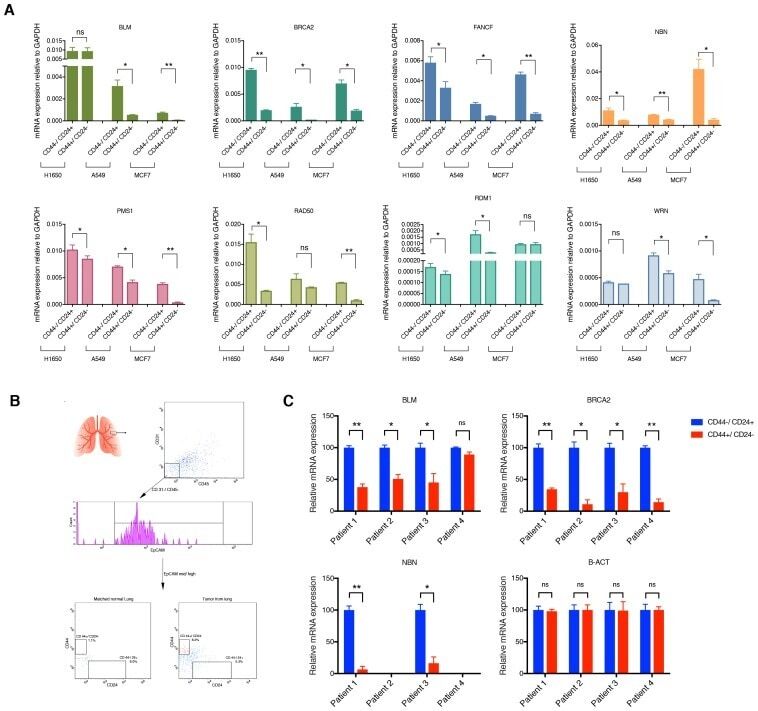
- Figure 2--figure supplement 3. mRNA expression analysis of HDR genes in CD44-/CD24+ and CD44+/CD24- cells FACS sorted from cells lines and patient tumors. ( A ) Comparative expression of the indicated HDR genes in FACS-sorted CD44+/ CD24- cells relative to CD44-/ CD24+ cells from H1650, A549 and MCF7. mRNA expression was quantified by RT-qPCR. Each bar is the mean +- SD of three replicates from two different experiments and represents mRNA expression of the indicated gene. p-value *
- Submitted by
- Invitrogen Antibodies (provider)
- Main image
- Experimental details
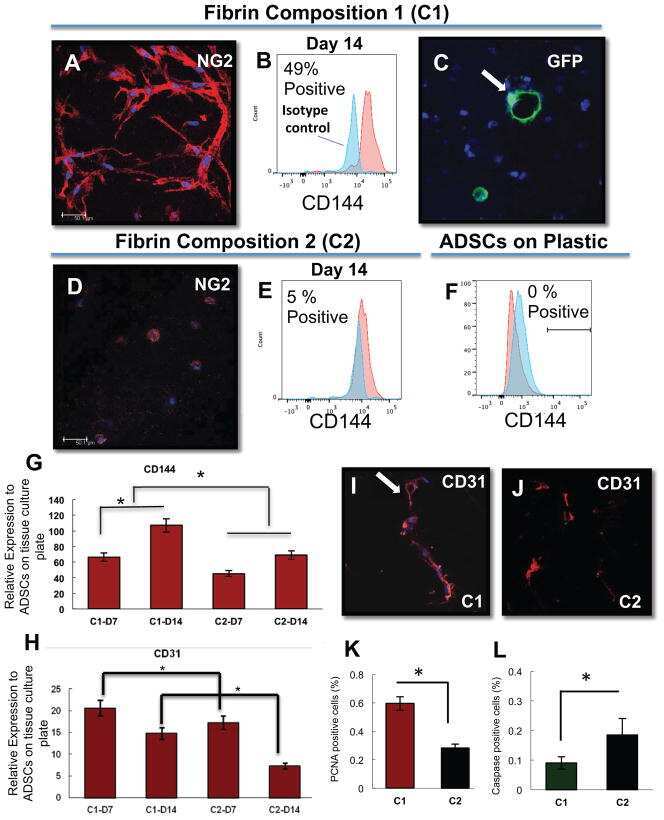
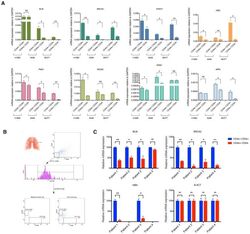
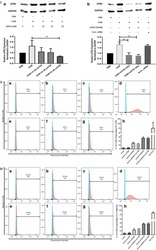
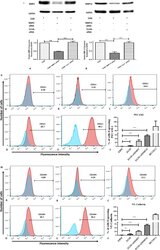
- Fig. 3 ATR2 siRNA transfection and immunophenotyping for EC markers. I Concentration selection for siRNA transfection. Three different concentrations (10, 35, and 50 nM) of ATR2 siRNA were used according to the manufacturer's protocol. Western blot analysis showed inhibition of ATR2 by 10, 35, and 50 nM of ATR2 siRNA. However, 50 nM of ATR2 siRNA showed the highest inhibition among all three different concentrations ( A ). ATR2 silencing by siRNA transfection with EGM compared with AMSCs with EGM and EGM + scrambled siRNA (negative control) ( B ). GAPDH was used as a housekeeping gene. II Flow cytometric analysis of PECAM1 (CD31) in four different groups; control group with EGM ( A ), AMSCs with EGM and MMP-2 siRNA ( B ), AMSCs with EGM and MMP-14 siRNA ( C ), and HUVECs as the positive control ( D ). Cell transfection with 5 muM of ATR2 siRNA for EGM ( E ), AMSCs with EGM and MMP-2 siRNA ( F ), and AMSCs with EGM and MMP-14 siRNA ( G ). Flow cytometry data were analyzed to show the significant differences between the groups ( H ). III Flow cytometric analysis of VE-cadherin (CD144) in four different groups: control group AMSCs with EGM ( A ), AMSCs with EGM and MMP-2 siRNA ( B ), AMSCs with EGM and MMP-14 siRNA ( C ), and HUVECs as the positive control ( D ). Cell transfection with 5 muM of ATR2 siRNA for EGM ( E ), AMSCs with EGM and MMP-2 siRNA ( F ), and AMSCs with EGM and MMP-14 siRNA ( G ). Flow cytometry data were analyzed to show the significant differences betwe
- Submitted by
- Invitrogen Antibodies (provider)
- Main image
- Experimental details
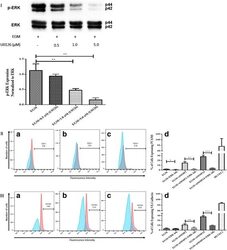
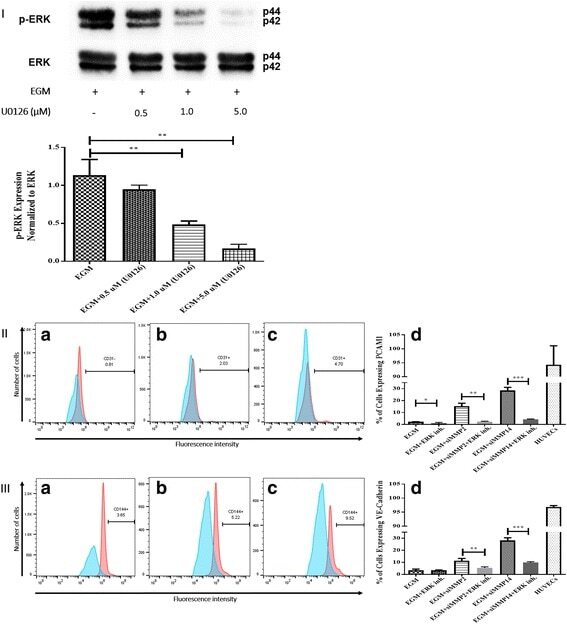
- Fig. 5 Inhibition of ERK phosphorylation and immunophenotyping for EC markers. I Concentration -dependent effect of ERK inhibitor (U0126). Three different concentrations (0.5, 1.0, and 5.0 muM) of U0126 were used. Western blot analysis showed significant inhibition of p-ERK by 1.0 and 5.0 muM of U0126. However, 5.0 muM of U0126 showed the highest inhibition among all three different concentrations. Phospho-ERK was normalized to its total protein expression. II Flow cytometric analysis of PECAM1 (CD31) with ERK inhibitor (U0126). Three different groups treated with 5.0 muM of U0126: AMSCs with EGM ( A ), AMSCs with EGM and MMP-2 siRNA ( B ), and AMSCs with EGM and MMP-14 siRNA ( C ). Flow cytometry data were analyzed to show the significant differences between the groups ( D ). III Flow cytometric analysis of VE-cadherin (CD144) with ERK inhibitor (U0126). Three different groups were treated with 5.0 muM of U0126: AMSCs with EGM ( A ), AMSCs with EGM and MMP-2 siRNA ( B ), and AMSCs with EGM and MMP-14 siRNA ( C ). Flow cytometry data were analyzed to show the significant differences with or without U0126 ( D ). * p < 0.05, ** p < 0.01, *** p < 0.001. EBM endothelial cell basal medium, EGM endothelial cell growth medium, MMP matrix metalloproteinase, ERK extracellular signal-regulated kinase, HUVEC human umbilical vein endothelial cell
- Submitted by
- Invitrogen Antibodies (provider)
- Main image
- Experimental details
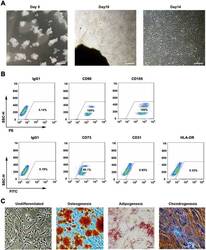
- Fig. 1 WJMSCs isolation and characterization. a Primary cell isolation procedure from Wharton''s jelly tissue. The migrated cells exhibited typical fibroblast-like morphology. Scale bar, 500 mum. b Flow cytometry analysis of P4 cells using mesenchymal stem cell markers (CD90, CD105, CD73), endothelial cell marker (CD31), and MHC class II protein HLA-DR. Isotypic antibodies (IgG1-PE and IgG1-FITC) were used as negative controls. c Representative stained images show that the fourth passage WJMSCs could differentiate into osteocytes (Alizarin Red S), adipocytes (Oil Red O), and chondrocytes (Alcian blue). Scale bar, 100 mum
- Submitted by
- Invitrogen Antibodies (provider)
- Main image
- Experimental details
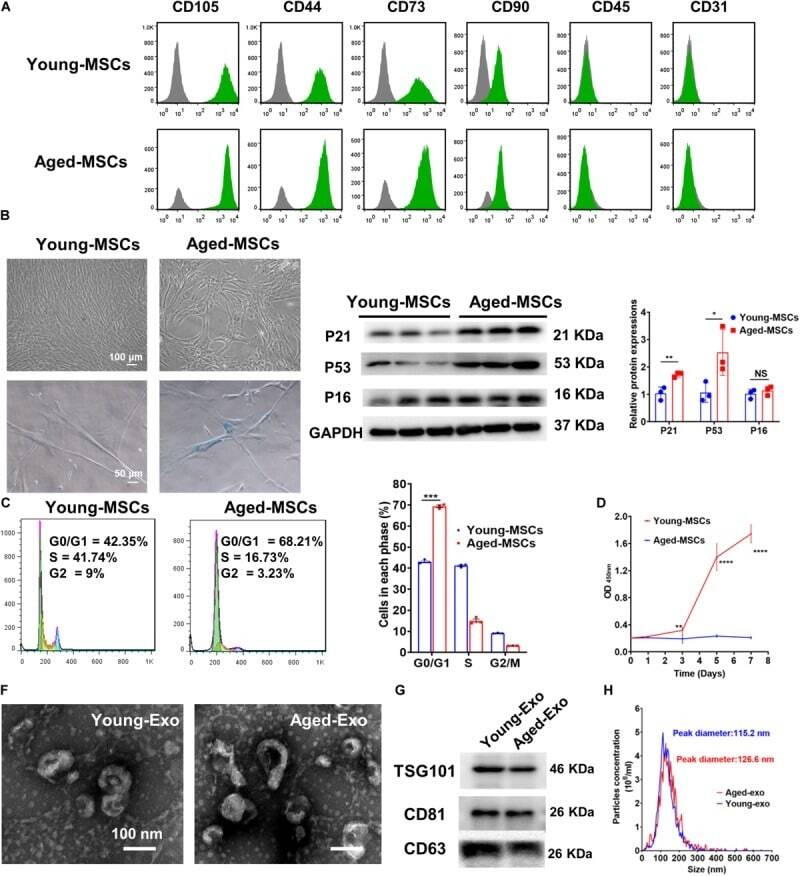
- FIGURE 1 Characterization of young and aged MSCs and exosomes. (A) Surface marker profiling of young-MSCs and aged-MSCs. (B) SA-beta-Gal staining showed that senescence increased significantly in aged MSCs. (C) Representative immunoblot images and quantitative analysis of p21, p53, and p16 protein level in young and aged-MSCs. ( n = 3). (D) Quantitation of cell cycle phases by propidium iodide staining. ( n = 3). (E) The CCK-8 assay showed that aged MSCs grew more slowly than young MSCs. ( n = 6). (F) Young and aged exosomes were observed using TEM. (G) The exosome surface markers were analyzed by Western blot. (H) Nanoparticle tracking analysis was used to analyze the particle size and concentration of Young-Exo and Aged-Exo. * p < 0.05; ** p < 0.01; *** p < 0.001; **** p < 0.0001; NS, not significant.
- Submitted by
- Invitrogen Antibodies (provider)
- Main image
- Experimental details
- Figure 5 siRNA transfection and immunophenotyping of differentiated adipose-derived mesenchymal stem cells (AMSCs); (I) : MMP-2 (A) and MMP-14 (B) silencing by siRNA transfection with EGM compared to AMSCs with EGM and EGM plus scrambled siRNA (negative control). GAPDH was used as a housekeeping gene (*, p < .05; **, p < .01; ***, p < .001). (II) : Flow cytometric analysis of PECAM1 (CD31) in five different groups; control group was the undifferentiated cells with EBM (A), AMSCs with differentiation medium EGM (B), AMSCs with differentiation medium EGM and MMP-2 siRNA (C), AMSCs with differentiation medium EGM and MMP-14 siRNA (D), and HUVECs as the positive control (E). Flow cytometry data were analyzed to show the significant differences between the groups (F). (III) : Flow cytometric analysis of VE-Cadherin (CD144) in five different groups; control group was the undifferentiated cells with EBM (A), AMSCs with differentiation medium EGM (B), AMSCs with differentiation medium EGM and MMP-2 siRNA (C), AMSCs with differentiation medium EGM and MMP-14 siRNA (D), and HUVECs as the positive control (E). Flow cytometry data were analyzed to show the significant differences between the groups (F). (*, p < .05; **, p < .01; ***, p < .001). Abbreviations: CD, cluster of differentiation; EBM, endothelial basal medium; EGM, endothelial growth medium; GAPDH, glyceraldehyde-3-phosphate dehydrogenase; HUVECs, human umbilical vein endothelial cells; MMP, matrix metalloproteinases.
- Submitted by
- Invitrogen Antibodies (provider)
- Main image
- Experimental details
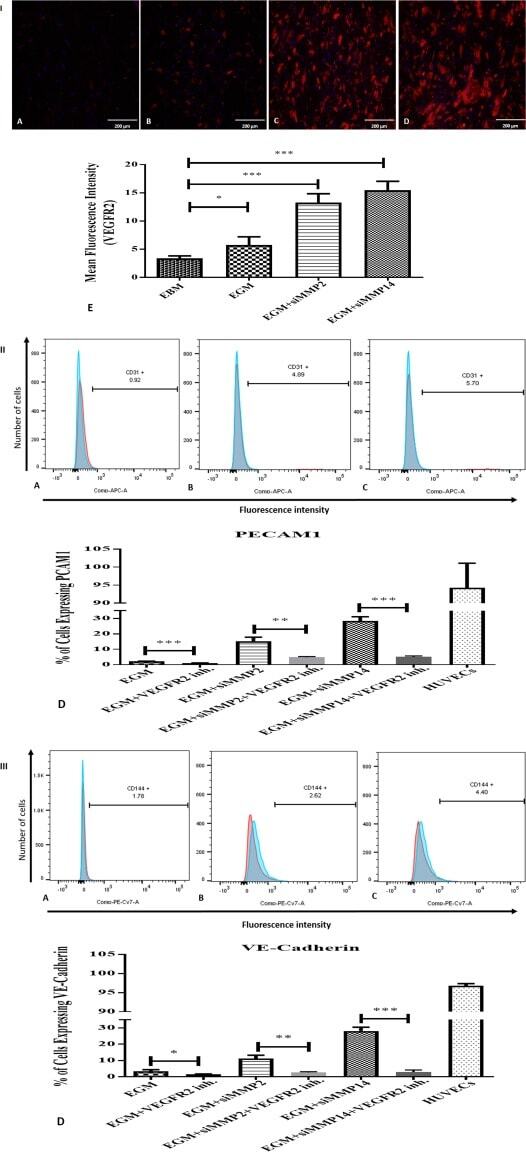
- Figure 7 Immunostaining of VEGFR2 and immunophenotyping of differentiated adipose-derived mesenchymal stem cells (AMSCs) after VEGFR2 kinase inhibition; (I) : Immunofluorescence staining for VEGFR2. AMSCs in EGM showed significant increases in the expression of VEGFR2 (B & E) compared to endothelial basal medium group (A & E). AMSCs cultured with EGM and MMP-2 siRNA showed significantly higher fluorescence intensity of VEGFR2 in comparison to the EGM cultured cells (C & E). AMSCs cultured with EGM and MMP-14 siRNA showed the greatest positive staining of VEGFR2 compared to that of EGM and EGM plus MMP2 siRNA (D & E). Fluorescence intensity was measured to show the significant differences between the groups using ImageJ software (E). (II) : Flow cytometric analysis of PECAM1 (CD31) in three different groups; control group was the differentiated cells with EGM and 5 muM of VEGFR2 inhibitor (A), AMSCs with differentiation medium EGM, MMP-2 siRNA and 5 muM of VEGFR2 inhibitor (B) and AMSCs with EGM, MMP-14 siRNA and 5 muM of VEGFR2 inhibitor (C). Flow cytometry data were analyzed to show the significant differences between the groups in comparison to the same groups without VEGFR2 inhibitor (D). (III) : Flow cytometric analysis of VE-Cadherin (CD144) in three different groups; the differentiated cells with EGM and 5 muM of VEGFR2 inhibitor (A), AMSCs with differentiation medium EGM, MMP-2 siRNA and 5 muM of VEGFR2 inhibitor (B) and AMSCs with EGM, MMP-14 siRNA and 5 muM of VEGFR2
- Submitted by
- Invitrogen Antibodies (provider)
- Main image
- Experimental details
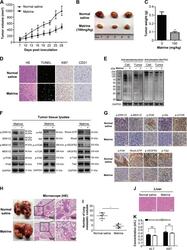
- Fig. 6 Inhibition of xenograft tumor growth and metastasis by matrine in vivo. a Time course of tumor growth, measured as tumor volume in each group at the indicated time of treatment with normal saline or matrine (100 mg/kg, ip). Data are presented as mean +- SD ( n = 3, * P < 0.05). b Tumors in matrine-treated mice were significantly smaller than those in normal saline-treated mice. c The bar graph represented the mean of tumor weight from matrine-treated and control mice ( n = 3, * P < 0.05). d The representative histological examinations of the dissected tumors with matrine or normal saline treatment using H&E staining, TUNEL assay, Ki-67 and CD31 antibodies. Scale bar: 50 mum. e The global phosphorylation levels of tyrosine and serine/threonine were significantly decreased in matrine-treated A2780 cells and in matrine-treated tumor tissue lysates, respectively. f , g Western blot and IHC staining demonstrated a decrease in the phosphorylation levels of ERK1/2, MEK1/2, PI3K, Akt, mTOR, FAK, RhoA, VEGFR2, and Tie2 in xenografts treated with matrine compared with those in control group. Scale bar: 50 mum. h A2780 cells were injected into tail veins of BALB/c nude mice. Representative images showed lungs with metastatic nodules from the matrine-treated mice and the control group. The left panel presents macroscopic appearances of lung metastatic nodules, and the middle and right panels present the H&E staining of lung tissues in mice with matrine or normal saline treatment
- Submitted by
- Invitrogen Antibodies (provider)
- Main image
- Experimental details
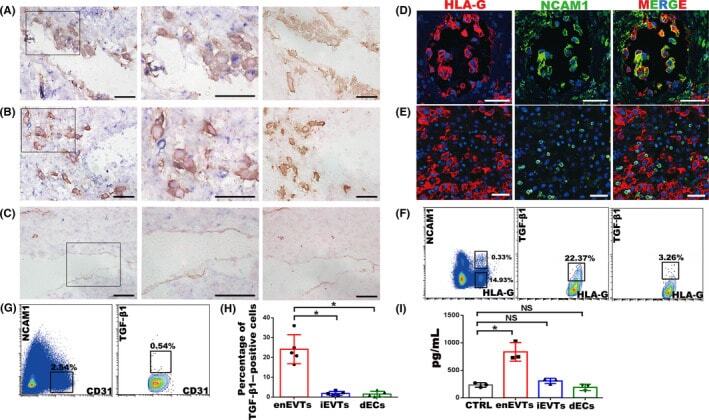
- FIGURE 2 Identification of TGF-beta1-producing cells at the maternal-foetal interface in normal pregnancy at gestational weeks 7-9. A-C, In situ hybridization of TGF-beta1 (blue) and immunohistochemistry staining of HLA-G (yellow in A and B) or CD31 (yellow in C) in normal pregnant decidua. Middle panels are enlargement of the rectangular areas in left panels, showing the enEVTs in remodelled SPA (A), iEVTs in the area nearby the remodelled SPA (B) and dECs in unremodelled SPA (C). Right panels are negative control of in situ hybridization, with the immunohistochemistry signals of HLA-G (A, B) or CD31 (C). D, E, Immunofluorescence of HLA-G (red) and NCAM1 (green) in remodelled SPA (D) and the area nearby remodelled SPA (E). F, Flow cytometry of TGF-beta1 expression in EVTs of normal pregnancy. Left panel, FACS isolation of enEVTs and iEVTs with antibodies against HLA-G and NCAM1. Middle panel, flow cytometry of TGF-beta1-positive enEVTs that are gated from the left panel as HLA-G + NCAM1 + . Right panel: flow cytometry analysis of TGF-beta1-positive iEVTs that were gated from the left panel as HLA-G + NCAM1 - . G, FACS isolation of CD31 + NCAM1 - dECs in normal pregnancy (left panel), and flow cytometry of TGF-beta1-positive dECs gated from the left panel as CD31 + NCAM1 - (right panel). H, The statistical analysis of TGF-beta1-positive primary cells based on the results from 5 normal pregnant cases. I, ELISA for TGF-beta1 in supernatants of the FACS-sorted enEVTs, iEVTs and
- Submitted by
- Invitrogen Antibodies (provider)
- Main image
- Experimental details
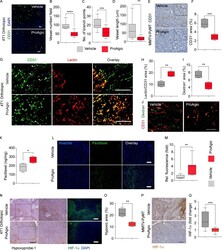
- Figure 5. ProAgio eliminates angiogenic vessels, enhances blood perfusion into the tumor, and consequentially reduces hypoxia. (A-D) Representative images of IF CD31 staining (A), quantification of vessel number (B), number of branch points (C), and vessel length (D) per view field in tumor sections of 4T1 mice treated with vehicle or ProAgio. Nuclei were counterstained with DAPI (blue) . Scale bars, 100 um ( n = 6-7/group). (E and F) Representative IHC images of CD31 staining (E) and quantification of CD31 + area (F) in the breast tumor sections of MMTV-PyMT mice treated with vehicle or ProAgio. Insets, x1.5. Scale bars, 100 um ( n = 5/group). (G and H) Representative fluorescence images of lectin perfusion in tumor vessels (G) and quantification of lectin-positive area (red) per total CD31-positive area (H; green, represented by white arrows) in tumor sections of 4T1 mice treated with vehicle or ProAgio. Scale bars, 100 um ( n = 4/group). (I and J) Representative IF images of dextran leakage of tumor vessels (J) and quantification of dextran + area (I) in the breast tumor sections of 4T1 orthotopic mice. Dextran + area is presented as a percentage per total section of the CD31 + area. Scale bar, 100 um ( n = 4/group). (K) Intratumoral levels of PTX in the extracts of tumors of 4T1 mice treated with vehicle or ProAgio. PTX levels were presented as nanograms of PTX per milligrams of tumor tissue ( n = 4/group). (L and M) Representative fluorescence images of FITC-conjugated P
- Submitted by
- Invitrogen Antibodies (provider)
- Main image

- Experimental details
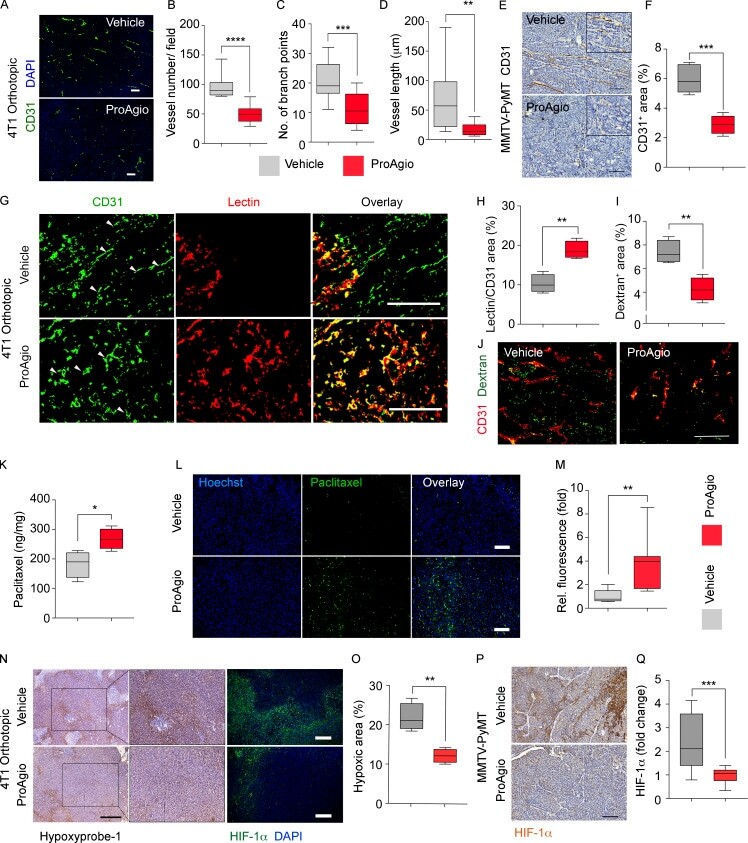
- Figure 3 Changes in the expression rate of CD31 in the peripheral blood of rats. Rats were randomly divided into the control, sham surgery and S2h, S8h, S24h, S48h and S72h groups, which were examined 2, 8, 24, 48 and 72 h after deep vein thrombosis modeling surgery, respectively. Flow cytometry was used to analyze the positive rate of the peripheral blood endothelial cell marker CD31. (A) Representative flow cytometry plots for each group. (B) Statistical analysis of the CD31 positive rate in each group. * P
- Submitted by
- Invitrogen Antibodies (provider)
- Main image
- Experimental details
- Fig. 1 In vitro bioactivity of the MSN/miR-21-5p complex. ( A ) In vitro uptake of the MSN/miR-21-5p complex by adherent endothelial cells (ECs) and macrophages (MCs). ( B ) In vitro transfection efficiency of miR-21-5p was determined by quantifying the miRNA level using real-time quantitative PCR. ( C ) Representative flow cytometry analysis of CD31 levels in ECs and F4/80 levels in MCs. ( D ) In vitro uptake of the MSN/miR-21-5p complex by ECs and MCs was determined by quantifying the double-positive cells (CD31 or F4/80 and Cy3) using flow cytometric analysis. The protein expression levels of VEGFA and PDGF-BB in endothelial cells ( E ) and tumor necrosis factor-alpha (TNF-alpha), interleukin-1beta (IL-1beta), and IL-6 in macrophages ( F ) were determined by the real-time quantitative PCR and Western blot analysis. ( G ) The endothelial cells that formed three-dimensional (3D) capillary-like tubular structures were evaluated at indicated times (8 and 16 hours). ( H ) Schematic diagram of the experimental setup. TUNEL, terminal deoxynucleotidyl transferase-mediated deoxyuridine triphosphate nick end labeling. ( I ) Apoptosis-positive cardiomyocytes from these treatment groups were further quantified. ( J ) Protein levels of secreted proangiogenic factors were determined by enzyme-linked immunosorbent assay (ELISA) analysis of cell supernatants from the MSN/miRNA-treated ECs (scale bars, 50 mum). * P < 0.05 and *** P < 0.01. All experiments were carried out in triplicate. n
- Submitted by
- Invitrogen Antibodies (provider)
- Main image
- Experimental details
- Gel@MSN/miR-21-5p promoted local neovascularization at the infarct site after MI. ( A ) Micro-CT angiography analysis of 3D vascular structures within the infarct zone 28 days after MI indicates that the vascular volume was significantly increased in the Gel@MSN/miR-21-5p treatment group. The vascular volume within the infarct zone was quantitatively analyzed. * P < 0.05 and *** P < 0.01. n = 3 per group. ( B ) Immunofluorescence staining for CD31 (red) identified the vascular endothelium, and staining for alpha-SMA (green) identified myofibroblasts and pericytes, showing that the cardiac capillary density in histological sections of the healing infarct zone was significantly higher in the Gel@MSN/miR-21-5p treatment group than in the other groups. The CD31 and alpha-SMA staining intensities in the above-described groups were quantitatively analyzed (scale bars, 500 mm). * P < 0.05 and *** P < 0.01. Sham, n = 3; MI/saline, n = 5; MI/agomir, n = 5; MI/Gel@MSN/miR-NC, n = 6; and MI/Gel@MSN/miR-21-5p, n = 6. The data are shown as the means +- SD. Photo credit: Yan Li, Shanghai Ninth People's Hospital, College of Stomatology, Shanghai Jiao Tong University School of Medicine, Shanghai 200011, China.
- Submitted by
- Invitrogen Antibodies (provider)
- Main image

- Experimental details
- Figure 1 Primary human adipose-derived cells cultured in hypoxia (hAMSCs-H) and normoxia (hAMSCs-N) are both MSCs but normoxia-cultured cells show increased signs of senescence, such as increased area and elongated morphology, compared with hypoxia-cultured cells. ( a ) hAMSCs were isolated from human fat tissue and cultured in hypoxic (1.5% oxygen) or normoxic (21% oxygen) conditions in vitro . The viability, mobility, tumor tropism, safety, and tumorigenic potential were subsequently compared in vitro and in vivo . ( b ) Differentiation assay. hAMSCs were cultured in control media and differentiation media for 3 weeks, 10 days after the second passage. Three different stains were performed to assess differentiation capabilities (scale bar, 100 mu m). ( c ) Flow cytometric analysis was performed to confirm the absence of CD31-, CD34-, and CD45-positive cells in both cell cultures. In addition, primary hAMSC cultures expressed high levels of CD73, CD90, and CD105, both in hypoxic and normoxic culture conditions at day 10 after passage 2. ( d ) Representative images of cell morphologies of hAMSCs on 2D surface (scale bar, 200 mu m). ( e ) Schematic of 3D-nanopatterned surface used to assess morphology and motility. ( f ) Images of cell morphologies of hAMSCs on 3D-nanopatterned surface (scale bar, 200 mu m). ( g - j ) The length, width, area, and length-to-width ratio were measured and compared after cell aligned on the nanopattern surface. Error bars represent S.E.M. * P
- Submitted by
- Invitrogen Antibodies (provider)
- Main image
- Experimental details
- Figure 3 Hypoxia-cultured primary human adipose-derived mesenchymal stem cells (hAMSCs-H) retain a greater proliferation capacity compared with normoxia-cultured primary hAMSCs (hAMSCs-N) when exposed to GBM media. hAMSCs-H maintain stem cell characteristics when exposed to GBM media. ( a ) Representative MRI of GBM from a patient. ( b ) Schema showing the collection of GBM CM and culture of hAMSCs in filtered GBM CM for proliferation and migration assays. ( c ) MTT assay was used to determine the effects of hypoxic conditions on the proliferative capacity of primary hAMSCs in GBM CM. In GBM CM, hAMSCs-H showed greater proliferation at day 10 and 15 compared with hAMSCs-N. ( d ) Ki-67 immunostaining was performed to quantify the number of proliferating cells in GBM CM. Proliferative capacities of hAMSCs-H and hAMSCs-N are shown in GBM CM (normalized to hAMSC-N proliferative capacity in control media). In GBM CM, hAMSCs-H had a greater proportion of proliferating cells than hAMSCs-N. ( e) Differentiation assay. hAMSCs were cultured in control media, differentiation media, and GBM CM for 3 weeks, 10 days after the second passage. Three stainings were performed to assess the differentiation capabilities (scale bar, 100 mu m). Both hAMSCs-N and hAMSCs-H maintained tri-lineage differentiation capability in GBM CM. ( f ) Flow cytometric analysis for CD31, CD34, CD45, CD73, CD90, and CD105 in hAMSC-N and hAMSC-H cultures after exposure to GBM CM for 20 days. hAMSCs-H maintained MSC

- Submitted by
- Invitrogen Antibodies (provider)
- Main image
- Experimental details
- Figure 1. HCMV positivity in GBM determined comparatively by serology, qPCR and IHC. GBM patients were investigated for presence of HCMV pp65 and IE-1 expression by (A) qPCR, IHC and serology (dark gray bars = positive samples and light gray bar = negative samples) and (B) IE-1 expression on macrophage/myeloid derived cells (left panel) and on tumor cells (right panel). Magnification 400X, Scale bar 100 mum. (C) Venn diagram showing comparative HCMV serology (IgG), qPCR (pp65), qPCR (IE-1) and IHC (IE-1) detection in GBM tissue and blood. (D) Venn diagram showing comparative HCMV pp65 and IE-1 qPCR in GBM patients' blood and tumor. (E) Representative dotplots showing (left to right) macrophages (CD45 bright CD11b bright ) and microglia (CD45 dim CD11b bright ) within tumor biopsies cells; pp65 vs. CD45 within macrophages of tumor biopsies; pp65 vs . CD31 within CD45 - tumor biopsy cells; and pp65 vs . CD45 within CD45 - tumor biopsy cells. (F) % mean +- SEM of pp65 + cells within CD45 bright CD11b bright macrophages, CD45 dim CD11b bright microglia, CD45-CD31+ endothelial cells and CD45- tumor cells. (2-way ANOVA, Bonferroni's multiple comparison, **** P < 0.0001). IHC = immunonohistochemistry; IE-1 = immediate early -1.

- Submitted by
- Invitrogen Antibodies (provider)
- Main image
- Experimental details
- Figure 3 HEB -/- hESCs Display Defects in Mesoendodermal Induction and Early Hematopoietic Differentiation (A) Experimental overview of embryoid body (EB) formation and differentiation. BMP4, bone morphogenetic protein 4; bFGF, basic fibroblast growth factor; VEGF, vascular endothelial growth factor; IL, interleukin; EPO, erythropoietin; SCF, stem cell factor; IGF1, insulin-like growth factor 1; FLT3L, FMS-like tyrosine kinase 3 ligand; TPO, thrombopoietin. (B) Reverse-transcriptase PCR analysis of HEB transcript (HEBCan, canonical; HEBAlt, alternative) expression at various stages of EB differentiation, and in sorted day-8 (d8) CD34 + cells (last column). GAPDH was measured as a loading control. (C) qRT-PCR analysis for the expression of pluripotency and differentiation markers in undifferentiated hESCs (day 0 [d0]) versus d4 EB-derived cells. (D) Flow-cytometric analysis of CD34 and KDR, CD144, and CD31 expression on d8 EB-derived cells. (E and F) Percentages (E) and numbers (F) of CD34 + cells in d8 EBs. (G) qRT-PCR analysis of the expression of mesodermal and hematopoietic genes in CD34 + cells. For qRT-PCR graphs, mRNA levels are shown relative to GAPDH. Error bars represent mean +- SD (n = 3 independent experiments). ** p < 0.01; *** p < 0.005 by Student's t test. Images in (B) and plots in (D) are representative of three independent experiments. See also Figure S4 .
- Submitted by
- Invitrogen Antibodies (provider)
- Main image
- Experimental details
- Figure 6 Ectopic Expression of HEBCan in HEB -/- hESCs Restores Lineage-Specific Gene Expression and Hematopoietic Specification (A) Western blot analysis for HEB expression in WT, KO (HEB -/- ), KO + GFP (HEB -/- hESCs transduced with GFP control vector) and KO + HEBCan (HEB -/- hESCs transduced with HEBCan-encoding vector) hESCs. (B) Bright-field (top) and fluorescent (bottom) images of day-8 (d8) EBs derived from HEB -/- hESCs transduced with control or HEBCan-expressing lentiviral particles. Scale bar, 100 mum. (C and D) qRT-PCR analysis for the expression of pluripotency-associated genes (C) and mesoendodermal genes (D) in WT, KO + GFP, and KO + HEBCan hESC-derived cells at d0 and d4 of EB culture. mRNA levels are shown relative to GAPDH. (E) Flow-cytometric analysis of CD34 and KDR, CD144, and CD31 on WT, KO + GFP, and KO + HEBCan d8 EB-derived cells. (F and G) Percentages (F) and numbers (G) of CD34 + cells in WT, KO + GFP, and KO + HEBCan d8 EBs. (H) Flow-cytometric analysis for CD34 and CD45 on WT, KO + GFP, and KO + HEBCan d18 EB-derived cells. (I and J) Percentages (I) and numbers (J) of CD34/CD45 subsets in WT, KO + GFP, and KO + HEBCan d18 EB-derived cells. (K) Numbers of erythroid (BFU-E) and myeloid (CFU-GM) arising from unfractionated WT, KO + GFP, and KO + HEBCan d18 EBs. Error bars represent mean +- SD (n = 3 independent experiments). * p < 0.05, ** p < 0.01, *** p < 0.005 by Student's t test. Images in (A) and (B) and plots in (E) and (H) are represent

- Submitted by
- Invitrogen Antibodies (provider)
- Main image
- Experimental details
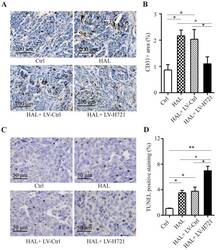
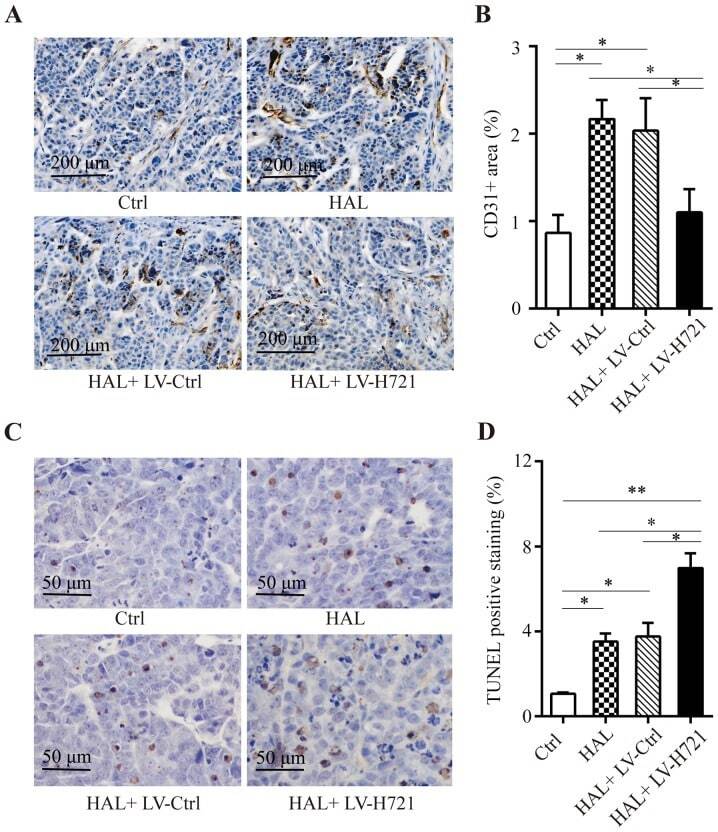
- Figure 6. Immunohistochemical analysis of microvascular density and TUNEL assay in the mouse orthotopic tumor model. Tumor tissues were acquired at 20 days after the different treatments. (A) Monoclonal anti-CD31 antibody staining of the section to examine the microvascular density with x20 magnification, and (B) CD31-positive cells. Five sections were counted for each slide. (C) TUNEL assay was performed on the SMMC-7721-Fluc-induced orthotopic hepatocellular carcinoma model in mice with x20 magnification, and (D) the percentage of TUNEL-positive cells is presented. Values represent the mean +- standard error of the mean, and are representative of four independent experiments. *P
- Submitted by
- Invitrogen Antibodies (provider)
- Main image

- Experimental details
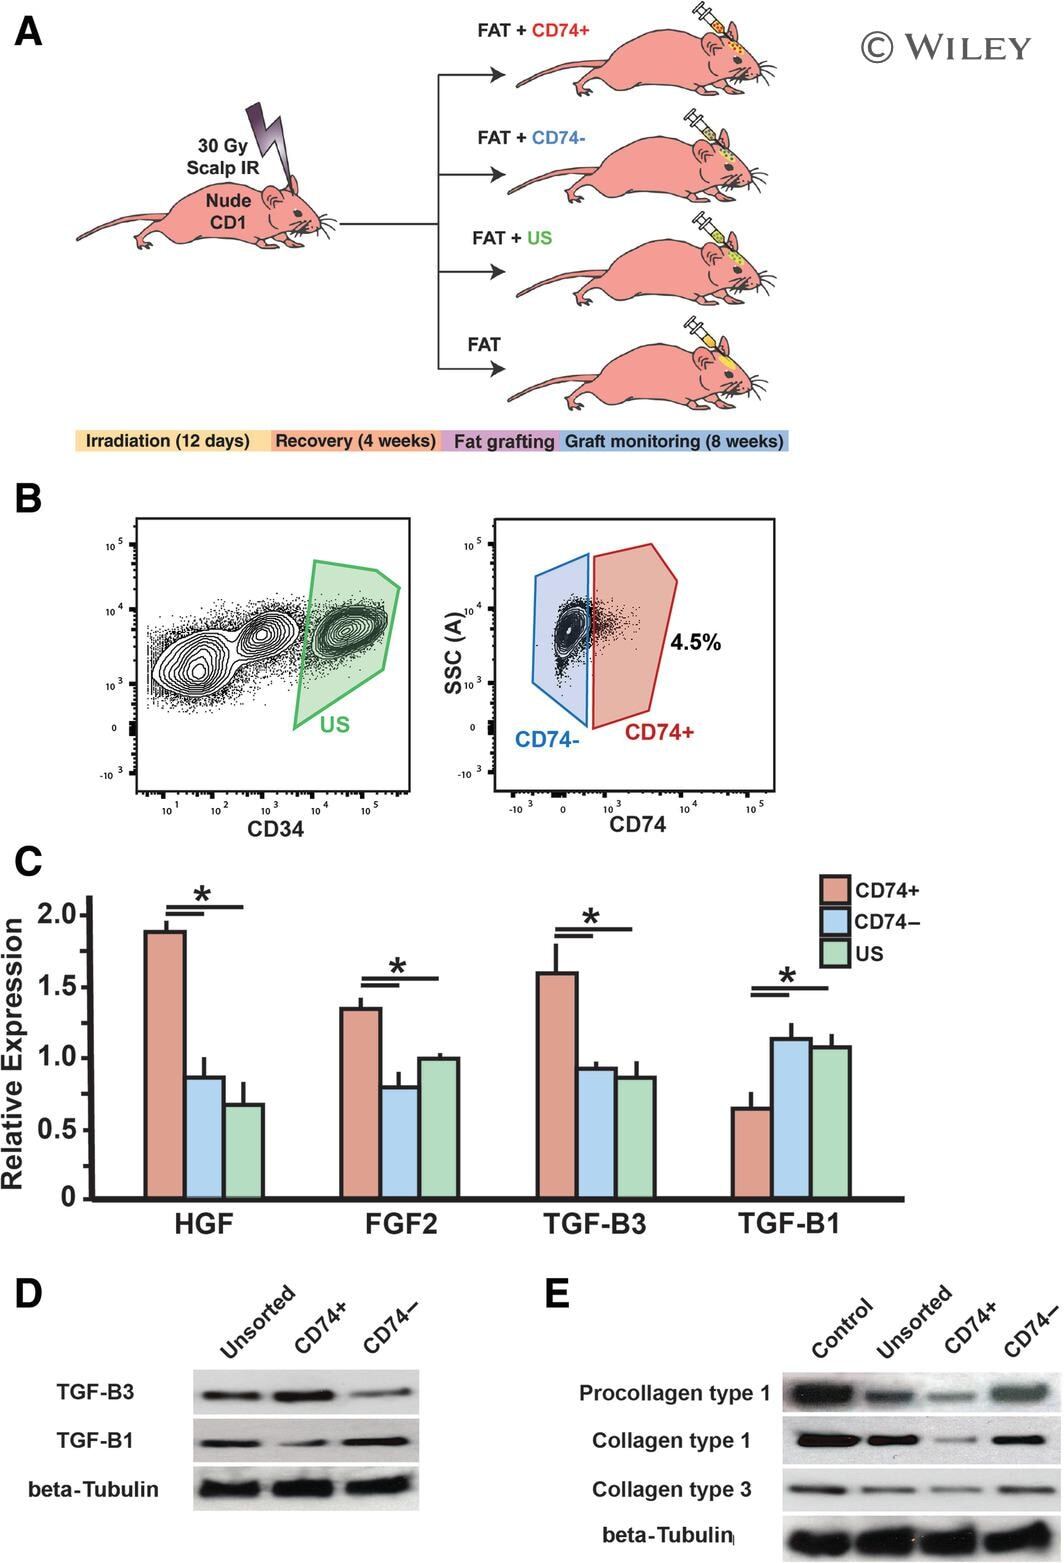
- 1 FIGURE Isolation of adipose-derived stromal cell subpopulations and analysis of effects. A, Schematic of overall experimental design used to explore antifibrotic effects of CD74+ ASCs within irradiated soft tissue beds. Mice were grafted with fat (n = 5/group): (1) enriched with CD74+ ASCs; (2) enriched with CD74- ASCs; (3) enriched with US ASCs; or (4) not enriched with ASCs. B, Isolation of CD74+ ASCs. Flow cytometry plots showing gating strategy used to isolate CD74+ ASCs. ASCs were defined as CD34+ live single cells, negative of lineage markers CD45, CD235a, and CD31. CD74+ ASCs comprised 4.5% of all ASCs within SVF. C, Quantitative real-time reverse transcription polymerase chain reaction-PCR showing differentiation expression of antifibrotic growth factors--HGF, FGF2, and TGF-beta3--and pro-fibrotic growth factor TGF-beta1. CD74+ ASCs had significantly increased expression of HGF, FGF2, and TGF-beta3 and decreased TGF-beta1 compared to both CD74- ASCs (* P < .05) and US ASCs (* P < .05). D, Representative Western blots of TGF-beta3 (top) and TGF-beta1 (middle) from US, CD74+, and CD74- ASCs with beta-Tubulin loading control (bottom). E, Representative Western blots of Procollagen type 1 (top), Collagen type 1 (second from top), and Collagen type 3 (third from top) synthesized by stimulated human dermal fibroblasts (control) and fibroblasts incubated in conditioned media from US, CD74+, and CD74-, ASCs with beta-Tubulin loading control (bottom). ASC, adipose-derived st
- Submitted by
- Invitrogen Antibodies (provider)
- Main image
- Experimental details
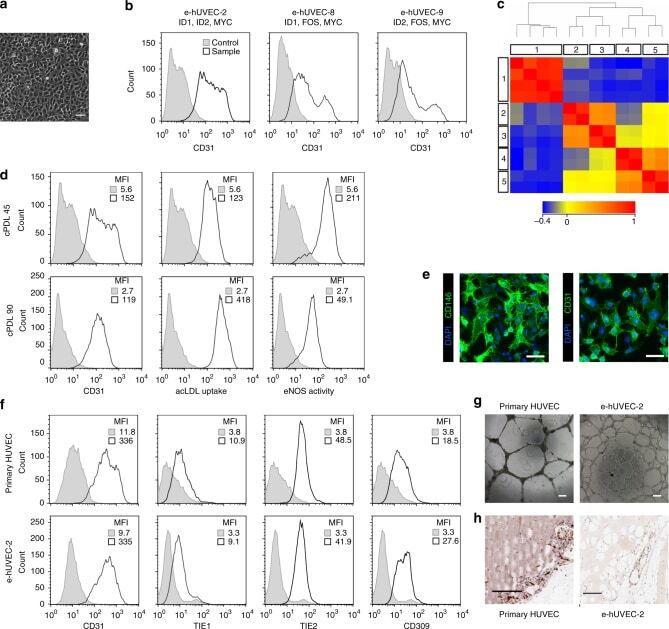
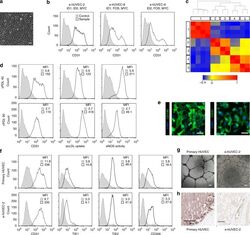
- Fig. 3 Comparable phenotype of primary and expanded endothelial cells. a Phase contrast microscopy shows the expandable HUVEC cell line e-hUVEC-2 (MYC, ID1, and ID2). Scale bar 100 um. b CD31 expression of human endothelial cell populations immortalized with three different gene sets as indicated. c Global gene expression analysis was performed on three different HUVEC lines (e-hUVEC-2, 8 and 9; in duplicate) (3, 4, 5, respectively) and two independent primary HUVEC populations (2) as well as four primary gingiva fibroblast populations (1). Expression data was processed with GeneSpring 11.5.1 software and a Standard Pearson Correlation was determined for each gene versus all other genes. The correlation heatmap depicts the pair-wise correlation coefficient between the given samples and displays the relationship between the different samples. The samples are clustered based on the pair-wise correlation coefficients between all entities. d Phenotypic stability of e-hUVEC-2 cells after 45 and 90 cumulative population doublings was evaluated by CD31 (also known as PECAM1) expression, acetylated LDL uptake, and eNOS activity. Gray fill: antibody isotype control; black outline: stained sample. MFI: median fluorescence intensity. e Immunofluorescence-based detection of CD31 and CD146 (also known as MCAM) in expandable HUVECs counterstained for nuclei with DAPI. Scale bars, 100 um. f The phenotype and the functionality of cell line e-hUVEC-2 (cumulative population doubling 80) was co