Explore
 Validate
 Learn
Learn Western blot
 ELISA
ELISA Immunocytochemistry
Antibody data
- Antibody Data
- Antigen structure
- References [12]
- Comments [0]
- Validations
- Immunocytochemistry [8]
- Immunohistochemistry [1]
- Other assay [11]
Submit
Validation data
Reference
Comment
Report error
- Product number
- MA3-002 - Provider product page

- Provider
- Invitrogen Antibodies
- Product name
- BAP31 Monoclonal Antibody (CC-1)
- Antibody type
- Monoclonal
- Antigen
- Other
- Description
- MA3-002 detects BAP31 from human, non-human primate, bovine, mouse and hamster samples. MA3-002 has been successfully used in Western blot, ELISA, immunoprecipitation, immunofluorescent, and immunohistochemical procedures. By Western blot, this antibody detects a 28-kDa protein corresponding to human BAP31. The MA3-002 antigen is solubilized protein from human neuroendocrine cell line IMR-32 corresponding to the C-terminal region residues 230-246 of BAP31 protein. This sequence is conserved in non-human primate, bovine and hamster species.
- Reactivity
- Human, Mouse, Bovine, Hamster
- Host
- Rat
- Isotype
- IgG
- Antibody clone number
- CC-1
- Vial size
- 100 μL
- Concentration
- Conc. Not Determined
- Storage
- -20°C, Avoid Freeze/Thaw Cycles
Submitted references Components of the LINC and NPC complexes coordinately target and translocate a virus into the nucleus to promote infection.
Lunapark-dependent formation of a virus-induced ER exit site contains multi-tubular ER junctions that promote viral ER-to-cytosol escape.
Global mapping of Salmonella enterica-host protein-protein interactions during infection.
Structural and mechanistic basis of the EMC-dependent biogenesis of distinct transmembrane clients.
Golgi-associated BICD adaptors couple ER membrane penetration and disassembly of a viral cargo.
TBC1D5-Catalyzed Cycling of Rab7 Is Required for Retromer-Mediated Human Papillomavirus Trafficking during Virus Entry.
Reticulon protects the integrity of the ER membrane during ER escape of large macromolecular protein complexes.
Dynein Engages and Disassembles Cytosol-Localized Simian Virus 40 To Promote Infection.
A Non-enveloped Virus Hijacks Host Disaggregation Machinery to Translocate across the Endoplasmic Reticulum Membrane.
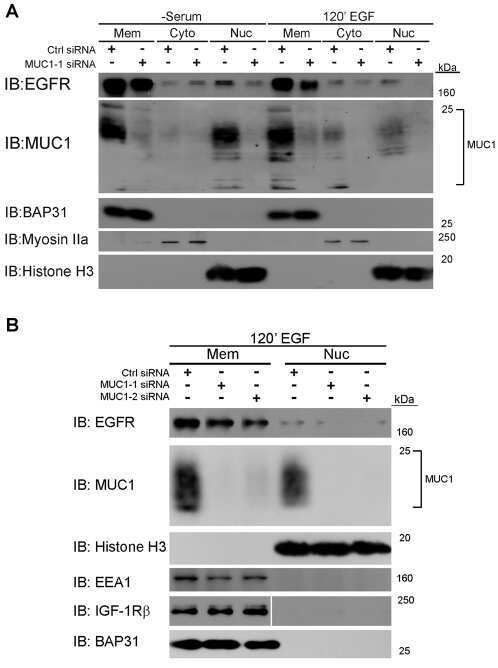
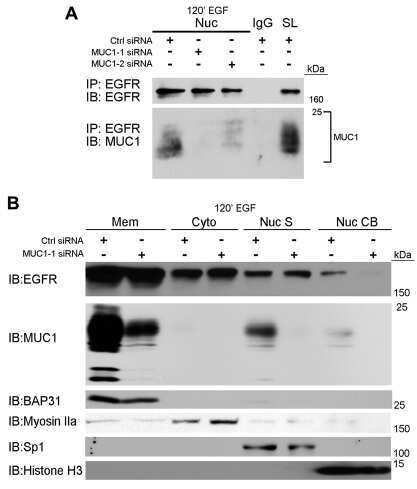
MUC1 regulates nuclear localization and function of the epidermal growth factor receptor.
BAP31 is involved in the retention of cytochrome P450 2C2 in the endoplasmic reticulum.
Association of BAP31 with CD11b/CD18. Potential role in intracellular trafficking of CD11b/CD18 in neutrophils.
Spriggs CC, Cha G, Li J, Tsai B
PLoS pathogens 2022 Sep;18(9):e1010824
PLoS pathogens 2022 Sep;18(9):e1010824
Lunapark-dependent formation of a virus-induced ER exit site contains multi-tubular ER junctions that promote viral ER-to-cytosol escape.
Bagchi P, Liu X, Cho WJ, Tsai B
Cell reports 2021 Dec 7;37(10):110077
Cell reports 2021 Dec 7;37(10):110077
Global mapping of Salmonella enterica-host protein-protein interactions during infection.
Walch P, Selkrig J, Knodler LA, Rettel M, Stein F, Fernandez K, Viéitez C, Potel CM, Scholzen K, Geyer M, Rottner K, Steele-Mortimer O, Savitski MM, Holden DW, Typas A
Cell host & microbe 2021 Aug 11;29(8):1316-1332.e12
Cell host & microbe 2021 Aug 11;29(8):1316-1332.e12
Structural and mechanistic basis of the EMC-dependent biogenesis of distinct transmembrane clients.
Miller-Vedam LE, Bräuning B, Popova KD, Schirle Oakdale NT, Bonnar JL, Prabu JR, Boydston EA, Sevillano N, Shurtleff MJ, Stroud RM, Craik CS, Schulman BA, Frost A, Weissman JS
eLife 2020 Nov 25;9
eLife 2020 Nov 25;9
Golgi-associated BICD adaptors couple ER membrane penetration and disassembly of a viral cargo.
Spriggs CC, Badieyan S, Verhey KJ, Cianfrocco MA, Tsai B
The Journal of cell biology 2020 May 4;219(5)
The Journal of cell biology 2020 May 4;219(5)
TBC1D5-Catalyzed Cycling of Rab7 Is Required for Retromer-Mediated Human Papillomavirus Trafficking during Virus Entry.
Xie J, Heim EN, Crite M, DiMaio D
Cell reports 2020 Jun 9;31(10):107750
Cell reports 2020 Jun 9;31(10):107750
Reticulon protects the integrity of the ER membrane during ER escape of large macromolecular protein complexes.
Chen YJ, Williams JM, Arvan P, Tsai B
The Journal of cell biology 2020 Feb 3;219(2)
The Journal of cell biology 2020 Feb 3;219(2)
Dynein Engages and Disassembles Cytosol-Localized Simian Virus 40 To Promote Infection.
Ravindran MS, Spriggs CC, Verhey KJ, Tsai B
Journal of virology 2018 Jun 15;92(12)
Journal of virology 2018 Jun 15;92(12)
A Non-enveloped Virus Hijacks Host Disaggregation Machinery to Translocate across the Endoplasmic Reticulum Membrane.
Ravindran MS, Bagchi P, Inoue T, Tsai B
PLoS pathogens 2015 Aug;11(8):e1005086
PLoS pathogens 2015 Aug;11(8):e1005086
MUC1 regulates nuclear localization and function of the epidermal growth factor receptor.
Bitler BG, Goverdhan A, Schroeder JA
Journal of cell science 2010 May 15;123(Pt 10):1716-23
Journal of cell science 2010 May 15;123(Pt 10):1716-23
BAP31 is involved in the retention of cytochrome P450 2C2 in the endoplasmic reticulum.
Szczesna-Skorupa E, Kemper B
The Journal of biological chemistry 2006 Feb 17;281(7):4142-8
The Journal of biological chemistry 2006 Feb 17;281(7):4142-8
Association of BAP31 with CD11b/CD18. Potential role in intracellular trafficking of CD11b/CD18 in neutrophils.
Zen K, Utech M, Liu Y, Soto I, Nusrat A, Parkos CA
The Journal of biological chemistry 2004 Oct 22;279(43):44924-30
The Journal of biological chemistry 2004 Oct 22;279(43):44924-30
No comments: Submit comment
Supportive validation
- Submitted by
- Invitrogen Antibodies (provider)
- Main image
- Experimental details
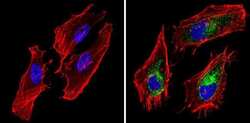
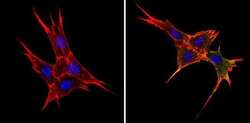
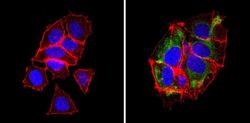
- Immunofluorescent analysis of BAP31 (green) showing staining in the cytoplasm of Hela cells (right) compared to a negative control without primary antibody (left). Formalin-fixed cells were permeabilized with 0.1% Triton X-100 in TBS for 5-10 minutes and blocked with 3% BSA-PBS for 30 minutes at room temperature. Cells were probed with a BAP31 monoclonal antibody (Product # MA3-002) in 3% BSA-PBS at a dilution of 1:200 and incubated overnight at 4ºC in a humidified chamber. Cells were washed with PBST and incubated with a DyLight-conjugated secondary antibody in PBS at room temperature in the dark. Actin was stained using Alexa Fluor 554 (red) and nuclei were stained with Hoechst or DAPI (blue). Images were taken at a magnification of 60x.

- Submitted by
- Invitrogen Antibodies (provider)
- Main image
- Experimental details
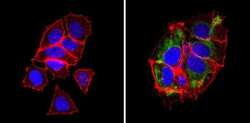
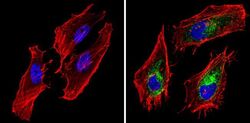
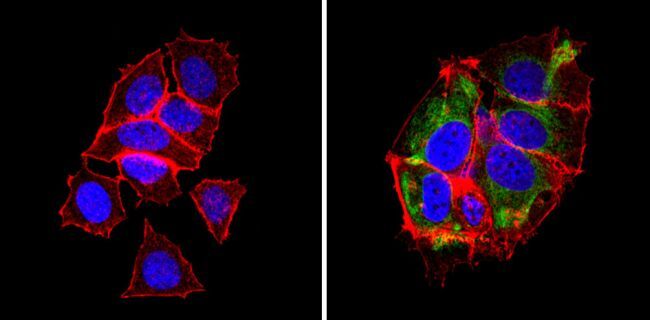
- Immunofluorescent analysis of BAP31 (green) showing staining in the cytoplasm of MCF-7 cells (right) compared to a negative control without primary antibody (left). Formalin-fixed cells were permeabilized with 0.1% Triton X-100 in TBS for 5-10 minutes and blocked with 3% BSA-PBS for 30 minutes at room temperature. Cells were probed with a BAP31 monoclonal antibody (Product # MA3-002) in 3% BSA-PBS at a dilution of 1:200 and incubated overnight at 4ºC in a humidified chamber. Cells were washed with PBST and incubated with a DyLight-conjugated secondary antibody in PBS at room temperature in the dark. Actin was stained using Alexa Fluor 554 (red) and nuclei were stained with Hoechst or DAPI (blue). Images were taken at a magnification of 60x.
- Submitted by
- Invitrogen Antibodies (provider)
- Main image
- Experimental details
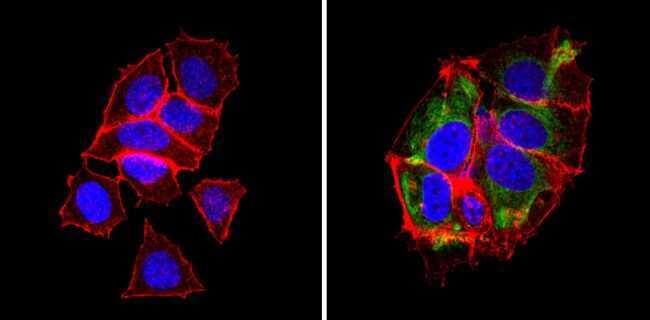
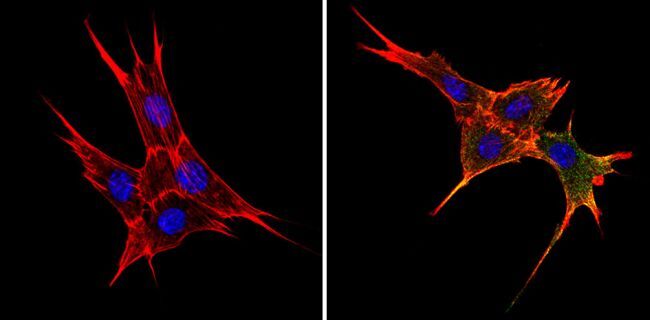
- Immunofluorescent analysis of BAP31 (green) showing staining in the cytoplasm of NIH-3T3 cells (right) compared to a negative control without primary antibody (left). Formalin-fixed cells were permeabilized with 0.1% Triton X-100 in TBS for 5-10 minutes and blocked with 3% BSA-PBS for 30 minutes at room temperature. Cells were probed with a BAP31 monoclonal antibody (Product # MA3-002) in 3% BSA-PBS at a dilution of 1:200 and incubated overnight at 4ºC in a humidified chamber. Cells were washed with PBST and incubated with a DyLight-conjugated secondary antibody in PBS at room temperature in the dark. Actin was stained using Alexa Fluor 554 (red) and nuclei were stained with Hoechst or DAPI (blue). Images were taken at a magnification of 60x.

- Submitted by
- Invitrogen Antibodies (provider)
- Main image
- Experimental details
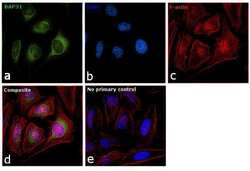
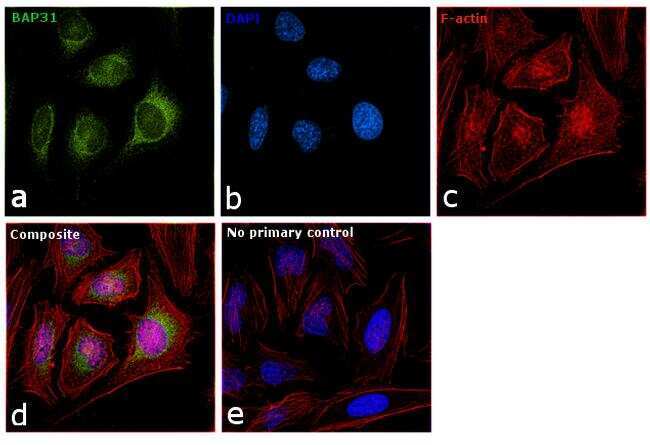
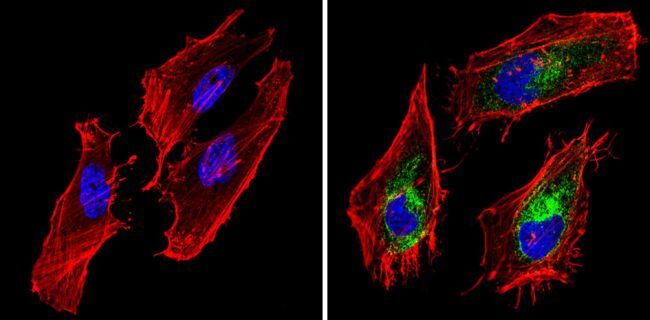
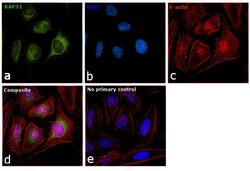
- Immunofluorescence analysis of BAP31 was performed using 70% confluent log phase HeLa cells. The cells were fixed with 4% paraformaldehyde for 10 minutes, permeabilized with 0.1% Triton™ X-100 for 15 minutes, and blocked with 1% BSA for 1 hour at room temperature. The cells were labeled with BAP31 Monoclonal Antibody (Product # MA3-002) at 1:200 dilution in 0.1% BSA, incubated at 4 degree Celsius overnight and then labeled with Goat anti-Rat IgG (H+L) Secondary Antibody, Alexa Fluor® 488 conjugate (Product # A-11006) at a dilution of 1:2000 for 45 minutes at room temperature (Panel a: green). Nuclei (Panel b: blue) were stained with ProLong™ Diamond Antifade Mountant with DAPI (Product # P36962). F-actin (Panel c: red) was stained with Rhodamine Phalloidin (Product # R415, 1:300). Panel d represents the merged image showing localization in endoplasmic reticulum, golgi and mitochondria. Panel e represents control cells with no primary antibody to assess background. The images were captured at 60X magnification.
- Submitted by
- Invitrogen Antibodies (provider)
- Main image
- Experimental details
- Immunofluorescent analysis of BAP31 (green) showing staining in the cytoplasm of Hela cells (right) compared to a negative control without primary antibody (left). Formalin-fixed cells were permeabilized with 0.1% Triton X-100 in TBS for 5-10 minutes and blocked with 3% BSA-PBS for 30 minutes at room temperature. Cells were probed with a BAP31 monoclonal antibody (Product # MA3-002) in 3% BSA-PBS at a dilution of 1:200 and incubated overnight at 4ºC in a humidified chamber. Cells were washed with PBST and incubated with a DyLight-conjugated secondary antibody in PBS at room temperature in the dark. Actin was stained using Alexa Fluor 554 (red) and nuclei were stained with Hoechst or DAPI (blue). Images were taken at a magnification of 60x.
- Submitted by
- Invitrogen Antibodies (provider)
- Main image
- Experimental details
- Immunofluorescent analysis of BAP31 (green) showing staining in the cytoplasm of MCF-7 cells (right) compared to a negative control without primary antibody (left). Formalin-fixed cells were permeabilized with 0.1% Triton X-100 in TBS for 5-10 minutes and blocked with 3% BSA-PBS for 30 minutes at room temperature. Cells were probed with a BAP31 monoclonal antibody (Product # MA3-002) in 3% BSA-PBS at a dilution of 1:200 and incubated overnight at 4ºC in a humidified chamber. Cells were washed with PBST and incubated with a DyLight-conjugated secondary antibody in PBS at room temperature in the dark. Actin was stained using Alexa Fluor 554 (red) and nuclei were stained with Hoechst or DAPI (blue). Images were taken at a magnification of 60x.
- Submitted by
- Invitrogen Antibodies (provider)
- Main image

- Experimental details
- Immunofluorescent analysis of BAP31 (green) showing staining in the cytoplasm of NIH-3T3 cells (right) compared to a negative control without primary antibody (left). Formalin-fixed cells were permeabilized with 0.1% Triton X-100 in TBS for 5-10 minutes and blocked with 3% BSA-PBS for 30 minutes at room temperature. Cells were probed with a BAP31 monoclonal antibody (Product # MA3-002) in 3% BSA-PBS at a dilution of 1:200 and incubated overnight at 4ºC in a humidified chamber. Cells were washed with PBST and incubated with a DyLight-conjugated secondary antibody in PBS at room temperature in the dark. Actin was stained using Alexa Fluor 554 (red) and nuclei were stained with Hoechst or DAPI (blue). Images were taken at a magnification of 60x.
- Submitted by
- Invitrogen Antibodies (provider)
- Main image
- Experimental details
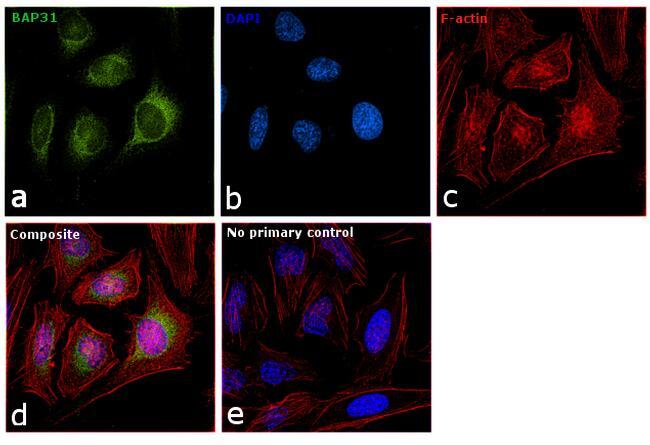
- Immunofluorescence analysis of BAP31 was performed using 70% confluent log phase HeLa cells. The cells were fixed with 4% paraformaldehyde for 10 minutes, permeabilized with 0.1% Triton™ X-100 for 15 minutes, and blocked with 1% BSA for 1 hour at room temperature. The cells were labeled with BAP31 Monoclonal Antibody (Product # MA3-002) at 1:200 dilution in 0.1% BSA, incubated at 4 degree Celsius overnight and then labeled with Goat anti-Rat IgG (H+L) Secondary Antibody, Alexa Fluor® 488 conjugate (Product # A-11006) at a dilution of 1:2000 for 45 minutes at room temperature (Panel a: green). Nuclei (Panel b: blue) were stained with ProLong™ Diamond Antifade Mountant with DAPI (Product # P36962). F-actin (Panel c: red) was stained with Rhodamine Phalloidin (Product # R415, 1:300). Panel d represents the merged image showing localization in endoplasmic reticulum, golgi and mitochondria. Panel e represents control cells with no primary antibody to assess background. The images were captured at 60X magnification.
Supportive validation
- Submitted by
- Invitrogen Antibodies (provider)
- Main image

- Experimental details
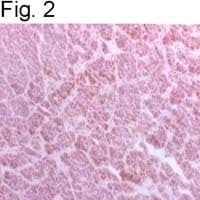
- Immunohistochemical staining of BAP31 in baboon adrenal gland using Product # MA3-002.
Supportive validation
- Submitted by
- Invitrogen Antibodies (provider)
- Main image
- Experimental details
- NULL
- Submitted by
- Invitrogen Antibodies (provider)
- Main image
- Experimental details
- NULL
- Submitted by
- Invitrogen Antibodies (provider)
- Main image

- Experimental details
- NULL
- Submitted by
- Invitrogen Antibodies (provider)
- Main image

- Experimental details
- NULL
- Submitted by
- Invitrogen Antibodies (provider)
- Main image

- Experimental details
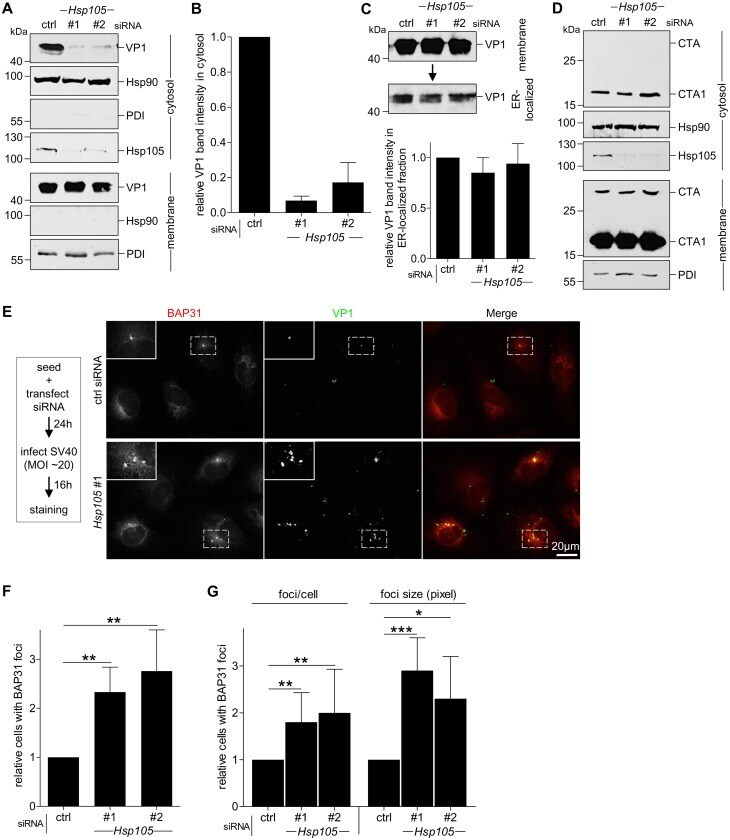
- Fig 3 Hsp105 is indispensable for SV40 cytosol arrival. A . CV-1 cells transfected with the indicated siRNAs for 24 h were incubated with SV40 (MOI ~5), harvested 12 hpi, and processed according to the semi-permeabilized cytosol arrival assay (see Methods ). Hsp90 and PDI serve as markers for the cytosol and membrane fraction, respectively. B . Relative VP1 band intensities in the cytosol fraction in (A) were quantified. Data are normalized to ctrl siRNA. Values represent the mean +- SD (n = 3). C . Membrane fraction in (A) was solubilized in a buffer containing 1% Triton X-100. After centrifugation, the extracted material containing ER-localized SV40 was analyzed by immunoblotting with VP1 antibodies (top panel). Relative VP1 band intensities in the ER-localized fraction were quantified as in (B) (bottom panel). D . As in (A), except cells were treated with 10 nM cholera toxin for 90 min before harvesting and analyzing using the indicated antibodies. E . CV-1 cells were transfected with either ctrl or Hsp105 siRNA #1. After 24 h, cells were infected with SV40 (MOI ~20) for 16 h. Cells were then fixed, stained, and analyzed by immunofluorescence microscopy. The experimental set-up is depicted on the left side of the figure. The insert shows a 2x enlarged area of the dotted box. Scale bar, 20 mum. F . The siRNA-transfected cells were scored for the presence of at least one BAP31-positive focus in each cell, and the values normalized to the ctrl siRNA. The bar graphs represent
- Submitted by
- Invitrogen Antibodies (provider)
- Main image
- Experimental details
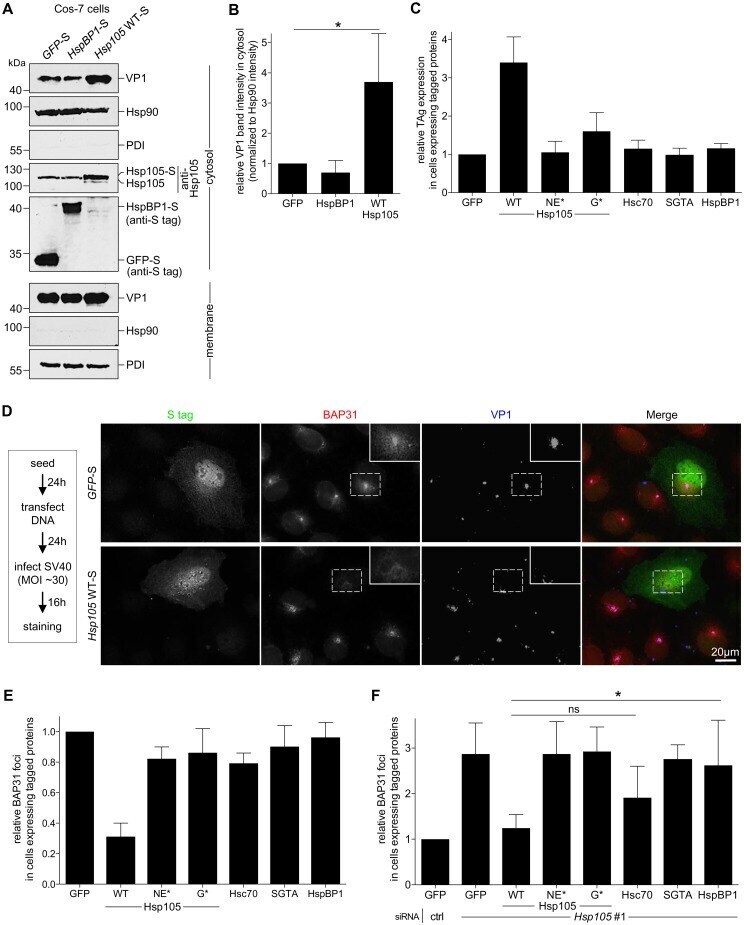
- Fig 4 Hsp105 overexpression enhances SV40 extraction into the cytosol. A . COS-7 cells expressing the indicated S-tagged construct were infected with SV40 (MOI ~5). 12 hpi, cells were processed as in Fig 3A , and the samples immunoblotted using the indicated antibodies. B . VP1 band intensities of the cytosol-localized SV40 in (A) were quantified and normalized against the Hsp90 band intensity. Values represent the mean +- SD (n>=3). * p =3). D . CV-1 cells expressing GFP-S or Hsp105 WT-S were infected with SV40 (MOI ~30) for 16 h. Cells were fixed, stained with BAP31 and VP1 antibodies, and imaged as in Fig 3E . The experimental set-up is depicted on the left side of the figure. In the first column, a representative cell expressing GFP-S (top row) or Hsp105 WT-S (second row) amongst cells not expressing this protein is shown. The insert shows a 2x enlarged area of the dotted box. Scale bar, 20 mum. E . Cells expressing the indicated tagged construct are scored for the presence of at least one BAP31-positive focus in each cell, and the values normalized to GFP. The bar graphs represent mean values +- SD (n>=3). F . Cells transfected with either ctrl or Hsp105 siRNA #1 were subsequently transfected with the indicated tagged construct, and BAP31 foci were quantified as in (E)
- Submitted by
- Invitrogen Antibodies (provider)
- Main image
- Experimental details
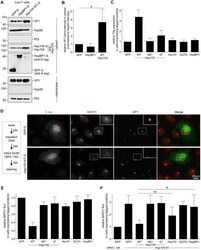
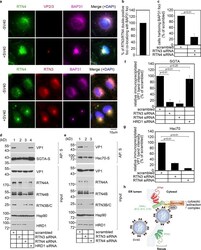
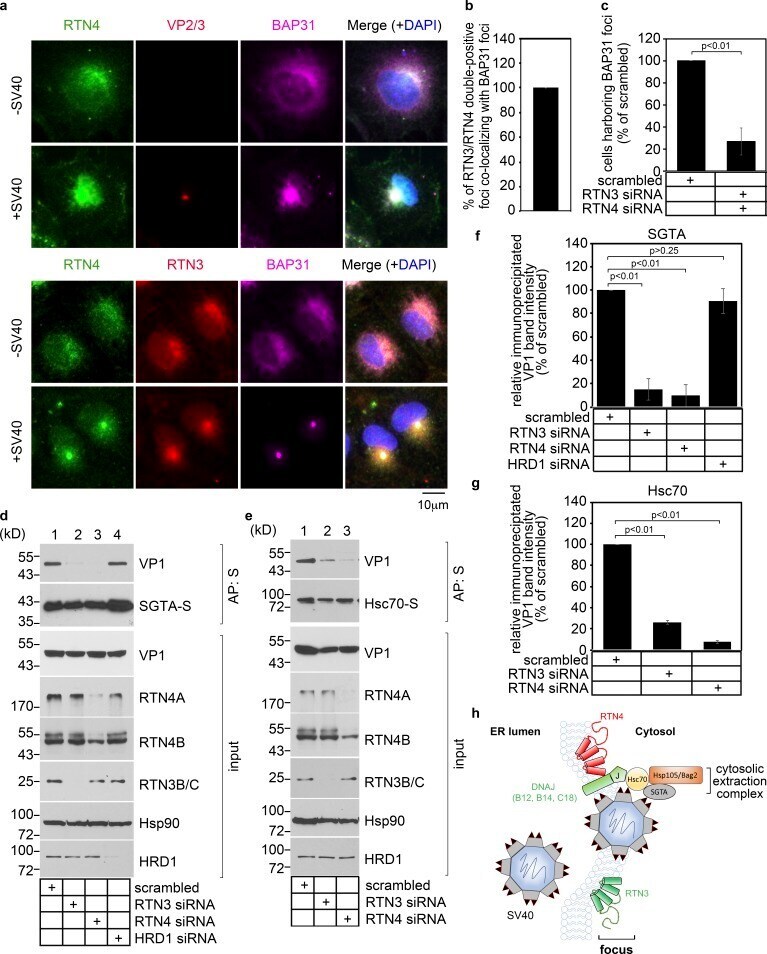
- Figure 3. RTN3 and RTN4 are recruited to viral foci to enable SV40 engagement with the cytosolic extraction machinery. (a) CV-1 cells uninfected or infected with SV40 for 16 h were fixed, stained with the indicated antibodies, and processed by epifluorescence microscopy. (b) Quantification of the percentage of RTN3/RTN4 double-positive foci colocalizing with BAP31 foci. Values represent means +- SD from three independent experiments. (c) Quantification of the percentage of RTN3/RTN4 double knockdown cells harboring BAP31 foci after SV40 infection. Cells were scored positive if at least one focus was present in the cell. Values represent means +- SD from three independent experiments. (d and e) COS-7 cells were treated with the indicated siRNAs for 24 h, followed by transfection of the SGTA-S (d) or Hsc70-S (e) construct. After 24 h, cells were infected with SV40 for 16 h, and the resulting cell extracts were subjected to affinity purification (AP), SDS-PAGE, and immunoblotting with the indicated antibodies. Input represents 5% of the total sample used for the affinity purification. (f and g) The VP1 band intensities from d and e were quantified with ImageJ software, normalized relative to the precipitated SGTA-S or Hsc70-S level, and expressed as a percentage of the VP1 band intensity in the scrambled siRNA-treated sample. The graph represents the means and SDs from three independent experiments. Student's two-tailed t test was used to determine statistical significance. (h)
- Submitted by
- Invitrogen Antibodies (provider)
- Main image
- Experimental details
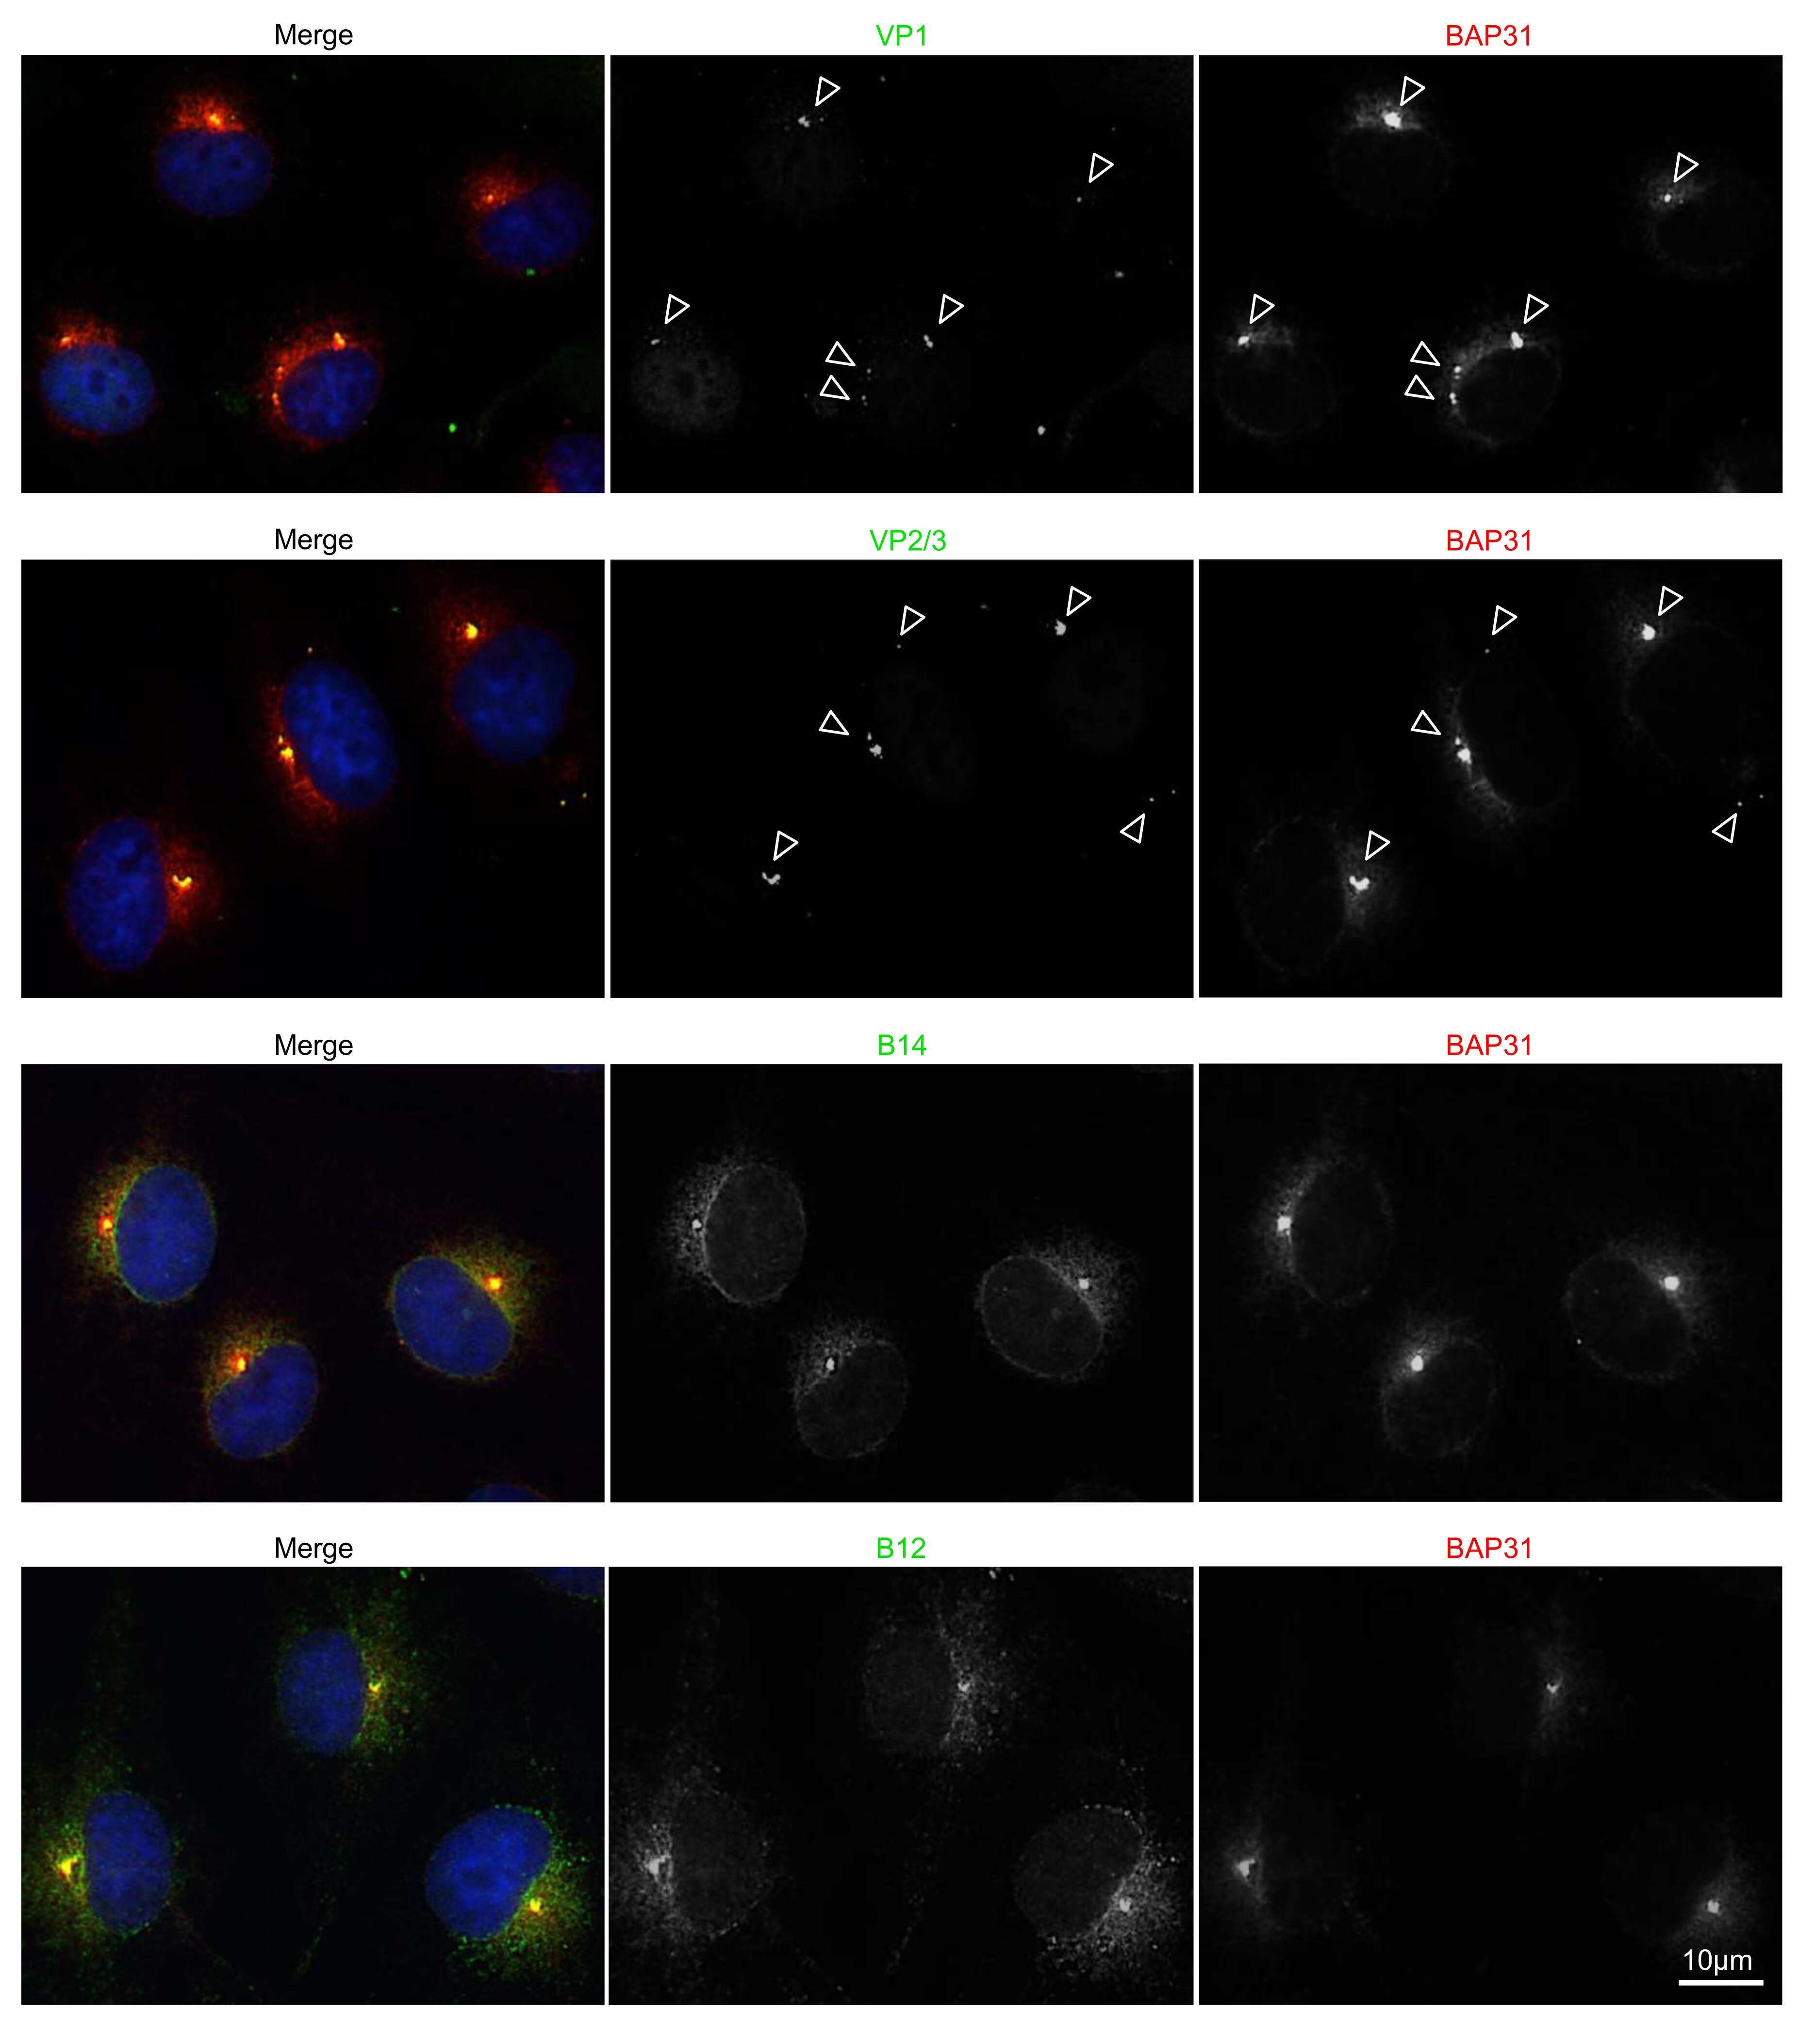
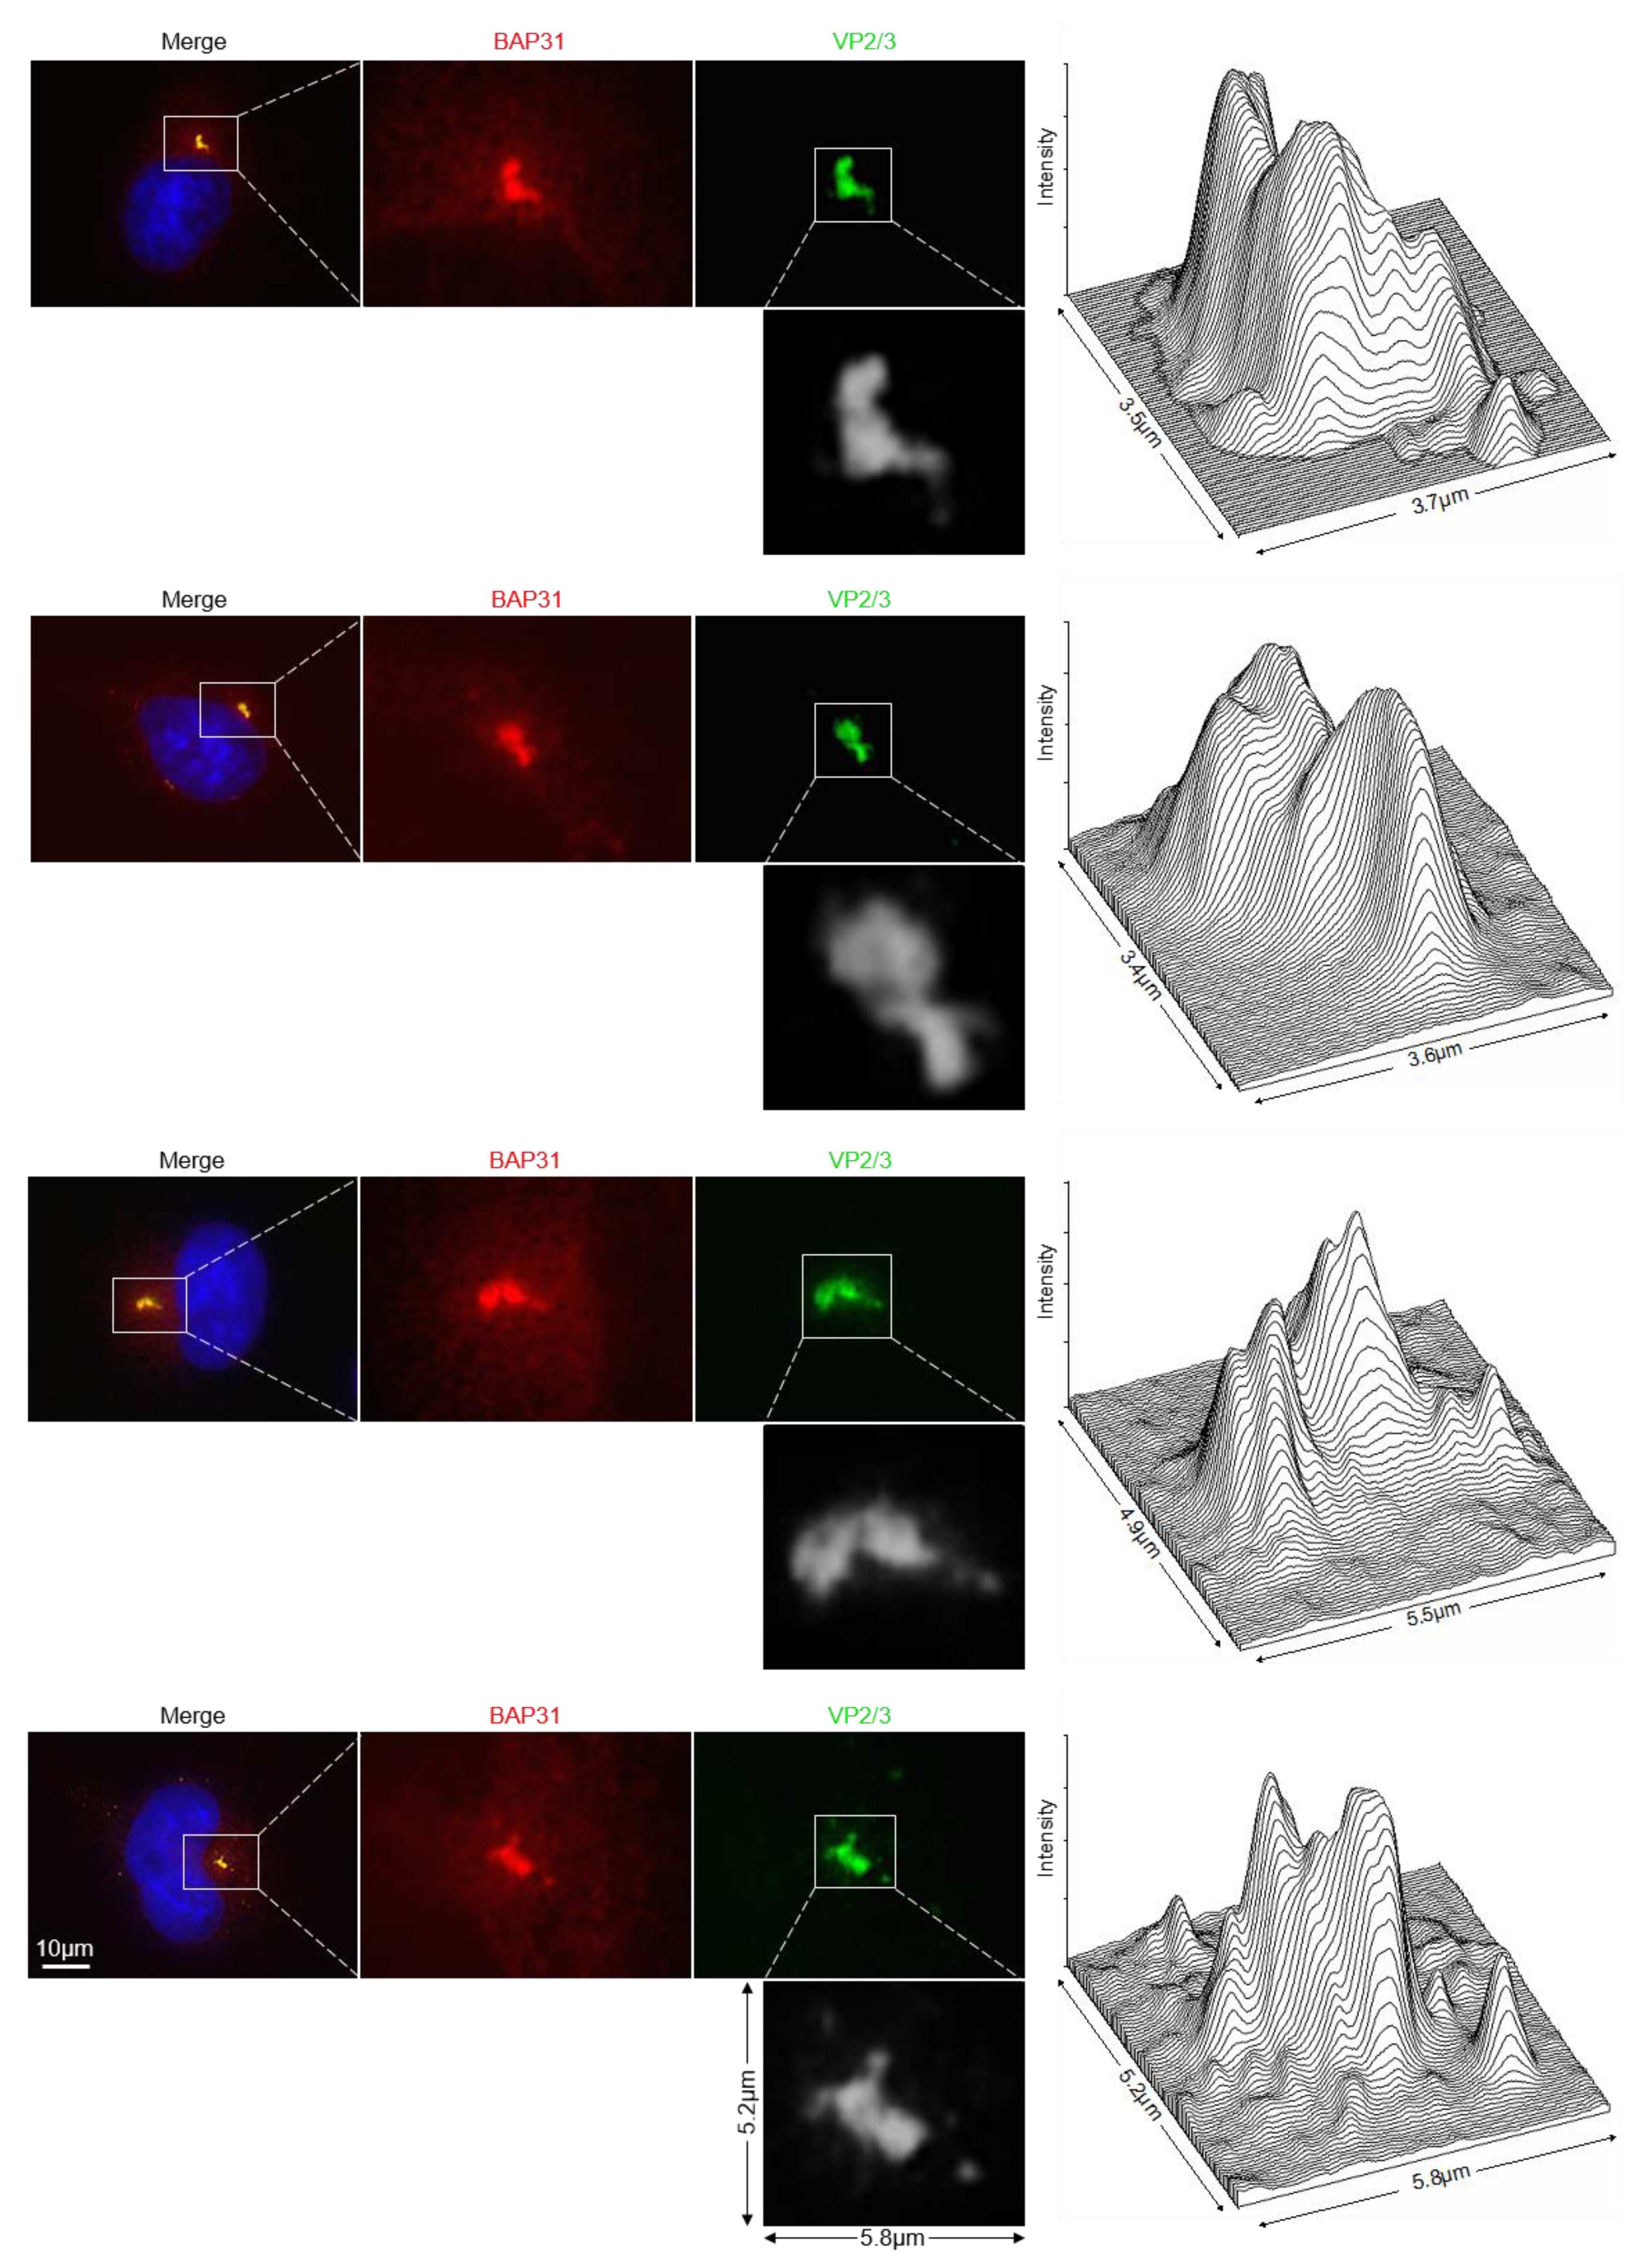
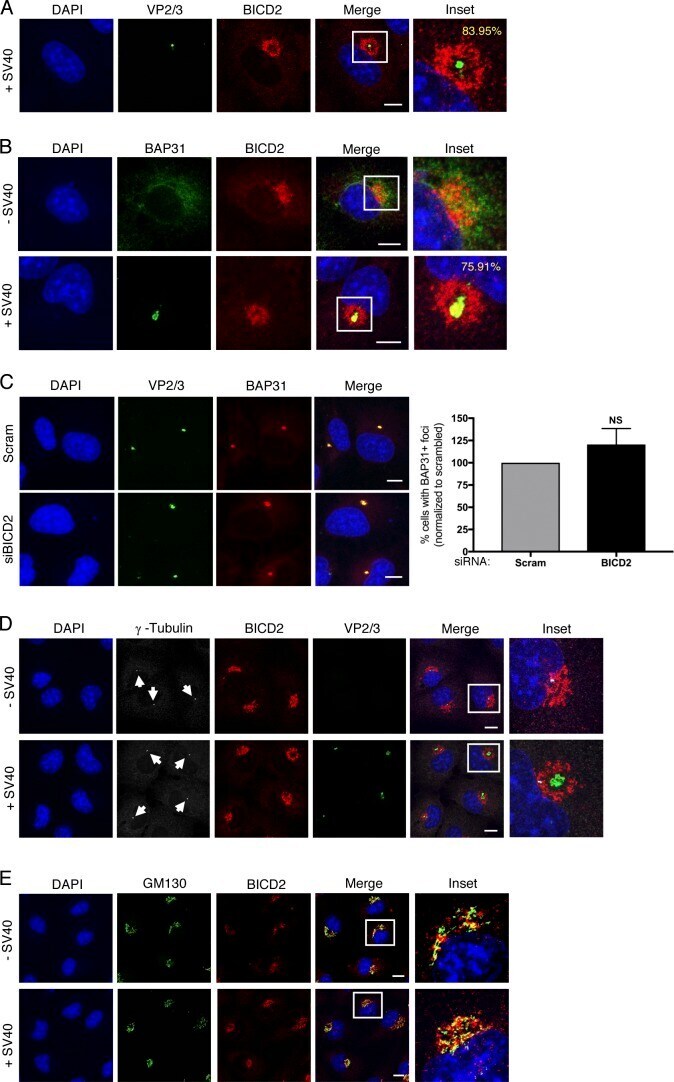
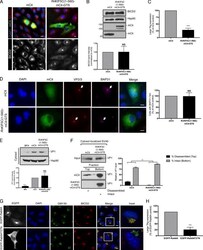
- Figure 6. The SV40-induced ER focus is constructed proximal to Golgi-associated BICD2. (A) Confocal analysis of CV-1 cells that were infected with SV40 (MOI ~5) for 16 h and stained with anti-VP2/3 (green) and anti-BICD2 (red) antibodies. Cells were counterstained with DAPI (blue). Percentage represents the number of VP2/3 foci surrounded by BICD2 out of total cells with VP2/3 foci. (B) Confocal analysis of uninfected or SV40-infected cells (MOI ~5) stained with anti-BAP31 (green) and anti-BICD2 (red) antibodies. Cells were counterstained with DAPI (blue). Percentage represents the number of BAP31 foci surrounded by BICD2 out of total cells with virus-induced BAP31 foci. (C) Confocal analysis of control and BICD2-depleted CV-1 cells infected with SV40 (MOI ~5). At 16 hpi, cells were stained with anti-VP2/3 (green) and anti-BAP31 (red) and counterstained with DAPI (blue). The graph represents the percentage of cells with BAP31 + foci normalized to the scrambled control. (D) As in B, except cells were stained with anti-gamma-tubulin (white, arrows), anti-BICD2 (red), and anti-VP2/3 (green) antibodies. Cells were counterstained with DAPI (blue). (E) As in B, except cells were stained with anti-GM130 (green) and anti-BICD2 (red) antibodies. Cells were counterstained with DAPI (blue). Scale bars, 10 um. Values are averages of the means ( n = 3) +- SD. A standard Student's t test was used to determine statistical significance. See also Fig. S4 .
- Submitted by
- Invitrogen Antibodies (provider)
- Main image
- Experimental details
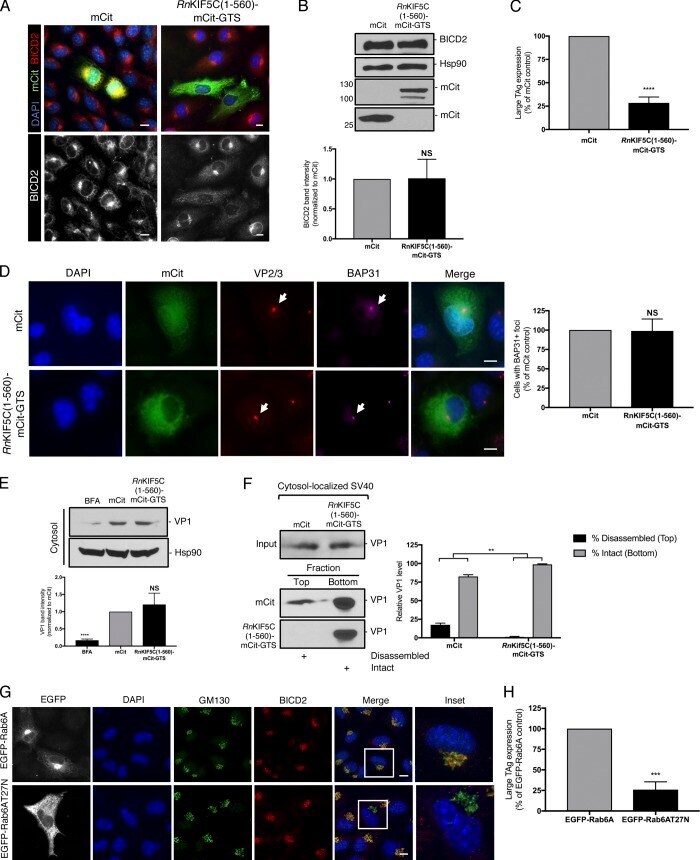
- Figure 7. BICD2 localization to the Golgi is crucial to promote SV40 disassembly and infection. (A) CV-1 cells were transfected with either the mCitN 1 control or Rn KIF5C(1-560)-mCit-GTS construct for 24 h and stained for BICD2 (red/white). Cells were counterstained with DAPI (blue). (B) COS-7 cells were transfected with either the mCitN 1 control or Rn KIF5C(1-560)-mCit-GTS construct for 24 h. Cells were harvested and the BICD2 levels assessed by immunoblotting. Hsp90 was used as a loading control. Anti-GFP was used to detect mCit levels. The BICD2 band intensities in cells expressing mCitN 1 or Rn KIF5C(1-560)-mCit-GTS are quantified in graph below. (C) CV-1 cells were transfected with either the mCitN 1 control or Rn KIF5C(1-560)-mCit-GTS construct for 24 h and infected with SV40 (MOI~1). At 24 hpi, cells were fixed and stained for TAg. Only mCit expressing cells were counted (green). (D) As in C, except cells were infected for 16 h and stained with anti-VP2/3 (red), anti-BAP31 (pink) and counterstained with DAPI (blue). Data on graph was normalized to the mCitN 1 control. (E) COS-7 cells were transfected with either the mCitN 1 control or Rn KIF5C(1-560)-mCit-GTS construct for 24 h and then infected with SV40 (MOI~5). At 12 hpi, the cytosolic fraction was isolated and VP1 levels assessed by immunoblotting. Cytosolic Hsp90 was used as a loading control. The VP1 band intensities are quantified in the graph below. (F) As in E, except at 12 hpi, the cytosolic fraction was la
- Submitted by
- Invitrogen Antibodies (provider)
- Main image
- Experimental details
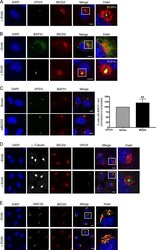
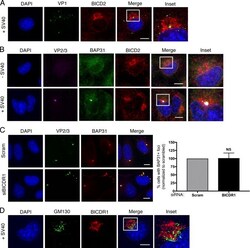
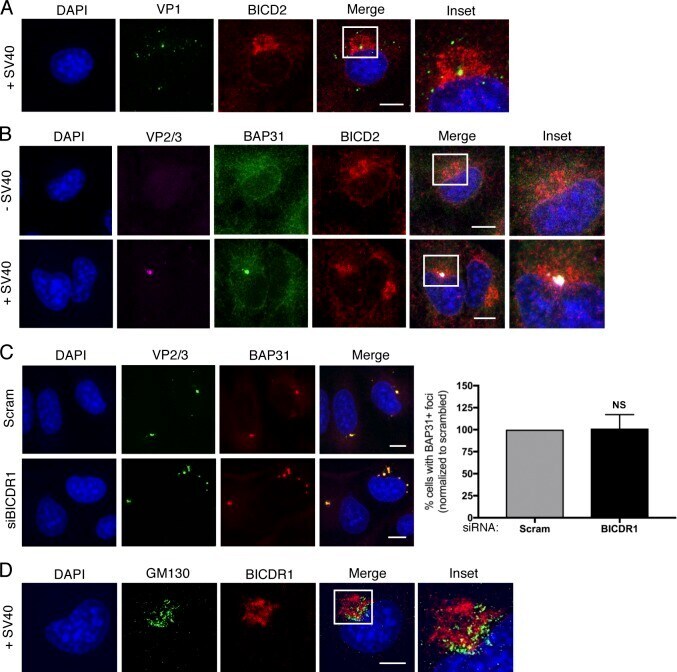
- Figure S4. The SV40-induced ER focus is surrounded by BICD2 and BICDR1 (related to Fig. 6 ). (A) Confocal analysis of CV-1 cells that were infected with SV40 (MOI ~5) for 16 h and stained with anti-VP1 (green) and anti-BICD2 (red) antibodies. Cells were counterstained with DAPI (blue). (B) Confocal analysis of uninfected and SV40-infected cells (MOI ~5) stained with anti-VP2/3 (pink), anti-BAP31 (green), and anti-BICD2 (red) antibodies. Cells were counterstained with DAPI (blue). (C) Confocal analysis of control and BICDR1-depleted CV-1 cells infected with SV40 (MOI ~5). At 16 hpi, cells were stained with anti-VP2/3 (green), anti-BAP31 (red), and counterstained with DAPI (blue). The graph represents the percentage of cells with BAP31 + foci normalized to the scrambled control. (D) As in A, except stained with anti-GM130 (green) and anti-BICDR1 (red) antibodies. Cells were counterstained with DAPI (blue). Scale bars, 10 um. Values are averages of the means ( n = 3) +- SD. A standard Student's t test was used to determine statistical significance.
- Submitted by
- Invitrogen Antibodies (provider)
- Main image
- Experimental details
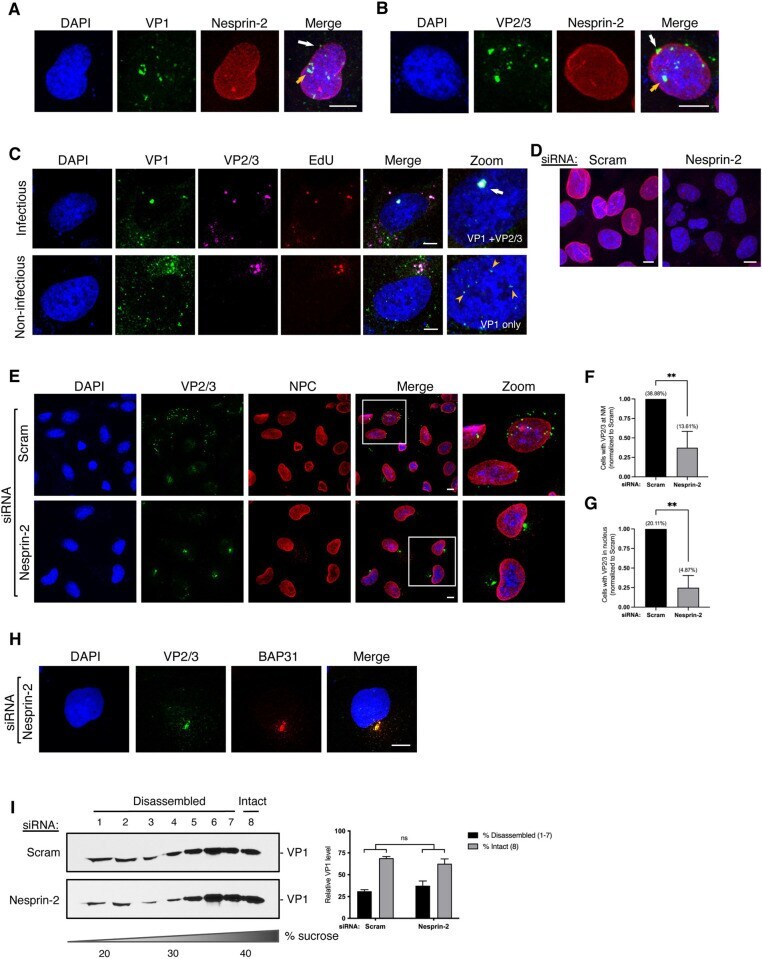
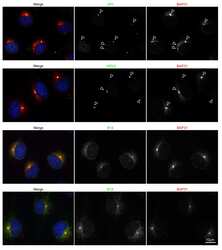
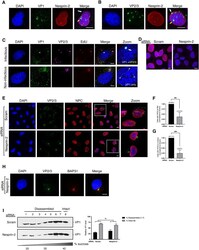
- 10.1371/journal.ppat.1010824.g003 Fig 3 Nesprin-2 promotes nuclear arrival of SV40. (A) Confocal analysis of CV-1 cells that were infected with SV40 (MOI ~25) for 20 h in the presence of 1 muM actinomycin D (ActD) and stained with anti-VP1 (green) and anti-Nesprin-2 (red) antibodies. Cells were counterstained with DAPI (blue). White arrow = VP1 at nuclear membrane, orange arrow = VP1 inside the nucleus. (B) As in A, except cells were stained with anti-VP2/3 instead. White arrow = VP2/3 at nuclear membrane, orange arrow = VP2/3 inside the nucleus. (C) Confocal analysis of CV-1 cells infected with ethynyl-2'-deoxyuridine (EdU)-labelled SV40 (MOI ~25; red) for 20 h with 1 muM ActD. EdU labeling in cells was detected using the Click-iT EdU reaction kit according to the manufacturer's protocol and then stained with anti-VP1 (green) and anti-VP2/3 (pink). Cells were counterstained with DAPI (blue). White arrow = VP1 with VP2/3 and genome, orange arrowhead = VP1 only (no genome) inside of the nucleus. (D) Confocal analysis of CV-1 cells that were transfected with the scrambled control siRNA or siRNA against Nesprin-2 for 48 h and stained with anti-Nesprin-2 (red) antibody. Cells were counterstained with DAPI (blue). (E) Confocal analysis of CV-1 cells that were infected with SV40 (MOI ~25) for 20 h with 1 muM ActD and stained with anti-VP2/3 (green) and anti-MAB414 that stains the NPC (red). Cells were counterstained with DAPI (blue). (F) Quantification of the percentage of cells in