Explore
 Validate
 Learn
LearnMA1-23308
antibody from Invitrogen Antibodies
Targeting: NDC80
HEC, HEC1, hsNDC80, KNTC2, TID3
 Western blot
 Immunocytochemistry
 Immunoprecipitation Immunohistochemistry Flow cytometry Other assay
Antibody data
- Antibody Data
- Antigen structure
- References [7]
- Comments [0]
- Validations
- Immunocytochemistry [14]
- Other assay [9]
Submit
Validation data
Reference
Comment
Report error
- Product number
- MA1-23308 - Provider product page

- Provider
- Invitrogen Antibodies
- Product name
- HEC1 Monoclonal Antibody (9G3.23)
- Antibody type
- Monoclonal
- Antigen
- Other
- Description
- Positive control of HELA WCE suggested.
- Reactivity
- Human, Mouse, Hamster
- Host
- Mouse
- Isotype
- IgG
- Antibody clone number
- 9G3.23
- Vial size
- 100 μL
- Concentration
- 1 mg/mL
- Storage
- Store at 4°C short term. For long term storage, store at -20°C, avoiding freeze/thaw cycles.
Submitted references Induction of spontaneous human neocentromere formation and long-term maturation.
CENP-A overexpression promotes aneuploidy with karyotypic heterogeneity.
Reprogramming of human cells to pluripotency induces CENP-A chromatin depletion.
A Biosensor for the Mitotic Kinase MPS1 Reveals Spatiotemporal Activity Dynamics and Regulation.
Genetic screening identifies a SUMO protease dynamically maintaining centromeric chromatin.
chTOG is a conserved mitotic error correction factor.
The quantitative architecture of centromeric chromatin.
Murillo-Pineda M, Valente LP, Dumont M, Mata JF, Fachinetti D, Jansen LET
The Journal of cell biology 2021 Mar 1;220(3)
The Journal of cell biology 2021 Mar 1;220(3)
CENP-A overexpression promotes aneuploidy with karyotypic heterogeneity.
Shrestha RL, Rossi A, Wangsa D, Hogan AK, Zaldana KS, Suva E, Chung YJ, Sanders CL, Difilippantonio S, Karpova TS, Karim B, Foltz DR, Fachinetti D, Aplan PD, Ried T, Basrai MA
The Journal of cell biology 2021 Apr 5;220(4)
The Journal of cell biology 2021 Apr 5;220(4)
Reprogramming of human cells to pluripotency induces CENP-A chromatin depletion.
Milagre I, Pereira C, Oliveira RA, Jansen LET
Open biology 2020 Oct;10(10):200227
Open biology 2020 Oct;10(10):200227
A Biosensor for the Mitotic Kinase MPS1 Reveals Spatiotemporal Activity Dynamics and Regulation.
Kuijt TEF, Lambers MLA, Weterings S, Ponsioen B, Bolhaqueiro ACF, Staijen DHM, Kops GJPL
Current biology : CB 2020 Oct 5;30(19):3862-3870.e6
Current biology : CB 2020 Oct 5;30(19):3862-3870.e6
Genetic screening identifies a SUMO protease dynamically maintaining centromeric chromatin.
Mitra S, Bodor DL, David AF, Abdul-Zani I, Mata JF, Neumann B, Reither S, Tischer C, Jansen LET
Nature communications 2020 Jan 24;11(1):501
Nature communications 2020 Jan 24;11(1):501
chTOG is a conserved mitotic error correction factor.
Herman JA, Miller MP, Biggins S
eLife 2020 Dec 30;9
eLife 2020 Dec 30;9
The quantitative architecture of centromeric chromatin.
Bodor DL, Mata JF, Sergeev M, David AF, Salimian KJ, Panchenko T, Cleveland DW, Black BE, Shah JV, Jansen LE
eLife 2014 Jul 15;3:e02137
eLife 2014 Jul 15;3:e02137
No comments: Submit comment
Supportive validation
- Submitted by
- Invitrogen Antibodies (provider)
- Main image
- Experimental details
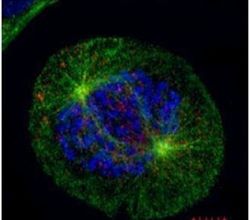
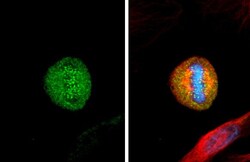
- Immunofluorescent analysis of HEC1 in U2OS cells fixed by 4% PFA. Cells were costained using a HEC1 monoclonal antibody (Product # MA1-23308) at a dilution of 1:500 and an Alpha-Tubulin polyclonal antibody (Product # PA5-29444) (Green) at a dilution of 1:500. Chromosomes are stained with DAPI (blue). Scale bar, 5 um.
- Submitted by
- Invitrogen Antibodies (provider)
- Main image

- Experimental details
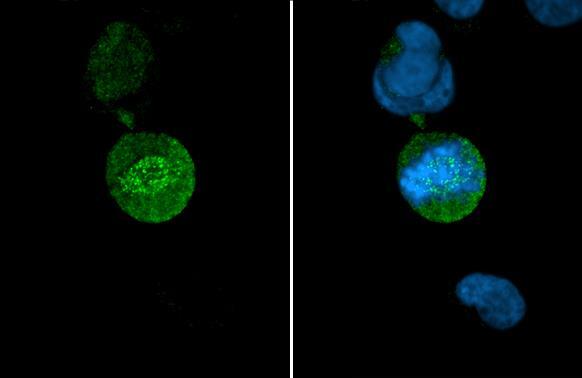
- Immunocytochemistry-Immunofluorescence analysis of HEC1 in MCF10A cells using HEC1 Monoclonal Antibody (9G3.23) (Product # MA1-23308). Insects show kinetochores of misaligned chromosomes. DAPI staining shows chromatin.
- Submitted by
- Invitrogen Antibodies (provider)
- Main image
- Experimental details
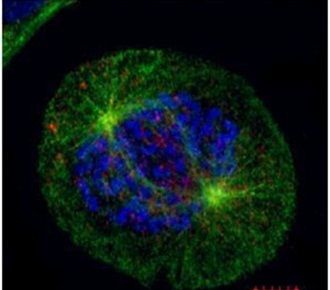
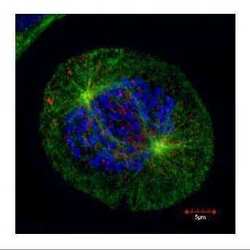
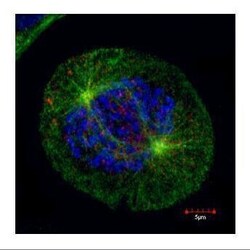
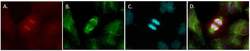
- Confocal immunofluorescence staining (Olympus FV10i) of HEC1, a kinetochore outer layer marker. U2OS cells were fixed by 4% PFA and costained with Hec1 9G3.23 AB (Red; HEC1 Monoclonal Antibody (9G3.23) (Product # MA1-23308); 1:500 Ab dilution) and alpha-tubulin rabbit polyclonal AB (Green; TUBA1A Polyclonal Antibody (Product # PA5-29444); 1:500 Ab dilution ), a spindle marker. DAPI (blue), chromosomes. Scale bar, 5 um.

- Submitted by
- Invitrogen Antibodies (provider)
- Main image

- Experimental details
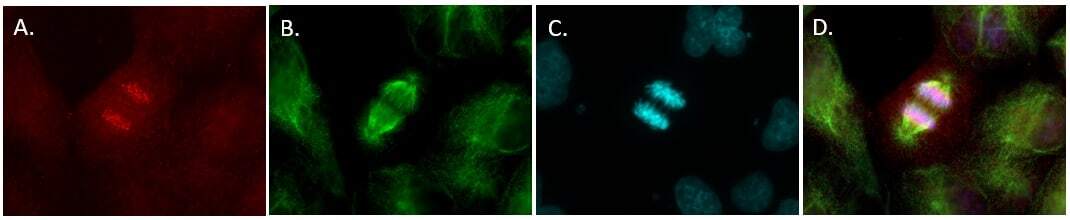
- Immunofluorescent analysis of HEC1 (kinetochore, red) in a BHP 2-7 thyroid cancer anaphase cell cultured in complete medium on a glass slide. Cells were fixed with 4% phosphate-buffered paraformaldehyde for 30 min at 37C, permeabilized with 100% ice-cold methanol for 20 min. and blocked with PBS/1% BSA/0.5% Tween 20 at 37C for 30 min. Cells were stained with anti-HEC1, clone 9G3, mouse IgG2a monoclonal antibody (Product # MA1-23308) at a dilution of 1:200 in PBS/1% BSA/0.1% Tween 20 for 60 min at 37C., and then incubated with goat anti-mouse IgG2a AF594 (Product # A-21135) at a dilution of 1:200 for 60 min. at 37C (panel a: red). Alpha tubulin (panel b: green) was stained simultaneously with anti alfa-tubulin, clone DM1A, mouse IgG1 (Product # 14-4502-82) followed by goat anti-mouse IgG1 AF488 (1:200, Cat # A-21121). DNA was stained with Hoechst33342 (panel c: blue). Panels d shows a merged image. Images were taken with a 40x immersion oil objective (for more information: Corver et al., Endocr Relat Cancer. 2018 Jan;25(1):83-97). Data courtesy of Antibody Data Exchange Program.
- Submitted by
- Invitrogen Antibodies (provider)
- Main image
- Experimental details
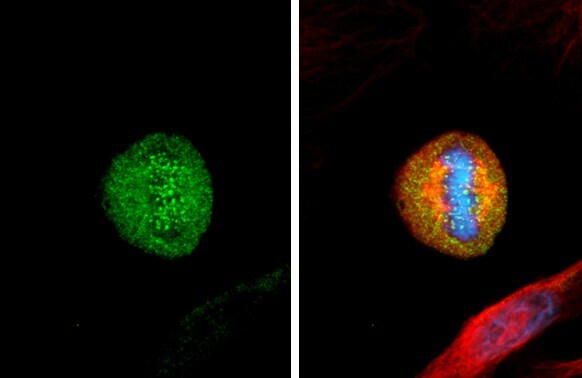
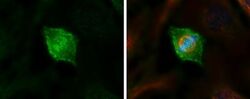
- Immunocytochemistry-Immunofluorescence analysis of HEC1 was performed in HeLa cells fixed in 4% paraformaldehyde at RT for 15 min. Green: HEC1 Monoclonal Antibody (9G3.23) (Product # MA1-23308) diluted at 1:500. Red: alpha Tubulin 4a, a cytoskeleton marker. Blue: Hoechst 33342 staining.
- Submitted by
- Invitrogen Antibodies (provider)
- Main image
- Experimental details
- Confocal immunofluorescence staining (Olympus FV10i) of HEC1, a kinetochore outer layer marker. U2OS cells were fixed by 4% PFA and costained with Hec1 9G3.23 AB (Red; HEC1 Monoclonal Antibody (9G3.23) (Product # MA1-23308); 1:500 Ab dilution) and alpha-tubulin rabbit polyclonal AB (Green; TUBA1A Polyclonal Antibody (Product # PA5-29444); 1:500 Ab dilution ), a spindle marker. DAPI (blue), chromosomes. Scale bar, 5 um.

- Submitted by
- Invitrogen Antibodies (provider)
- Main image

- Experimental details
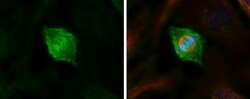
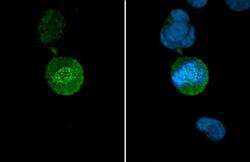
- HEC1 Monoclonal Antibody (9G3.23) detects Hec1 protein at Kinetochore by immunofluorescent analysis. Sample: HeLa cells were fixed in 4% paraformaldehyde at RT for 15 min. Green: Hec1 stained by HEC1 Monoclonal Antibody (9G3.23) (Product # MA1-23308) diluted at 1:500. Blue: Fluoroshield with DAPI .
- Submitted by
- Invitrogen Antibodies (provider)
- Main image
- Experimental details
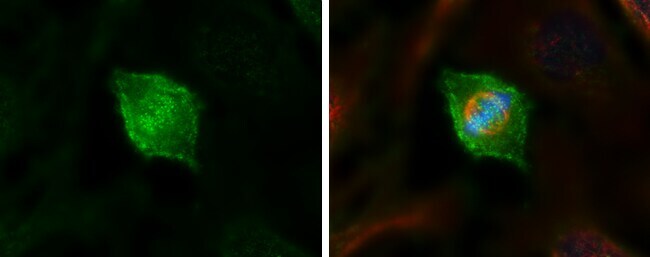
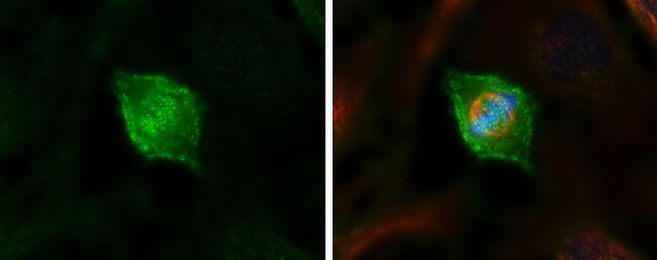
- HEC1 Monoclonal Antibody (9G3.23) detects Hec1 protein at kinetochore by immunofluorescent analysis. Sample: HeLa cells were fixed in 4% paraformaldehyde at RT for 15 min. Green: Hec1 stained by HEC1 Monoclonal Antibody (9G3.23) (Product # MA1-23308) diluted at 1:1,000. Red: alpha Tubulin, a cytoskeleton marker, stained by alpha Tubulin antibody (Product # PA5-85158) diluted at 1:1,000. Blue: Fluoroshield with DAPI .
- Submitted by
- Invitrogen Antibodies (provider)
- Main image

- Experimental details
- Confocal immunofluorescence staining (Olympus FV10i) of HEC1, a kinetochore outer layer marker. U2OS cells were fixed by 4% PFA and costained with Hec1 9G3.23 AB (Red; HEC1 Monoclonal Antibody (9G3.23) (Product # MA1-23308); 1:500 Ab dilution) and alpha-tubulin rabbit polyclonal AB (Green; TUBA1A Polyclonal Antibody (Product # PA5-29444); 1:500 Ab dilution ), a spindle marker. DAPI (blue), chromosomes. Scale bar, 5 um.

- Submitted by
- Invitrogen Antibodies (provider)
- Main image
- Experimental details
- HEC1 Monoclonal Antibody (9G3.23) detects Hec1 protein at Kinetochore by immunofluorescent analysis. Sample: HeLa cells were fixed in 4% paraformaldehyde at RT for 15 min. Green: Hec1 stained by HEC1 Monoclonal Antibody (9G3.23) (Product # MA1-23308) diluted at 1:500. Blue: Fluoroshield with DAPI .

- Submitted by
- Invitrogen Antibodies (provider)
- Main image

- Experimental details
- HEC1 Monoclonal Antibody (9G3.23) detects Hec1 protein at kinetochore by immunofluorescent analysis. Sample: HeLa cells were fixed in 4% paraformaldehyde at RT for 15 min. Green: Hec1 stained by HEC1 Monoclonal Antibody (9G3.23) (Product # MA1-23308) diluted at 1:1,000. Red: alpha Tubulin, a cytoskeleton marker, stained by alpha Tubulin antibody (Product # PA5-85158) diluted at 1:1,000. Blue: Fluoroshield with DAPI .

- Submitted by
- Invitrogen Antibodies (provider)
- Main image
- Experimental details
- Immunocytochemistry-Immunofluorescence analysis of HEC1 was performed in HeLa cells fixed in 4% paraformaldehyde at RT for 15 min. Green: HEC1 Monoclonal Antibody (9G3.23) (Product # MA1-23308) diluted at 1:500. Red: alpha Tubulin 4a, a cytoskeleton marker. Blue: Hoechst 33342 staining.
- Submitted by
- Invitrogen Antibodies (provider)
- Main image
- Experimental details
- Immunocytochemistry-Immunofluorescence analysis of HEC1 in MCF10A cells using HEC1 Monoclonal Antibody (9G3.23) (Product # MA1-23308). Insects show kinetochores of misaligned chromosomes. DAPI staining shows chromatin.

- Submitted by
- Invitrogen Antibodies (provider)
- Main image
- Experimental details
- Immunofluorescent analysis of HEC1 (kinetochore, red) in a BHP 2-7 thyroid cancer anaphase cell cultured in complete medium on a glass slide. Cells were fixed with 4% phosphate-buffered paraformaldehyde for 30 min at 37C, permeabilized with 100% ice-cold methanol for 20 min. and blocked with PBS/1% BSA/0.5% Tween 20 at 37C for 30 min. Cells were stained with anti-HEC1, clone 9G3, mouse IgG2a monoclonal antibody (Product # MA1-23308) at a dilution of 1:200 in PBS/1% BSA/0.1% Tween 20 for 60 min at 37C., and then incubated with goat anti-mouse IgG2a AF594 (Product # A-21135) at a dilution of 1:200 for 60 min. at 37C (panel a: red). Alpha tubulin (panel b: green) was stained simultaneously with anti alfa-tubulin, clone DM1A, mouse IgG1 (Product # 14-4502-82) followed by goat anti-mouse IgG1 AF488 (1:200, Cat # A-21121). DNA was stained with Hoechst33342 (panel c: blue). Panels d shows a merged image. Images were taken with a 40x immersion oil objective (for more information: Corver et al., Endocr Relat Cancer. 2018 Jan;25(1):83-97). Data courtesy of Antibody Data Exchange Program.

Supportive validation
- Submitted by
- Invitrogen Antibodies (provider)
- Main image
- Experimental details
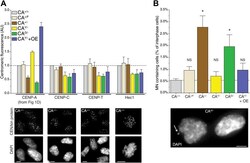
- Figure 6. Reduction of CENP-A leads to a CENP-C, CENP-T, and Hec1 independent increase in micronuclei. ( A ) Quantification of centromeric CENP-A (from Figure 1 ), CENP-C, CENP-T, and Hec1 levels for indicated cell lines; n = 4 independent experiments in each case. Note that cell lines carrying tagged CENP-A have a slight, yet non-significant impairment in recruiting CENP-C, CENP-T, and Hec1. However, this does not correlate with the CENP-A levels themselves. Below, representative images of indicated antibody staining from CA +/+ cells are shown. Representative images from all cell lines can be found in Figure 6--figure supplement 1 . ( B ) Quantification of the fraction of cells containing micronuclei (MN) for indicated cell lines. Asterisk indicates statistically significant increase compared to wild-type (paired t test; p

- Submitted by
- Invitrogen Antibodies (provider)
- Main image
- Experimental details
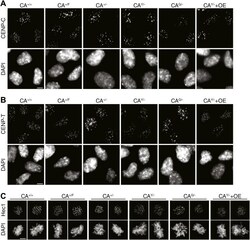
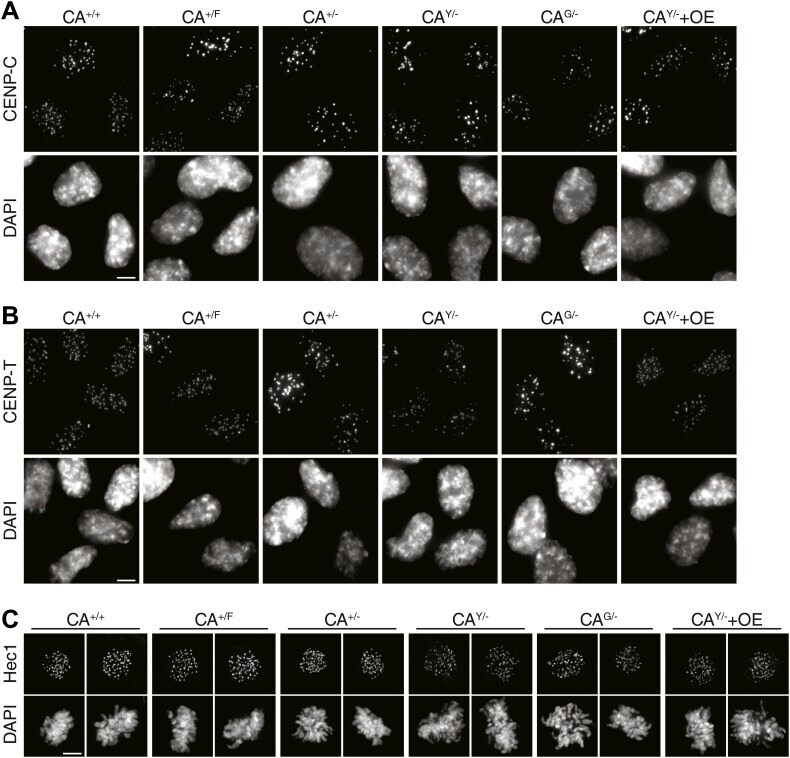
- Figure 6--figure supplement 1. Representative images for quantifications in Figure 6B . Images of indicated cell lines are shown for immunofluorescence staining of ( A ) CENP-C, ( B ) CENP-T, and ( C ) Hec1 (mitotic cells). Scale bars: 5 mum. DOI: http://dx.doi.org/
- Submitted by
- Invitrogen Antibodies (provider)
- Main image
- Experimental details
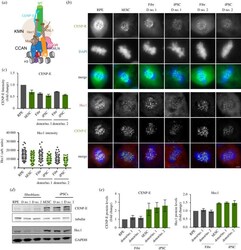
- Figure 4. Reduced outer kinetochore size of PSCs in mitosis. ( a ) Scheme representing the architecture and interactions of different proteins that comprise the human centromere and kinetochore. ( b ) Representative immunofluorescence images from differentiated (RPE and fibroblasts derived from donor no. 1 and donor no. 2-Fibr D no. 1 and Fibr D no. 2) and pluripotent stem cells (human embryonic stem cell line H9-hESC and iPSCs reprogrammed from Fibr D no. 1 and Fibr D no. 2-iPSC D no. 1 and iPSC D no. 2) for CENP-E and Hec1. ( c ) Quantitation of centromeric CENP-E and Hec1. Mean levels of fluorescence per nuclei was measured (CENP-E) or average centromere intensities were determined using automatic centromere recognition and quantification (Hec1). The average and standard error of the mean of one (Hec1) or three (CENP-E) independent experiments are shown. ( d ) Human ESCs, RPE, iPSCs and the fibroblasts they were reprogrammed from, were harvested and processed for SDS-PAGE and immunobloting. CENP-E and Hec1 levels were assessed with specific antibodies. GAPDH (Hec1) or tubulin (CENP-E) was used as a loading control. CENP-E and CENP-A (in figure 2 ) were detected in the same gel shown using different channels. ( e ) Quantitation of WB bands. Average and standard error of the mean of three independent experiments are shown. Protein levels were normalized to GAPDH or tubulin. Scale bar = 2 um.
- Submitted by
- Invitrogen Antibodies (provider)
- Main image
- Experimental details
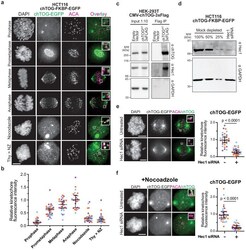
- Figure 1. chTOG localizes to kinetochores during mitosis. ( a ) Immunofluorescence images of chTOG subcellular localization during mitosis, as visualized in HCT116 cells expressing endogenously epitope-tagged chTOG-EGFP. Anti-centromere protein antibody (ACA) staining marks the centromere-binding proteins and representative images are shown with inlays of kinetochore proximal chTOG at each stage of mitosis. ( b ) Quantification of chTOG kinetochore association. Each data point represents mean chTOG-EGFP fluorescence intensity at all kinetochores in a single cell normalized to the mean value of the anaphase population ( c ) HEK-293T cells with either an empty vector control or overexpressed chTOG-3Flag were immunoprecipitated using anti-Flag antibodies. Immunoblots of the input (left) or Flag IP (right) show that the endogenous Hec1/Ndc80 protein specifically co-purified with chTOG. Endogenous and epitope tagged chTOG cannot be individually resolved by anti-chTOG immunoblotting because the 3Flag tag increases the protein's predicted MW by only 3%. Anti-GAPDH served as a non-specific control. ( d ) Immunoblotting with anti-Hec1 antibodies was performed on samples of mock-depleted lysate that were diluted to contain the indicated percent of total protein and compared to a lysate prepared from a population of HCT116 cells treated with Hec1 siRNA. Greater than 75% of Hec1 protein was depleted in the siRNA-treated cells. Anti-GAPDH is a loading control. ( e ) Kinetochore localizati
- Submitted by
- Invitrogen Antibodies (provider)
- Main image
- Experimental details
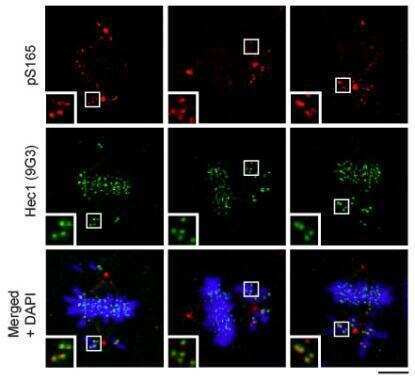
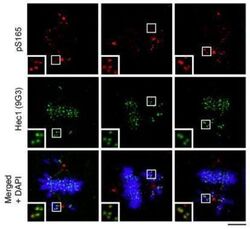
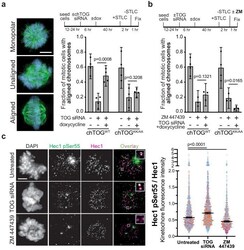
- Figure 6. chTOG- and Aurora-B-dependent error pathways likely function independently. ( a ) Mitotic error correction was assayed by inducing errors with STLC to inhibit Eg5 and then washing out the inhibitor in control cells or chTOG-depleted cells expressing chTOG WT or chTOG KK/AA . The chromosome alignment phenotype (left) was quantified 60 min after inhibitor washout. ( b ) The same error correction assay was performed as in ( a ) but was supplemented with a low dose of Aurora B kinase inhibitor ZM 447439. Untreated populations in ( a and b ) are the same and both display mean values and the 95% confidence interval of three or four experimental replicates; p values were determined with paired t tests. ( c ) Representative immunofluorescence images (left) and quantifications (right) of the relative fluorescence intensity of phosphorylated Hec1 analyzed with a phospho-specific antibody to Ser55. Each data point represents individual kinetochore intensities of Hec1 pSer55 antibody ratioed to Hec1 antibody. Data points on graphs are grouped from three experimental replicates and colored according to each replicate with median and 95% confidence intervals displayed in black. p-Values were determined by an unpaired Mann-Whitney test. All scale bars are 5 um. Figure 6--figure supplement 1. Formation of bipolar or monopolar spindles in STLC washout experiments. ( a ) Cells under all experimental conditions in Figure 4 were quantified for the fraction of mitotic cells with aligned
- Submitted by
- Invitrogen Antibodies (provider)
- Main image
- Experimental details
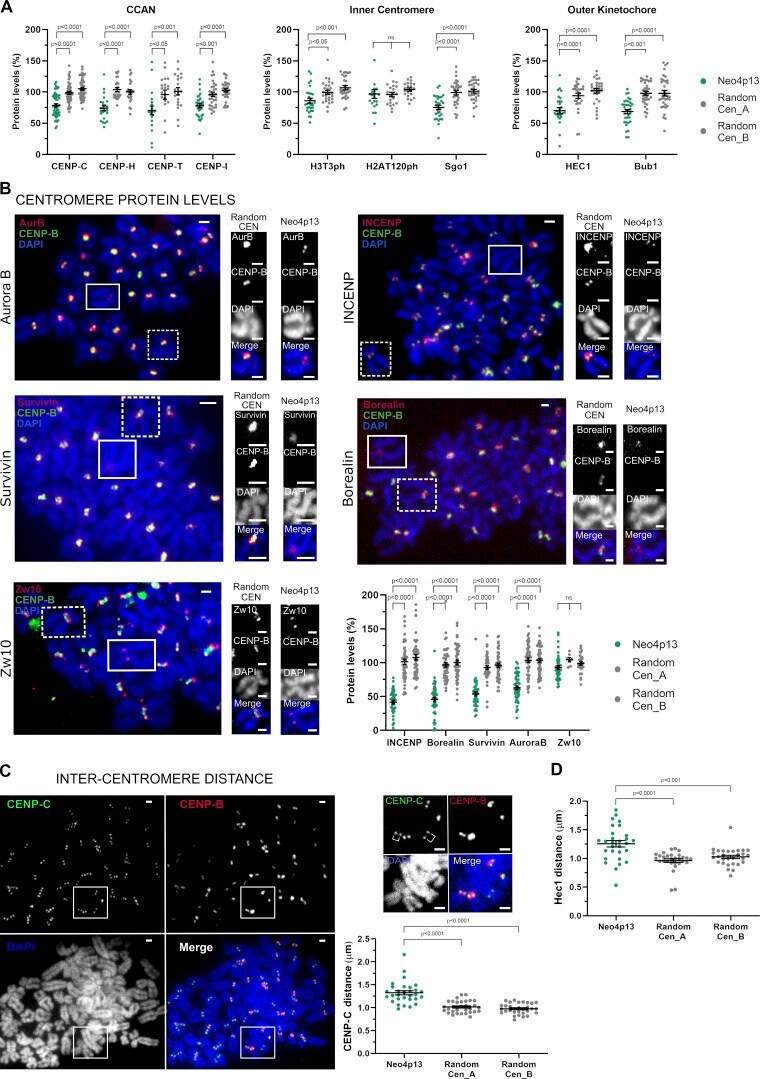
- Figure 2. Experimentally induced human neocentromere shows inner-centromere defects. (A) Centromeric protein levels in the neocentromere (Neo4p13) compared with random endogenous centromeres. Quantification of mitotic spreads coimmunostained for indicated proteins and CENP-B. Mean and SEM of five ( n = 50 spreads, for CENP-C) or three ( n = 21-34 spreads, for all other proteins) independent experiments. P values based on one-way ANOVA with Tukey's multiple comparison test. (B) CPC protein levels at Neo4p13 compared with random endogenous centromeres (Random CEN). Representative mitotic spreads coimmunostained for indicated CPC proteins and CENP-B. Zw10 outer kinetochore protein is included as a comparison to an unchanged reference protein. Insets show Neo4p13 and a random centromere equally scaled for visual comparison. Scale bars, 2 um. Mean and SEM of five independent experiments ( n = 45-52 spreads) analyzed as in A. (C) Intercentromere distance measured by coimmunostaining mitotic spreads for CENP-C and CENP-B. Quantification of distance (in micrometers) between the peak intensities of each CENP-C dot pair in one plane compared with equivalent pairs of random centromeres. Mean and SEM ( n = 30 spreads) of three independent experiments. Scale bars, 2 um. P values determined as in A. (D) Intercentromere distance based on Hec1 staining measured and analyzed as in C. Mean and SEM ( n = 29 spreads) of three independent experiments.
- Submitted by
- Invitrogen Antibodies (provider)
- Main image
- Experimental details
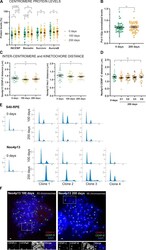
- Figure S3. The neocentromere adapts by accumulating INCENP and Borealin. (A) CPC component protein levels at Neo4p13 at indicated times points (0, 100, and 200 d of continuous culture) measured as in Fig. 2 A . Mean and SEM of five independent experiments ( n = 47-54 spreads). P values are based on one-way ANOVA with Tukey's multiple comparison test. (B) Pol II S2p levels at Neo4p13 at 0 and 200 d of continuous culture measured as in Fig. 3 E . Mean and SEM of five independent experiments ( n = 50 spreads). P values were determined as in A. (C) Intercentromere and inter-kinetochore distance at Neo4p13 at indicated time points based on CENP-C and Hec1 immunostaining measured as in Fig. 2 C . Mean and SEM of three independent experiments ( n = 20-32 spreads; P values are indicated in the figure, determined as in A). (D) Intercentromere distance based on CENP-C of different clones of Neo4p13 (C1-C4, four independent clones) after 200 d in continuous culture measured as in Fig. 2 C . Mean and SEM of three independent experiments ( n = 27-30 spreads). P values are defined as in A. (E) Cell cycle profiles determined by flow cytometry using PI DNA staining of S40-RPE and Neo4p13 at 0, 100, and 200 d of continuous culture. Three independent populations for S40-RPE and four for Neo4p13 subjected to long-term culture experiments are shown. (F) Representative spreads of polyploid cells of Neo4p13 cell line after 100 or 200 d in continuous culture, stained for indicated proteins and DNA
- Submitted by
- Invitrogen Antibodies (provider)
- Main image
- Experimental details
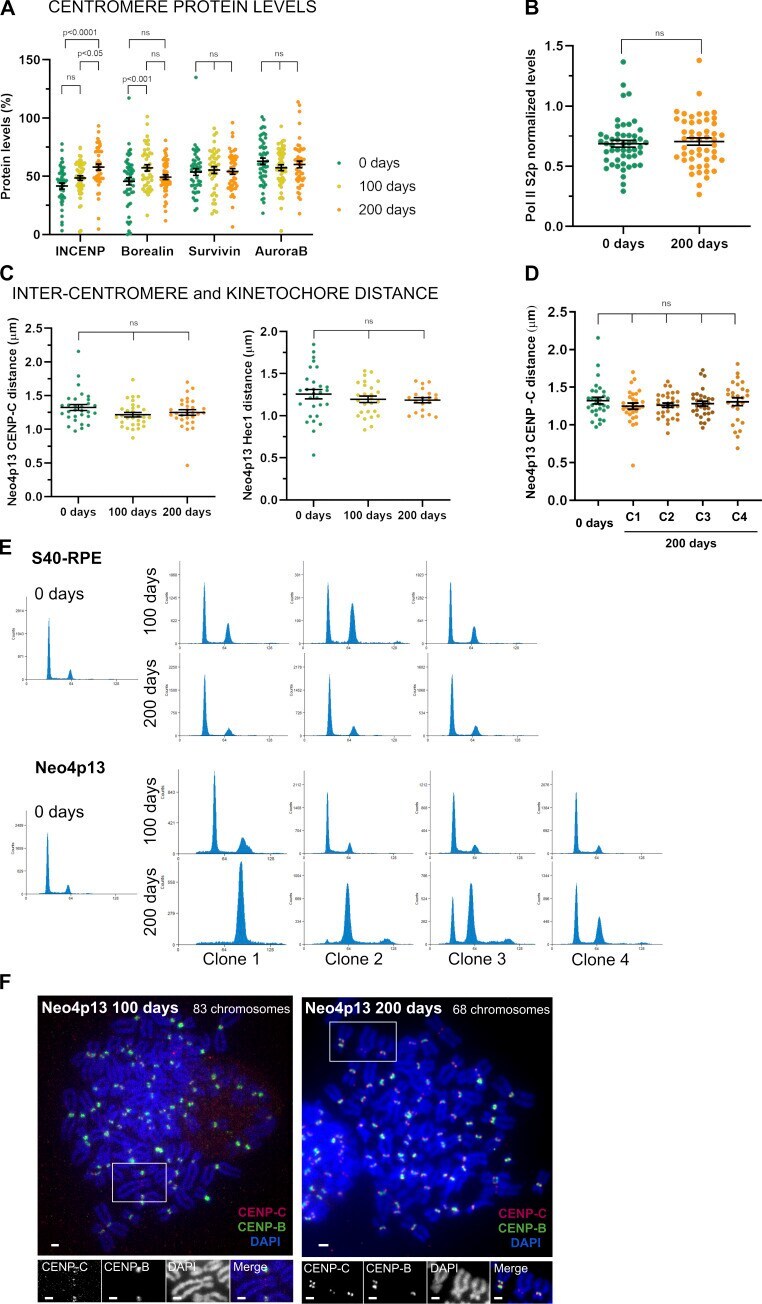
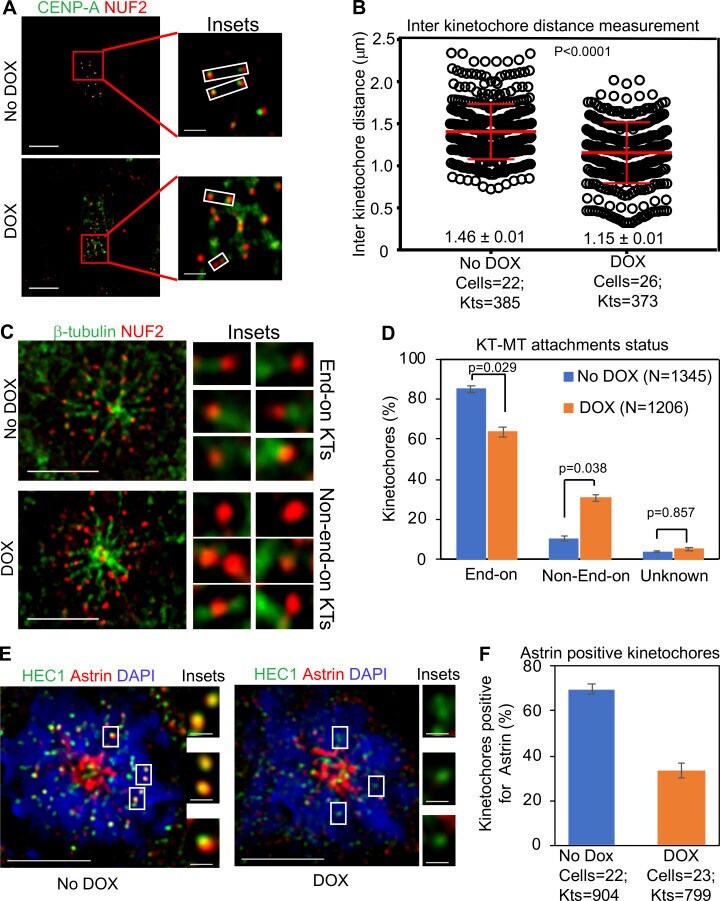
- Figure 4. CENP-A OE weakens the strength of kinetochores and contributes to reduced stable end-on attachment between kinetochores and microtubules. (A) Reduced interkinetochore distance in DLD1 cells due to weakening of native kinetochores in DLD1 cells overexpressing CENP-A. Images show interkinetochore distance in DLD1 CENP-A cells with or without DOX treatment. Prior to immunostaining, cells were treated with 10 uM MG132 for 90 min. Cell were immunostained with antibodies against CENP-A and NUF2, stained with DAPI, and analyzed for interkinetochore distance as determined by the distance between two NUF2 signals in a pair of chromatids. Insets correspond to red-boxed areas in main images. White-boxed areas in insets show examples for kinetochore pairs included in the analysis. Scale bar: 5 um. (B) Prism graph for quantification of interkinetochore distance in DLD1 CENP-A cells with or without DOX treatment. Red horizontal lines represent mean interkinetochore distance. Error bars represent SD across kinetochores measured in the indicated number of cells from three independent experiments. P values were calculated by using the Mann-Whitney U test. (C) Reduced levels of stable end-on attached kinetochores in DLD1 cells overexpressing CENP-A. Images show KT-MT attachments status in DLD1 CENP-A cells with or without DOX treatment. Prior to fixation with ice-cold methanol for 1 min, cells were treated with 10 uM monastrol (3 h) and 10 uM MG132 (90 min), followed by exposure to c
- Submitted by
- Invitrogen Antibodies (provider)
- Main image
- Experimental details
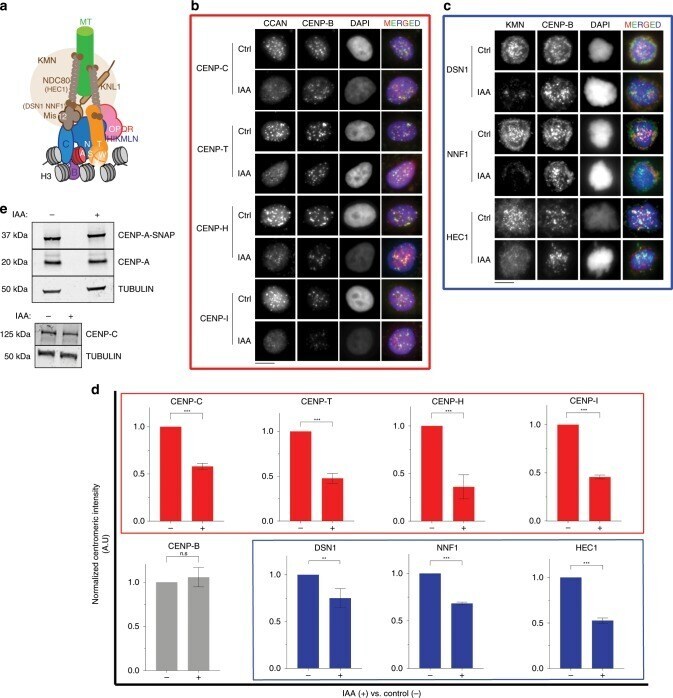
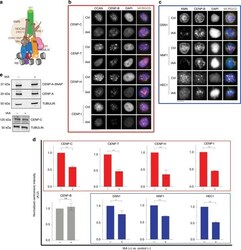
- Fig. 5 SENP6 is required for maintaining the integrity of the CCAN independent of proteolysis. a Schematic representing the architecture and interactions of different protein complexes in the human centromere and kinetochore. b Centromeric levels of different CCAN proteins following auxin-mediated depletion of SENP6 (24 h). Cells were counterstained with CENP-B to mark centromeres. Bars, 10 um. c Centromeric levels of KMN (KNL1-MIS12-NDC80) members following auxin-mediated depletion of SENP6. Bars, 10 um. d Automated centromere recognition and quantification of b and c . Fluorescence intensities of indicated proteins were normalized to the mean of the control 'no auxin' condition in each experiment and plotted as a bar graph for auxin treated '+' or no auxin '-' condition. Three replicate experiments were performed. Bars represent SEM. Parametric two-tailed Student's t test were performed to calculate statistical significance. ** p < 0.01, *** p < 0.001. e Immunoblot showing the total levels of CENP-A and CENP-C proteins following 48 h treatment with auxin to deplete AID-SENP6. Extracts from control '-' or auxin treated '+' cells were separated by SDS-PAGE and immunoblotted with anti-CENP-A (detecting both SNAP tagged and endogenous CENP-A) or anti-CENP-C antibody. Tubulin was used as loading control. Source data are provided as a Source Data file.