 Explore
 Validate
 Learn
Learn Western blot
 Immunocytochemistry
Antibody data
- Antibody Data
- Antigen structure
- References [1]
- Comments [0]
- Validations
- Immunocytochemistry [2]
- Other assay [2]
Submit
Validation data
Reference
Comment
Report error
- Product number
- PA5-28150 - Provider product page

- Provider
- Invitrogen Antibodies
- Product name
- PDCD4 Polyclonal Antibody
- Antibody type
- Polyclonal
- Antigen
- Recombinant protein fragment
- Description
- Recommended positive controls: A431, HeLa, Mouse heart. Predicted reactivity: Mouse (97%), Rat (96%), Chicken (87%), Rhesus Monkey (98%), Bovine (97%). Store product as a concentrated solution. Centrifuge briefly prior to opening the vial.
- Reactivity
- Human, Mouse
- Host
- Rabbit
- Isotype
- IgG
- Vial size
- 100 µL
- Concentration
- 1 mg/mL
- Storage
- Store at 4°C short term. For long term storage, store at -20°C, avoiding freeze/thaw cycles.
Submitted references BPA Decreases PDCD4 in Bovine Granulosa Cells Independently of miR-21 Inhibition.
Sabry R, Williams M, Werry N, LaMarre J, Favetta LA
International journal of molecular sciences 2022 Jul 27;23(15)
International journal of molecular sciences 2022 Jul 27;23(15)
No comments: Submit comment
Supportive validation
- Submitted by
- Invitrogen Antibodies (provider)
- Main image

- Experimental details
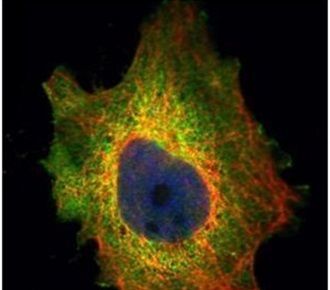
- Immunofluorescent analysis of PDCD4 in paraformaldehyde-fixed HeLa cells using a PDCD4 polyclonal antibody (Product # PA5-28150) (Green) at a 1:500 dilution. Alpha-tubulin filaments were labeled with Product # PA5-29281 (Red) at a 1:2000.
- Submitted by
- Invitrogen Antibodies (provider)
- Main image
- Experimental details
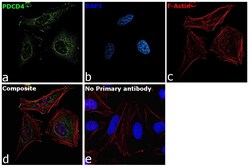
- Immunofluorescence analysis of Programmed cell death protein 4 was performed using 70% confluent log phase HeLa cells. The cells were fixed with 4% paraformaldehyde for 15 minutes, permeabilized with 0.1% Triton™ X-100 for 15 minutes, and blocked with 2% BSA for 45 minutes at room temperature. The cells were labeled with PDCD4 Polyclonal Antibody (Product # PA5-28150) at 1:200 dilution in 0.1% BSA, incubated at 4 degree celsius overnight and then labeled with Donkey anti-Rabbit IgG (H+L) Highly Cross-Adsorbed Secondary Antibody, Alexa Fluor Plus 488 (Product # A32790), (1:2000 dilution), for 45 minutes at room temperature (Panel a: Green). Nuclei (Panel b:Blue) were stained with ProLong™ Diamond Antifade Mountant with DAPI (Product # P36962). F-actin (Panel c: Red) was stained with Rhodamine Phalloidin (Product # R415, 1:300 dilution). Panel d represents the merged image showing nuclear and cytoplasmic localization. Panel e represents control cells with no primary antibody to assess background. The images were captured at 60X magnification.

Supportive validation
- Submitted by
- Invitrogen Antibodies (provider)
- Main image

- Experimental details
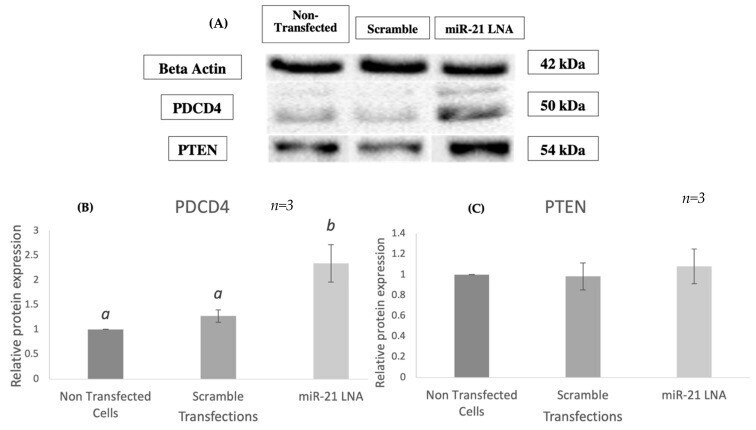
- Relative protein expression of PDCD4 & PTEN after miR-21 inhibition . Western blots ( A ) and graphical representations of PDCD4 ( B ) and PTEN ( C ) revealed that miR-21 inhibition significantly increased PDCD4 protein levels but did not affect PTEN. Transfections were done with LNA inhibitor probes at 0.5 muM for 12 h. Densitometric analysis was performed relative to the loading control, beta-actin. PTEN representation contains lane rearrangement; full original PTEN blot is included in the Supplementary File (Figure S4) . Different letters indicate significant differences, with b indicating a significantly different mean than a at p < 0.005. Bars represent the mean +- SEM.
- Submitted by
- Invitrogen Antibodies (provider)
- Main image
- Experimental details
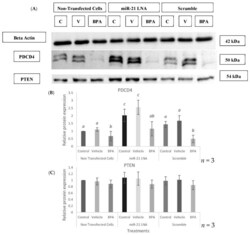
- Relative protein expression of PDCD4 & PTEN after miR-21 inhibition and BPA treatment . Western blots ( A ) and graphical representations of PDCD4 ( B ) and PTEN ( C ) revealed that BPA decreased PDCD4 protein, but miR-21 LNA treatment increased it. Neither BPA nor miR-21 LNA treatment affected PTEN protein. Transfections were done with LNA inhibitor probes at 0.5 muM for 12 h followed by BPA treatment for another 12 h. Densitometric analysis was performed relative to the loading control, B-actin. Different letters indicate significant differences, with b indicating a significantly different mean than a at p < 0.05 and c indicating a significantly different mean than a and b at p < 0.05. ab indicates no differences between a or b . Bars represent the mean +- SEM.
