 Explore
 Validate
 Learn
Learn Western blot
 Immunohistochemistry
Antibody data
- Antibody Data
- Antigen structure
- References [22]
- Comments [0]
- Validations
- Immunohistochemistry [2]
- Other assay [13]
Submit
Validation data
Reference
Comment
Report error
- Product number
- 14-5959-80 - Provider product page

- Provider
- Invitrogen Antibodies
- Product name
- AID Monoclonal Antibody (mAID-2), eBioscience™
- Antibody type
- Monoclonal
- Antigen
- Other
- Description
- Description: The monoclonal mAID-2 recognizes human and mouse AID (gene AICDA) also known as Activation-Induced Cytidine Deaminase. AID is a 24 kDa RNA-editing enzyme that converts cytosine into uracil. It plays a critical role during B cell development, specifically in somatic hypermutation (SHM) and immunoglobulin class switch recombination (CSR). Changes in levels of AID expression typically present with disease. For example, mutations in AID are found in Hyper-IgM Syndrome (type 2), a disease form without opportunistic infections, while overexpression correlates with poor prognosis in chronic lymphocytic leukemia/small lymphocytic lymphoma. AID is expressed mainly by activated mature B cells such as mature germinal centre (GC) B cells but also in intermediate GC cells (defined as IgD+CD38-CD23-CD71+). In addition to hematopoietic cells, AID is expressed in primary human hepatocellular carcinomas, helicobacter infected gastric epithelial cells, oocytes and embryonic stem cells although it role in these cells is not well understood. Because AID contains an NLS (nuclear localization signal), expression can be found both in the nucleus as well as in the cytoplasm. Applications Reported: This mAID-2 antibody has been reported for use in immunoblotting (WB), immunohistologic staining of frozen tissue sections, and immunohistochemical staining of formalin-fixed paraffin embedded tissue sections. Applications Tested: This mAID-2 antibody has been tested by western blot and/or immunohistochemistry on FFPE sections using either low or high pH antigen retrieval. This can be used at less than or equal to 20 µg/mL. It is recommended that the antibody be carefully titrated for optimal performance in the assay of interest. Purity: Greater than 90%, as determined by SDS-PAGE. Aggregation: Less than 10%, as determined by HPLC. Filtration: 0.2 µm post-manufacturing filtered.
- Reactivity
- Human, Mouse
- Host
- Rat
- Isotype
- IgG
- Antibody clone number
- mAID-2
- Vial size
- 25 μg
- Concentration
- 0.5 mg/mL
- Storage
- 4°C
Submitted references The 3'-flap endonuclease XPF-ERCC1 promotes alternative end joining and chromosomal translocation during B cell class switching.
Activation-induced cytidine deaminase is a possible regulator of cross-talk between oocytes and granulosa cells through GDF-9 and SCF feedback system.
ATR kinase activity promotes antibody class switch recombination in B cells through cell cycle regulation without suppressing DSB resection and microhomology usage.
Immunoglobulin Class Switch Recombination Is Initiated by Rare Cytosine Deamination Events at Switch Regions.
Interplay between UNG and AID governs intratumoral heterogeneity in mature B cell lymphoma.
Liver Is a Generative Site for the B Cell Response to Ehrlichia muris.
A licensing step links AID to transcription elongation for mutagenesis in B cells.
CCCTC-Binding Factor Locks Premature IgH Germline Transcription and Restrains Class Switch Recombination.
The cell cycle restricts activation-induced cytidine deaminase activity to early G1.
Phosphatidylinositol 3-kinase δ blockade increases genomic instability in B cells.
Epstein-Barr virus nuclear protein EBNA3C directly induces expression of AID and somatic mutations in B cells.
HSP90 inhibitors decrease AID levels and activity in mice and in human cells.
TGF-β suppression of HBV RNA through AID-dependent recruitment of an RNA exosome complex.
Generation and characterization of induced pluripotent stem cells from Aid-deficient mice.
The transcription factor Foxp1 is a critical negative regulator of the differentiation of follicular helper T cells.
BCL6 positively regulates AID and germinal center gene expression via repression of miR-155.
Preferential generation of follicular B helper T cells from Foxp3+ T cells in gut Peyer's patches.
Requirement for lymphoid tissue-inducer cells in isolated follicle formation and T cell-independent immunoglobulin A generation in the gut.
A novel human B cell subpopulation representing the initial germinal center population to express AID.
AID: how does it aid antibody diversity?
Constitutive expression of AID leads to tumorigenesis.
Specific expression of activation-induced cytidine deaminase (AID), a novel member of the RNA-editing deaminase family in germinal center B cells.
Bai W, Zhu G, Xu J, Chen P, Meng F, Xue H, Chen C, Dong J
Cell reports 2021 Sep 28;36(13):109756
Cell reports 2021 Sep 28;36(13):109756
Activation-induced cytidine deaminase is a possible regulator of cross-talk between oocytes and granulosa cells through GDF-9 and SCF feedback system.
Iizuka T, Wakae K, Ono M, Suzuki T, Mizumoto Y, Kitamura K, Horike SI, Muramatsu M, Fujiwara H
Scientific reports 2021 Feb 15;11(1):3833
Scientific reports 2021 Feb 15;11(1):3833
ATR kinase activity promotes antibody class switch recombination in B cells through cell cycle regulation without suppressing DSB resection and microhomology usage.
Sun X, Liu M, Bai J, Xu J, Zhu C, Dong J, Chen C
Journal of leukocyte biology 2021 Dec;110(6):1101-1112
Journal of leukocyte biology 2021 Dec;110(6):1101-1112
Immunoglobulin Class Switch Recombination Is Initiated by Rare Cytosine Deamination Events at Switch Regions.
Kim A, Han L, Yu K
Molecular and cellular biology 2020 Jul 29;40(16)
Molecular and cellular biology 2020 Jul 29;40(16)
Interplay between UNG and AID governs intratumoral heterogeneity in mature B cell lymphoma.
Delgado P, Álvarez-Prado ÁF, Marina-Zárate E, Sernandez IV, Mur SM, de la Barrera J, Sanchez-Cabo F, Cañamero M, de Molina A, Belver L, de Yébenes VG, Ramiro AR
PLoS genetics 2020 Dec;16(12):e1008960
PLoS genetics 2020 Dec;16(12):e1008960
Liver Is a Generative Site for the B Cell Response to Ehrlichia muris.
Trivedi N, Weisel F, Smita S, Joachim S, Kader M, Radhakrishnan A, Clouser C, Rosenfeld AM, Chikina M, Vigneault F, Hershberg U, Ismail N, Shlomchik MJ
Immunity 2019 Dec 17;51(6):1088-1101.e5
Immunity 2019 Dec 17;51(6):1088-1101.e5
A licensing step links AID to transcription elongation for mutagenesis in B cells.
Methot SP, Litzler LC, Subramani PG, Eranki AK, Fifield H, Patenaude AM, Gilmore JC, Santiago GE, Bagci H, Côté JF, Larijani M, Verdun RE, Di Noia JM
Nature communications 2018 Mar 28;9(1):1248
Nature communications 2018 Mar 28;9(1):1248
CCCTC-Binding Factor Locks Premature IgH Germline Transcription and Restrains Class Switch Recombination.
Marina-Zárate E, Pérez-García A, Ramiro AR
Frontiers in immunology 2017;8:1076
Frontiers in immunology 2017;8:1076
The cell cycle restricts activation-induced cytidine deaminase activity to early G1.
Wang Q, Kieffer-Kwon KR, Oliveira TY, Mayer CT, Yao K, Pai J, Cao Z, Dose M, Casellas R, Jankovic M, Nussenzweig MC, Robbiani DF
The Journal of experimental medicine 2017 Jan;214(1):49-58
The Journal of experimental medicine 2017 Jan;214(1):49-58
Phosphatidylinositol 3-kinase δ blockade increases genomic instability in B cells.
Compagno M, Wang Q, Pighi C, Cheong TC, Meng FL, Poggio T, Yeap LS, Karaca E, Blasco RB, Langellotto F, Ambrogio C, Voena C, Wiestner A, Kasar SN, Brown JR, Sun J, Wu CJ, Gostissa M, Alt FW, Chiarle R
Nature 2017 Feb 23;542(7642):489-493
Nature 2017 Feb 23;542(7642):489-493
Epstein-Barr virus nuclear protein EBNA3C directly induces expression of AID and somatic mutations in B cells.
Kalchschmidt JS, Bashford-Rogers R, Paschos K, Gillman AC, Styles CT, Kellam P, Allday MJ
The Journal of experimental medicine 2016 May 30;213(6):921-8
The Journal of experimental medicine 2016 May 30;213(6):921-8
HSP90 inhibitors decrease AID levels and activity in mice and in human cells.
Montamat-Sicotte D, Litzler LC, Abreu C, Safavi S, Zahn A, Orthwein A, Müschen M, Oppezzo P, Muñoz DP, Di Noia JM
European journal of immunology 2015 Aug;45(8):2365-76
European journal of immunology 2015 Aug;45(8):2365-76
TGF-β suppression of HBV RNA through AID-dependent recruitment of an RNA exosome complex.
Liang G, Liu G, Kitamura K, Wang Z, Chowdhury S, Monjurul AM, Wakae K, Koura M, Shimadu M, Kinoshita K, Muramatsu M
PLoS pathogens 2015 Apr;11(4):e1004780
PLoS pathogens 2015 Apr;11(4):e1004780
Generation and characterization of induced pluripotent stem cells from Aid-deficient mice.
Shimamoto R, Amano N, Ichisaka T, Watanabe A, Yamanaka S, Okita K
PloS one 2014;9(4):e94735
PloS one 2014;9(4):e94735
The transcription factor Foxp1 is a critical negative regulator of the differentiation of follicular helper T cells.
Wang H, Geng J, Wen X, Bi E, Kossenkov AV, Wolf AI, Tas J, Choi YS, Takata H, Day TJ, Chang LY, Sprout SL, Becker EK, Willen J, Tian L, Wang X, Xiao C, Jiang P, Crotty S, Victora GD, Showe LC, Tucker HO, Erikson J, Hu H
Nature immunology 2014 Jul;15(7):667-75
Nature immunology 2014 Jul;15(7):667-75
BCL6 positively regulates AID and germinal center gene expression via repression of miR-155.
Basso K, Schneider C, Shen Q, Holmes AB, Setty M, Leslie C, Dalla-Favera R
The Journal of experimental medicine 2012 Dec 17;209(13):2455-65
The Journal of experimental medicine 2012 Dec 17;209(13):2455-65
Preferential generation of follicular B helper T cells from Foxp3+ T cells in gut Peyer's patches.
Tsuji M, Komatsu N, Kawamoto S, Suzuki K, Kanagawa O, Honjo T, Hori S, Fagarasan S
Science (New York, N.Y.) 2009 Mar 13;323(5920):1488-92
Science (New York, N.Y.) 2009 Mar 13;323(5920):1488-92
Requirement for lymphoid tissue-inducer cells in isolated follicle formation and T cell-independent immunoglobulin A generation in the gut.
Tsuji M, Suzuki K, Kitamura H, Maruya M, Kinoshita K, Ivanov II, Itoh K, Littman DR, Fagarasan S
Immunity 2008 Aug 15;29(2):261-71
Immunity 2008 Aug 15;29(2):261-71
A novel human B cell subpopulation representing the initial germinal center population to express AID.
Kolar GR, Mehta D, Pelayo R, Capra JD
Blood 2007 Mar 15;109(6):2545-52
Blood 2007 Mar 15;109(6):2545-52
AID: how does it aid antibody diversity?
Honjo T, Muramatsu M, Fagarasan S
Immunity 2004 Jun;20(6):659-68
Immunity 2004 Jun;20(6):659-68
Constitutive expression of AID leads to tumorigenesis.
Okazaki IM, Hiai H, Kakazu N, Yamada S, Muramatsu M, Kinoshita K, Honjo T
The Journal of experimental medicine 2003 May 5;197(9):1173-81
The Journal of experimental medicine 2003 May 5;197(9):1173-81
Specific expression of activation-induced cytidine deaminase (AID), a novel member of the RNA-editing deaminase family in germinal center B cells.
Muramatsu M, Sankaranand VS, Anant S, Sugai M, Kinoshita K, Davidson NO, Honjo T
The Journal of biological chemistry 1999 Jun 25;274(26):18470-6
The Journal of biological chemistry 1999 Jun 25;274(26):18470-6
No comments: Submit comment
Supportive validation
- Submitted by
- Invitrogen Antibodies (provider)
- Main image
- Experimental details
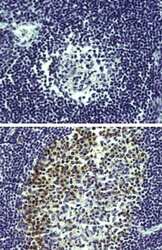
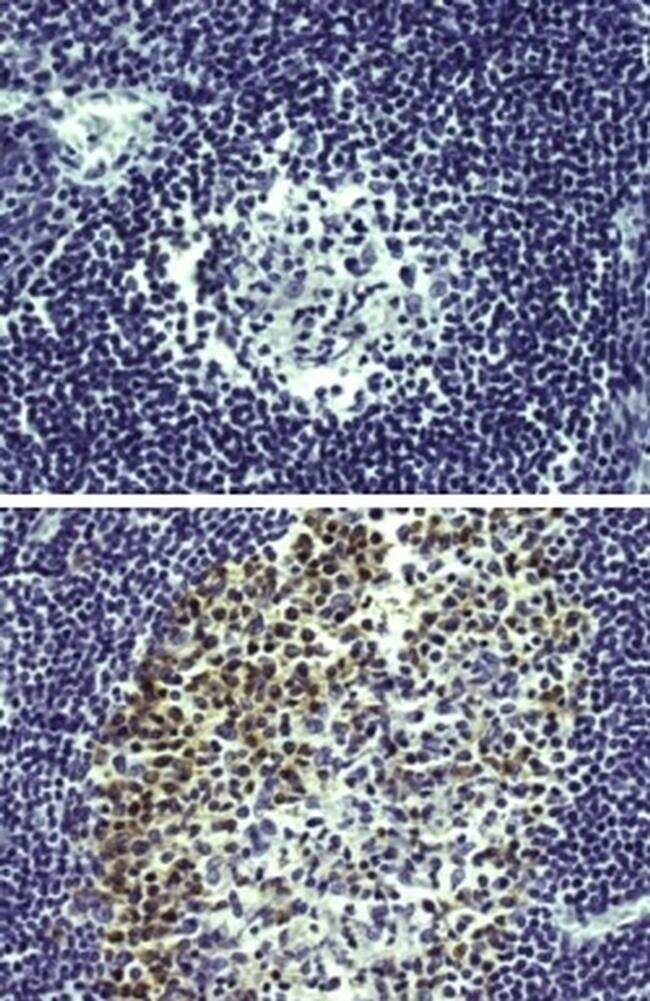
- Immunohistochemistry of formalin-fixed paraffin embedded human tonsil using low pH antigen retrieval and 20 µg/mL of Rat IgG2a K Isotype Control Purified (Product # 14-4321-82) (top) or 20 µg/mL Anti-Human/Mouse AID (bottom) followed by Anti-Rat Biotin and DAB visualization.Nuclei are counterstained with hematoxylin.
- Submitted by
- Invitrogen Antibodies (provider)
- Main image
- Experimental details
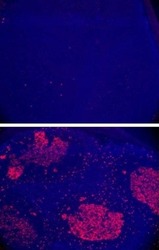
- Immunofluorescent staining of AID knock-out (top) or wild type (bottom) mouse intestinal Peyer's patches with Anti-Human/Mouse AID.Data courtesy of Fagarasan and Honjo Labs.

Supportive validation
- Submitted by
- Invitrogen Antibodies (provider)
- Main image
- Experimental details
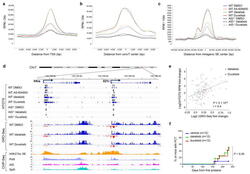
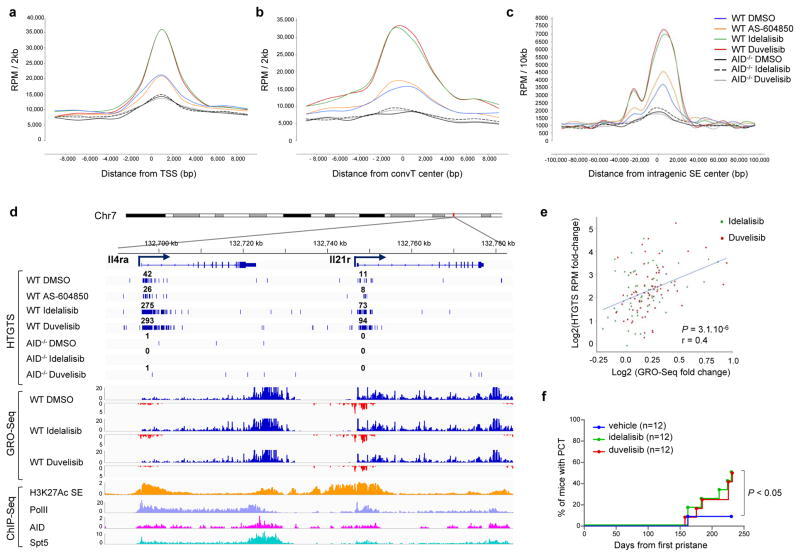
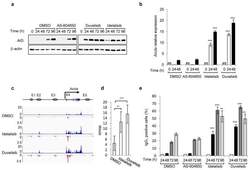
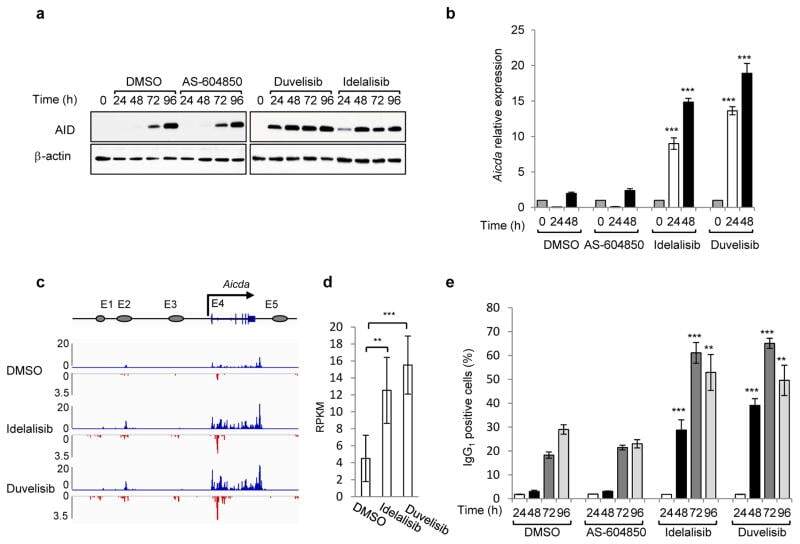
- Figure 3 Enhanced genomic instability in mouse B cells by PI3Kdelta blockade Genome-wide distribution of translocation junctions relative to transcription starting site (TSS) regions ( a ), convergent transcription (ConvT) regions ( b ) and intragenic super-enhancers (SEs) ( c ) in WT and AID -/- B cells treated with the indicated inhibitors. d , Detailed distribution of HTGTS junctions and GRO-Seq reads in representative gene examples. Numbers of translocation junctions in focal clusters are indicated in bold. Corresponding PolII, AID, Spt5 and H3K27Ac/SE ChIP-Seq profiles are shown. e , Fold change HTGTS junctions plotted against GRO-Seq transcription levels of AID targets in B cells treated with idelalisib or duvelisib over DMSO. Pearson's correlation coefficient; P value calculated by two-tailed F-test. f , Development of PC tumor in mice induced with pristane and treated with idelalisib or duvelisib is plotted over time (n = 12 for each group in 2 independent cohorts of 6 mice). P values calculated by Log-rank (Mantel-Cox) test.
- Submitted by
- Invitrogen Antibodies (provider)
- Main image
- Experimental details
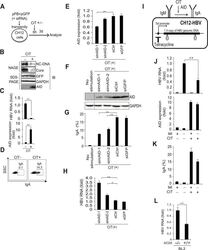
- Fig 3 IgA switching activity correlates with reduction of HBV transcripts in B cells. (A, B, C, D) pPB and GFP expression vectors were transiently co-transfected into a mouse B cell line (CH12F3-2). Six hours after transfection, cells were divided into two groups and stimulated with (or without) CD40 ligand, IL-4, and TGF-beta1 (CIT) for 3 days to induce IgA switching; (A) Schematic diagram of experimental design; (B) Nucleocapsid formation was measured using NAGE assays and GFP expression was used to confirm transfection. (C) HBV transcripts and AID expression levels were determined using qRT-PCR. (D) AID dependent IgA switching was determined using flow cytometry. (E, F, G, H) CH12F3-2 cells were co-transfected with pPB and the indicated siRNA against mouse AID (simAID-1 and -2) or controls (siCtrl and siGFP), and after 6 hours incubation, cells were further stimulated with CIT for 3 days. HBV transcript levels, knock down efficiency of AID, and IgA switching were determined using qRT-PCR, western blotting, and flow cytometry, respectively. (I, J, K) A tetracycline promoter-regulating HBV plasmid (pTre-HBV) was stably transfected into CH12F3-2 transfectants expressing tetracycline-responsible transactivator (Tet-off). Established CH12F3-2 transfectants were designated CH12-HBV; (I) Schematic diagram of CH12-HBV; (J) CH12-HBV cells were incubated in the presence or absence of CD40 ligand, IL-4, or TGF-beta1 (CIT) and tetracycline as indicated for 2 days to induce endogenous
- Submitted by
- Invitrogen Antibodies (provider)
- Main image
- Experimental details
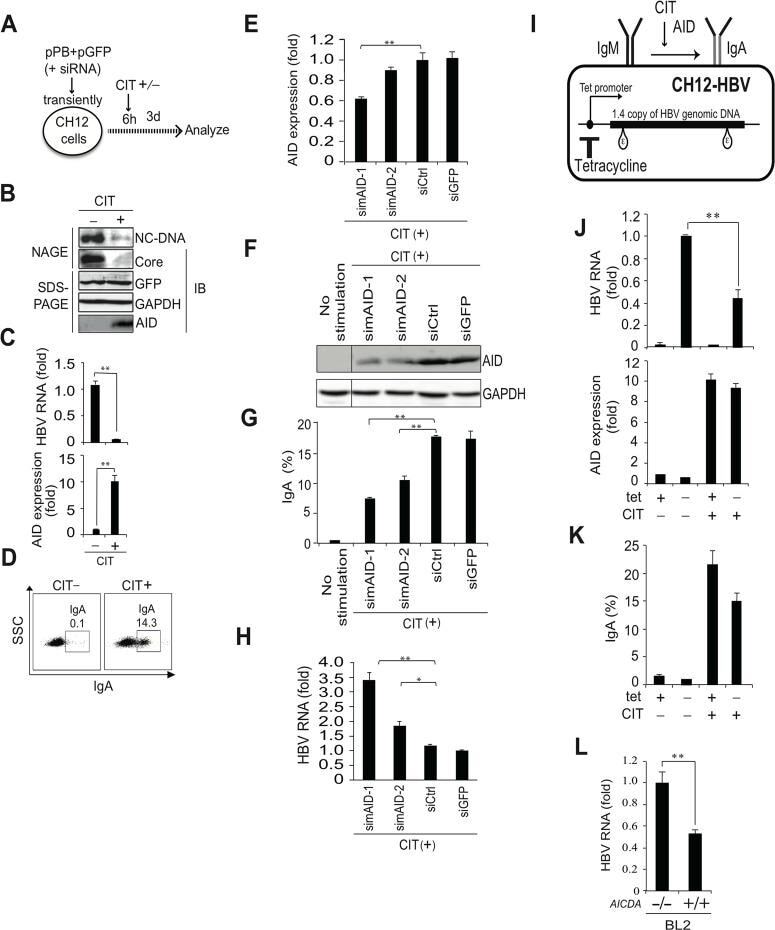
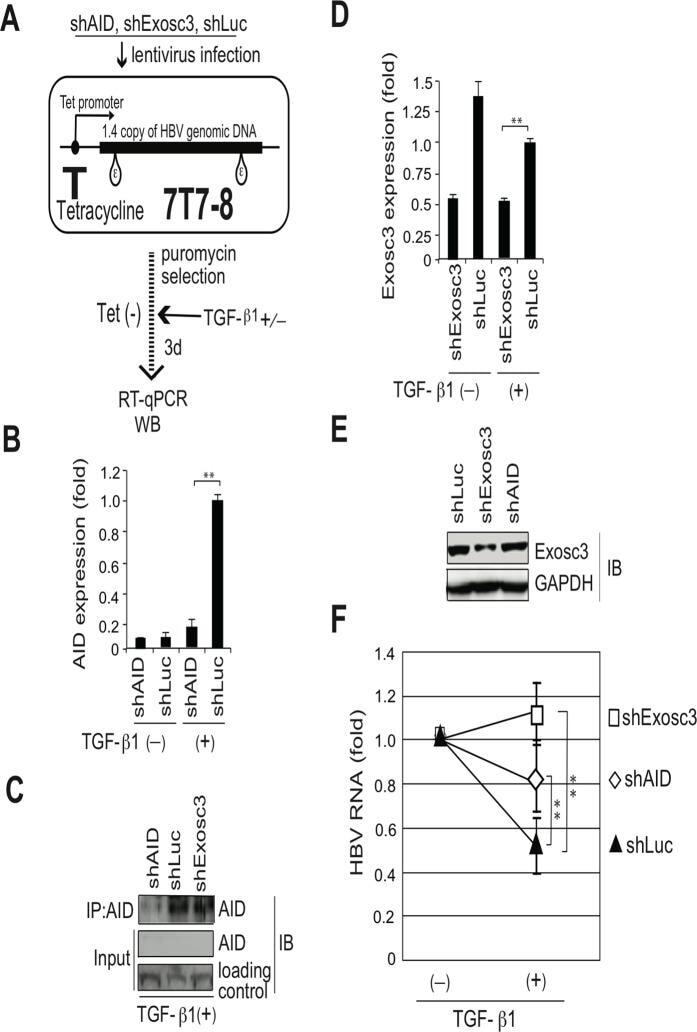
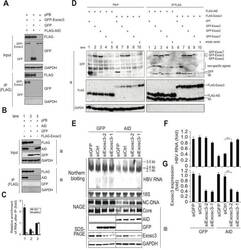
- Fig 7 TGF-beta1-mediated reduction of HBV transcripts depends on AID and Exosc3. Stable HBV transfectant Huh7 cells (7T7-8) were infected with recombinant lentiviruses to express indicated short hairpin (sh) RNA, and then cells were incubated in the presence or absence of 15 ng/ml TGF-beta1 for 3 days. (A) Schematic diagram of experimental design; (B) AID expression levels in qRT-PCR and (C) IP western blotting. Crude extract before IP was also blotted (input). Crude extracts from TGF-beta1-treated 7T7-8 transfectants were immunoprecipitated by anti-AID antibody. Loading control: anti-(adenosine deaminase acting on RNA) ADAR. (D) Exosc3 expression level in qRT-PCR or western blotting (E); shLuc was used as a control; (F) Reductions of HBV transcript levels following TGF-beta1 treatment are compared between shAID-, shExosc3-, and shLuc-expressing 7T7-8 cells. HBV transcript levels of each non-stimulated transfectant are defined as 1; shLuc was used as a non-targeted control. * P < 0.05, ** P < 0.01 ( t -test), error bars represent standard errors of the mean. Data are representative of two to three independent experiments.
- Submitted by
- Invitrogen Antibodies (provider)
- Main image
- Experimental details
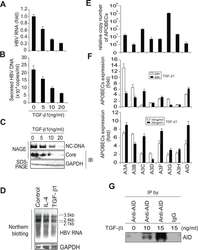
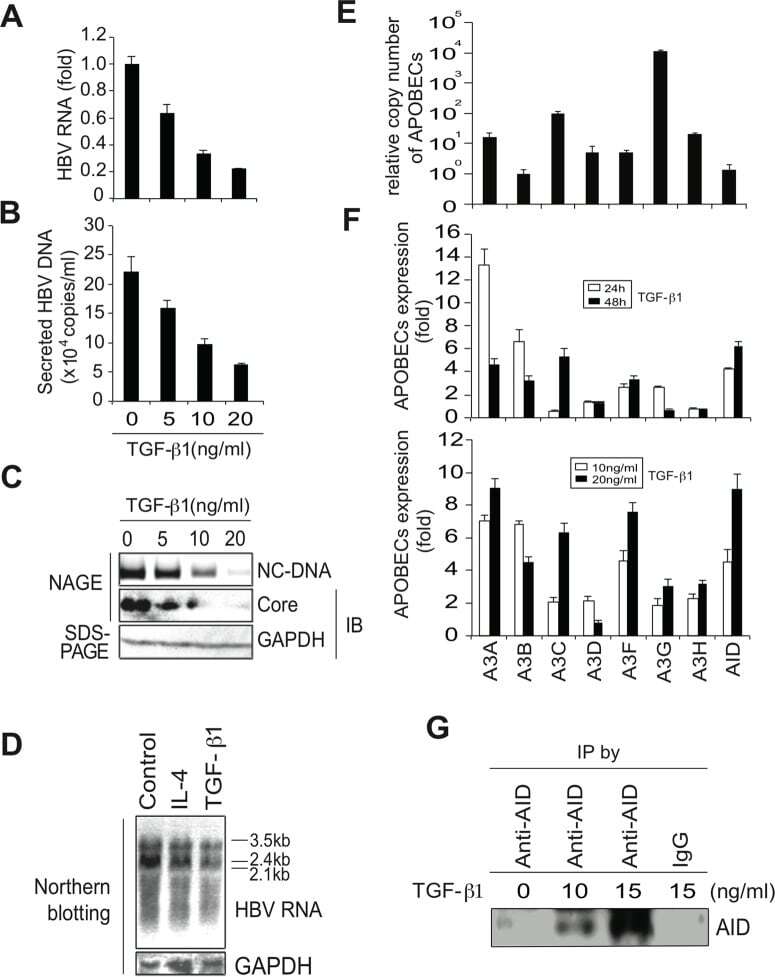
- Fig 1 TGF-beta1 upregulates APOBEC3 expression and suppresses HBV replication in Huh7 cells. Six hours after transfection of pPB, Huh7 cells were treated with TGF-beta1 for 3 days, and HBV replication was evaluated. (A) qRT-PCR shows dose-dependent reduction of HBV transcripts by TGF-beta1. (B) NC-DNA levels in secreted virions were also measured using qPCR. (C) Nucleocapsid NC-DNA and core protein levels in crude cytoplasmic extracts were assessed using NAGE assays. GAPDH protein levels in the same crude extracts were determined using western blotting. (D) Huh7 cells were treated with 150 ng/mL IL-4 or 10 ng/ml TGF-beta1 for 3 days. Levels of HBV RNA and GAPDH mRNA were determined by Northern blot. Control: non-stimulated Huh7 cells. (E) Relative expression levels of APOBEC deaminases in non-stimulated Huh7 cells; Relative expression levels were determined using qPCR with cDNA from non-stimulated Huh7 cells and standard curves of control APOBEC deaminase DNA. Relative copy numbers of A3B were defined as one. (F) Induction of APOBEC deaminase expression in TGF-beta1-treated Huh7 cells was estimated using qRT-PCR. Fold induction of APOBEC deaminases is shown in the top (10 ng/mL TGF-beta1 for 24 or 48 h) and bottom (10 or 20 ng/mL TGF-beta1 for 24 h) panels. (G) Huh7 cells were treated with indicated concentrations of TGF-beta1 for 3 days. AID protein was immunoprecipitated using an anti-AID antibody (or an isotype control IgG, most right) and immunoprecipitated AID protein wa
- Submitted by
- Invitrogen Antibodies (provider)
- Main image
- Experimental details
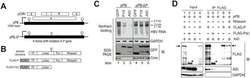
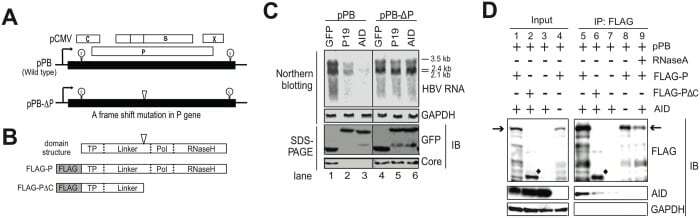
- Fig 4 Intact P protein is required for AID-mediated downregulation of HBV transcripts and AID associates with HBV P protein. (A) Schematic diagram of wild-type and mutant HBV replicon plasmids. Partially redundant HBV genomic DNA is shown as black boxes and the positions of 5'-epsilon and 3'-epsilon are shown. Open reading frames corresponding to C, P, S, and X genes are shown as open boxes. The position of the frame-shift mutation in the mutant replicon plasmid (pPB-DeltaP) is indicated as an open triangle. This frame-shift mutation results in loss of the C-terminal portion (polymerase and RNase H domains) from the P protein; pCMV, CMV promoter. (B) Schematic diagram of P protein domain structure; (C) Replicon plasmid (pPB or pPB-DeltaP) and GFP fusion expression vectors (mock, AID, and p19-mutant AID) were transfected into Huh7 cells, and after four days, AID-mediated downregulation of HBV transcripts was compared between two replicon plasmids or between wild-type and p19 mutant AID using northern blotting. Expression of HBV core and GFP fusion proteins (mock, AID, and p19-mutant AID) was confirmed using SDS-PAGE and western blotting. (D) Wild-type replicon plasmid (pPB) and indicated protein expression vectors (FLAG-P, FLAG-PDeltaC, or AID) were transfected into Huh7 cells. Three days later, physical associations between AID and FLAG-P (or FLAG-PDeltaC) proteins were determined using immunoprecipitation (IP). In lane 9, crude extract was incubated with RNase A be
- Submitted by
- Invitrogen Antibodies (provider)
- Main image
- Experimental details
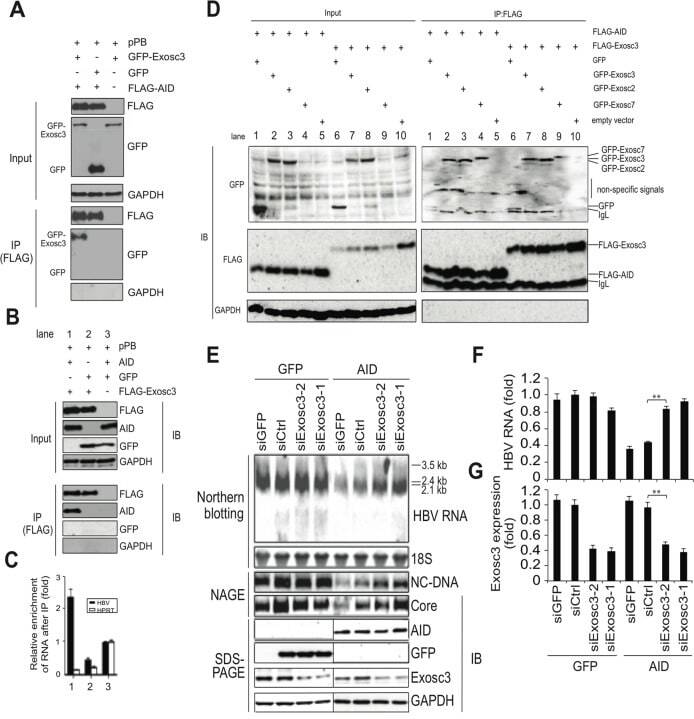
- Fig 5 AID inducing HBV RNA reduction depends on Exosc3. (A, B) Huh7 cells were co-transfected with pPB and the indicated protein expression vectors, and were cultured for 3 days. Crude extracts (input) were then subjected to IP using an anti-FLAG antibody, and crude extracts and IP fractions were analyzed using western blotting. (C) Fold enrichment of HBV or HPRT transcripts upon anti-FLAG-Exosc3 IP; To determine RNA coprecipitation with the RNA exosome component Exosc3, Huh7 cells were transfected with pPB, pFLAG-Exosc3, and pCMV-AID (or pEGFP-C2), and were cultivated for 3 days. IP using anti-FLAG antibody was then performed, complexes of FLAG-Exosc3 were then eluted using free FLAG peptides, and the eluted RNA was analyzed using qRT-PCR. Combination of expression vectors used for transfection is the same with B (see numbers below the graph), and values in lane 3 were defined as 1. Error bars represent standard errors of the mean. (D) Associations of AID with RNA exosome proteins; Huh7 cells were co-transfected with indicated expression vectors, and were cultured for 3 days. Crude extracts (input) were subjected to IP with FLAG antibody, and crude extracts and IP fractions were analyzed using western blotting. Expression levels of GFP-Exosc7 were too low to be visualized in the crude extract (lanes 4 and 9, input), but GFP-Exosc7 was clearly detectable after FLAG-AID and FLAG-Exosc3 immunoprecipitation (lanes 4 and 9, IP). (E) Huh7 cells were co-transfected with pPB and eit
- Submitted by
- Invitrogen Antibodies (provider)
- Main image
- Experimental details
- Figure 1 Phosphatidylinositol 3-Kinase (PI3K)delta blockade increases AID expression and CSR in activated mouse B cells a , Western blot for AID protein from B cells treated with the indicated inhibitors (1 muM) (n = 3 biological replicates). For gel source data, see Supplementary Figure 1 . b , Aicda mRNA levels were analyzed by qRT-PCR. Data are expressed as mean +- s.d. (n = 3 biological replicates).. ** P
- Submitted by
- Invitrogen Antibodies (provider)
- Main image

- Experimental details
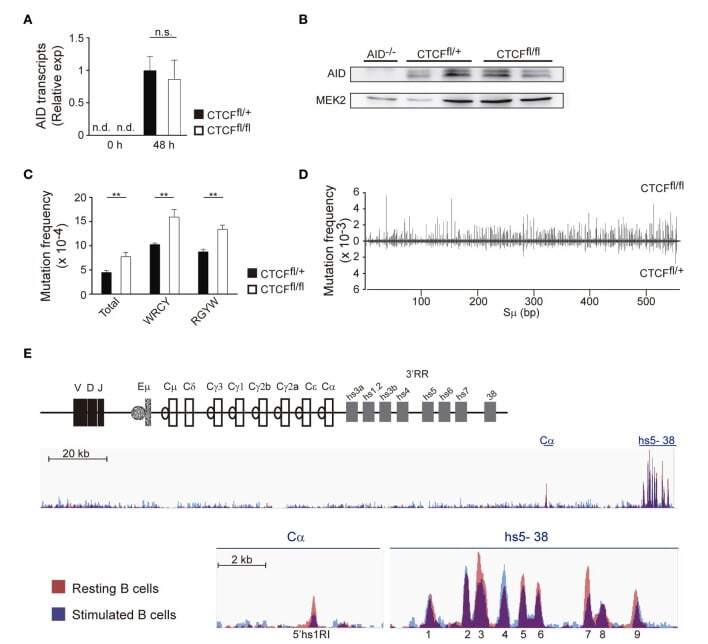
- Figure 4 CCCTC-binding factor (CTCF) deletion increases S region somatic mutation and germline transcription. (A) qRT-PCR analysis of activation-induced cytidine deaminase (AID) expression in spleen B cells from CTCF fl/+ ( n = 7) and CTCF fl/fl ( n = 6) mice 48 h after lipopolysaccharide (LPS) + IL-4 stimulation. (B) Western blot analysis of AID in B cells from AID -/- , CTCF fl/+ , and CTCF fl/fl mice after 48 h of LPS/IL-4 stimulation. Mek2 is shown as a loading control. (C) Analysis of AID mutagenic activity by next-generation sequencing ( 32 ). DNA was isolated from splenic B cells 48 h after LPS + IL-4 stimulation, amplified by PCR with specific primers and analyzed by next-generation sequencing. Graphs show total mutation frequency, mutation frequency at C or G in WR C Y/R G YW hotspot motif in CTCF fl/+ ( n = 3) and CTCF fl/fl ( n = 3) mice. p (total) = 0.0039; p (WRCY) = 0.0037; p (RGYW) = 0.0015. (D) Distribution of mutations along the sequenced Smu region in CTCF fl/+ ( n = 3) and CTCF fl/fl ( n = 3) mice. Mutation frequency at each position is shown. (E) CTCF-binding at the IgH locus in resting and stimulated B cells (data from GSE43594).
- Submitted by
- Invitrogen Antibodies (provider)
- Main image
- Experimental details
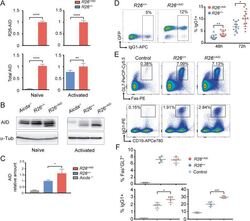
- 10.1371/journal.pgen.1008960.g001 Fig 1 Characterization of R26 +/AID Cd19 +/Cre mice. (A) Increased expression of Aicda mRNA in B cells from R26 +/AID Cd19 +/Cre mice. mRNA levels of R26-AID and total Aicda was measured by RT-qPCR in naive (left) and in LPS+IL4 activated B (right) cells from R26 +/AID Cd19 +/Cre (red bars) and R26 +/+ Cd19 +/Cre control mice (blue bars). Values are relative to levels in naive (left) or activated (right) B cells from R26 +/AID Cd19 +/Cre mice; mean of two experiments is shown; n = 6 per group. (B) Increased AID protein in B cells from R26 +/AID Cd19 +/Cre mice. Total lysates of naive or LPS+IL4 activated B cells from R26 +/AID Cd19 +/Cre and R26 +/+ Cd19 +/Cre mice were analysed by western blot with a monoclonal anti-AID antibody. Incubation with an anti-tubulin antibody is shown as loading control. (C) Quantification of AID protein in LPS+IL4 activated B cells by western blot. Total lysates of activated B cells from 4 individual mice of each genotype, R26 +/AID Cd19 +/Cre and R26 +/+ Cd19 +/Cre and 1 Aicda -/- were analyzed by western blot as shown in (B). Values are relative to R26 +/+ Cd19 +/Cre and normalized to actin or tubulin. (D) Increased CSR in R26 +/AID Cd19 +/Cre mice. Representative FACS analysis of CSR to IgG1 in LPS+IL4 activated B cells from R26 +/AID Cd19 +/Cre and R26 +/+ Cd19 +/Cre mice (left panel). Quantification is shown on the right. Each dot represents an individual mouse (n = 11 mice per group). (E) Increased immuniza

- Submitted by
- Invitrogen Antibodies (provider)
- Main image
- Experimental details
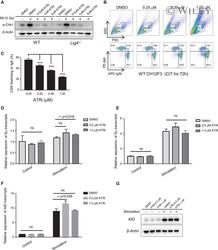
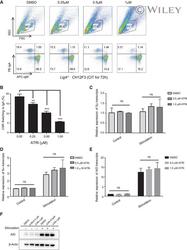
- 1 FIGURE ATR kinase activity is essential for c-NHEJ-mediated CSR (A) Western blot analysis of phospho-CHK1 in wild-type and Lig4 -deficient CH12F3 cells treated with 0, 0.5, 1, and 5 muM ATR inhibitor AZD6738 irradiated with 10 Gy. (B) Representative flow cytometry analysis of CSR to IgA in CH12F3 cells treated with AZD6738 at doses of 0, 0.25, 0.5, and 1 muM. CH12F3 cells were stimulated with anti-CD40/IL-4/TGF-beta for 72 h. (C) Efficiency of CSR to IgA in CH12F3 cells treated with AZD6738 at indicated doses. The bar graph was showed with 4 independent experiments. (D and E) qRT-PCR analysis of Imu-Cmu (D) and Ia-Ca (E) germline transcripts in unstimulated and stimulated CH12F3 cells treated with AZD6738 at 0, 0.5, and 1 muM for 24 h. The bar graph was showed with 3 independent replicate experiments. (F) qRT-PCR analysis of AID transcripts in unstimulated and stimulated CH12F3 cells treated with AZD6738 at 0, 0.5, and 1 muM for 24 h. The bar graph was showed with 3 independent replicate experiments. (G) Western blot analysis of AID expression in unstimulated and stimulated CH12F3 cells treated with AZD6738 at 0, 0.5, and 1 muMu for 24 h

- Submitted by
- Invitrogen Antibodies (provider)
- Main image
- Experimental details
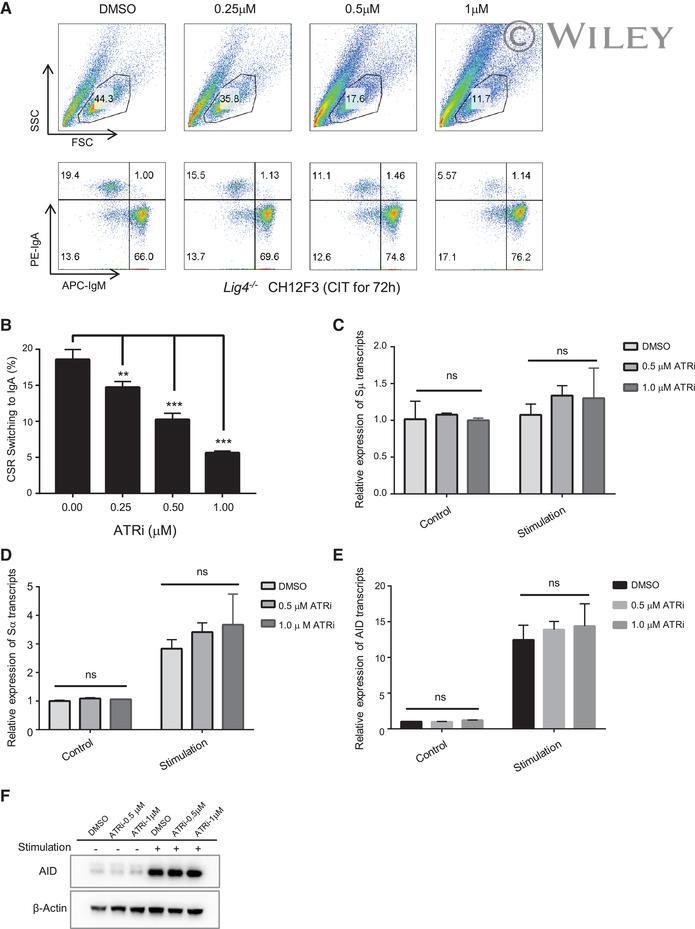
- 4 FIGURE ATR kinase inhibition impairs A-EJ-mediated CSR (A) Representative flow cytometry analysis of CSR to IgA in Lig4 -deficient CH12F3 cells treated with AZD6738 at doses of 0, 0.25, 0.5, and 1 muM.The cells were stimulated with anti-CD40/IL4-TGF-beta for 72 h. (B) Efficiency of CSR to IgA in Lig4 -deficient CH12F3 cells treated with AZD6738 at indicated doses. The bar graph was showed with at least 4 independent experiments. (C and D) qRT-PCR analysis of Imu-Cmu (C) and Ia-Ca (D) germline transcripts in unstimulated and stimulated Lig4 -deficient CH12F3 cells treated with AZD6738 at 0, 0.5, and 1 muM for 24 h. The bar graph was showed with 3 independent replicate experiments. (E) qRT-PCR analysis of AID transcripts in unstimulated and stimulated Lig4 -deficient CH12F3 cells treated with AZD6738 at 0, 0.5, and 1 muM for 24 h. The bar graph was showed with 3 independent replicate experiments. (F) Western blot analysis of AID expression in unstimulated and stimulated Lig4 -deficient CH12F3 cells treated with AZD6738 at 0, 0.5, and 1 muMu for 24 h
- Submitted by
- Invitrogen Antibodies (provider)
- Main image
- Experimental details
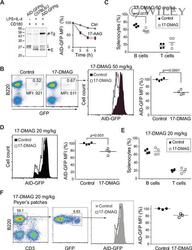
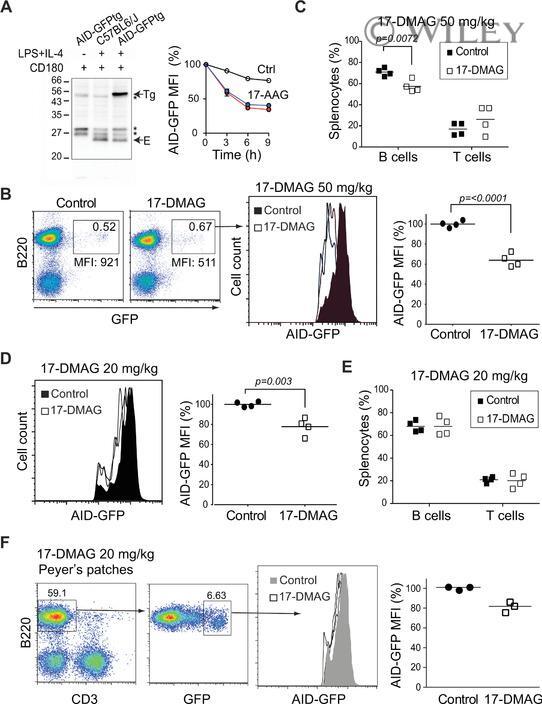
- HSP90 inhibition reduces AID levels in germinal center B cells. A. Left , Western blot probed with an anti-AID antibody recognizing both endogenous AID (E) and AID-GFP (Tg) in C57BL6/J or AID-GFPtg splenic B cells activated with anti-CD180, which induces proliferation, with and without IL-4 and LPS, which induce AID expression. Asterisks indicate nonspecific bands that serve as loading controls. One representative blot out of two experiments is shown. Right , Purified naive B cells from AID-GFPtg mice were stimulated with LPS + IL-4 and 48 h later (t0) treated with DMSO (Ctrl) or 2 muM (blue) or 8 muM (red) 17-AAG. The level of AID-GFP was determined by flow cytometry at various time points and plotted normalized to t0=100%. Means + SEM of two mice each from a single experiment are plotted. B. AID-GFPtg mice were treated with 50 mg/kg 17-DMAG or water twice a day for 2 days starting at day 3 postimmunization with 100 mug of NP-CGG and splenocytes analyzed at day 5 postimmunization. Left : One representative flow cytometry dot plot is shown. Middle , overlapping histograms of GFP MFI of B220 + GFP + cells. Right , MFI values normalized to the average MFI of control mice set as 100% for four mice from two independent experiments. Each dot represents one mouse, bars show means. C. The proportion of B and T cells in the spleen of the four mice from (B) was determined by flow cytometry. Each dot represents one mouse, bars show means. D. Splenic cells from AID-GFPtg mice that were
- Submitted by
- Invitrogen Antibodies (provider)
- Main image
- Experimental details
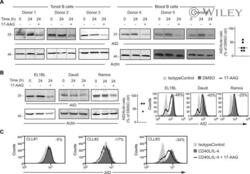
- Human AID is sensitive to HSP90 inhibition in normal and transformed B cells . A. Human B cells were purified from blood or tonsils, activated with IL-4 and sCD40L and 3 days later (t0) treated with 2 muM 17-AAG (+) or DMSO (-) for 24 h and analyzed by western blot using anti-AID and beta-actin as loading control. The experiment was performed with six different donors; one representative blot of each is shown. Right , AID to actin ratio in treated cells is plotted as % of the same ratio in the corresponding untreated sample, as determined by densitometry. B. BL cell lines EL1BL, Daudi and Ramos that constitutively express endogenous AID were treated with 8 muM 17-AAG for 24 h and AID levels analyzed by Western blot, as in (A) including densitometry of each sample ( Left ) or by intracellular staining and flow cytometry, with the reduction (%) in AID levels after treatment with 17-AAG indicated for each sample ( Right ). One representative out of two independent experiments is shown for each technique. C. AID levels were analyzed by intracellular staining and flow cytometry in PBMCs from three CLL patients activated with IL-4 and sCD40L and 3 days later treated with 8 muM 17-AAG or DMSO for 24 h. The reduction (%) in AID levels after treatment with 17-AAG indicated for each sample. One representative plot from each patient is shown.
