Explore
 Validate
 Learn
Learn Western blot
 Immunoprecipitation
 Flow cytometry
Antibody data
- Antibody Data
- Antigen structure
- References [1]
- Comments [0]
- Validations
- Flow cytometry [1]
- Other assay [2]
Submit
Validation data
Reference
Comment
Report error
- Product number
- MA5-24851 - Provider product page

- Provider
- Invitrogen Antibodies
- Product name
- MMP12 Recombinant Rabbit Monoclonal Antibody (1C11)
- Antibody type
- Monoclonal
- Antigen
- Synthetic peptide
- Description
- Recombinant rabbit monoclonal antibodies are produced using in vitro expression systems. The expression systems are developed by cloning in the specific antibody DNA sequences from immunoreactive rabbits. Then, individual clones are screened to select the best candidates for production. The advantages of using recombinant rabbit monoclonal antibodies include: better specificity and sensitivity, lot-to-lot consistency, animal origin-free formulations, and broader immunoreactivity to diverse targets due to larger rabbit immune repertoire.
- Reactivity
- Human, Rat, Hamster
- Host
- Rabbit
- Isotype
- IgG
- Antibody clone number
- 1C11
- Vial size
- 100 μL
- Concentration
- 1.0 mg/mL
- Storage
- Store at 4°C short term. For long term storage, store at -20°C, avoiding freeze/thaw cycles.
Submitted references MMP12 knockout prevents weight and muscle loss in tumor-bearing mice.
Jiang L, Yang M, He S, Li Z, Li H, Niu T, Xie D, Mei Y, He X, Wei L, Huang P, Huang M, Zhang R, Wang L, Li J
BMC cancer 2021 Dec 4;21(1):1297
BMC cancer 2021 Dec 4;21(1):1297
No comments: Submit comment
Supportive validation
- Submitted by
- Invitrogen Antibodies (provider)
- Main image
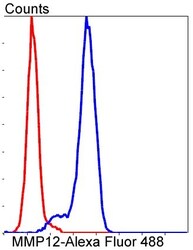
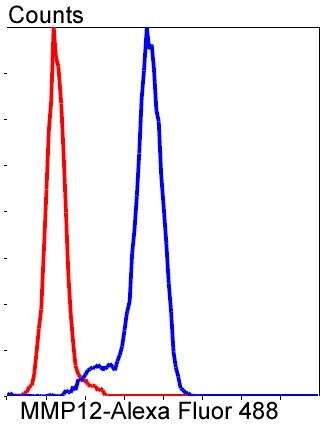
- Experimental details
- Flow cytometry analysis of MMP12 in A549 cells and unlabeled control (cells without incubation with primary antibody; red). Samples were incubated with MMP12 monoclonal antibody (Product # MA5-24851) at a dilution of 1:50 followed by Alexa Fluor 488-conjugated goat anti rabbit IgG.
Supportive validation
- Submitted by
- Invitrogen Antibodies (provider)
- Main image
- Experimental details
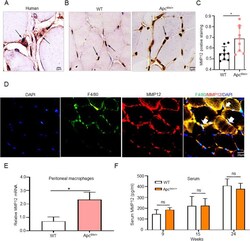
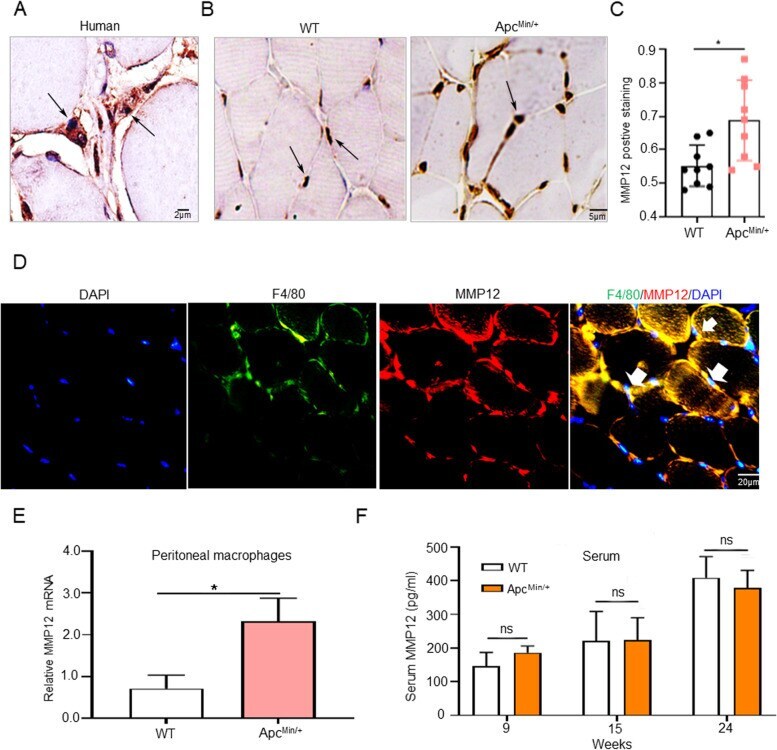
- Fig. 2 MMP12 Is Up-regulated in Muscle Tissues and Macrophages of Apc Min/+ Mice. A MMP12 antibody immunostaining in the muscle of healthy individuals. Scale bar: 2 mum. B Immunostaining of MMP12 in muscle tissue of WT mice and Apc Min/+ mice. Scale bar: 5 mum. C Quantification of MM12 expression in gastrocnemius tissue was performed by ImageJ software (40X) (* P < 0.05, data are shown as means +- SD; n = 9 per group). D Representative images of dual immnofluorescent staining of macrophages (F4/80 in green) and MMP12 (in red) in WT mice are shown. The yellow areas in the merged images indicate overlapping localization of the red and green signals, indicated by the white arrows. Scale bars: 20 mum. E Quantification of MMP12 mRNA level in peritoneal macrophages isolated from WT mice and Apc Min/+ mice by qPCR (* P < 0.05; data are shown as the means +- SD; n = 6 per group). F The serum MMP12 levels detected in WT and Apc Min/+ mice at 9, 15, and 24 weeks old by ELISA ( P > 0.05; data are shown as means +- SD; n = 6 per group)
- Submitted by
- Invitrogen Antibodies (provider)
- Main image

- Experimental details
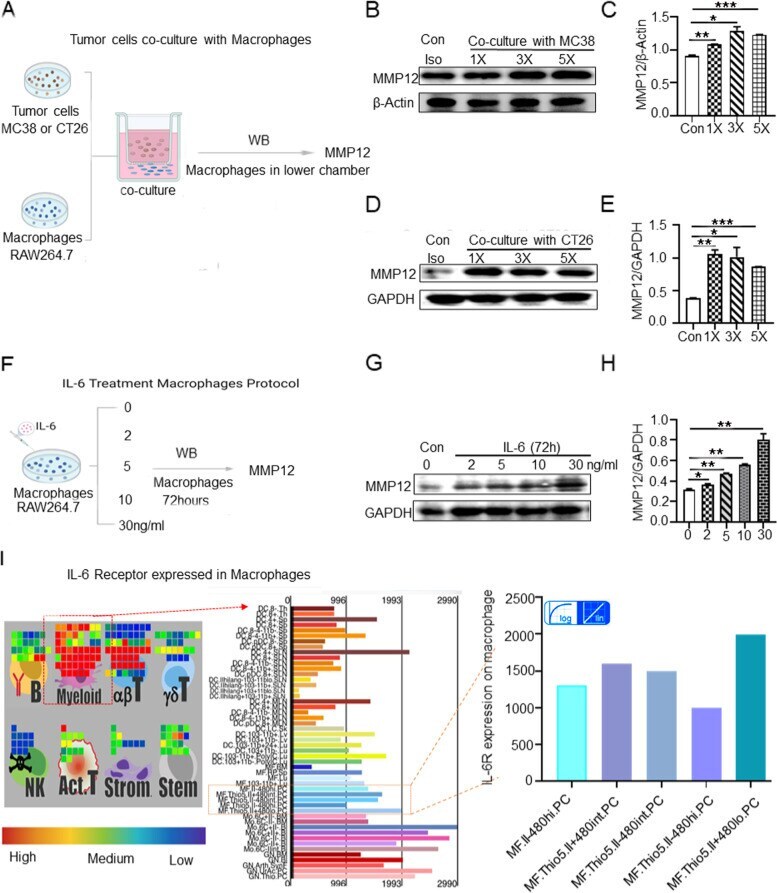
- Fig. 4 IL-6 Up-regulates MMP12 in Macrophages. A Schematic diagram of tumor cells (MC38/CT26 cell lines) co-cultured with macrophage cells (RAW264.7 cell lines). All quantifications were performed by image J software for gray scale statistics. B , C Representative western blots showing the secreted MMP12 protein levels from RAW264.7 cell lines (1-2 x 10 5 ) cultured alone or co-cultured with MC38 cell lines (control, 1 x 10 4 , 3 x 10 4 , 5 x 10 4 ). beta-Actin as the internal control. D , E Representative western blots showing the secreted MMP12 protein levels from RAW264.7 cell lines (1-2 x 10 5 ) cultured alone or co-cultured with CT26 cell lines (control, 1 x 10 4 , 3 x 10 4 , 5 x 10 4 ). GAPDH as the internal control. F Schematic diagram of IL-6 treated macrophages. RAW264.7 cells incubated with fresh media were served as untreated negative controls. Western blot was used to detect MMP12 in RAW 264.7 cells and GAPDH as the internal control. G , H RAW264.7 cells (1-2 x 10 5 ) were seeded in 6-well plates and treated with increasing doses of IL-6 (0, 2, 5, 10, 30 ng/mL) for 72 h. I Immune Gene data ( https://www.immgen.org/ImmGenApps.html ) suggest that IL-6 receptor expresses on F480+ macrophages. The colored bars refer to the expression level of IL-6 receptors on macrophages. Red represents high expression of IL-6 receptors, and green represents low expression of IL-6 receptors