Explore
 Validate
 Learn
LearnMA1-440
antibody from Invitrogen Antibodies
Targeting: APEX1
APE, APE-1, APEN, APEX, APX, HAP1, REF-1, REF1
 Western blot
 Immunocytochemistry
Antibody data
- Antibody Data
- Antigen structure
- References [5]
- Comments [0]
- Validations
- Immunocytochemistry [4]
- Immunoprecipitation [1]
- Immunohistochemistry [4]
- Flow cytometry [2]
- Chromatin Immunoprecipitation [2]
- Other assay [9]
Submit
Validation data
Reference
Comment
Report error
- Product number
- MA1-440 - Provider product page

- Provider
- Invitrogen Antibodies
- Product name
- APE1 Monoclonal Antibody (13B 8E5C2)
- Antibody type
- Monoclonal
- Antigen
- Recombinant full-length protein
- Description
- MA1-440 detects apurinic/apyrimidinic endonuclease (APE/ref-1) from human, non human primate, canine, mouse and rat samples. MA1-440 has been successfully used in Western blot, immunohistochemical, flow cytometry and immunoprecipitation procedures. By Western blot, this antibody detects a 36 kDa protein representing APE/ref-1 in HeLa cell lysate. Immunohistochemical staining of APE/ref-1 in a variety of normal and cancerous human tissues, including ovaries, cervix, prostate, germ cell tumors, osteosarcomas, and rhabdosarcomas, with MA1-440 yields a staining pattern consistent with nuclear staining. The MA1-440 immunogen is full-length, recombinant human APE protein.
- Reactivity
- Human, Mouse, Rat, Canine
- Host
- Mouse
- Isotype
- IgG
- Antibody clone number
- 13B 8E5C2
- Vial size
- 100 μL
- Concentration
- 1 mg/mL
- Storage
- -20°C, Avoid Freeze/Thaw Cycles
Submitted references APE1 redox function is required for activation of Yes-associated protein 1 under reflux conditions in Barrett's-associated esophageal adenocarcinomas.
Endogenous DNA 3' Blocks Are Vulnerabilities for BRCA1 and BRCA2 Deficiency and Are Reversed by the APE2 Nuclease.
Studies of apurinic/apyrimidinic endonuclease/ref-1 expression in epithelial ovarian cancer: correlations with tumor progression and platinum resistance.
Down-regulation of apurinic/apyrimidinic endonuclease expression is associated with the induction of apoptosis in differentiating myeloid leukemia cells.
Differential cellular and subcellular expression of the human multifunctional apurinic/apyrimidinic endonuclease (APE/ref-1) DNA repair enzyme.
Ballout F, Lu H, Chen L, Sriramajayam K, Que J, Meng Z, Wang TC, Giordano S, Zaika A, McDonald O, Peng D, El-Rifai W
Journal of experimental & clinical cancer research : CR 2022 Sep 1;41(1):264
Journal of experimental & clinical cancer research : CR 2022 Sep 1;41(1):264
Endogenous DNA 3' Blocks Are Vulnerabilities for BRCA1 and BRCA2 Deficiency and Are Reversed by the APE2 Nuclease.
Álvarez-Quilón A, Wojtaszek JL, Mathieu MC, Patel T, Appel CD, Hustedt N, Rossi SE, Wallace BD, Setiaputra D, Adam S, Ohashi Y, Melo H, Cho T, Gervais C, Muñoz IM, Grazzini E, Young JTF, Rouse J, Zinda M, Williams RS, Durocher D
Molecular cell 2020 Jun 18;78(6):1152-1165.e8
Molecular cell 2020 Jun 18;78(6):1152-1165.e8
Studies of apurinic/apyrimidinic endonuclease/ref-1 expression in epithelial ovarian cancer: correlations with tumor progression and platinum resistance.
Freitas S, Moore DH, Michael H, Kelley MR
Clinical cancer research : an official journal of the American Association for Cancer Research 2003 Oct 15;9(13):4689-94
Clinical cancer research : an official journal of the American Association for Cancer Research 2003 Oct 15;9(13):4689-94
Down-regulation of apurinic/apyrimidinic endonuclease expression is associated with the induction of apoptosis in differentiating myeloid leukemia cells.
Robertson KA, Hill DP, Xu Y, Liu L, Van Epps S, Hockenbery DM, Park JR, Wilson TM, Kelley MR
Cell growth & differentiation : the molecular biology journal of the American Association for Cancer Research 1997 Apr;8(4):443-9
Cell growth & differentiation : the molecular biology journal of the American Association for Cancer Research 1997 Apr;8(4):443-9
Differential cellular and subcellular expression of the human multifunctional apurinic/apyrimidinic endonuclease (APE/ref-1) DNA repair enzyme.
Duguid JR, Eble JN, Wilson TM, Kelley MR
Cancer research 1995 Dec 15;55(24):6097-102
Cancer research 1995 Dec 15;55(24):6097-102
No comments: Submit comment
Supportive validation
- Submitted by
- Invitrogen Antibodies (provider)
- Main image
- Experimental details
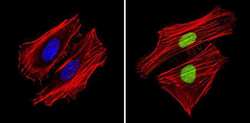
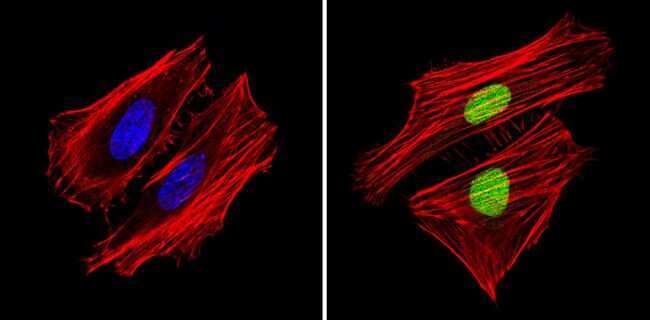
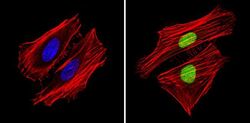
- Immunofluorescent analysis of APE1 (green) showing staining in the in the nucleus of Hela cells (right) compared to a negative control without primary antibody (left). Formalin-fixed cells were permeabilized with 0.1% Triton X-100 in TBS for 5-10 minutes and blocked with 3% BSA-PBS for 30 minutes at room temperature. Cells were probed with an APE1 monoclonal antibody (Product # MA1-440) in 3% BSA-PBS at a dilution of 1:200 and incubated overnight at 4ºC in a humidified chamber. Cells were washed with PBST and incubated with a DyLight-conjugated secondary antibody in PBS at room temperature in the dark. F-actin (red) was stained with a fluorescent red phalloidin and nuclei (blue) were stained with Hoechst or DAPI. Images were taken at a magnification of 60x.
- Submitted by
- Invitrogen Antibodies (provider)
- Main image
- Experimental details
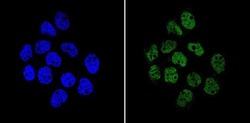
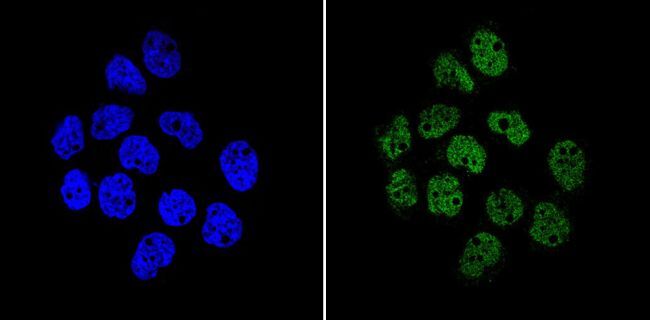
- Immunofluorescent analysis of APE1 (green) showing staining in the in the nucleus of A431 cells (right) compared to a negative control without primary antibody (left). Formalin-fixed cells were permeabilized with 0.1% Triton X-100 in TBS for 5-10 minutes and blocked with 3% BSA-PBS for 30 minutes at room temperature. Cells were probed with an APE1 monoclonal antibody (Product # MA1-440) in 3% BSA-PBS at a dilution of 1:200 and incubated overnight at 4ºC in a humidified chamber. Cells were washed with PBST and incubated with a DyLight-conjugated secondary antibody in PBS at room temperature in the dark. Nuclei (blue) were stained with Hoechst or DAPI. Images were taken at a magnification of 60x.

- Submitted by
- Invitrogen Antibodies (provider)
- Main image
- Experimental details
- Immunofluorescent analysis of APE1 (green) showing staining in the in the nucleus of Hela cells (right) compared to a negative control without primary antibody (left). Formalin-fixed cells were permeabilized with 0.1% Triton X-100 in TBS for 5-10 minutes and blocked with 3% BSA-PBS for 30 minutes at room temperature. Cells were probed with an APE1 monoclonal antibody (Product # MA1-440) in 3% BSA-PBS at a dilution of 1:200 and incubated overnight at 4ºC in a humidified chamber. Cells were washed with PBST and incubated with a DyLight-conjugated secondary antibody in PBS at room temperature in the dark. F-actin (red) was stained with a fluorescent red phalloidin and nuclei (blue) were stained with Hoechst or DAPI. Images were taken at a magnification of 60x.

- Submitted by
- Invitrogen Antibodies (provider)
- Main image

- Experimental details
- Immunofluorescent analysis of APE1 (green) showing staining in the in the nucleus of A431 cells (right) compared to a negative control without primary antibody (left). Formalin-fixed cells were permeabilized with 0.1% Triton X-100 in TBS for 5-10 minutes and blocked with 3% BSA-PBS for 30 minutes at room temperature. Cells were probed with an APE1 monoclonal antibody (Product # MA1-440) in 3% BSA-PBS at a dilution of 1:200 and incubated overnight at 4ºC in a humidified chamber. Cells were washed with PBST and incubated with a DyLight-conjugated secondary antibody in PBS at room temperature in the dark. Nuclei (blue) were stained with Hoechst or DAPI. Images were taken at a magnification of 60x.
Supportive validation
- Submitted by
- Invitrogen Antibodies (provider)
- Main image
- Experimental details
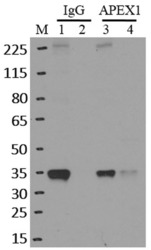
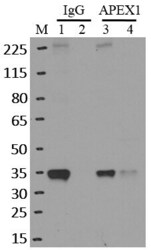
- Immunoprecipitation of APEX1 was performed on K562 cells. Antigen-antibody complexes were formed by incubating approximately 500 ug whole cell lysate with 5 ug of monoclonal APEX1 antibody (Product # MA1-440) rotating 60 min at RT. The immune complexes were captured on 625 ug of Dynabeads M-280 sheep anti-mouse IgG (Product # 11202D), washed extensively, and eluted in NuPAGE LDS sample buffer (Product # NP0007). Samples were resolved onto a 4-12% Bis-Tris protein gel (Product # NP0335BOX). Lanes 1 and 3 are input and lanes 2 and 4 are IP. Proteins were transferred to nitrocellulose membrane (Product # IB23001) and blocked in 5% milk. APEX1 was detected at approximately 36 kDa using a monoclonal APEX1 antibody (Product # MA1-440) at a dilution of 1:2000, followed by incubation with anti-mouse secondary antibody. Chemiluminescent detection was performed using ECL Western Blotting Substrate (Product # 32106). Data courtesy of the Yeo lab as part of the ENCODE project (www.encodeproject.org).

Supportive validation
- Submitted by
- Invitrogen Antibodies (provider)
- Main image
- Experimental details
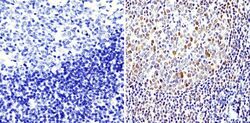
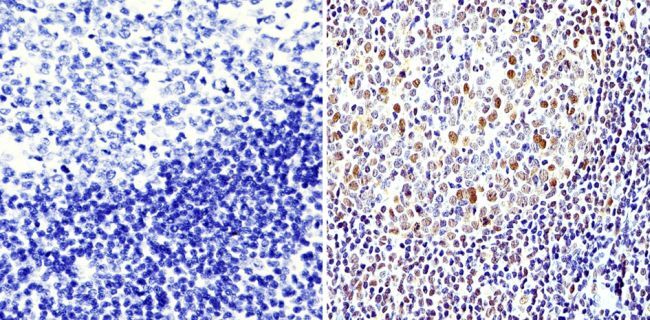
- Immunohistochemistry analysis of APE1 showing staining in the nucleus of paraffin-embedded human tonsil tissue (right) compared with a negative control without primary antibody (left). To expose target proteins, antigen retrieval was performed using 10mM sodium citrate (pH 6.0), microwaved for 8-15 min. Following antigen retrieval, tissues were blocked in 3% H2O2-methanol for 15 min at room temperature, washed with ddH2O and PBS, and then probed with an APE1 monoclonal antibody (Product # MA1-440) diluted in 3% BSA-PBS at a dilution of 1:500 overnight at 4°C in a humidified chamber. Tissues were washed extensively in PBST and detection was performed using an HRP-conjugated secondary antibody followed by colorimetric detection using a DAB kit. Tissues were counterstained with hematoxylin and dehydrated with ethanol and xylene to prep for mounting.
- Submitted by
- Invitrogen Antibodies (provider)
- Main image
- Experimental details
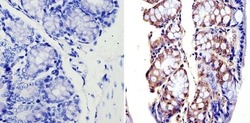
- Immunohistochemistry analysis of APE1 showing staining in the nucleus of paraffin-embedded mouse colon tissue (right) compared with a negative control without primary antibody (left). To expose target proteins, antigen retrieval was performed using 10mM sodium citrate (pH 6.0), microwaved for 8-15 min. Following antigen retrieval, tissues were blocked in 3% H2O2-methanol for 15 min at room temperature, washed with ddH2O and PBS, and then probed with an APE1 monoclonal antibody (Product # MA1-440) diluted in 3% BSA-PBS at a dilution of 1:500 overnight at 4°C in a humidified chamber. Tissues were washed extensively in PBST and detection was performed using an HRP-conjugated secondary antibody followed by colorimetric detection using a DAB kit. Tissues were counterstained with hematoxylin and dehydrated with ethanol and xylene to prep for mounting.

- Submitted by
- Invitrogen Antibodies (provider)
- Main image
- Experimental details
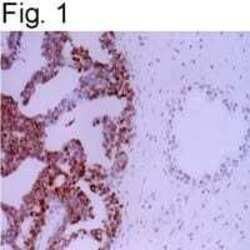
- Immunolocalization of APE/ref-1 in prostatic carcinoma using Product # MA1-440.

- Submitted by
- Invitrogen Antibodies (provider)
- Main image
- Experimental details
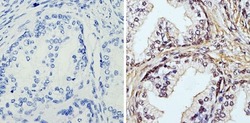
- Immunohistochemistry analysis of APE1 showing staining in the nucleus of paraffin-embedded human prostate carcinoma (right) compared with a negative control without primary antibody (left). To expose target proteins, antigen retrieval was performed using 10mM sodium citrate (pH 6.0), microwaved for 8-15 min. Following antigen retrieval, tissues were blocked in 3% H2O2-methanol for 15 min at room temperature, washed with ddH2O and PBS, and then probed with an APE1 monoclonal antibody (Product # MA1-440) diluted in 3% BSA-PBS at a dilution of 1:100 overnight at 4°C in a humidified chamber. Tissues were washed extensively in PBST and detection was performed using an HRP-conjugated secondary antibody followed by colorimetric detection using a DAB kit. Tissues were counterstained with hematoxylin and dehydrated with ethanol and xylene to prep for mounting.

Supportive validation
- Submitted by
- Invitrogen Antibodies (provider)
- Main image
- Experimental details
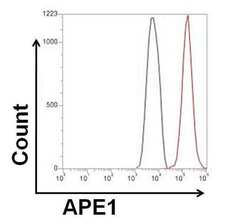
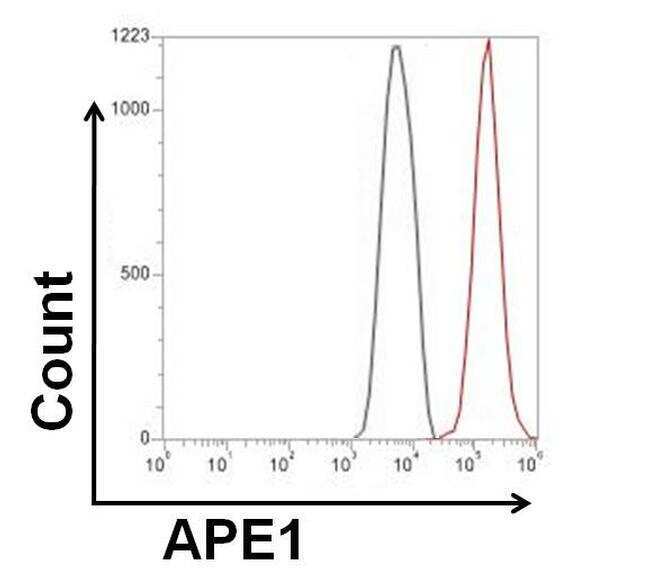
- Flow cytometry analysis of APE1 was done on HeLa cells. The cells were fixed, permeabilized and stained with a APE1 mouse monoclonal antibody (Product # MA1-440, red histogram) or Mouse IgG2a isotype control (Product # MA1-10418, black histogram) at a concentration of 2.5 µg/mL. After incubation of the primary antibody on ice for an hour, the cells were stained with a Goat anti-Mouse IgG (H+L) Secondary Antibody, Alexa Fluor Plus 680 conjugate (Product # A32734) at a dilution of 1:50 for at least 30 minutes on ice. A representative 10,000 cells were acquired for each sample.
- Submitted by
- Invitrogen Antibodies (provider)
- Main image
- Experimental details
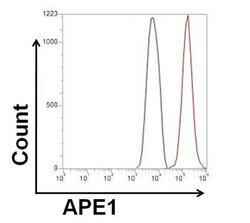
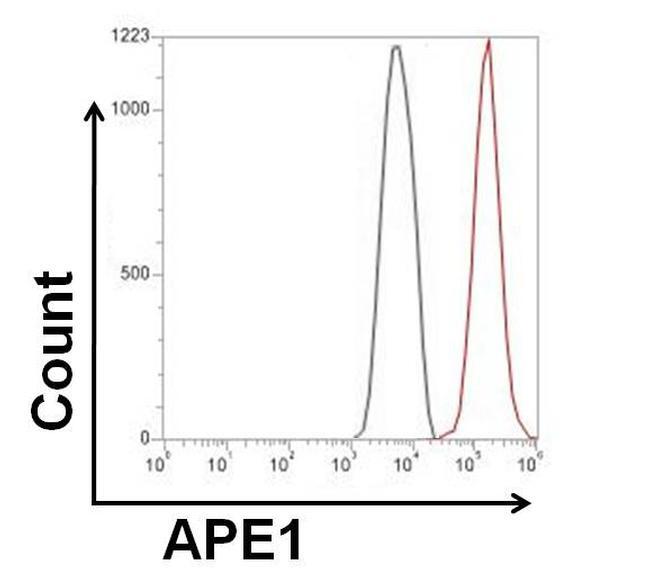
- Flow cytometry analysis of APE1 was done on HeLa cells. The cells were fixed, permeabilized and stained with a APE1 mouse monoclonal antibody (Product # MA1-440, red histogram) or Mouse IgG2a isotype control (Product # MA1-10418, black histogram) at a concentration of 2.5 µg/mL. After incubation of the primary antibody on ice for an hour, the cells were stained with a Goat anti-Mouse IgG (H+L) Secondary Antibody, Alexa Fluor Plus 680 conjugate (Product # A32734) at a dilution of 1:50 for at least 30 minutes on ice. A representative 10,000 cells were acquired for each sample.
Supportive validation
- Submitted by
- Invitrogen Antibodies (provider)
- Main image
- Experimental details
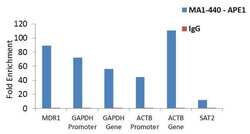
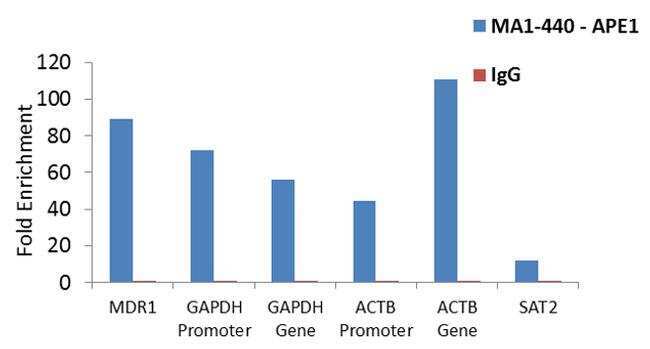
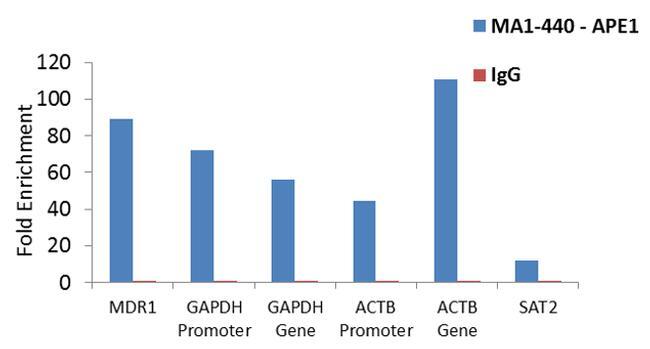
- Enrichment of endogenous APE1 protein at specific gene loci using Anti-APE1 Antibody: Chromatin Immunoprecipitation (ChIP) was performed using Anti-APE1 Mouse Monoclonal Antibody (Product # MA1-440, 3 µg) on sheared chromatin from 2 million HeLa cells treated with Methyl methanesulphonate (1mM for 2 hours) using the MAGnify ChIP system kit (Product # 49-2024). Normal Rabbit IgG was used as a negative IP control. The purified DNA was analyzed by qPCR with PCR primer pairs over MDR1, GAPDH promoter and gene, ACTB promoter and gene (active) and SAT2 satellite repeats (inactive). Data is presented as fold enrichment of the antibody signal versus the negative control IgG using the comparative CT method.
- Submitted by
- Invitrogen Antibodies (provider)
- Main image

- Experimental details
- Enrichment of endogenous APE1 protein at specific gene loci using Anti-APE1 Antibody: Chromatin Immunoprecipitation (ChIP) was performed using Anti-APE1 Mouse Monoclonal Antibody (Product # MA1-440, 3 µg) on sheared chromatin from 2 million HeLa cells treated with Methyl methanesulphonate (1mM for 2 hours) using the MAGnify ChIP system kit (Product # 49-2024). Normal Rabbit IgG was used as a negative IP control. The purified DNA was analyzed by qPCR with PCR primer pairs over MDR1, GAPDH promoter and gene, ACTB promoter and gene (active) and SAT2 satellite repeats (inactive). Data is presented as fold enrichment of the antibody signal versus the negative control IgG using the comparative CT method.
Supportive validation
- Submitted by
- Invitrogen Antibodies (provider)
- Main image

- Experimental details
- Immunoprecipitation of APEX1 was performed on K562 cells. Antigen-antibody complexes were formed by incubating approximately 500 ug whole cell lysate with 5 ug of monoclonal APEX1 antibody (Product # MA1-440) rotating 60 min at RT. The immune complexes were captured on 625 ug of Dynabeads M-280 sheep anti-mouse IgG (Product # 11202D), washed extensively, and eluted in NuPAGE LDS sample buffer (Product # NP0007). Samples were resolved onto a 4-12% Bis-Tris protein gel (Product # NP0335BOX). Lanes 1 and 3 are input and lanes 2 and 4 are IP. Proteins were transferred to nitrocellulose membrane (Product # IB23001) and blocked in 5% milk. APEX1 was detected at approximately 36 kDa using a monoclonal APEX1 antibody (Product # MA1-440) at a dilution of 1:2000, followed by incubation with anti-mouse secondary antibody. Chemiluminescent detection was performed using ECL Western Blotting Substrate (Product # 32106). Data courtesy of the Yeo lab as part of the ENCODE project (www.encodeproject.org).

- Submitted by
- Invitrogen Antibodies (provider)
- Main image

- Experimental details
- RNA immunoprecipitation (RIP) western of APEX1 was performed on K562 cells. Antigen-antibody complexes were formed by incubating approximately 500 æg whole cell lysate with 5 æg of monoclonal APEX1 antibody (Product # MA1-440) rotating 60 min at RT. The immune complexes were captured on 625 æg of Dynabeads M-280 sheep anti-mouse IgG (Product # 11202D), washed extensively, and eluted in NuPAGE LDS sample buffer (Product # NP0007). Samples were resolved onto a 4-12% Bis-Tris protein gel (Product # NP0335BOX). Lanes 1 and 3 are input and lanes 2 and 4 are IP. Proteins were transferred to nitrocellulose membrane (Product # IB23001) and blocked in 5% milk. APEX1 was detected at approximately 36 kDa using a monoclonal APEX1 antibody (Product # MA1-440) at a dilution of 1:2000, followed by incubation with anti-mouse secondary antibody. Chemiluminescent detection was performed using ECL Western Blotting Substrate (Product # 32106). Data courtesy of the Yeo lab as part of the ENCODE project (www.encodeproject.org).

- Submitted by
- Invitrogen Antibodies (provider)
- Main image
- Experimental details
- RNA immunoprecipitation (RIP) western of APEX1 was performed on K562 cells. Antigen-antibody complexes were formed by incubating approximately 500 µg whole cell lysate with 5 µg of monoclonal APEX1 antibody (Product # MA1-440) rotating 60 min at RT. The immune complexes were captured on 625 µg of Dynabeads M-280 sheep anti-mouse IgG (Product # 11202D), washed extensively, and eluted in NuPAGE LDS sample buffer (Product # NP0007). Samples were resolved onto a 4-12% Bis-Tris protein gel (Product # NP0335BOX). Lanes 1 and 3 are input and lanes 2 and 4 are IP. Proteins were transferred to nitrocellulose membrane (Product # IB23001) and blocked in 5% milk. APEX1 was detected at approximately 36 kDa using a monoclonal APEX1 antibody (Product # MA1-440) at a dilution of 1:2000, followed by incubation with anti-mouse secondary antibody. Chemiluminescent detection was performed using ECL Western Blotting Substrate (Product # 32106). Data courtesy of the Yeo lab as part of the ENCODE project (www.encodeproject.org).

- Submitted by
- Invitrogen Antibodies (provider)
- Main image
- Experimental details
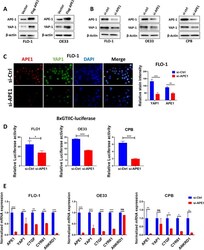
- Fig. 1 APE1 regulates YAP1 expression and transcriptional activity in BE and EAC cell lines. A FLO-1 (left) and OE33 (right) cells were transfected with APE1-wild-type overexpression plasmid and analyzed for APE1 and YAP1 expression by Western blot. beta-actin was used as a loading control. B Western blot was used to analyze APE1 and YAP1 expression following transient APE1 knockdown (si-APE1) in FLO-1 (left), OE33 (middle) and CPB (right) cells. beta-actin was used as a loading control. C Representative immunofluorescent staining images of APE1 (red) and YAP1 (green) in FLO-1 cells showing downregulation of nuclear YAP1 expression with or without APE1 knockdown. Quantification of stain intensity by ImageJ is also reported. DAPI (blue) was used for nuclear staining. D 8xCTIIC luciferase reporter assay was used to measure YAP1 transcriptional activity in FLO-1, OE33 and CPB cells with or without APE1 knockdown. The luciferase reporter activity values were normalized to Renilla expression levels. E qRT-PCR analyses of YAP1 downstream target genes, CTGF, CYR61 and ANKRD1 in FLO-1, OE33 and CPB cells with or without APE1 knockdown. Values are represented as mean +- SEM of three independent experiments. * P < 0.05; ** P < 0.01; *** P < 0.001, ns: no significance
- Submitted by
- Invitrogen Antibodies (provider)
- Main image
- Experimental details
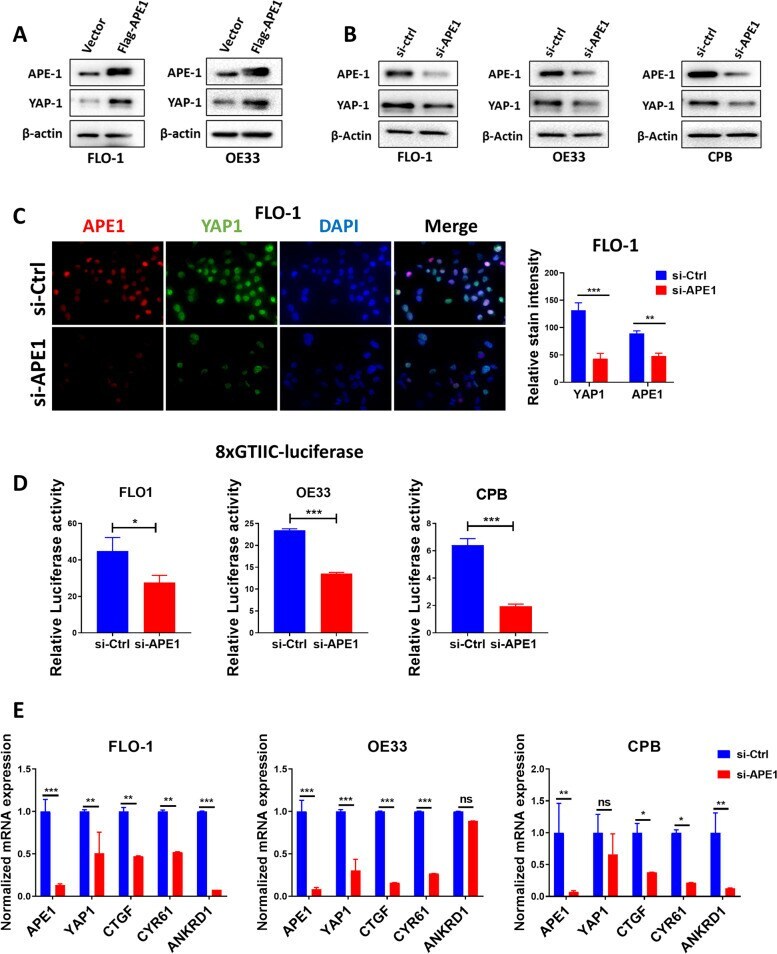
- Fig. 2 ABS induces YAP1 expression, promotes its nuclear accumulation and facilitates its transcriptional activity. A Western blot analysis of APE1 and YAP1 levels in FLO-1 and OE33 cells. Cells were exposed to 200 uM ABS for 20 min followed by recovery in complete media for the indicated time points. beta-actin was used as a loading control. B Representative immunofluorescent staining images of APE1 (red) and YAP1 (green) in FLO-1 cells exposed to ABS (200 uM, pH 4, 20 min) followed by 3 h recovery versus control untreated cells. DAPI (blue) was used for nuclear staining. Quantification of stain intensity by ImageJ is also reported. C Representative immunofluorescent staining images of APE1 (red) and YAP1 (green) in FLO-1 cells repeatedly exposed to ABS (200 uM, pH 5.5, 20 min per day for 14 days) versus control untreated cells. DAPI (blue) was used for nuclear staining. Quantification of stain intensity by ImageJ is also reported. D-E YAP1 transcriptional activity was measured using 8xCTIIC luciferase reporter assay in FLO-1 cells exposed or not to ABS treatment (200 uM, pH 4, 20 min) followed by 3 h recovery ( D ) or FLO-1 cells repeatedly exposed to ABS (200 uM, pH 5.5, 20 min per day for 14 days) versus control untreated cells ( E ). The luciferase reporter activity values were normalized to Renilla expression levels. F qRT-PCR analyses of YAP1 downstream target genes, CTGF, CYR61 and ANKRD1 in FLO-1 cells exposed to ABS (200 uM, pH 4, 20 min) followed by 3 h recovery ve

- Submitted by
- Invitrogen Antibodies (provider)
- Main image

- Experimental details
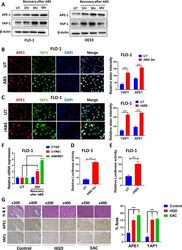
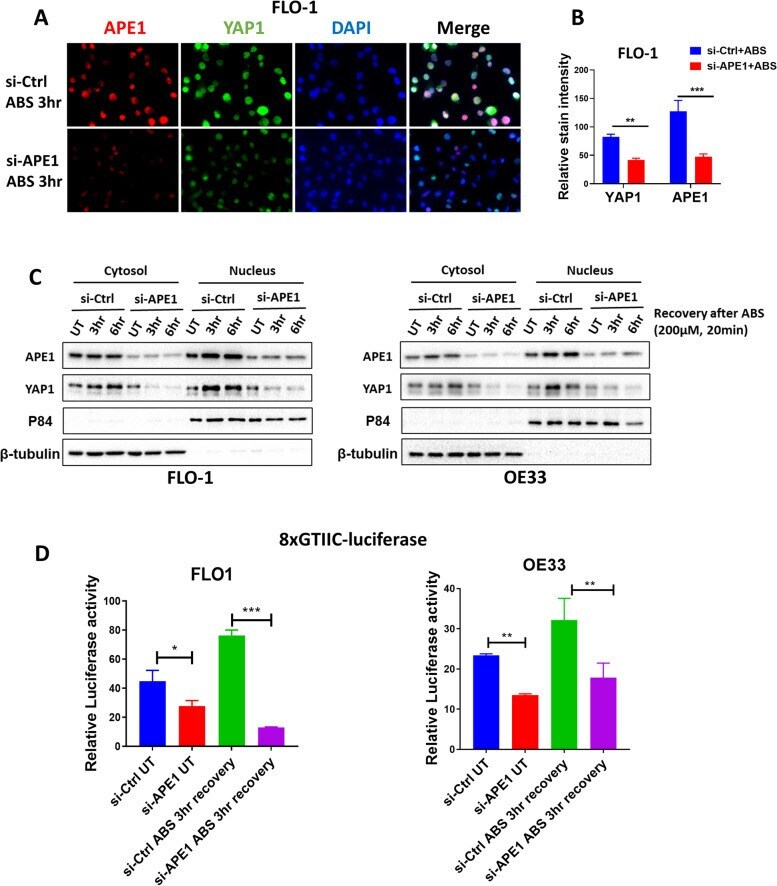
- Fig. 3 APE1 mediates ABS-induced YAP1 activation. A Representative immunofluorescence images of APE1 (red) and YAP1 (green) in FLO-1 cells exposed to ABS (200 uM, pH 4, 20 min) followed by 3 h recovery with or without APE1 knockdown. DAPI (blue) was used for nuclear staining. B Quantification of immunofluorescence stain intensity using ImageJ. C Cytosolic and nuclear fractions from FLO-1 (left) and OE33 (right) cells transfected with si-Ctrl or si-APE1 and treated with ABS (200 uM, pH 4, 20 min) followed by recovery in complete media for indicated timepoints were evaluated by western blot for the levels of APE1 and YAP1. beta-tubulin and p84 were used as a loading control for cytosolic and nuclear fractions, respectively. D 8xCTIIC luciferase reporter assay was used to measure YAP1 transcriptional activity in FLO-1 and OE33 cells transfected with si-Ctrl or si-APE1 and exposed or not to ABS treatment (200 uM, pH 4, 20 min) followed by 3 h recovery. The luciferase reporter activity values were normalized to Renilla expression levels. Values are represented as mean +- SEM of three independent experiments. * P < 0.05; ** P < 0.01; *** P < 0.001
- Submitted by
- Invitrogen Antibodies (provider)
- Main image

- Experimental details
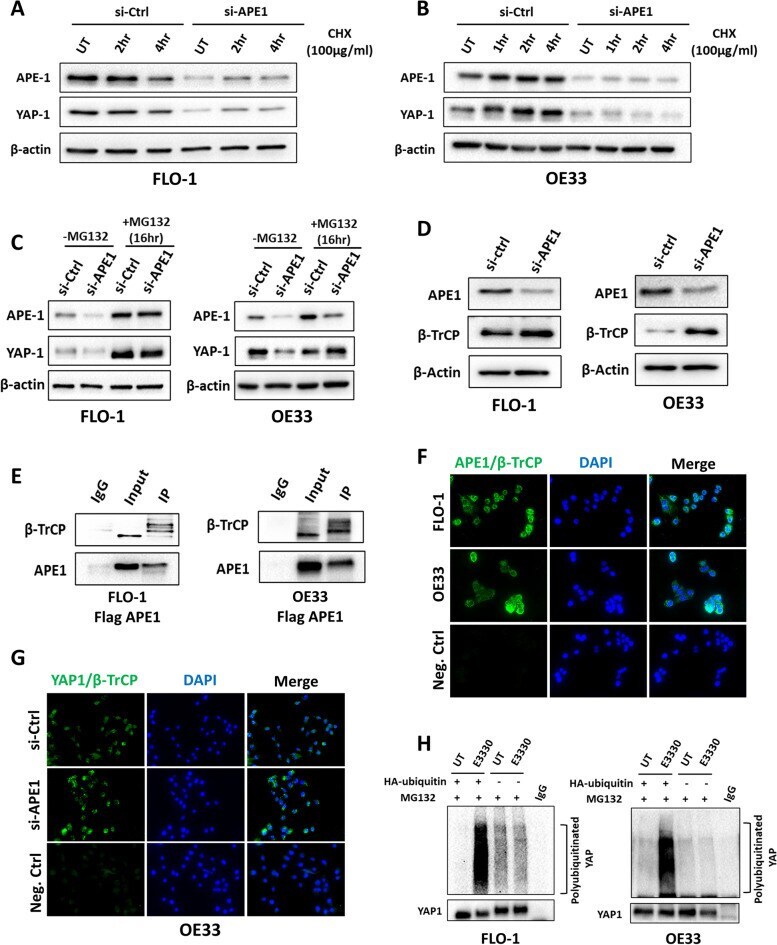
- Fig. 6 APE1 regulates YAP1 stability through beta-TrCP ubiquitinase. A-B FLO-1 ( A ) and OE33 ( B ) cells with or without APE1 transient knockdown were treated with cycloheximide (CHX, 100 ug/mL) for the indicated timepoints. The levels of APE1 and YAP1 were determined using western blot. beta-actin was used as a loading control. C FLO-1 and OE33 cells with or without APE1 transient knockdown were treated or not with MG132 (10 uM) for 16 h. The levels of APE1 and YAP1 were evaluated using western blot. beta-actin was used as a loading control. D Western blot was used to analyze APE1 and beta-TrCP expression following transient APE1 knockdown (si-APE1) in FLO-1 and OE33 cells. beta-actin was used as a loading control. E FLO-1 and OE33 cells were transfected with wild type APE1 (flag APE1), immunoprecipitated with flag antibody and immunoblotted with beta-TrCP and APE1 antibodies. F-G Representative images of proximity ligation assay for APE1 and beta-TrCP in FLO-1 and OE33 cells ( F ) and YAP1 and beta-TrCP in OE33 cells with and without APE1 knockdown ( G ). DAPI (blue) was used for nuclear staining. H In vitro ubiquitination assay in FLO-1 and OE33 cells transfected with HA-ubiquitin plasmid then treated or not with APE1 redox inhibitor E3330 (100 uM, overnight) followed by MG132 treatment (10 uM for 6 h). YAP1 antibody was used for immunoprecipitation and samples were then blotted with anti-ubiquitin and anti-YAP1
- Submitted by
- Invitrogen Antibodies (provider)
- Main image

- Experimental details
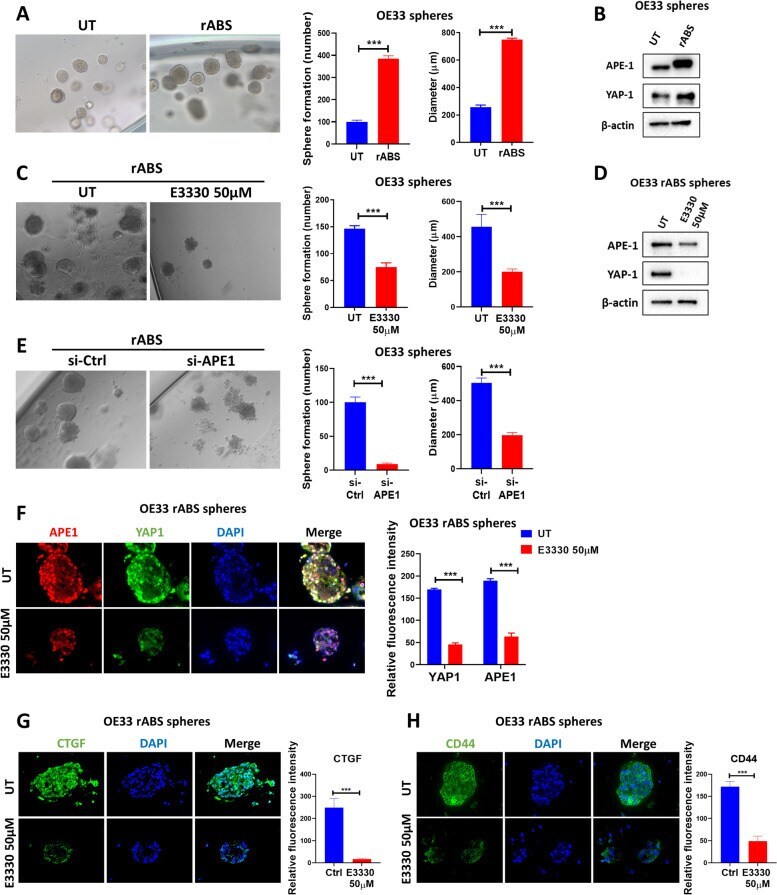
- Fig. 7 ABS enhances sphere formation and induces YAP1 through APE1. A Representative bright field images of OE33 spheres derived from control cells (UT) or cells repeatedly exposed to ABS (200uM, pH5.5) for 20 min per day for 14 days (rABS). Quantification of the number and diameter of spheres is also presented. B Western blot analysis of APE1 and YAP1 in OE33-derived spheres with or without repeated ABS. C Representative bright field images of spheres derived from repeated-ABS-treated OE33 cells with or without E3330 (50 uM) treatment. Quantification of the number and diameter of spheres is also presented. D Western blot analysis of APE1 and YAP1 in spheres derived from repeated-ABS-treated OE33 cells with or without E3330 (50 uM) treatment. E Representative bright field images of spheres derived from repeated-ABS-treated OE33 cells with or without transient APE1 knockdown. Quantification of the number and diameter of spheres is also presented. F-H Representative immunofluorescence images of spheres derived from repeated-ABS-treated OE33 cells with or without E3330 (50 uM) treatment showing APE1 (red) and YAP1 (green) staining in ( F ), CTGF (green) in ( G ) and CD44 (green) in ( H ). DAPI (blue) was used for nuclear staining. Quantification of immunofluorescence intensity by ImageJ is also shown. Values are represented as mean +- SEM. * P < 0.05; ** P < 0.01; *** P < 0.001