Explore
 Validate
 Learn
LearnPA5-29157
antibody from Invitrogen Antibodies
Targeting: APEX1
APE, APE-1, APEN, APEX, APX, HAP1, REF-1, REF1
 Western blot
 Immunocytochemistry
Antibody data
- Antibody Data
- Antigen structure
- References [1]
- Comments [0]
- Validations
- Immunocytochemistry [3]
- Immunoprecipitation [1]
- Immunohistochemistry [1]
- Chromatin Immunoprecipitation [4]
- Other assay [4]
Submit
Validation data
Reference
Comment
Report error
- Product number
- PA5-29157 - Provider product page

- Provider
- Invitrogen Antibodies
- Product name
- APE1 Polyclonal Antibody
- Antibody type
- Polyclonal
- Antigen
- Recombinant full-length protein
- Description
- Recommended positive controls: 293T, A431, HeLa, HepG2, mouse brain, PC-12. Predicted reactivity: Mouse (94%), Rat (93%), Dog (95%), Pig (94%), Rhesus Monkey (98%), Chimpanzee (99%), Bovine (93%). Store product as a concentrated solution. Centrifuge briefly prior to opening the vial.
- Reactivity
- Human, Mouse, Rat
- Host
- Rabbit
- Isotype
- IgG
- Vial size
- 100 μL
- Concentration
- 0.34 mg/mL
- Storage
- Store at 4°C short term. For long term storage, store at -20°C, avoiding freeze/thaw cycles.
Submitted references APE1 redox function is required for activation of Yes-associated protein 1 under reflux conditions in Barrett's-associated esophageal adenocarcinomas.
Ballout F, Lu H, Chen L, Sriramajayam K, Que J, Meng Z, Wang TC, Giordano S, Zaika A, McDonald O, Peng D, El-Rifai W
Journal of experimental & clinical cancer research : CR 2022 Sep 1;41(1):264
Journal of experimental & clinical cancer research : CR 2022 Sep 1;41(1):264
No comments: Submit comment
Supportive validation
- Submitted by
- Invitrogen Antibodies (provider)
- Main image
- Experimental details
- Immunofluorescent analysis of APE1 in paraformaldehyde-fixed A549 cells using an APE1 polyclonal antibody (Product # PA5-29157) at a 1:200 dilution.

- Submitted by
- Invitrogen Antibodies (provider)
- Main image

- Experimental details
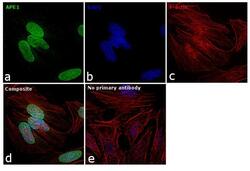
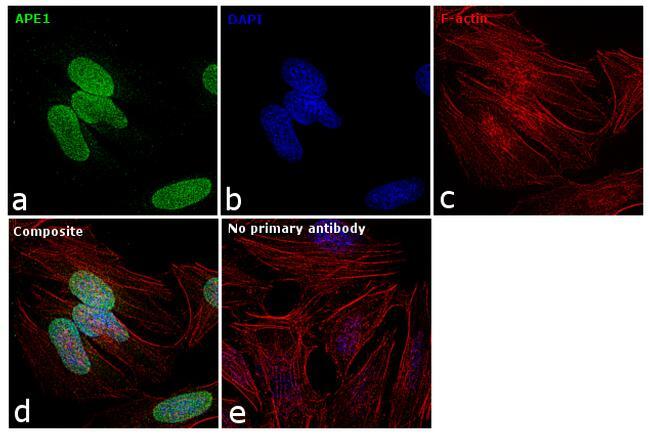
- Immunofluorescence analysis APE1 was performed using 70% confluent log phase HeLa cells. The cells were fixed with 4% paraformaldehyde for 10 minutes, permeabilized with 0.1% Triton™ X-100 for 15 minutes, and blocked with 1% BSA for 1 hour at room temperature. The cells were labeled with APE1 Polyclonal Antibody (Product # PA5-29157) at 5 microgram/mL in 0.1% BSA, incubated at 4 degree Celsius overnight and then labeled with Goat anti-Rabbit IgG (H+L) Superclonal™ Secondary Antibody, Alexa Fluor® 488 conjugate (Product # A27034) at a dilution of 1:2000 for 45 minutes at room temperature (Panel a: green). Nuclei (Panel b: blue) were stained with SlowFade® Gold Antifade Mountant with DAPI (Product # S36938). F-actin (Panel c: red) was stained with Rhodamine Phalloidin (Product # R415, 1:300). Panel d represents the merged image showing nuclear localization. Panel e represents control cells with no primary antibody to assess background. The images were captured at 60X magnification.

- Submitted by
- Invitrogen Antibodies (provider)
- Main image
- Experimental details
- Immunofluorescence analysis APE1 was performed using 70% confluent log phase HeLa cells. The cells were fixed with 4% paraformaldehyde for 10 minutes, permeabilized with 0.1% Triton™ X-100 for 15 minutes, and blocked with 1% BSA for 1 hour at room temperature. The cells were labeled with APE1 Polyclonal Antibody (Product # PA5-29157) at 5 microgram/mL in 0.1% BSA, incubated at 4 degree Celsius overnight and then labeled with Goat anti-Rabbit IgG (Heavy Chain) Superclonal™ Secondary Antibody, Alexa Fluor® 488 conjugate (Product # A27034) at a dilution of 1:2000 for 45 minutes at room temperature (Panel a: green). Nuclei (Panel b: blue) were stained with SlowFade® Gold Antifade Mountant with DAPI (Product # S36938). F-actin (Panel c: red) was stained with Rhodamine Phalloidin (Product # R415, 1:300). Panel d represents the merged image showing nuclear localization. Panel e represents control cells with no primary antibody to assess background. The images were captured at 60X magnification.
Supportive validation
- Submitted by
- Invitrogen Antibodies (provider)
- Main image

- Experimental details
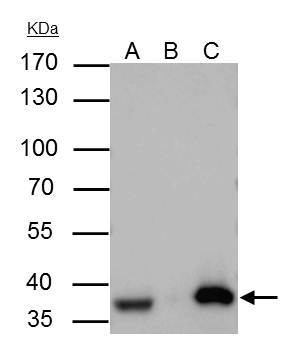
- APE1 Polyclonal Antibody immunoprecipitates APE1 protein in IP experiments. IP Sample: A431 whole cell lysate/extract A : 30 µg whole cell lysate/extract of APE1 protein expressing A431 cells B : Control with 3 µg of pre-immune rabbit IgG C : Immunoprecipitation of APE1 by 3 µg of APE1 Polyclonal Antibody (Product # PA5-29157) 10% SDS-PAGE The immunoprecipitated APE1 protein was detected by APE1 Polyclonal Antibody (Product # PA5-29157) diluted at 1:1,000. Anti-rabbit IgG (HRP) was used as a secondary reagent.

Supportive validation
- Submitted by
- Invitrogen Antibodies (provider)
- Main image
- Experimental details
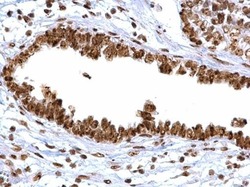
- APE1 Polyclonal Antibody detects APE1 protein at cytoplasm, nucleus and nucleolus on human ovarian carcinoma by immunohistochemical analysis. Sample: Paraffin-embedded human ovarian carcinoma. APE1 Polyclonal Antibody (Product # PA5-29157) diluted at 1:500. Antigen Retrieval: EDTA based buffer, pH 8.0, 15 min.

Supportive validation
- Submitted by
- Invitrogen Antibodies (provider)
- Main image
- Experimental details
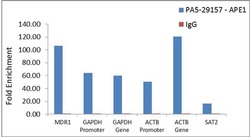
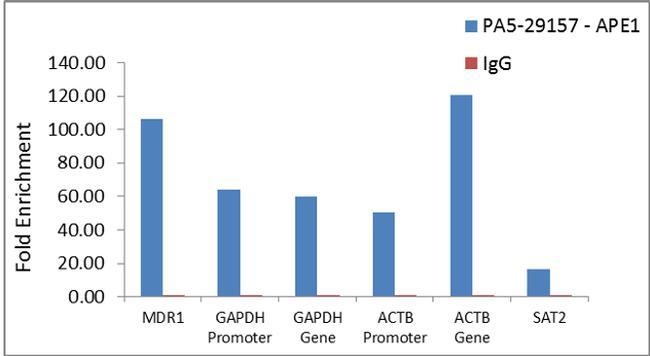
- Enrichment of endogenous APE1 protein at specific gene loci using Anti-APE1 Antibody: Chromatin Immunoprecipitation (ChIP) was performed using Anti-APE1 Rabbit Polyclonal Antibody (Product # PA5-29157, 3 µg) on sheared chromatin from 2 million HeLa cells treated with Methyl methanesulphonate (1mM for 2 hours) using the MAGnify ChIP system kit (Product # 49-2024). Normal Rabbit IgG was used as a negative IP control. The purified DNA was analyzed by qPCR with PCR primer pairs over MDR1, GAPDH promoter, GAPDH gene, ACTB promoter, ACTB gene (active) and SAT2 satellite repeats (inactive). Data is presented as fold enrichment of the antibody signal versus the negative control IgG using the comparative CT method.

- Submitted by
- Invitrogen Antibodies (provider)
- Main image
- Experimental details
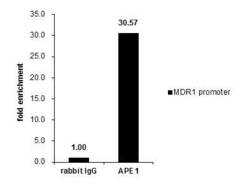
- Cross-linked ChIP was performed with 293T chromatin extract treated with Trichostatin A (0.4 µM for 18 h) and 5 µg of either control rabbit IgG or APE1 Polyclonal Antibody (Product # PA5-29157). The precipitated DNA was detected by PCR with primer set targeting to MDR1 promoter.

- Submitted by
- Invitrogen Antibodies (provider)
- Main image

- Experimental details
- Cross-linked ChIP was performed with 293T chromatin extract treated with Trichostatin A (0.4 µM for 18 h) and 5 µg of either control rabbit IgG or APE1 Polyclonal Antibody (Product # PA5-29157). The precipitated DNA was detected by PCR with primer set targeting to MDR1 promoter.

- Submitted by
- Invitrogen Antibodies (provider)
- Main image
- Experimental details
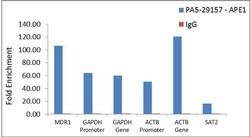
- Enrichment of endogenous APE1 protein at specific gene loci using Anti-APE1 Antibody: Chromatin Immunoprecipitation (ChIP) was performed using Anti-APE1 Rabbit Polyclonal Antibody (Product # PA5-29157, 3 µg) on sheared chromatin from 2 million HeLa cells treated with Methyl methanesulphonate (1mM for 2 hours) using the MAGnify ChIP system kit (Product # 49-2024). Normal Rabbit IgG was used as a negative IP control. The purified DNA was analyzed by qPCR with PCR primer pairs over MDR1, GAPDH promoter, GAPDH gene, ACTB promoter, ACTB gene (active) and SAT2 satellite repeats (inactive). Data is presented as fold enrichment of the antibody signal versus the negative control IgG using the comparative CT method.
Supportive validation
- Submitted by
- Invitrogen Antibodies (provider)
- Main image

- Experimental details
- APE1 Polyclonal Antibody immunoprecipitates APE1 protein in IP experiments. IP Sample: A431 whole cell lysate/extract A : 30 µg whole cell lysate/extract of APE1 protein expressing A431 cells B : Control with 3 µg of pre-immune rabbit IgG C : Immunoprecipitation of APE1 by 3 µg of APE1 Polyclonal Antibody (Product # PA5-29157) 10% SDS-PAGE The immunoprecipitated APE1 protein was detected by APE1 Polyclonal Antibody (Product # PA5-29157) diluted at 1:1,000. Anti-rabbit IgG (HRP) was used as a secondary reagent.
- Submitted by
- Invitrogen Antibodies (provider)
- Main image
- Experimental details
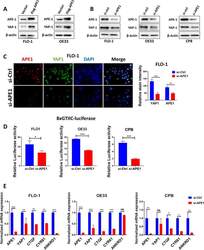
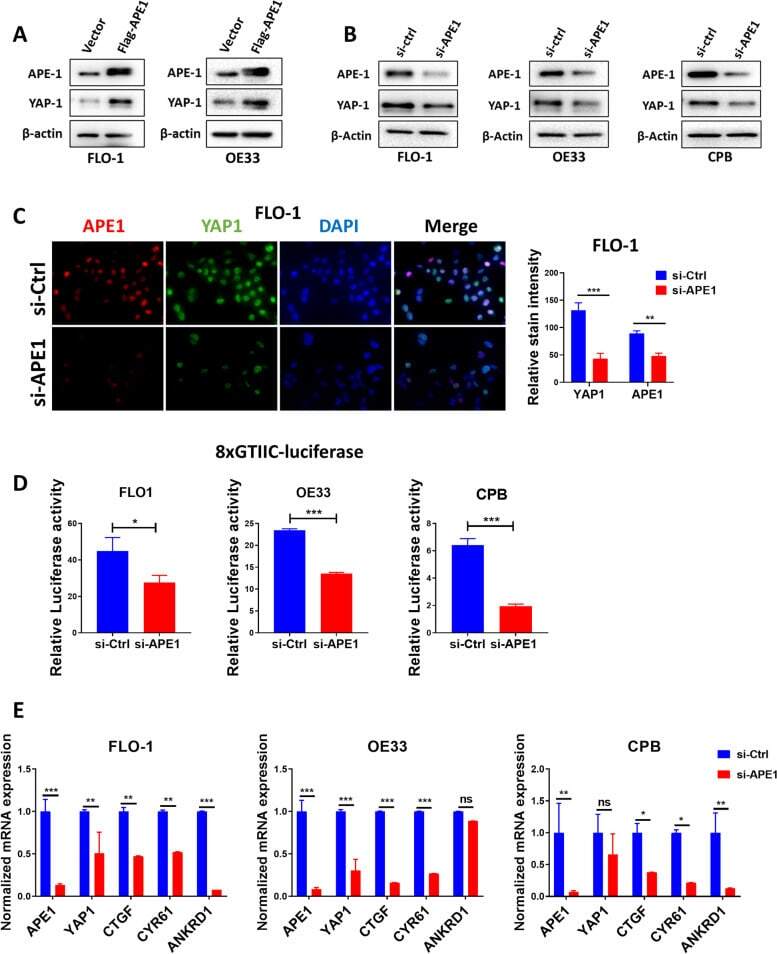
- Fig. 1 APE1 regulates YAP1 expression and transcriptional activity in BE and EAC cell lines. A FLO-1 (left) and OE33 (right) cells were transfected with APE1-wild-type overexpression plasmid and analyzed for APE1 and YAP1 expression by Western blot. beta-actin was used as a loading control. B Western blot was used to analyze APE1 and YAP1 expression following transient APE1 knockdown (si-APE1) in FLO-1 (left), OE33 (middle) and CPB (right) cells. beta-actin was used as a loading control. C Representative immunofluorescent staining images of APE1 (red) and YAP1 (green) in FLO-1 cells showing downregulation of nuclear YAP1 expression with or without APE1 knockdown. Quantification of stain intensity by ImageJ is also reported. DAPI (blue) was used for nuclear staining. D 8xCTIIC luciferase reporter assay was used to measure YAP1 transcriptional activity in FLO-1, OE33 and CPB cells with or without APE1 knockdown. The luciferase reporter activity values were normalized to Renilla expression levels. E qRT-PCR analyses of YAP1 downstream target genes, CTGF, CYR61 and ANKRD1 in FLO-1, OE33 and CPB cells with or without APE1 knockdown. Values are represented as mean +- SEM of three independent experiments. * P < 0.05; ** P < 0.01; *** P < 0.001, ns: no significance
- Submitted by
- Invitrogen Antibodies (provider)
- Main image

- Experimental details
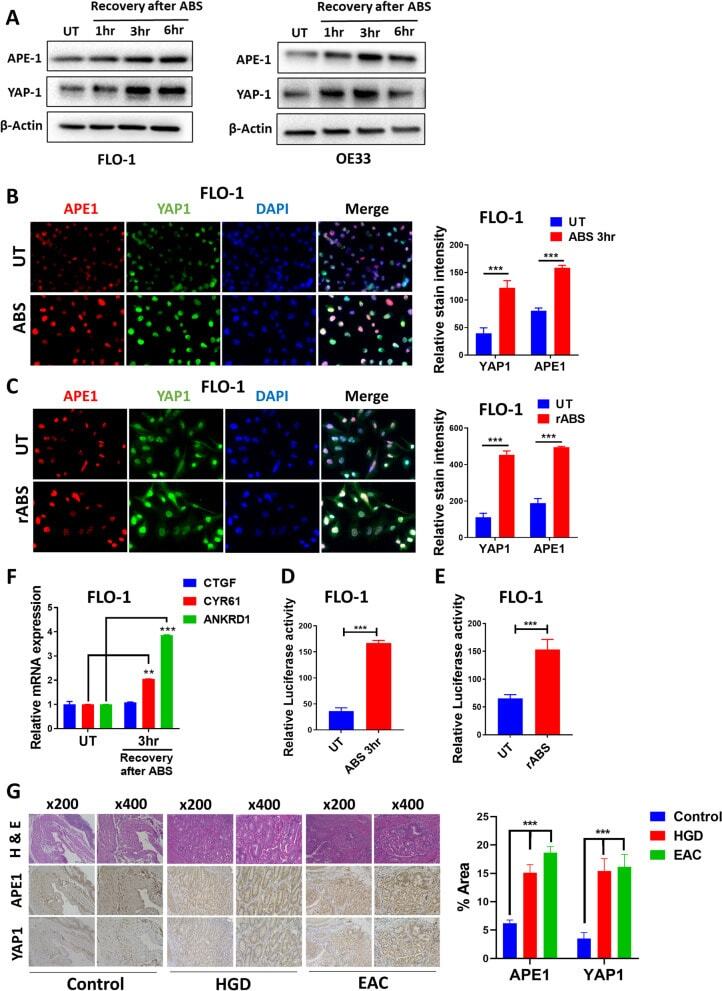
- Fig. 2 ABS induces YAP1 expression, promotes its nuclear accumulation and facilitates its transcriptional activity. A Western blot analysis of APE1 and YAP1 levels in FLO-1 and OE33 cells. Cells were exposed to 200 uM ABS for 20 min followed by recovery in complete media for the indicated time points. beta-actin was used as a loading control. B Representative immunofluorescent staining images of APE1 (red) and YAP1 (green) in FLO-1 cells exposed to ABS (200 uM, pH 4, 20 min) followed by 3 h recovery versus control untreated cells. DAPI (blue) was used for nuclear staining. Quantification of stain intensity by ImageJ is also reported. C Representative immunofluorescent staining images of APE1 (red) and YAP1 (green) in FLO-1 cells repeatedly exposed to ABS (200 uM, pH 5.5, 20 min per day for 14 days) versus control untreated cells. DAPI (blue) was used for nuclear staining. Quantification of stain intensity by ImageJ is also reported. D-E YAP1 transcriptional activity was measured using 8xCTIIC luciferase reporter assay in FLO-1 cells exposed or not to ABS treatment (200 uM, pH 4, 20 min) followed by 3 h recovery ( D ) or FLO-1 cells repeatedly exposed to ABS (200 uM, pH 5.5, 20 min per day for 14 days) versus control untreated cells ( E ). The luciferase reporter activity values were normalized to Renilla expression levels. F qRT-PCR analyses of YAP1 downstream target genes, CTGF, CYR61 and ANKRD1 in FLO-1 cells exposed to ABS (200 uM, pH 4, 20 min) followed by 3 h recovery ve
- Submitted by
- Invitrogen Antibodies (provider)
- Main image
- Experimental details
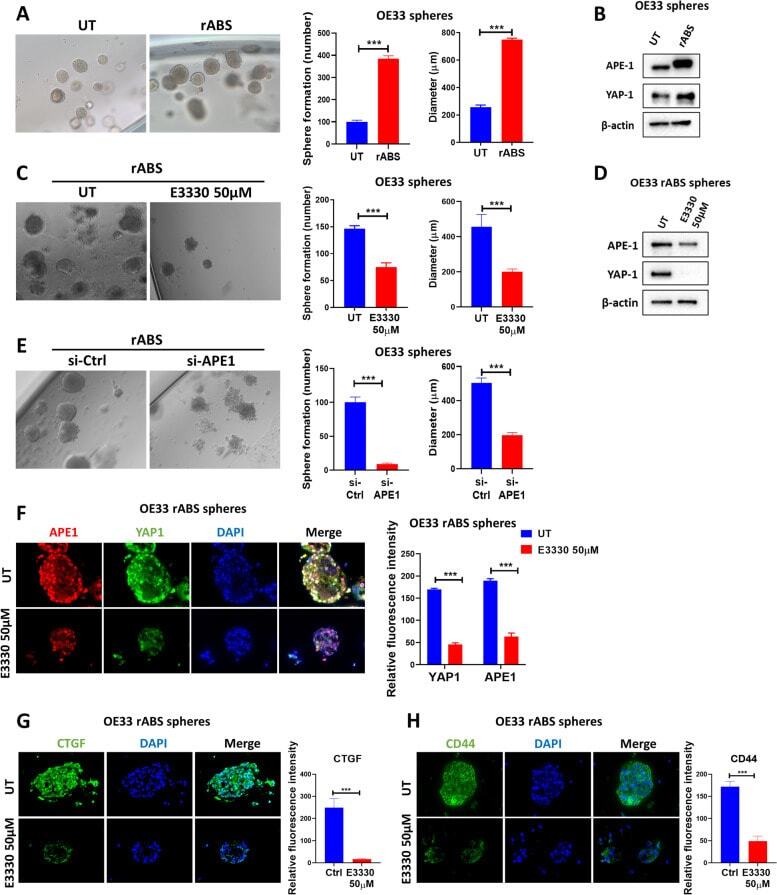
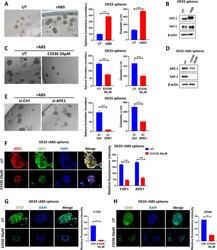
- Fig. 7 ABS enhances sphere formation and induces YAP1 through APE1. A Representative bright field images of OE33 spheres derived from control cells (UT) or cells repeatedly exposed to ABS (200uM, pH5.5) for 20 min per day for 14 days (rABS). Quantification of the number and diameter of spheres is also presented. B Western blot analysis of APE1 and YAP1 in OE33-derived spheres with or without repeated ABS. C Representative bright field images of spheres derived from repeated-ABS-treated OE33 cells with or without E3330 (50 uM) treatment. Quantification of the number and diameter of spheres is also presented. D Western blot analysis of APE1 and YAP1 in spheres derived from repeated-ABS-treated OE33 cells with or without E3330 (50 uM) treatment. E Representative bright field images of spheres derived from repeated-ABS-treated OE33 cells with or without transient APE1 knockdown. Quantification of the number and diameter of spheres is also presented. F-H Representative immunofluorescence images of spheres derived from repeated-ABS-treated OE33 cells with or without E3330 (50 uM) treatment showing APE1 (red) and YAP1 (green) staining in ( F ), CTGF (green) in ( G ) and CD44 (green) in ( H ). DAPI (blue) was used for nuclear staining. Quantification of immunofluorescence intensity by ImageJ is also shown. Values are represented as mean +- SEM. * P < 0.05; ** P < 0.01; *** P < 0.001