Explore
 Validate
 Learn
Learn Western blot
 Immunocytochemistry
Antibody data
- Antibody Data
- Antigen structure
- References [3]
- Comments [0]
- Validations
- Immunocytochemistry [2]
- Immunohistochemistry [1]
- Other assay [1]
Submit
Validation data
Reference
Comment
Report error
- Product number
- PA5-28686 - Provider product page

- Provider
- Invitrogen Antibodies
- Product name
- CK2 alpha-1 Polyclonal Antibody
- Antibody type
- Polyclonal
- Antigen
- Recombinant full-length protein
- Description
- Recommended positive controls: 293T, A431, H1299, HeLaS3, HepG2, Molt-4, Raji, mouse brain, PC-12, Rat2, rat brain. Predicted reactivity: Mouse (98%), Rat (97%), Zebrafish (84%), Xenopus laevis (86%), Rabbit (100%), Chicken (97%), Rhesus Monkey (100%), Bovine (100%). Store product as a concentrated solution. Centrifuge briefly prior to opening the vial.
- Reactivity
- Human, Mouse, Rat
- Host
- Rabbit
- Isotype
- IgG
- Vial size
- 100 μL
- Concentration
- 0.62 mg/mL
- Storage
- Store at 4°C short term. For long term storage, store at -20°C, avoiding freeze/thaw cycles.
Submitted references MicroRNA-499 serves as a sensitizer for lung cancer cells to radiotherapy by inhibition of CK2α-mediated phosphorylation of p65.
Regulation of the oncogenic phenotype by the nuclear body protein ZC3H8.
BET protein Brd4 activates transcription in neurons and BET inhibitor Jq1 blocks memory in mice.
Ma YS, Shi BW, Lu HM, Xie PF, Xin R, Wu ZJ, Shi Y, Yin YZ, Hou LK, Jia CY, Wu W, Lv ZW, Yu F, Wang GR, Liu JB, Jiang GX, Fu D
Molecular therapy oncolytics 2021 Jun 25;21:171-182
Molecular therapy oncolytics 2021 Jun 25;21:171-182
Regulation of the oncogenic phenotype by the nuclear body protein ZC3H8.
Schmidt JA, Danielson KG, Duffner ER, Radecki SG, Walker GT, Shelton A, Wang T, Knepper JE
BMC cancer 2018 Jul 24;18(1):759
BMC cancer 2018 Jul 24;18(1):759
BET protein Brd4 activates transcription in neurons and BET inhibitor Jq1 blocks memory in mice.
Korb E, Herre M, Zucker-Scharff I, Darnell RB, Allis CD
Nature neuroscience 2015 Oct;18(10):1464-73
Nature neuroscience 2015 Oct;18(10):1464-73
No comments: Submit comment
Supportive validation
- Submitted by
- Invitrogen Antibodies (provider)
- Main image

- Experimental details
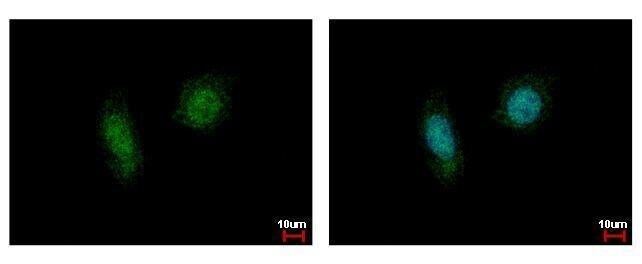
- CK2 alpha-1 Polyclonal Antibody detects CSNK2A1 protein at cytoplasm and nucleus by immunofluorescent analysis. Sample: HeLa cells were fixed in 4% paraformaldehyde at RT for 15 min. Green: CSNK2A1 protein stained by CK2 alpha-1 Polyclonal Antibody (Product # PA5-28686) diluted at 1:500. Blue: Hoechst 33342 staining.
- Submitted by
- Invitrogen Antibodies (provider)
- Main image
- Experimental details
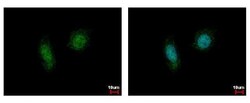
- CK2 alpha-1 Polyclonal Antibody detects CSNK2A1 protein at cytoplasm and nucleus by immunofluorescent analysis. Sample: HeLa cells were fixed in 4% paraformaldehyde at RT for 15 min. Green: CSNK2A1 protein stained by CK2 alpha-1 Polyclonal Antibody (Product # PA5-28686) diluted at 1:500. Blue: Hoechst 33342 staining.

Supportive validation
- Submitted by
- Invitrogen Antibodies (provider)
- Main image
- Experimental details
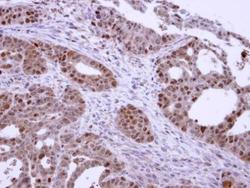
- Immunohistochemical analysis of paraffin-embedded Cal27 xenograft, using Casein Kinase 2 alpha 1 (Product # PA5-28686) antibody at 1:100 dilution. Antigen Retrieval: EDTA based buffer, pH 8.0, 15 min.

Supportive validation
- Submitted by
- Invitrogen Antibodies (provider)
- Main image

- Experimental details
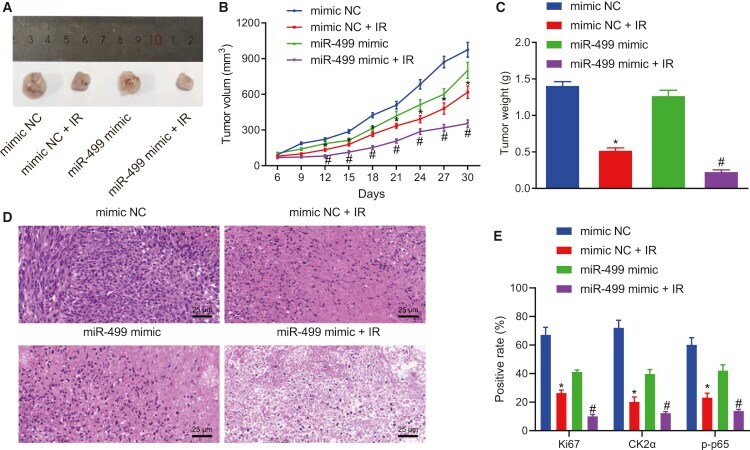
- Figure 4 miR-499 increased the sensitivity of lung cancer A549 cells to IR exposure in vivo (A) Representative pictures of tumors after different treatment. (B) Measurements of tumor volume after overexpression of miR-499 and IR. (C) Measurements of tumor weight after overexpression of miR-499 and IR. (D) H&E staining was conducted to detect the cellular structure changes (x400). (E) Ki67, CK2alpha, and p-p65 expression in tissues detected by IHC. *p < 0.05 versus mice treated with mimic NC; # p < 0.05 versus mice treated with mimic NC + IR, n = 12. The measurement data were expressed as mean +- standard deviation. Data between two groups were compared using independent sample t test. Comparisons among multiple groups were conducted by ANOVA, followed by Bonferroni''s post hoc test.