Explore
 Validate
 Learn
Learn Western blot
 Immunocytochemistry
Antibody data
- Antibody Data
- Antigen structure
- References [1]
- Comments [0]
- Validations
- Immunocytochemistry [1]
- Immunohistochemistry [3]
- Other assay [5]
Submit
Validation data
Reference
Comment
Report error
- Product number
- PA5-66367 - Provider product page

- Provider
- Invitrogen Antibodies
- Product name
- CCDC64 Polyclonal Antibody
- Antibody type
- Polyclonal
- Antigen
- Recombinant protein fragment
- Description
- Immunogen sequence: LRLQLWEAYCQ VRYLCSHLRG NDSADSAVST DSSMDESSET SSAKDVPAGS LRTALNELKR LIQSIVDGME PTVT Highest antigen sequence identity to the following orthologs - mouse 97%, rat 97%.
- Reactivity
- Human
- Host
- Rabbit
- Isotype
- IgG
- Vial size
- 100 μL
- Concentration
- 0.1 mg/mL
- Storage
- Store at 4°C short term. For long term storage, store at -20°C, avoiding freeze/thaw cycles.
Submitted references Golgi-associated BICD adaptors couple ER membrane penetration and disassembly of a viral cargo.
Spriggs CC, Badieyan S, Verhey KJ, Cianfrocco MA, Tsai B
The Journal of cell biology 2020 May 4;219(5)
The Journal of cell biology 2020 May 4;219(5)
No comments: Submit comment
Supportive validation
- Submitted by
- Invitrogen Antibodies (provider)
- Main image
- Experimental details
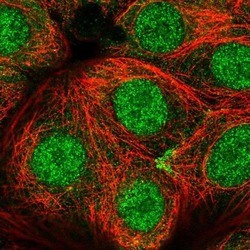
- Immunofluorescent staining of CCDC64 in human cell line MCF7 shows localization to nucleoplasm and cytosol. Samples were probed using a CCDC64 Polyclonal Antibody (Product # PA5-66367).

Supportive validation
- Submitted by
- Invitrogen Antibodies (provider)
- Main image
- Experimental details
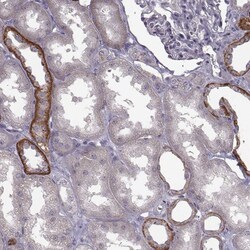
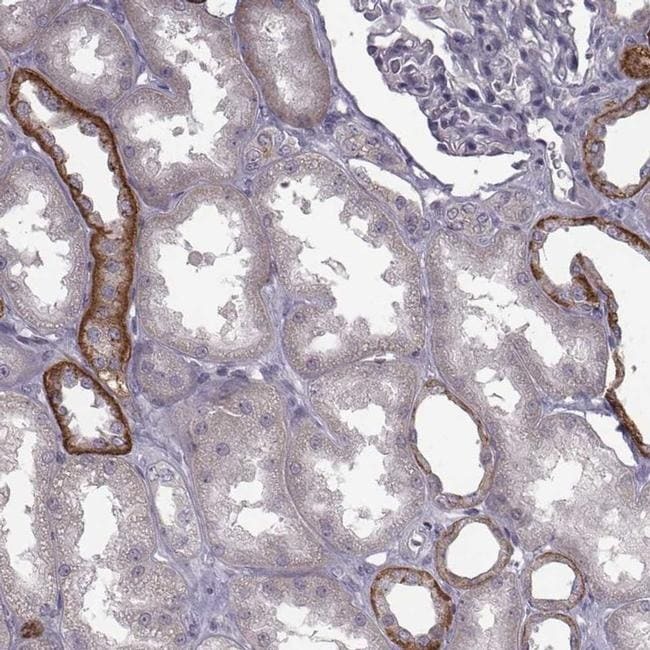
- Immunohistochemical staining of CCDC64 in human kidney using CCDC64 Polyclonal Antibody (Product # PA5-66367) shows high expression.

- Submitted by
- Invitrogen Antibodies (provider)
- Main image
- Experimental details
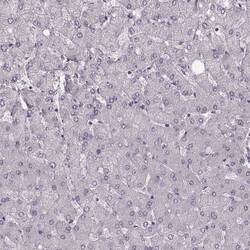
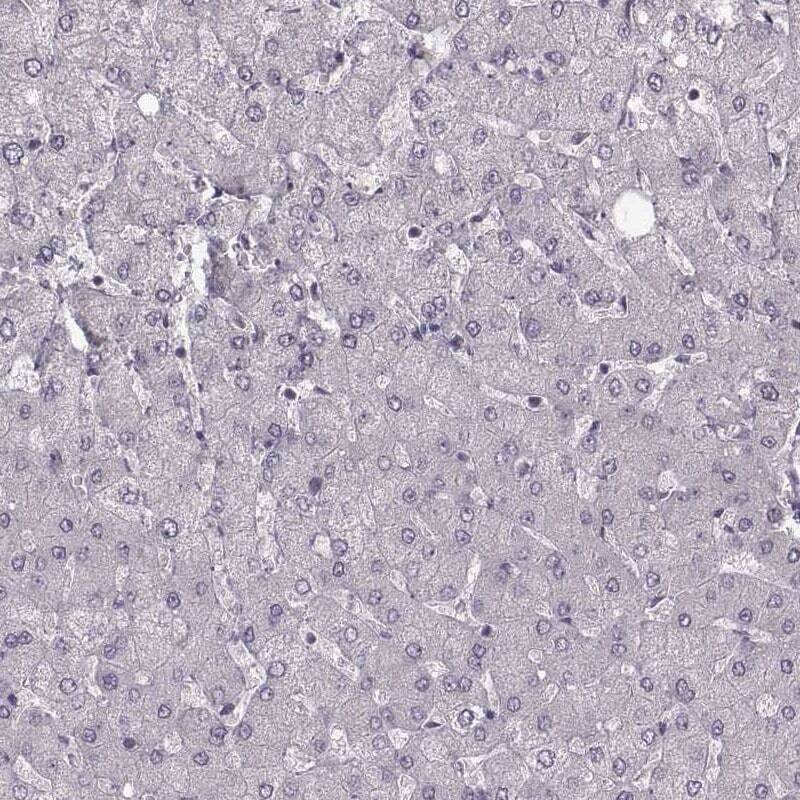
- Immunohistochemical staining of CCDC64 in human liver using CCDC64 Polyclonal Antibody (Product # PA5-66367) shows low expression as expected.
- Submitted by
- Invitrogen Antibodies (provider)
- Main image

- Experimental details
- Immunohistochemical staining of CCDC64 in human kidney shows strong membranous and cytoplasmic positivity in cells in tubules. Samples were probed using a CCDC64 Polyclonal Antibody (Product # PA5-66367).
Supportive validation
- Submitted by
- Invitrogen Antibodies (provider)
- Main image

- Experimental details
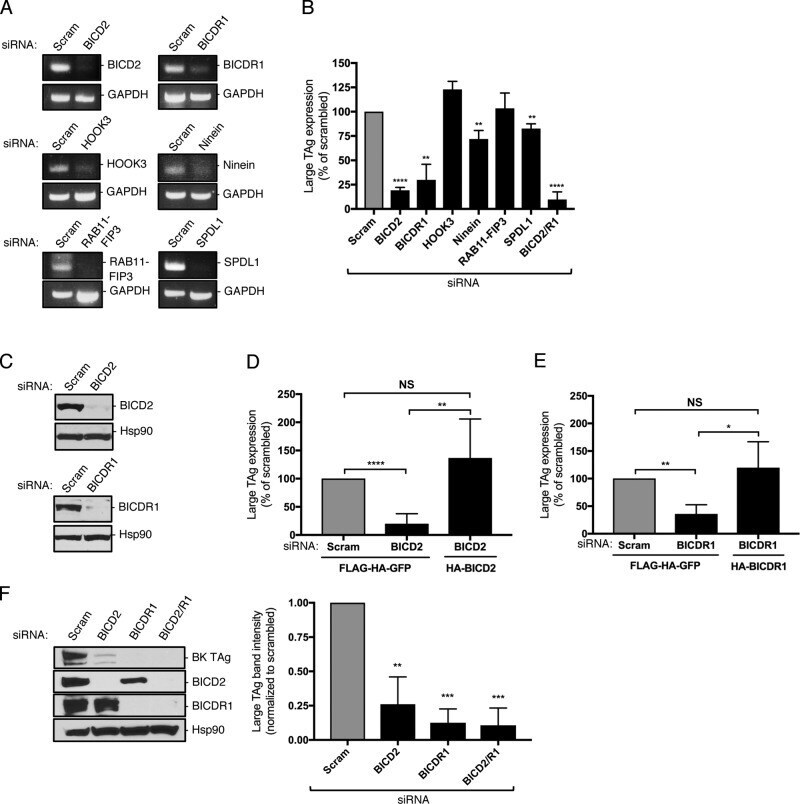
- Figure 1. The dynein cargo BICD adaptors support SV40 infection. (A) CV-1 cells were transfected with 5 nM of the indicated siRNA for 48 h. RNA was isolated and RT-PCR used to assess transcript levels. GAPDH was used as a loading control. (B) CV-1 cells were transfected with 5 nM of the indicated siRNA and infected with SV40 (MOI ~1). At 24 hours post infection (hpi), cells were fixed and stained for large T antigen (TAg). Data were normalized to the scrambled control. (C) CV-1 cells were transfected with either a scrambled control siRNA or siRNA against BICD2 or BICDR1, and BICD2 and BICDR1 protein levels were assessed by immunoblotting. Hsp90 was used as a loading control. (D) CV-1 cells were transfected with the scrambled control siRNA or siRNA against BICD2 for 24 h. Cells were then either transfected with the FLAG-HA-GFP control construct or mouse HA-BICD2 for an additional 24 h before infection with SV40 (MOI ~1). At 24 hpi, cells were fixed and stained for TAg. Data were normalized to the scrambled control with FLAG-HA-GFP. (E) CV-1 cells were transfected with the scrambled control siRNA or siRNA against BICDR1 for 24 h. Cells were then either transfected with the FLAG-HA-GFP control construct or mouse HA-BICDR1 for an additional 24 h before infection with SV40 (MOI ~1). At 24 hpi, cells were fixed and stained for TAg. Data were normalized to the scrambled control with FLAG-HA-GFP. (F) CV-1 cells were transfected with 5 nM of the indicated siRNA and infected with BK Py
- Submitted by
- Invitrogen Antibodies (provider)
- Main image
- Experimental details
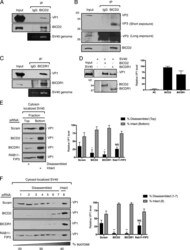
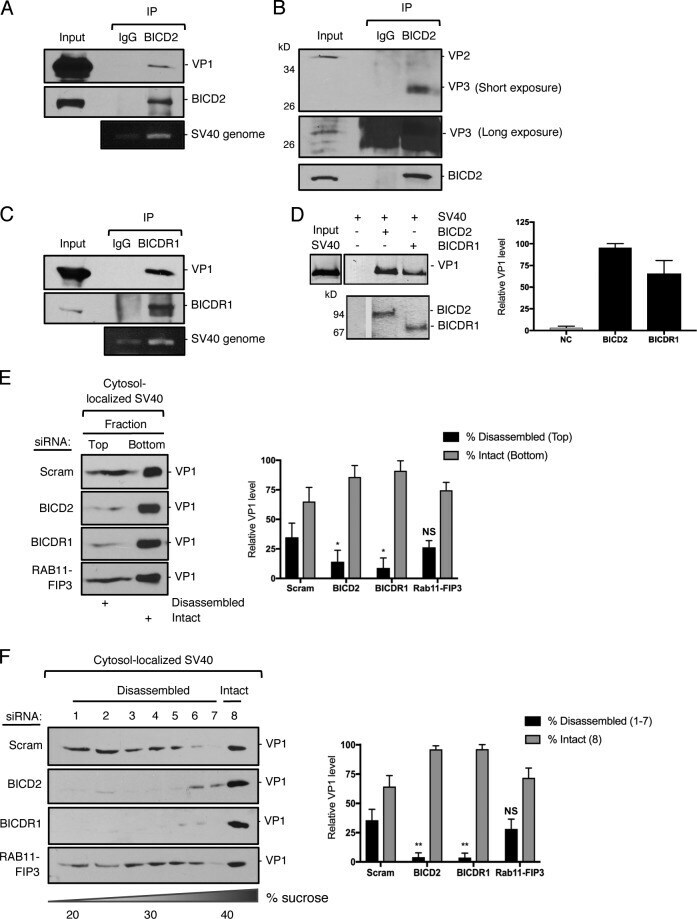
- Figure 3. BICD2 and BICDR1 bind to and promote SV40 disassembly in the cytosol during entry. (A) CV-1 cells were infected with SV40 (MOI ~25) for 16 h. Endogenous BICD2 was immunoprecipitated (IP) from whole-cell extracts and the eluted samples subjected to SDS-PAGE followed by immunoblotting for VP1. DNA was isolated from the eluted sample and PCR performed to identify SV40 genomic DNA. (B) As in A, except immunoprecipitation by BICD2 was followed by immunoblotting for VP2/3. (C) As in A, except endogenous BICDR1 was immunoprecipitated. (D) In vitro binding assay of SV40 and full-length BICD2 and BICDR1. Purified His-tagged BICD2 and BICDR1 were separately linked to Nickel- Nitrilotriacetic acid (NTA) agarose resin. After incubation of these adaptors with SV40 (treated with DTT and EGTA), the immobilized proteins were eluted with imidazole and blotted with anti-VP1 antibody. The line indicates that lanes from the same immunoblot have been spliced together. (E) CV-1 cells were transfected with either a scrambled control siRNA, siRNA against BICD2, BICDR1 or RAB11-FIP3, and infected with SV40 (MOI~5). At 16 hpi, the cytosolic fraction was isolated, layered on top of a 20% sucrose cushion, and centrifuged. Top and bottom fractions were collected and the presence of SV40 (VP1) assessed by immunoblotting. The levels of VP1 in the top fraction, corresponding to disassembled virus, and the bottom fraction, representing the intact virus, are quantified. (F) As in E, except the cytos
- Submitted by
- Invitrogen Antibodies (provider)
- Main image
- Experimental details
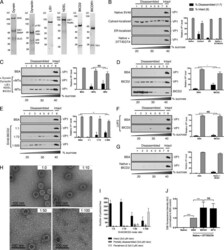
- Figure 4. Reconstitution of BICD2-dependent disassembly of SV40 in vitro. (A) SDS-PAGE of purified dynein, dynactin, LIS1, NDEL, BICD2, and BICDR1. (B) Native SV40 (+-DTT/EGTA) and SV40 isolated from the cytosol or ER of infected CV-1 cells were layered over a discontinuous sucrose gradient (20-40% sucrose) and centrifuged. Fractions were collected from the top of the gradient and the presence of SV40 (VP1) assessed by immunoblotting. The levels of VP1 in fractions 1-7, corresponding to disassembled virus, and fraction 8, representing the intact virus, are quantified. (C) Native SV40 was incubated with DTT/EGTA, the indicated purified proteins, ATP, and polymerized MTs where indicated. Samples were then layered over a discontinuous sucrose gradient and disassembly analyzed as in B. (D) Native SV40 was incubated with DTT/EGTA and BICD2 (without ATP or MTs). Disassembly was analyzed as in B. (E) Native SV40 was incubated with DTT/EGTA and increasing molar ratios of BICD2. Disassembly was assessed as in B. (F) ^VP3 SV40 was incubated with DTT/EGTA and BICD2 as in D. Disassembly was analyzed as in B. (G) Native SV40 (without DTT/EGTA) was incubated with BICD2 and disassembly analyzed as in B. (H) Negative-stained images of DTT/EGTA-treated SV40 incubated with BICD2 at different molar ratios. (I) Quantification of negative staining. Graph represents the number of intact or partially disassembled viruses and formed VP1 pentamers per field of view. Intact and disassembled viruses we

- Submitted by
- Invitrogen Antibodies (provider)
- Main image
- Experimental details
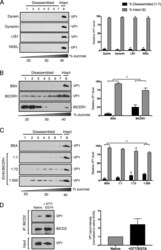
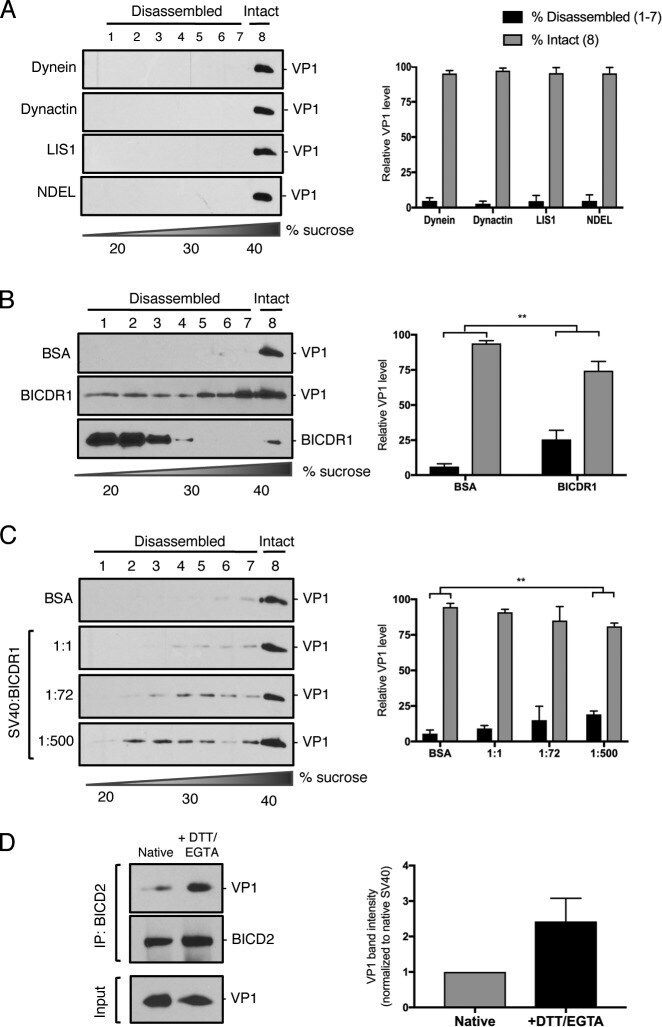
- Figure S2. Additional characterization of BICD-dependent binding and disassembly of SV40 in vitro (related to Fig. 4 ) . (A) Native SV40 was incubated with DTT/EGTA and the indicated purified proteins. Samples were then layered over a discontinuous sucrose gradient (20-40% sucrose) and centrifuged. Fractions were collected from the top of the gradient and the presence of SV40 (VP1) assessed by immunoblotting. The levels of VP1 in fractions 1-7, corresponding to disassembled virus, and fraction 8, representing the intact virus, are quantified. (B) Native SV40 was incubated with DTT/EGTA and BICDR1 (without ATP or MTs). Disassembly was analyzed as in A. (C) Native SV40 was incubated with DTT/EGTA and increasing molar ratios of BICDR1. Disassembly was assessed as in A. (D) In vitro pull-down of BICD2 with VP1 in the presence or absence of DTT/EGTA. Values are the averages of the means ( n = 3) +- SD. A standard Student's t test was used to determine statistical significance. **, P
- Submitted by
- Invitrogen Antibodies (provider)
- Main image
- Experimental details
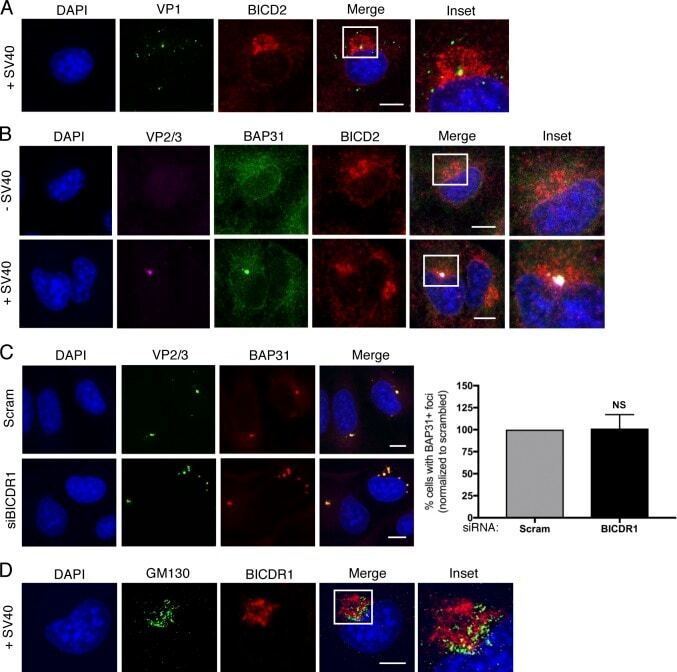
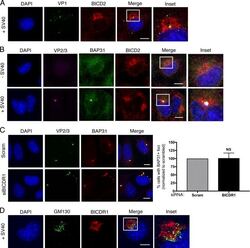
- Figure S4. The SV40-induced ER focus is surrounded by BICD2 and BICDR1 (related to Fig. 6 ). (A) Confocal analysis of CV-1 cells that were infected with SV40 (MOI ~5) for 16 h and stained with anti-VP1 (green) and anti-BICD2 (red) antibodies. Cells were counterstained with DAPI (blue). (B) Confocal analysis of uninfected and SV40-infected cells (MOI ~5) stained with anti-VP2/3 (pink), anti-BAP31 (green), and anti-BICD2 (red) antibodies. Cells were counterstained with DAPI (blue). (C) Confocal analysis of control and BICDR1-depleted CV-1 cells infected with SV40 (MOI ~5). At 16 hpi, cells were stained with anti-VP2/3 (green), anti-BAP31 (red), and counterstained with DAPI (blue). The graph represents the percentage of cells with BAP31 + foci normalized to the scrambled control. (D) As in A, except stained with anti-GM130 (green) and anti-BICDR1 (red) antibodies. Cells were counterstained with DAPI (blue). Scale bars, 10 um. Values are averages of the means ( n = 3) +- SD. A standard Student's t test was used to determine statistical significance.