Explore
 Validate
 Learn
Learn Western blot
Antibody data
- Antibody Data
- Antigen structure
- References [3]
- Comments [0]
- Validations
- Western blot [1]
- Other assay [8]
Submit
Validation data
Reference
Comment
Report error
- Product number
- PA5-27142 - Provider product page

- Provider
- Invitrogen Antibodies
- Product name
- FOXD1 Polyclonal Antibody
- Antibody type
- Polyclonal
- Antigen
- Synthetic peptide
- Description
- Recommended positive controls: 293T. Predicted reactivity: Mouse (100%), Rat (100%). Store product as a concentrated solution. Centrifuge briefly prior to opening the vial.
- Reactivity
- Human
- Host
- Rabbit
- Isotype
- IgG
- Vial size
- 100 µL
- Concentration
- 1 mg/mL
- Storage
- Store at 4°C short term. For long term storage, store at -20°C, avoiding freeze/thaw cycles.
Submitted references USP21 promotes self-renewal and tumorigenicity of mesenchymal glioblastoma stem cells by deubiquitinating and stabilizing FOXD1.
FOXD1 and Gal-3 Form a Positive Regulatory Loop to Regulate Lung Cancer Aggressiveness.
Up-regulation of FOXD1 by YAP alleviates senescence and osteoarthritis.
Zhang Q, Chen Z, Tang Q, Wang Z, Lu J, You Y, Wang H
Cell death & disease 2022 Aug 16;13(8):712
Cell death & disease 2022 Aug 16;13(8):712
FOXD1 and Gal-3 Form a Positive Regulatory Loop to Regulate Lung Cancer Aggressiveness.
Li CH, Chang YC, Hsiao M, Liang SM
Cancers 2019 Nov 28;11(12)
Cancers 2019 Nov 28;11(12)
Up-regulation of FOXD1 by YAP alleviates senescence and osteoarthritis.
Fu L, Hu Y, Song M, Liu Z, Zhang W, Yu FX, Wu J, Wang S, Izpisua Belmonte JC, Chan P, Qu J, Tang F, Liu GH
PLoS biology 2019 Apr;17(4):e3000201
PLoS biology 2019 Apr;17(4):e3000201
No comments: Submit comment
Supportive validation
- Submitted by
- Invitrogen Antibodies (provider)
- Main image

- Experimental details
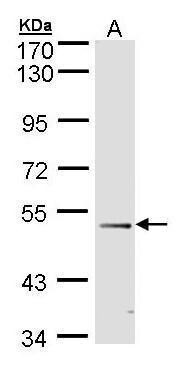
- Western Blot using FOXD1 Polyclonal Antibody (Product # PA5-27142). Sample. A: 30 µg of 293T nuclear extract. 10% SDS PAGE. FOXD1 Polyclonal Antibody (Product # PA5-27142) diluted at 1:500.
Supportive validation
- Submitted by
- Invitrogen Antibodies (provider)
- Main image
- Experimental details
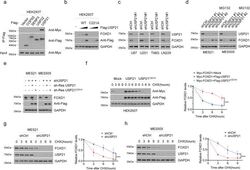
- Fig. 1 USP21 maintains FOXD1 stability. a Co-IP showing that FOXD1 was physically conjugated with USP21 among the predicated proteins(COPS5, SENP3, USP22, USP21). Anti-Flag antibody was used to bind Flag-tagged USP21 WT or C221A. Anti-Myc antibody was used to bind Myc-tagged FOXD1. b Western blotting showing that transiently transfecting of USP21-overexpressing plasmid altered the expression of FOXD1 in a dose-dependent manner. c Western blotting showing that knockdown of USP21 attenuated the protein expression of FOXD1 in U87, U251, T98G and LN229 GBM cell lines. d Western blotting shows that knockdown of USP21 attenuated the expression of FOXD1 in MES 21 and 505 GSCs, whereas treatment with MG-132 (20 muM) abolished the effect of the knockdown of USP21 in MES 21 and 505 GSCs thus increasing the expression of FOXD1. e Western blotting showing that the overexpression of an shRNA-resistant WT, but not C221A mutant, USP21 altered the effect of the knockdown of USP21 in MES 21 and 505 GSCs thus increasing the expression of FOXD1. f Western blotting showing that the overexpression of wild-type USP21 (USP21 WT) but not the catalytically inactive USP21 mutant (USP21 C221A) stabilized FOXD1. *** P < 0.001. g , h Western blotting showing that the knockdown of USP21 in MES 21 ( g ) and 505 ( h ) GSCs resulted in accelerated degradation of FOXD1. *** P < 0.001.
- Submitted by
- Invitrogen Antibodies (provider)
- Main image

- Experimental details
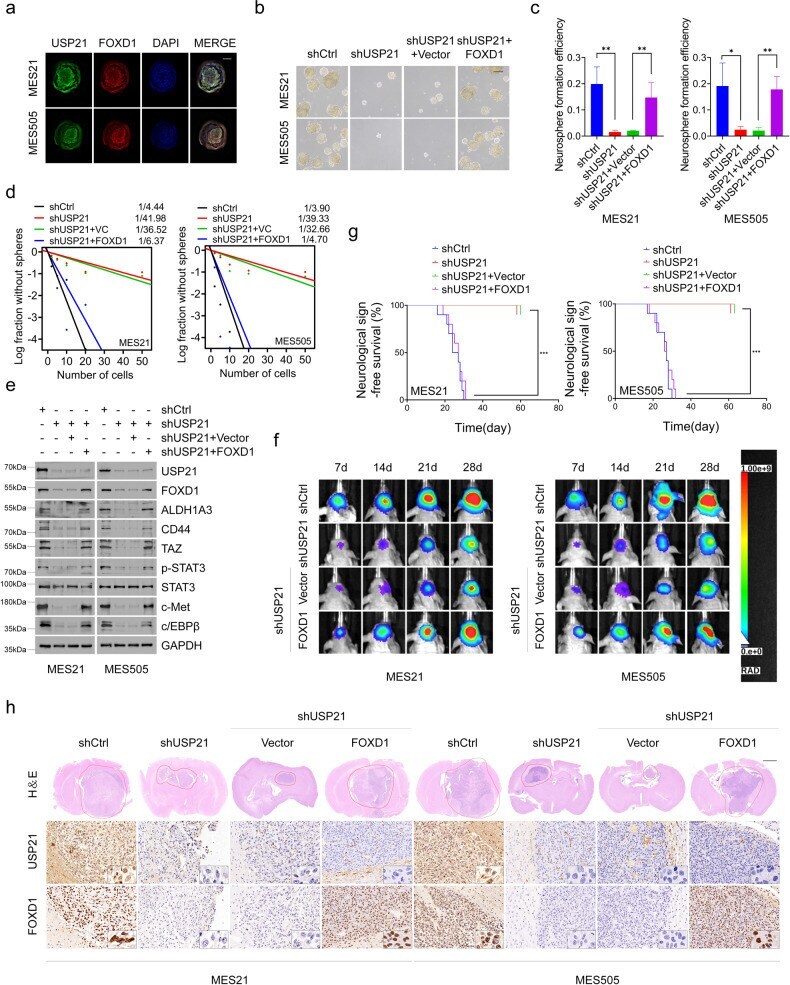
- Fig. 4 USP21 regulates self-renewal and tumorigenicity of MES GSCs. a Immunofluorescence assays showing that USP21 colocalizes with FOXD1 in the nuclei of MES 21 and 505 GSCs. Scale bar: 30 mum ( b , c ). Primary neurosphere formation showing that the silencing of USP21 considerably attenuated cell growth, and the effect of USP21-knockdown could be largely rescued by FOXD1. Right panel ( c ) showing the quantification of neurosphere formation efficiency (spheres/cells plated). Data are shown as mean +- S.D., n = 3, * P < 0.05, ** P < 0.01, Student's t -test. d In vitro limiting dilution sphere-forming frequency showing that the knockdown of USP21 remarkably reduced the tumorsphere formation frequency of MES21 and 505 GSCs, and the effect of USP21-knockdown could be rescued by FOXD1. Stem cell frequencies were estimated as the ratio 1/x with the upper and lower 95% confidence intervals, where 1 = stem cell and x = all cells. * P < 0.05. e Western blotting showing that the USP21/FOXD1 axis has great importance in the maintenance of core MES-specific markers, including ALDH1A3, CD44, C/EBPbeta, TAZ, phosphorylated STAT3 (p-STAT3), and c-MET. f Representative bioluminescent images showing that USP21-knockdown MES 21 and 505 GSCs had lower tumorigenicity abilities than control GSCs while the tumorigenicity abilities could be rescued by FOXD1. n = 10. g Kaplan-Meier survival curves showing that mice bearing xenograft tumors formed by USP21-knockdown GSCs had a longer lifespan than
- Submitted by
- Invitrogen Antibodies (provider)
- Main image

- Experimental details
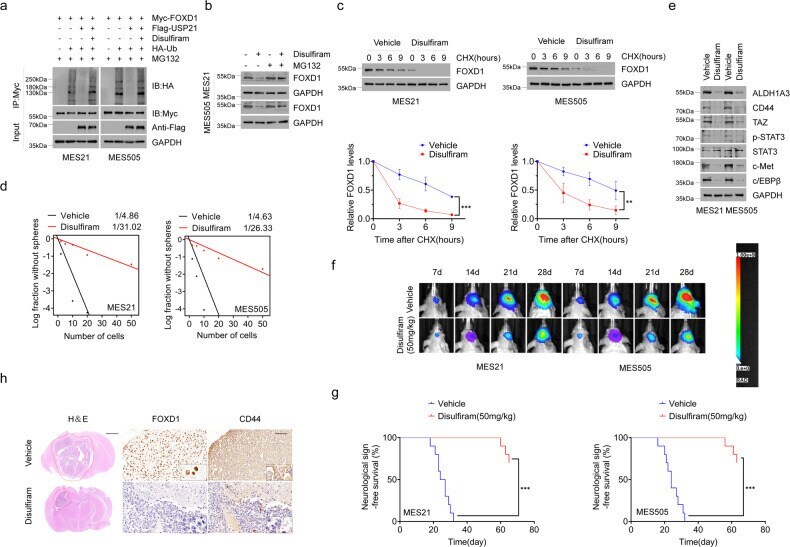
- Pharmacological inhibition of USP21 by disulfiram promotes FOXD1 ubiquitination and retards tumor growth. a Co-IP showing that the ability of USP21 to remove ubiquitin moieties from polyubiquitinated FOXD1 was almost completely abrogated by disulfiram. b Western blotting showing that disulfiram, like USP21 knockdown, promotes FOXD1 ubiquitination and degradation. c Western blotting showing that disulfiram induced a marked decrease in the stabilization of FOXD1 protein. *** P < 0.001, ** P < 0.01. d In vitro limiting dilution sphere-forming frequency showing that the disulfiram treatment reduced the tumorsphere formation frequency of MES21 and 505 GSCs. ** P < 0.01. e Western blotting showing that disulfiram treatment notably inhibited the core MES GSC markers including ALDH1A3, CD44, TAZ, p-STAT3, c-MET and c/EBPbeta. f Representative bioluminescent images showing that tumor-bearing mice receiving disulfiram treatment showed retarded tumor growth compared with vehicle-treated mice. n = 10. g Kaplan-Meier survival curves showing that mice bearing xenograft tumors receiving disulfiram treatment had a shorter lifespan than vehicle-treated mice. n = 10, *** P < 0.001, Log-rank test. h Representative H&E and IHC images showing that disulfiram attenuated the tumor growth and the expression of FOXD1 and CD44 in tumor tissues.
- Submitted by
- Invitrogen Antibodies (provider)
- Main image
- Experimental details
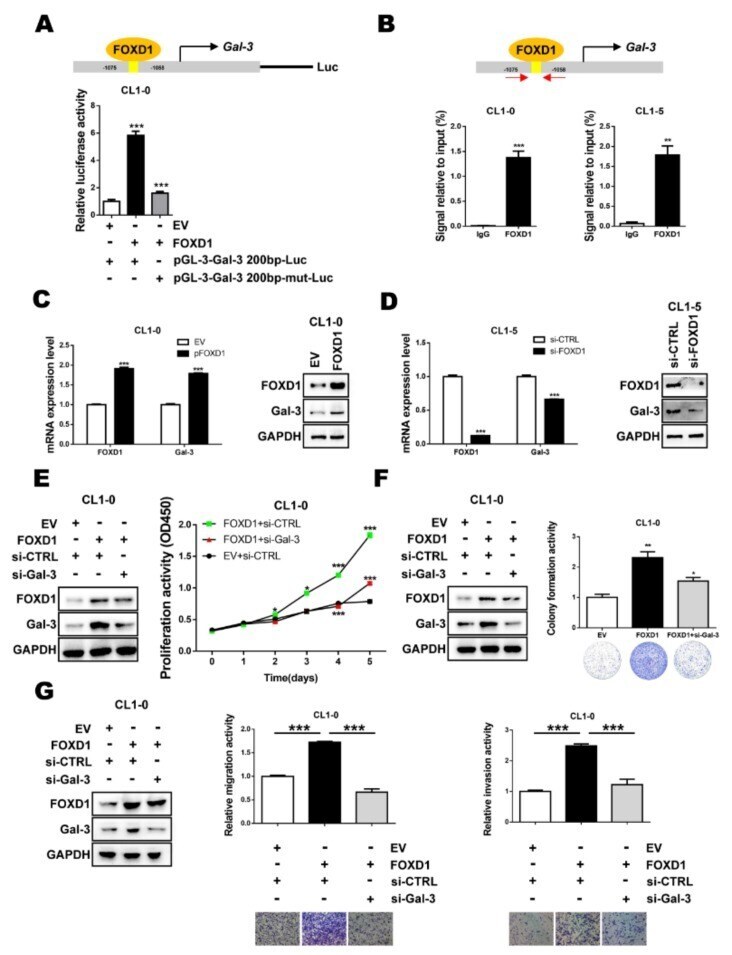
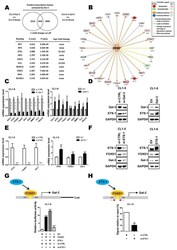
- Figure 2 FOXD1 is a transcription factor of Gal-3. ( A ) CL1-0 cells were co-transfected with plasmids of the Gal-3 promoter reporter (pGL3- Gal-3 2000 bp) or Gal-3 promoter mutation reporter (pGL3- Gal-3 2000 bp-mut) and FOXD1 ( pFOXD1 ). The cell lysates were collected, and the promoter activity of Gal-3 was analyzed by luciferase assay. ( B ) ChIP-qPCR assay using IgG as a control or FOXD1 antibody in CL1-0 and CL1-5 showed the binding of FOXD1 on the Gal-3 promoter. ( C ) CL1-0 cells transfected with the empty vector or plasmid of FOXD1 ( pFOXD1 ) for 48 h and ( D ) CL1-5 cells transfected with scramble or siRNA targeting FOXD1 (si- FOXD1 ) for 72 h were collected. The mRNA and protein levels of FOXD1 and Gal-3 were analyzed by qPCR (left) and immunoblotting (right), respectively. ( E ) CCK-8 assay in different groups. FOXD1-stimulated CL1-0 proliferation ability was reduced by knocking down Gal-3 . ( F ) The colony-formation ability of FOXD1-stimulated CL1-0 cells was suppressed by the depletion of Gal-3. ( G ) The numbers of migrating or invading cells were increased in the FOXD1 group compared with the FOXD1-stimulated CL1-0-si Gal-3 group and control group.
- Submitted by
- Invitrogen Antibodies (provider)
- Main image
- Experimental details
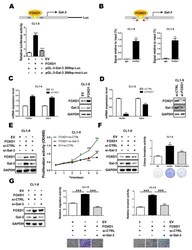
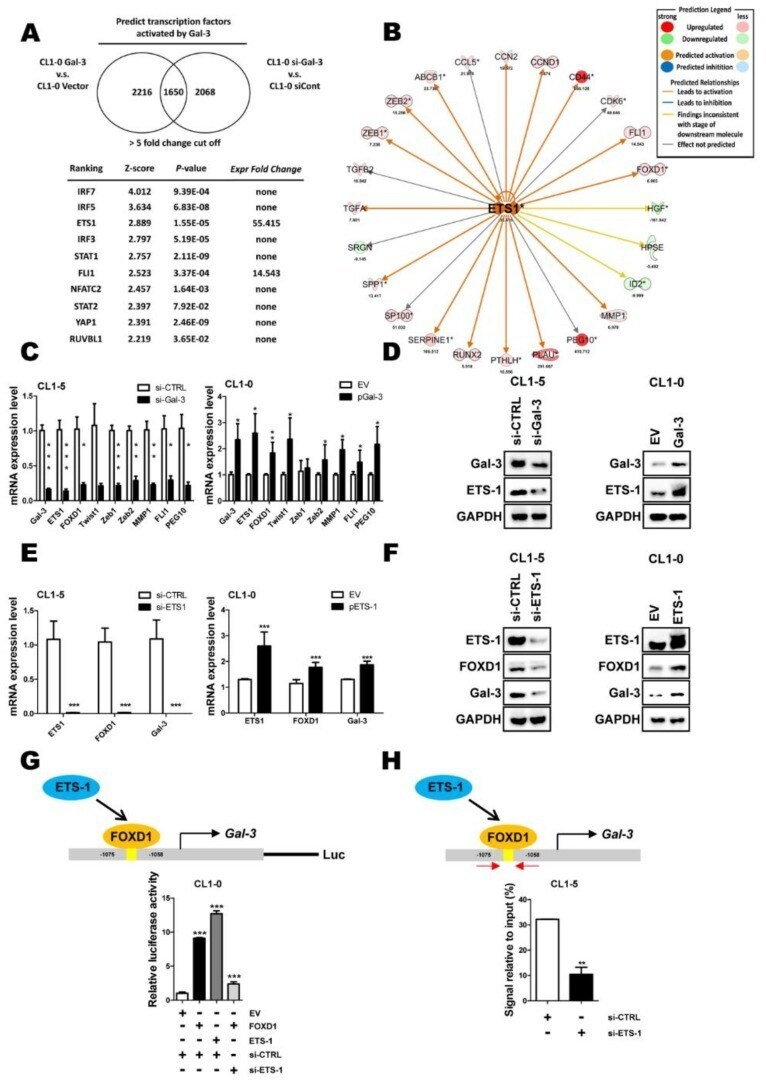
- Figure 3 Proto-oncogene 1 (ETS-1) is involved in Gal-3-mediated FOXD1 expression. ( A ) The ranking of candidate transcription factors and its corresponding z-score and p -value using the IPA database from a microarray experiment performed with CL1-0 Gal-3 compared with the CL1-0 vector and CL1-5 scramble compared with CL1-5 si- Gal-3 using a 5-fold change cut-off. ( B ) Statistical p -values and fold change of the expressions of ETS-1 ( ets-1 ) and its relative molecules are shown. Prediction legend: upregulation (red round icon), downregulation (green round icon), predicted activation (brown round icon), predicted inhibition (blue round icon), leads to activation (brown line), leads to inhibition (blue line), findings inconsistent with stage of downstream molecule (yellow line), effect not predicted (gray line). ( C ) CL1-0 and CL1-5 cells were transfected with specific cDNA for 48 h or siRNA for 72 h; RT-qPCR analysis of ets-1, which targets downstream mRNA expression in CL1-0 cells. ( D ) Western blot analysis of Gal-3 and ETS-1 from CL1-0 with expression of the vector control (VC) or exogenous Gal-3 gene and CL1-5 cells with scramble and siRNA targeting Gal-3 ( si-Gal-3 ). ( E , F ) CL1-0 and CL1-5 cells were transfected with the empty vector or plasmid of Gal-3 ( p Ets- 1 ) for 48 h or scramble and siRNA targeting ETS-1 ( si- ets-1 ) for 72 h, respectively, as indicated. The mRNA and protein levels of ETS-1, FOXD1, and Gal-3 were analyzed by qPCR and immunoblotting, res
- Submitted by
- Invitrogen Antibodies (provider)
- Main image
- Experimental details
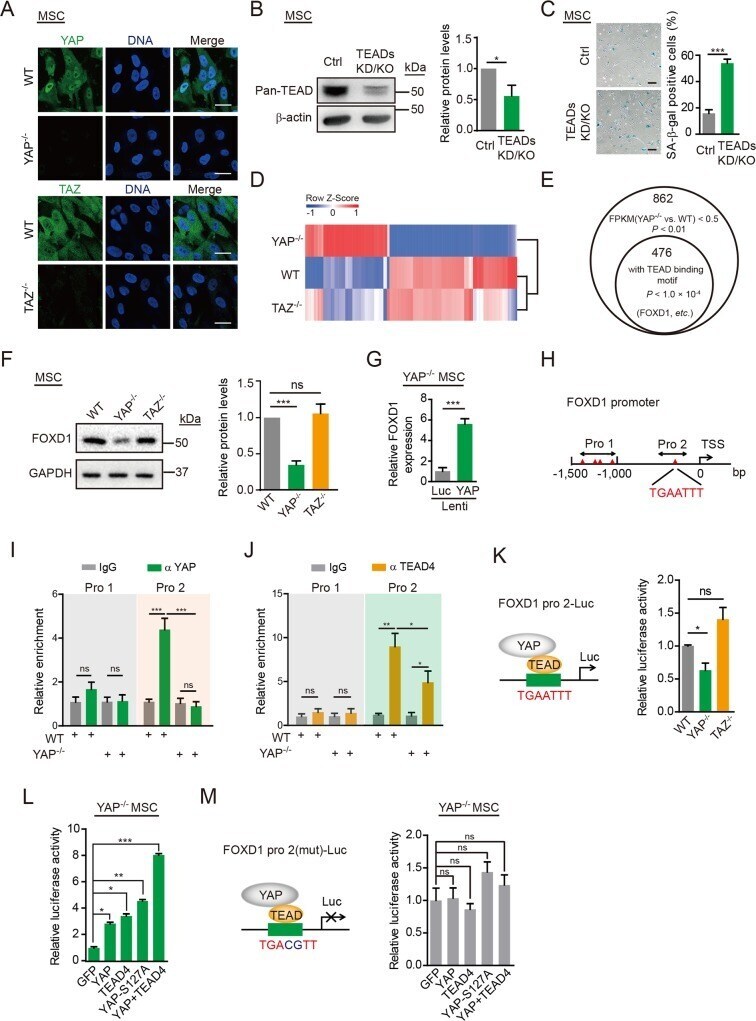
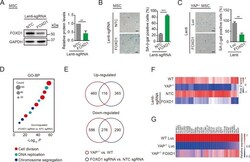
- Fig 3 YAP transcriptionally induces FOXD1 expression. (A) Immunofluorescence analysis of YAP in WT and YAP -/- hMSCs, and TAZ in WT and TAZ -/- hMSCs. Scale bar, 25 mum. (B) Western blot analysis of pan-TEAD proteins in Ctrl and TEADs KD/KO hMSCs. beta-actin was used as a loading Ctrl (left). The protein levels normalized with beta-actin were shown as fold change relative to Ctrl hMSCs (right). Data are presented as the mean +- SD, n = 3, * P < 0.05. (C) SA-beta-gal staining of Ctrl and TEADs KD/KO hMSCs. Scale bar, 100 mum. Data are presented as the mean +- SD, n = 3, *** P < 0.001. (D) A heat map showing relative mRNA expression levels of the differentially expressed genes in YAP -/- hMSCs. Genes were sorted by the fold change and P value (fold change > 2 or < 0.5, P < 0.01). Corresponding gene expression profiles obtained from TAZ -/- hMSCs were also shown. (E) The bioinformatics analysis predicted that 476 (55%) of 862 genes down-regulated in YAP -/- hMSCs were potential YAP-TEAD targets. Among these genes, FOXD1 was the most down-regulated gene. (F) Western blot analysis of FOXD1 in WT, YAP -/- , and TAZ -/- hMSCs. GAPDH was used as a loading Ctrl (left). The protein levels normalized with GAPDH were shown as fold change relative to WT hMSCs (right). Data are presented as the mean +- SD. n = 3, *** P < 0.001. (G) RT-qPCR showing elevated expression of FOXD1 in YAP -/- hMSCs transduced with a lentivirus encoding YAP. Data are presented a
- Submitted by
- Invitrogen Antibodies (provider)
- Main image
- Experimental details
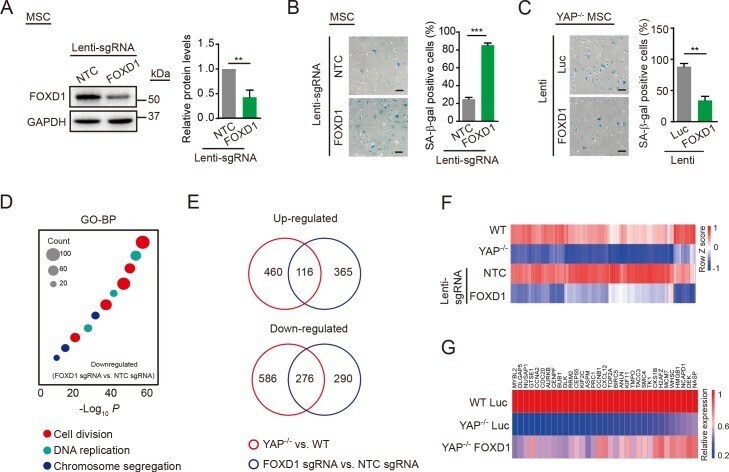
- Fig 4 FOXD1 mediates YAP deficiency-induced senescence. (A) Western blot analysis of FOXD1 in hMSCs transduced with lentiviruses expressing NTC or FOXD1 sgRNA, as well as CRISPR/Cas9. GAPDH was used as a loading control (left). The protein levels normalized with GAPDH were shown as fold change relative to lenti-NTC sgRNA transduced hMSCs (right). Data are presented as the mean +- SD, n = 3, ** P < 0.01. (B) SA-beta-gal staining of hMSCs transduced with lentiviruses expressing NTC or FOXD1 sgRNA, as well as CRSPR/Cas9. Scale bar, 100 mum. Data are presented as the mean +- SD, n = 3, *** P < 0.001. (C) SA-beta-gal staining of YAP -/- hMSCs transduced with lentiviruses expressing Luc or FOXD1. Scale bar, 100 mum. Data are presented as the mean +- SD, n = 3, ** P < 0.01. (D) GO-BP enrichment analysis of down-regulated genes in FOXD1 KO hMSCs. (E) Venn diagram showing differentially expressed genes in both YAP -/- hMSCs (relative to WT) and FOXD1 KO hMSCs (relative to NTC). (F) RNA-seq heat map of the genes that were down-regulated both in YAP -/- and FOXD1 KO hMSCs. (G) RT-qPCR heat map showing the rescue of aging-associated genes by FOXD1 overexpression in YAP -/- hMSCs. The numerical data underlying this figure are included in S8 Data . ANLN, anillin actin binding protein; ASPM, abnormal spindle microtubule assembly; AURKB, aurora kinase B; BIRC5, baculoviral IAP repeat containing 5; BP, biological process; BUB1, BUB1 mitotic checkpoint serine/threonine k
- Submitted by
- Invitrogen Antibodies (provider)
- Main image

- Experimental details
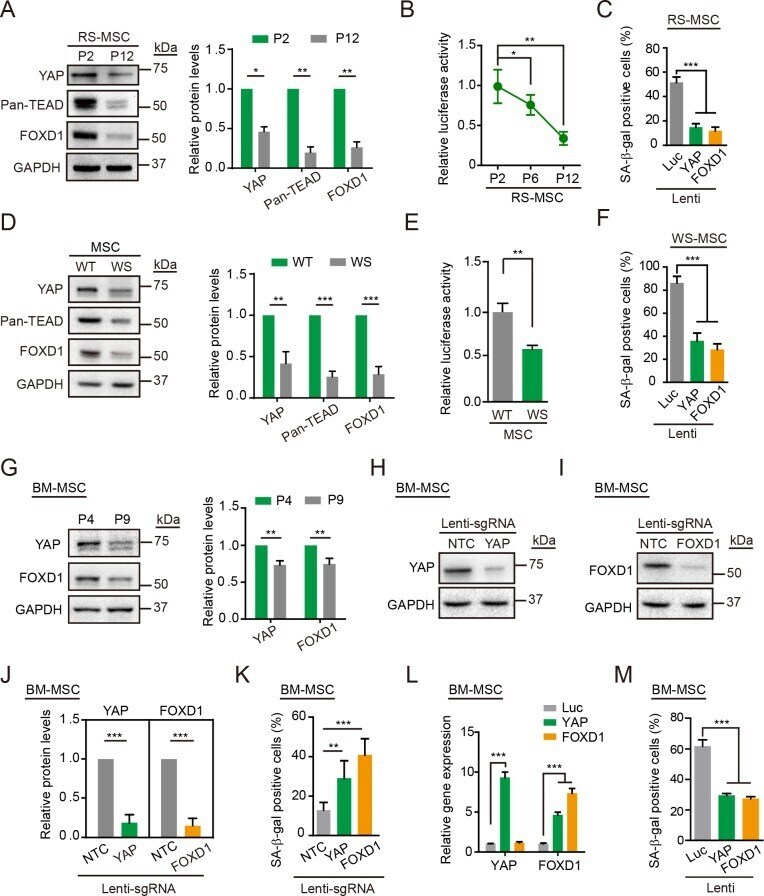
- Fig 5 The YAP-FOXD1 axis counteracts replicative and pathological senescence. (A) Western blot analysis of YAP, Pan-TEAD, and FOXD1 in RS hMSCs. GAPDH was used as a loading control. The protein levels normalized with GAPDH were shown as fold change relative to P2 hMSCs (right). Data are presented as the mean +- SD, n = 3, * P < 0.05, ** P < 0.01. (B) The 8 x GTIIC-Luc activity detected in RS hMSCs. Data are presented as the mean +- SD, n = 3, * P < 0.05, ** P < 0.01. (C) SA-beta-gal staining of RS hMSCs transduced with lentiviruses expressing Luc, YAP, or FOXD1. Data are presented as the mean +- SD, n = 3, *** P < 0.001. (D) Western blot analysis of YAP, Pan-TEAD, and FOXD1 in WT and WS hMSCs. GAPDH was used as a loading control (left). The protein levels normalized with GAPDH were shown as fold change relative to WT hMSCs (right). Data are presented as the mean +- SD, n = 3, ** P < 0.01, *** P < 0.001. (E) The 8 x GTIIC-Luc activity determined in WT and WS hMSCs. Data are presented as the mean +- SD, n = 3, ** P < 0.01. (F) SA-beta-gal staining of WS hMSCs transduced with lentiviruses expressing Luc, YAP, or FOXD1. Data are presented as the mean +- SD, n = 3, *** P < 0.001. (G) Western blot analysis of YAP and FOXD1 in RS BM-hMSCs. GAPDH was used as a loading control (left). The protein levels normalized with GAPDH were shown as fold change relative to P4 BM-hMSCs (right). Data are presented as the mean +- SD, n = 3, ** P < 0.01. (H) Western blot ana