Explore
 Validate
 Learn
LearnPA5-46931
antibody from Invitrogen Antibodies
Targeting: CLU
APOJ, CLI, CLU1, CLU2, KUB1, SGP-2, SP-40, TRPM-2
 Western blot
 ELISA
ELISA Immunocytochemistry
Antibody data
- Antibody Data
- Antigen structure
- References [2]
- Comments [0]
- Validations
- Immunocytochemistry [2]
- Immunohistochemistry [2]
- Other assay [3]
Submit
Validation data
Reference
Comment
Report error
- Product number
- PA5-46931 - Provider product page

- Provider
- Invitrogen Antibodies
- Product name
- Apolipoprotein J Polyclonal Antibody
- Antibody type
- Polyclonal
- Antigen
- Recombinant full-length protein
- Description
- In sandwich ELISAs, approximately 5% cross-reactivity with recombinant human Clusterin is observed. Reconstitute at 0.2 mg/mL in sterile PBS.
- Reactivity
- Human, Mouse
- Host
- Goat
- Isotype
- IgG
- Vial size
- 100 μg
- Concentration
- 0.2 mg/mL
- Storage
- -20°C, Avoid Freeze/Thaw Cycles
Submitted references Isolation, culture, and cryosectioning of primary porcine retinal pigment epithelium on transwell cell culture inserts.
Sterol O-acyltransferase 2 chaperoned by apolipoprotein J facilitates hepatic lipid accumulation following viral and nutrient stresses.
Hood EMS, Curcio CA, Lipinski D
STAR protocols 2022 Dec 16;3(4):101758
STAR protocols 2022 Dec 16;3(4):101758
Sterol O-acyltransferase 2 chaperoned by apolipoprotein J facilitates hepatic lipid accumulation following viral and nutrient stresses.
Sun HY, Chen TY, Tan YC, Wang CH, Young KC
Communications biology 2021 May 12;4(1):564
Communications biology 2021 May 12;4(1):564
No comments: Submit comment
Supportive validation
- Submitted by
- Invitrogen Antibodies (provider)
- Main image
- Experimental details
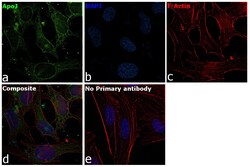
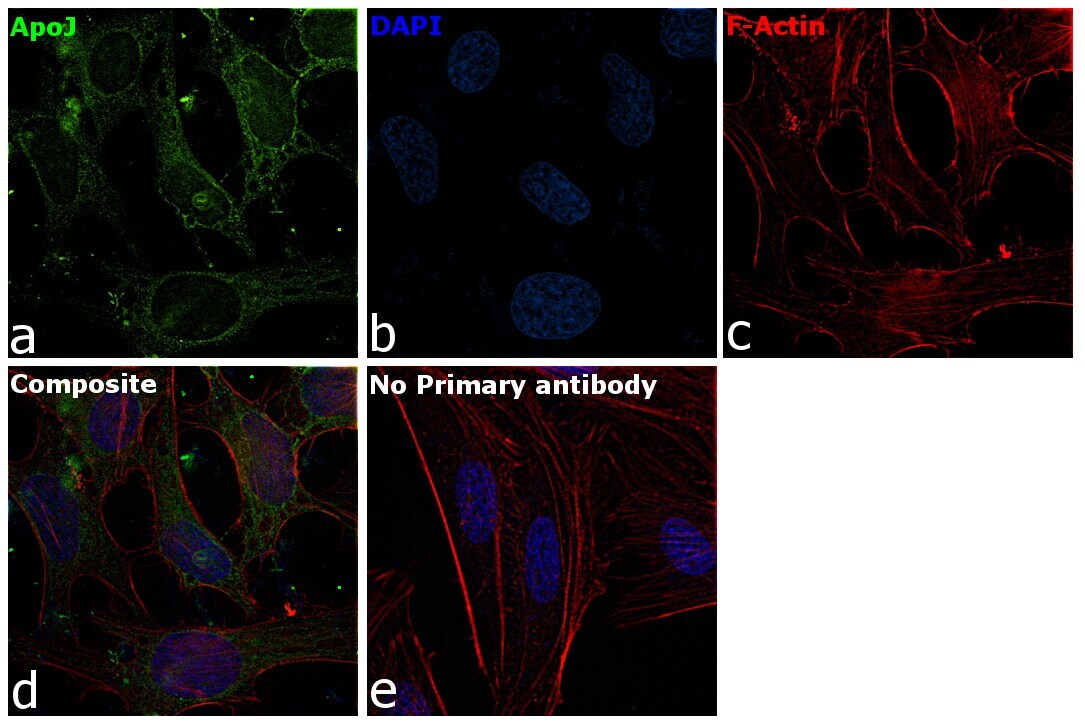
- Immunofluorescence analysis of Apolipoprotein J was performed using HeLa cells. The cells were fixed with 4% paraformaldehyde for 10 minutes, permeabilized with 0.1% Triton™ X-100 for 15 minutes, and blocked with 2% BSA for 1 hour at room temperature. The cells were labeled with Apolipoprotein J Goat Polyclonal Antibody (Product # PA5-46931) at 5 µg/mL in 0.1% BSA and incubated overnight at 4 degree and then labeled with Rabbit anti-Goat IgG (H+L) Superclonal™ Recombinant Secondary Antibody, Alexa Fluor® 488 conjugate (Product # A27012) at a dilution of 1:2000 for 45 minutes at room temperature (Panel a: green) in HeLa cells. Nuclei (Panel b: blue) were stained with ProLong™ Diamond Antifade Mountant with DAPI (Product # P36962). F-actin (Panel c: red) was stained with Rhodamine Phalloidin (Product # R415, 1:300). Panel d represents the merged image of HeLa cells showing cytoplasmic and nuclear localization. Panel e represents control cells with no primary antibody to assess background. The images were captured at 60X magnification.
- Submitted by
- Invitrogen Antibodies (provider)
- Main image

- Experimental details
- Immunofluorescence analysis of Apolipoprotein J was performed using HeLa cells. The cells were fixed with 4% paraformaldehyde for 10 minutes, permeabilized with 0.1% Triton™ X-100 for 15 minutes, and blocked with 2% BSA for 1 hour at room temperature. The cells were labeled with Apolipoprotein J Goat Polyclonal Antibody (Product # PA5-46931) at 5 µg/mL in 0.1% BSA and incubated overnight at 4 degree and then labeled with Rabbit anti-Goat IgG Heavy Chain Superclonal™ Recombinant Secondary Antibody, Alexa Fluor® 488 conjugate (Product # A27012) at a dilution of 1:2000 for 45 minutes at room temperature (Panel a: green) in HeLa cells. Nuclei (Panel b: blue) were stained with ProLong™ Diamond Antifade Mountant with DAPI (Product # P36962). F-actin (Panel c: red) was stained with Rhodamine Phalloidin (Product # R415, 1:300). Panel d represents the merged image of HeLa cells showing cytoplasmic and nuclear localization. Panel e represents control cells with no primary antibody to assess background. The images were captured at 60X magnification.

Supportive validation
- Submitted by
- Invitrogen Antibodies (provider)
- Main image
- Experimental details
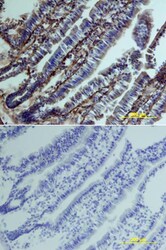
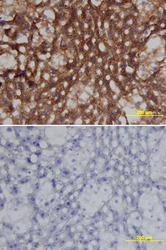
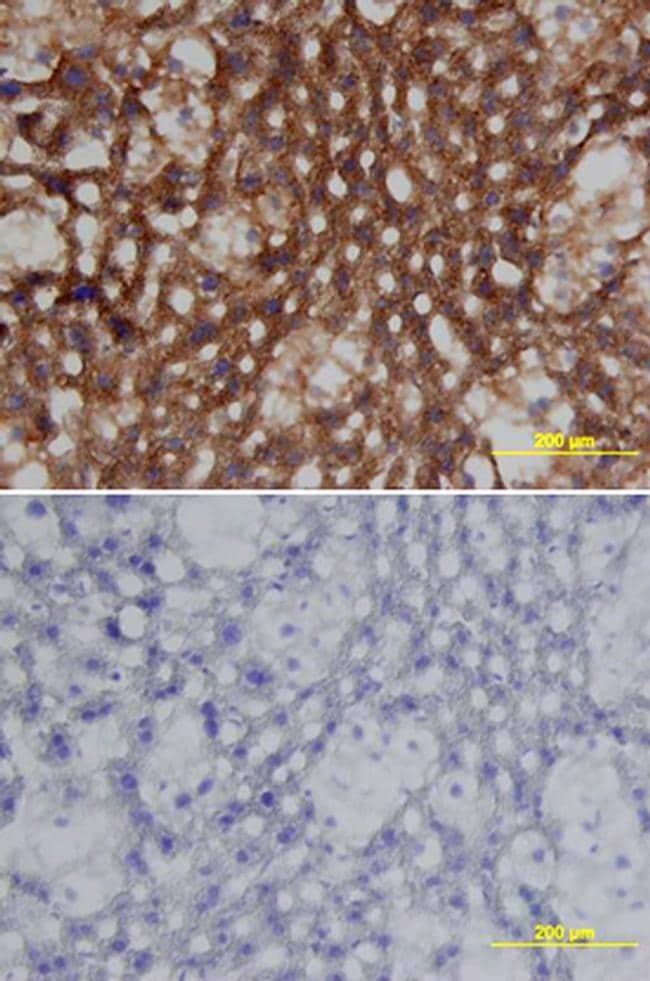
- Immunohistochemical analysis of Clusterin was detected in perfusion fixed frozen sections of mouse intestine using Goat Anti-mouse Clusterin Antigen Affinity-purified Polyclonal Antibody (Product # PA5-46931) at 15 µg/mL overnight at 4 °C. Tissue was stained using the Anti-Goat HRP-DAB (brown and counterstained with hematoxylin (blue). Lower panel shows a lack of labeling if primary antibodies are omitted and tissue is stained only with secondary antibody followed by incubation with detection reagents.

- Submitted by
- Invitrogen Antibodies (provider)
- Main image
- Experimental details
- Immunohistochemical analysis of Clusterin was detected in perfusion fixed frozen sections of mouse liver using Goat Anti-mouse Clusterin Antigen Affinity-purified Polyclonal Antibody (Product # PA5-46931) at 15 µg/mL overnight at 4 °C. Tissue was stained using the Anti-Goat HRP-DAB (brown and counterstained with hematoxylin (blue). Lower panel shows a lack of labeling if primary antibodies are omitted and tissue is stained only with secondary antibody followed by incubation with detection reagents.
Supportive validation
- Submitted by
- Invitrogen Antibodies (provider)
- Main image
- Experimental details
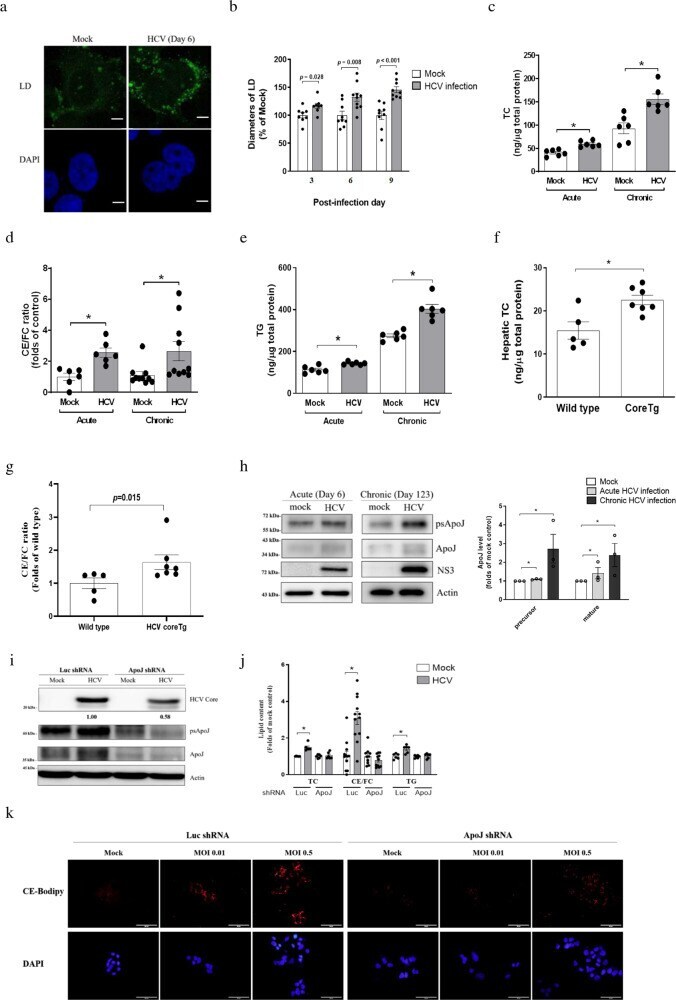
- Fig. 1 ApoJ participated in HCV-induced lipid accumulation. a Representative images of LDs in Huh7.5 cells with mock or HCV infection at day 6 post-infection. Scale bar, 5 mum. b The diameters of LDs ( n > 2000) were quantified with ImageJ software. The data were collected from three independent experiments ( n >= 8). Quantification of the intracellular contents of TC ( c ), CE/FC ratio ( d ), and TG ( e ) with acute or chronic HCV infections ( n >= 6). The hepatic TC level ( f ) and CE/FC ratio ( g ) in wild type ( n = 5) and HCV coreTg mice ( n = 7). h Protein levels of ApoJ and HCV-NS3 in Huh7.5 cells with acute or chronic HCV infections. The right panel: ApoJ intensities ( n = 3); psApoJ, ApoJ precursor. i Protein levels of ApoJ and HCV core in control and ApoJ-silenced Huh7.5 cells inoculated with HCV (MOI = 0.01) at day 6 post-infection. j TC, CE/FC ratio and TG contents and with HCV infection in the control and ApoJ-silenced Huh7.5 cells at day 6 post-infection. All results are presented as the mean +- SEM, and asterisks indicate statistical significance ( p < 0.05). k Images of LDs visualized by CholEsteryl BODIPY(tm) 542/563 C 11 tracer with MOI = 0.01 or 0.5 at post-infection day 3. Scale bar, 50 mum. Uncropped blots of h and thereafter are displayed in Supplementary Figs. 15 - 30 .
- Submitted by
- Invitrogen Antibodies (provider)
- Main image

- Experimental details
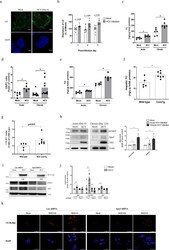
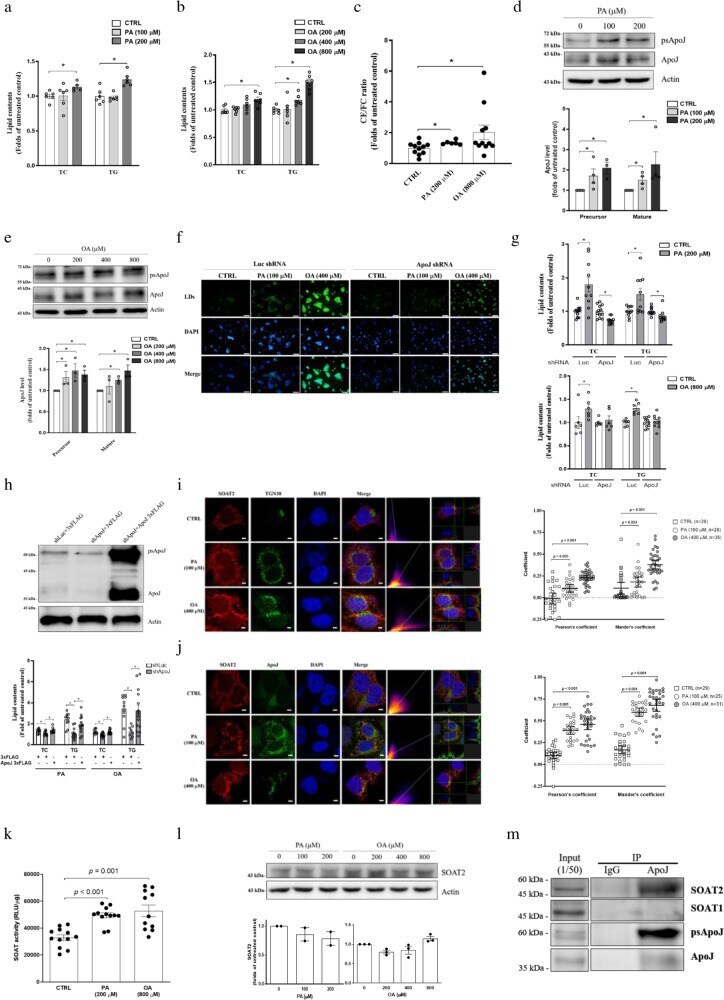
- Fig. 3 FFA-induced hepatic lipid accumulation depended on ApoJ. The cellular contents of TC and TG were quantified in Huh7 cells treated with PA ( a ) or OA ( b ) for 24 h ( n >= 5), CE/FC ratio of PA and OA treated cells ( c ) ( n >= 6), and ApoJ expression in Huh7 cells treated with PA ( d ) or OA ( e ). The lower panel: ApoJ intensities ( n = 3); psApoJ, ApoJ precursor. f Representative images of LDs stained with BODIPY493/503, and g quantification of lipid contents in Huh7.5 cells bearing Luc or ApoJ shRNA treated with PA or OA for 24 h. Scale bar, 100 mum in f . h Quantification of lipid contents in the cells transfected with ApoJ expressing plasmid or control vector. All results are normalized to the respective untreated control and presented as the mean +- SEM ( n >= 5), and asterisks indicate statistical significance ( p < 0.05). Representative IFA images of SOAT2 (red) and Golgi (TGN38, green) ( i ); SOAT2 and ApoJ (green) ( j ) in PA- or OA-treated cells were analysed by Coloc2 plugin and FVW31S software as in Fig. 2d . Scale bar, 5 mum. Asterisks indicate statistical significance ( p < 0.05). k The PA- (200 muM) or OA- (800 muM) treated Huh7 cells were fed with NBD-Chol, and the SOAT activity was evaluated and expressed as the mean +- SEM ( n = 6). l The protein level of SOAT2 in Huh7 cells treated with PA or OA for 24 h. The lower panel: SOAT2 intensities ( n >= 2). m Huh7 cells were treated with 800 muM OA for 24 h. The cell lysate was immunoprecipitated with ant
- Submitted by
- Invitrogen Antibodies (provider)
- Main image
- Experimental details
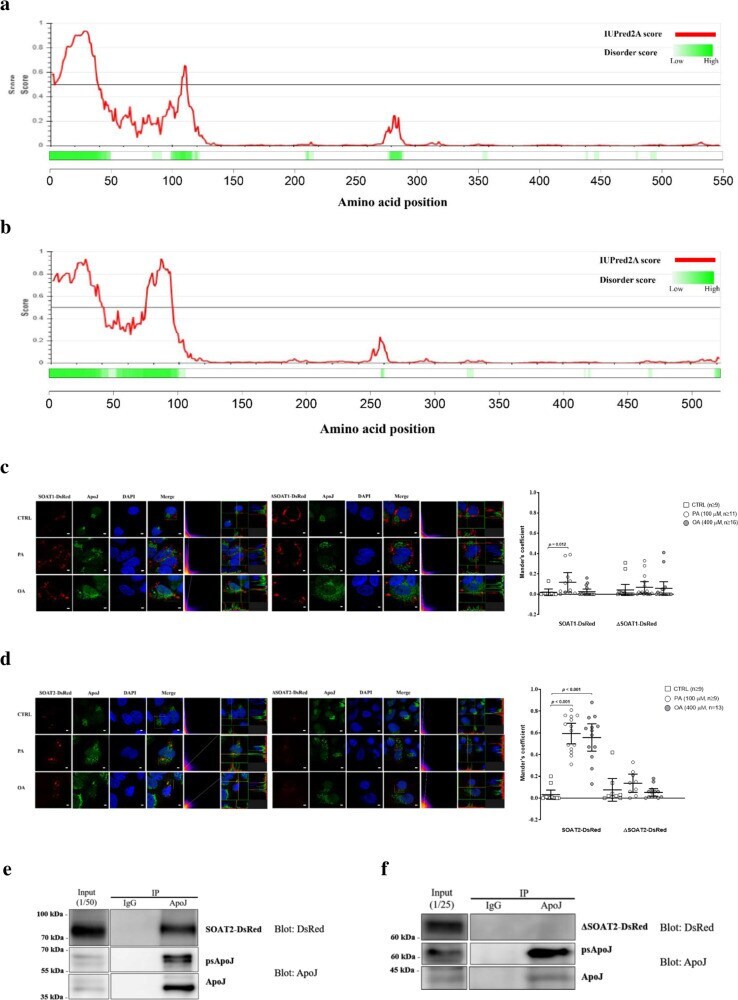
- Fig. 5 ApoJ co-localized with SOAT2 by recognizing the IDR region. The IDR regions of SOAT1 (UniProt ID: P35610, a ) and SOAT2 (UniProt ID: O75908, b ) were predicted by D 2 P 2 ( http://d2p2.pro/search ) and IUPred2A ( https://iupred2a.elte.hu/ ) algorithms, respectively. Huh7 cells were transfected with SOAT1-DsRed ( c , the left panels), IDR-truncated SOAT1-DsRed (DeltaSOAT1-DsRed, c , the right panels); SOAT2-DsRed ( d , the left panels), and IDR-truncated SOAT2-DsRed (DeltaSOAT2-DsRed, d the right panels), followed by administration of PA (100 muM) or OA (400 muM) for 24 h, and visualized with confocal microscopy. The fluorescence intensity was analysed by FVW31S software. The Mander''s coefficient was analysed by ImageJ with the Coloc2 plugin from ImageJ/Fiji shown above. Scale bar, 5 mum. Huh7 cells were transfected with plasmids encoding SOAT2-DsRed ( e ) or DeltaSOAT2-DsRed ( f ). The cell lysates were immunoprecipitated with antibody against ApoJ and examined by western blot analysis recognizing DsRed and apoJ.