Explore
 Validate
 Learn
Learn Western blot
 Immunocytochemistry
Antibody data
- Antibody Data
- Antigen structure
- References [2]
- Comments [0]
- Validations
- Immunocytochemistry [4]
- Immunohistochemistry [3]
- Other assay [2]
Submit
Validation data
Reference
Comment
Report error
- Product number
- PA5-29846 - Provider product page

- Provider
- Invitrogen Antibodies
- Product name
- TPM1 Polyclonal Antibody
- Antibody type
- Polyclonal
- Antigen
- Recombinant full-length protein
- Description
- Recommended positive controls: A431, mouse liver, rat muscle. Predicted reactivity: Mouse (99%), Rat (88%), Zebrafish (80%), Xenopus laevis (83%), Pig (88%), Rabbit (88%), Chicken (81%), Sheep (88%), Bovine (88%). Store product as a concentrated solution. Centrifuge briefly prior to opening the vial.
- Reactivity
- Human, Mouse, Rat, Porcine
- Host
- Rabbit
- Isotype
- IgG
- Vial size
- 100 μL
- Concentration
- 1.05 mg/mL
- Storage
- Store at 4°C short term. For long term storage, store at -20°C, avoiding freeze/thaw cycles.
Submitted references Physiological calcium combined with electrical pacing accelerates maturation of human engineered heart tissue.
miRNA‑183‑5p.1 promotes the migration and invasion of gastric cancer AGS cells by targeting TPM1.
Shen S, Sewanan LR, Shao S, Halder SS, Stankey P, Li X, Campbell SG
Stem cell reports 2022 Sep 13;17(9):2037-2049
Stem cell reports 2022 Sep 13;17(9):2037-2049
miRNA‑183‑5p.1 promotes the migration and invasion of gastric cancer AGS cells by targeting TPM1.
Lin J, Shen J, Yue H, Cao Z
Oncology reports 2019 Dec;42(6):2371-2381
Oncology reports 2019 Dec;42(6):2371-2381
No comments: Submit comment
Supportive validation
- Submitted by
- Invitrogen Antibodies (provider)
- Main image
- Experimental details
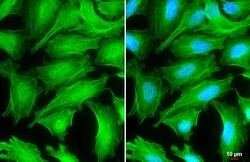
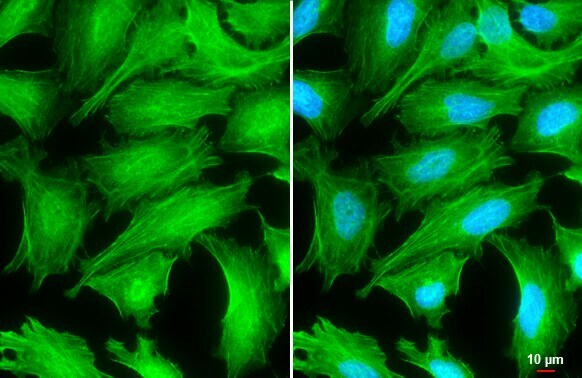
- TPM1 Polyclonal Antibody detects Tropomyosin 1 protein at cytoskeleton by immunofluorescent analysis. Sample: HeLa cells were fixed in 4% paraformaldehyde at RT for 15 min. Green: Tropomyosin 1 stained by TPM1 Polyclonal Antibody (Product # PA5-29846) diluted at 1:500. Blue: Fluoroshield with DAPI . Scale bar= 10 µm.

- Submitted by
- Invitrogen Antibodies (provider)
- Main image

- Experimental details
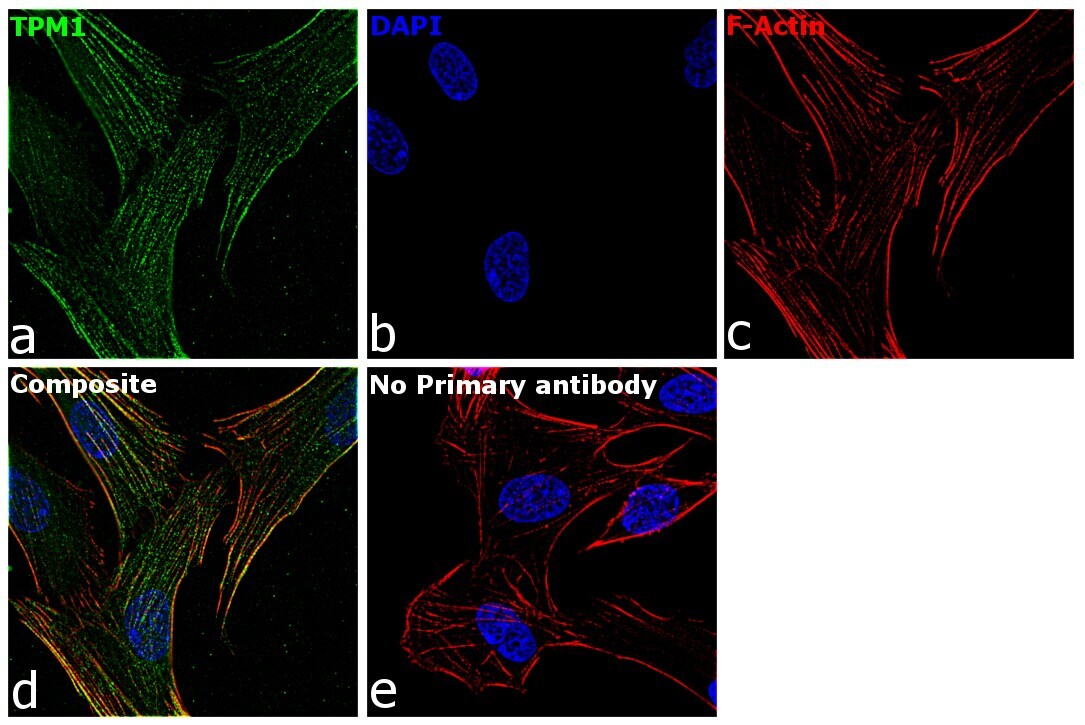
- Immunofluorescence analysis of TPM1 was performed using 70% confluent log phase HSkMs cells. The cells were fixed with 4% paraformaldehyde for 10 minutes, permeabilized with 0.1% Triton™ X-100 for 15 minutes, and blocked with 1% BSA for 1 hour at room temperature. The cells were labeled with TPM1 Rabbit Polyclonal Antibody (Product # PA5-29846) at 5 microgram/mL in 0.1% BSA, incubated at 4 degree Celsius overnight and then labeled with Goat anti-Rabbit IgG (H+L) Superclonal™ Secondary Antibody, Alexa Fluor® 488 conjugate (Product # A27034) at a dilution of 1:2000 for 45 minutes at room temperature (Panel a: green). Nuclei (Panel b: blue) were stained with ProLong™ Diamond Antifade Mountant with DAPI (Product # P36962). F-actin (Panel c: red) was stained with Rhodamine Phalloidin (Product # R415). Panel d represents the merged image showing Cytoskeletal localization. Panel e represents control cells with no primary antibody to assess background. The images were captured at 60X magnification.

- Submitted by
- Invitrogen Antibodies (provider)
- Main image

- Experimental details
- TPM1 Polyclonal Antibody detects Tropomyosin 1 protein at cytoskeleton by immunofluorescent analysis. Sample: HeLa cells were fixed in 4% paraformaldehyde at RT for 15 min. Green: Tropomyosin 1 stained by TPM1 Polyclonal Antibody (Product # PA5-29846) diluted at 1:500. Blue: Fluoroshield with DAPI . Scale bar= 10 µm.
- Submitted by
- Invitrogen Antibodies (provider)
- Main image

- Experimental details
- Immunofluorescence analysis of TPM1 was performed using 70% confluent log phase HSkMs cells. The cells were fixed with 4% paraformaldehyde for 10 minutes, permeabilized with 0.1% Triton™ X-100 for 15 minutes, and blocked with 1% BSA for 1 hour at room temperature. The cells were labeled with TPM1 Rabbit Polyclonal Antibody (Product # PA5-29846) at 5 microgram/mL in 0.1% BSA, incubated at 4 degree Celsius overnight and then labeled with Goat anti-Rabbit IgG (Heavy Chain) Superclonal™ Secondary Antibody, Alexa Fluor® 488 conjugate (Product # A27034) at a dilution of 1:2000 for 45 minutes at room temperature (Panel a: green). Nuclei (Panel b: blue) were stained with ProLong™ Diamond Antifade Mountant with DAPI (Product # P36962). F-actin (Panel c: red) was stained with Rhodamine Phalloidin (Product # R415). Panel d represents the merged image showing Cytoskeletal localization. Panel e represents control cells with no primary antibody to assess background. The images were captured at 60X magnification.
Supportive validation
- Submitted by
- Invitrogen Antibodies (provider)
- Main image
- Experimental details
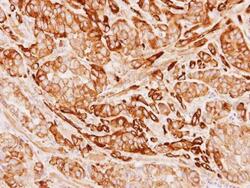
- Immunohistochemical analysis of paraffin-embedded A549 xenograft, using Tropomyosin 1 (Product # PA5-29846) antibody at 1:500 dilution. Antigen Retrieval: EDTA based buffer, pH 8.0, 15 min.

- Submitted by
- Invitrogen Antibodies (provider)
- Main image

- Experimental details
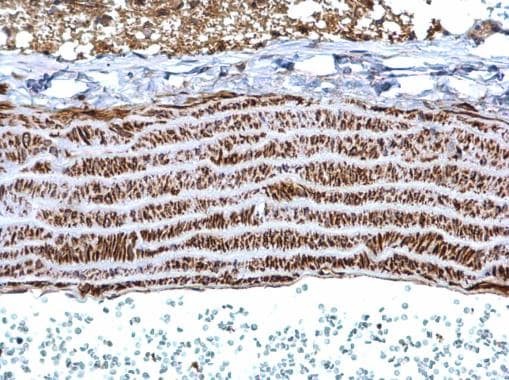
- TPM1 Polyclonal Antibody detects Tropomyosin 1 protein at cytosol on mouse vein by immunohistochemical analysis. Sample: Paraffin-embedded mouse vein. TPM1 Polyclonal Antibody (Product # PA5-29846) dilution: 1:500. Antigen Retrieval: EDTA based buffer, pH 8.0, 15 min.
- Submitted by
- Invitrogen Antibodies (provider)
- Main image
- Experimental details
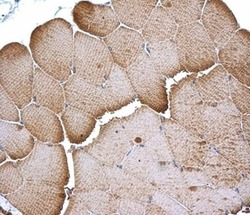
- TPM1 Polyclonal Antibody detects Tropomyosin 1 protein at cytosol on mouse vein by immunohistochemical analysis. Sample: Paraffin-embedded mouse vein. TPM1 Polyclonal Antibody (Product # PA5-29846) dilution: 1:500. Antigen Retrieval: EDTA based buffer, pH 8.0, 15 min.
Supportive validation
- Submitted by
- Invitrogen Antibodies (provider)
- Main image
- Experimental details
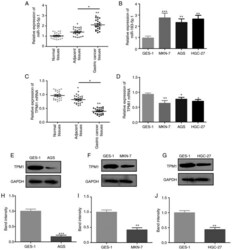
- Figure 1. Expression of miR-183-5p.1 and TPM1 in GC cells and tissues. miR-183-5p.1 levels in (A) normal tissues, adjacent tissues, GC tissues and (B) normal gastric epithelial cells (GES-1) and GC cell lines (MKN-7, AGS, HGC-27) were determined by RT-qPCR. TPM1 mRNA expression in (C) normal tissues, adjacent tissues, GC tissues and (D) GES-1, MKN-7, AGS, HGC-27 cells as quantified by RT-qPCR. (E) TPM1 protein expression in GES-1 and AGS cells was determined by western blotting and (H) statistically analyzed. (F) TPM1 protein expression in GES-1 and MKN-7 cells was determined by western blotting and (I) statistically analyzed. (G) TPM1 protein expression in GES-1 and HGC-27 cells was determined by western blotting and (J) statistically analyzed. Results are presented as the mean +- standard error of the mean (n=3) *P

- Submitted by
- Invitrogen Antibodies (provider)
- Main image

- Experimental details
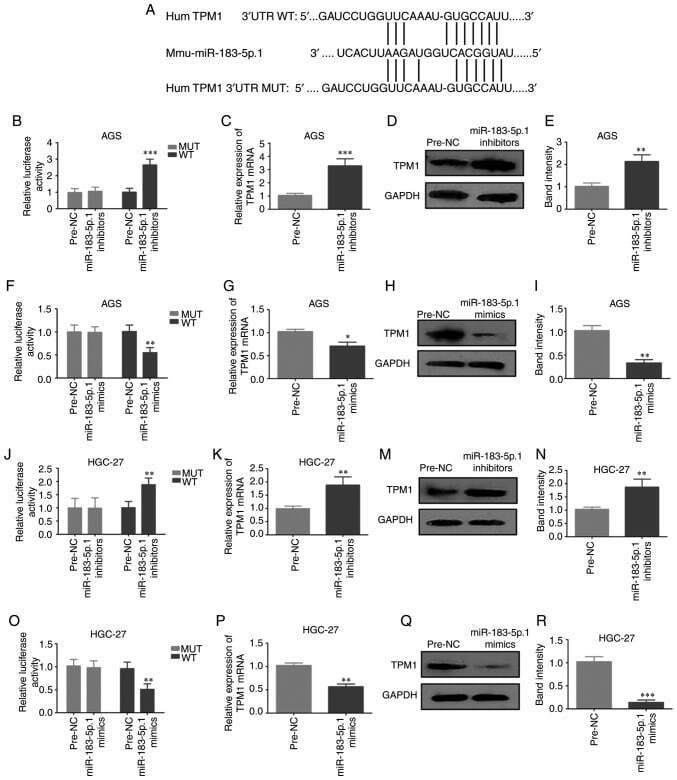
- Figure 3. Experimental validation of miR-183-5p.1 as a TPM1 regulator. (A) miR-183-5p.1 binding with the 3'UTR of TPM1 predicted by TargetScan and coding sequence of miR-183-5p.1 and TPM1. The luciferase activities of WT-TPM1 mRNAs in GC (B) AGS and (J) HGC-27 cells were significantly enhanced by transfection with miR-183-5p.1 inhibitors and markedly decreased in (F) AGS and (O) HGC-27 cells by miR-183-5p.1 mimics following the Luciferase reporter assay. TPM1 expression was markedly increased in (C-E) AGS and (K-N) HGC-27 cells by miR-183-5p.1 inhibitors and significantly decreased in (G-I) AGS and (P-R) HGC-27 cells by miR-183-5p.1 mimics as revealed by reverse transcription-quantitative PCR and western blotting. GAPDH served as the internal control. Results are presented as the mean +- standard error of the mean (n=3). *P