Explore
 Validate
 Learn
Learn Western blot
 Immunocytochemistry
Antibody data
- Antibody Data
- Antigen structure
- References [7]
- Comments [0]
- Validations
- Immunocytochemistry [2]
- Immunohistochemistry [1]
- Other assay [7]
Submit
Validation data
Reference
Comment
Report error
- Product number
- 700258 - Provider product page

- Provider
- Invitrogen Antibodies
- Product name
- Connexin 30 Recombinant Rabbit Monoclonal Antibody (16H9L8)
- Antibody type
- Monoclonal
- Antigen
- Synthetic peptide
- Description
- This antibody is predicted to react with human, rat, hamster and bovine based on sequence homology. Intact IgG appears on a non-reducing gel as ~150 kDa band and upon reduction generating a ~25 kDa light chain band and a ~50 kDa heavy chain. Recombinant rabbit monoclonal antibodies are produced using in vitro expression systems. The expression systems are developed by cloning in the specific antibody DNA sequences from immunoreactive rabbits. Then, individual clones are screened to select the best candidates for production. The advantages of using recombinant rabbit monoclonal antibodies include: better specificity and sensitivity, lot-to-lot consistency, animal origin-free formulations, and broader immunoreactivity to diverse targets due to larger rabbit immune repertoire.
- Reactivity
- Human, Mouse
- Host
- Rabbit
- Isotype
- IgG
- Antibody clone number
- 16H9L8
- Vial size
- 100 μg
- Concentration
- 0.5 mg/mL
- Storage
- Store at 4°C short term. For long term storage, store at -20°C, avoiding freeze/thaw cycles.
Submitted references Failure Of Hearing Acquisition in Mice With Reduced Expression of Connexin 26 Correlates With the Abnormal Phasing of Apoptosis Relative to Autophagy and Defective ATP-Dependent Ca(2+) Signaling in Kölliker's Organ.
Altered Gap Junction Network Topography in Mouse Models for Human Hereditary Deafness.
Caloric restriction triggers morphofunctional remodeling of astrocytes and enhances synaptic plasticity in the mouse hippocampus.
Anisotropic Panglial Coupling Reflects Tonotopic Organization in the Inferior Colliculus.
Functional anisotropic panglial networks in the lateral superior olive.
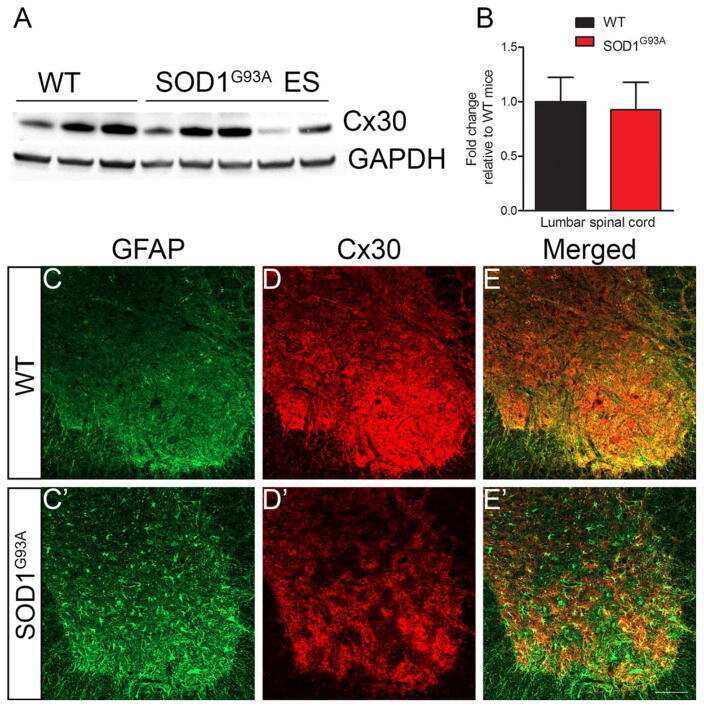
Connexin 43 in astrocytes contributes to motor neuron toxicity in amyotrophic lateral sclerosis.
Connexins, E-cadherin, Claudin-7 and β-catenin transiently form junctional nexuses during the post-natal mammary gland development.
Sun L, Gao D, Chen J, Hou S, Li Y, Huang Y, Mammano F, Chen J, Yang J
Frontiers in cellular neuroscience 2022;16:816079
Frontiers in cellular neuroscience 2022;16:816079
Altered Gap Junction Network Topography in Mouse Models for Human Hereditary Deafness.
Eitelmann S, Petersilie L, Rose CR, Stephan J
International journal of molecular sciences 2020 Oct 6;21(19)
International journal of molecular sciences 2020 Oct 6;21(19)
Caloric restriction triggers morphofunctional remodeling of astrocytes and enhances synaptic plasticity in the mouse hippocampus.
Popov A, Denisov P, Bychkov M, Brazhe A, Lyukmanova E, Shenkarev Z, Lazareva N, Verkhratsky A, Semyanov A
Cell death & disease 2020 Mar 30;11(3):208
Cell death & disease 2020 Mar 30;11(3):208
Anisotropic Panglial Coupling Reflects Tonotopic Organization in the Inferior Colliculus.
Wadle SL, Augustin V, Langer J, Jabs R, Philippot C, Weingarten DJ, Rose CR, Steinhäuser C, Stephan J
Frontiers in cellular neuroscience 2018;12:431
Frontiers in cellular neuroscience 2018;12:431
Functional anisotropic panglial networks in the lateral superior olive.
Augustin V, Bold C, Wadle SL, Langer J, Jabs R, Philippot C, Weingarten DJ, Rose CR, Steinhäuser C, Stephan J
Glia 2016 Nov;64(11):1892-911
Glia 2016 Nov;64(11):1892-911
Connexin 43 in astrocytes contributes to motor neuron toxicity in amyotrophic lateral sclerosis.
Almad AA, Doreswamy A, Gross SK, Richard JP, Huo Y, Haughey N, Maragakis NJ
Glia 2016 Jul;64(7):1154-69
Glia 2016 Jul;64(7):1154-69
Connexins, E-cadherin, Claudin-7 and β-catenin transiently form junctional nexuses during the post-natal mammary gland development.
Dianati E, Poiraud J, Weber-Ouellette A, Plante I
Developmental biology 2016 Aug 1;416(1):52-68
Developmental biology 2016 Aug 1;416(1):52-68
No comments: Submit comment
Supportive validation
- Submitted by
- Invitrogen Antibodies (provider)
- Main image
- Experimental details
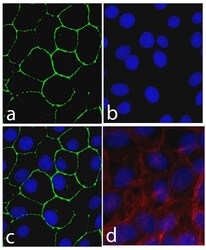
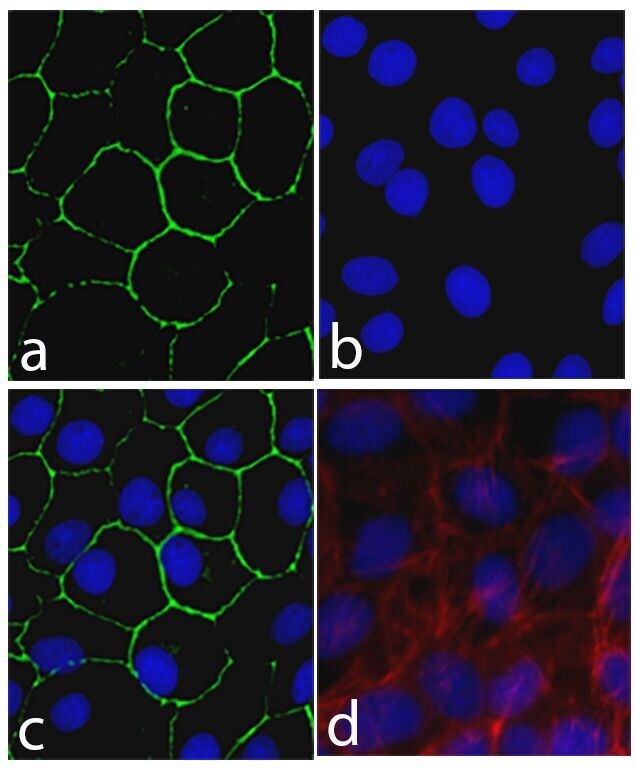
- Immunofluorescent analysis of Connexin 30 was performed on 90% confluent log phase Caco-2 cells The cells were fixed with 4% paraformaldehyde for 15 minutes, and blocked with 5% BSA for 1 hour at room temperature. The cells were labeled with Connexin 30 Recombinant Rabbit Monoclonal Antibody (Product # 700258) at a dilution of 1:500 in 1% BSA and incubated for 3 hours at room temperature and then labeled with Alexa Fluor® 488 Goat anti-Rabbit IgG secondary antibody (Product # A-11008) at a dilution of 1:400 for 30 minutes at room temperature (Panel a: green). Nuclei (Panel b: blue) were stained with SlowFade® Gold Antifade Mountant with DAPI (Product # S36938). Panel c is a merged image showing cell junction localization and panel d is a control without primary antibody. The images were captured using a Nikon microscope at 20X magnification.
- Submitted by
- Invitrogen Antibodies (provider)
- Main image

- Experimental details
- Immunofluorescent analysis of Connexin 30 was performed on 90% confluent log phase Caco-2 cells The cells were fixed with 4% paraformaldehyde for 15 minutes, and blocked with 5% BSA for 1 hour at room temperature. The cells were labeled with Connexin 30 Recombinant Rabbit Monoclonal Antibody (Product # 700258) at a dilution of 1:500 in 1% BSA and incubated for 3 hours at room temperature and then labeled with Alexa Fluor® 488 Goat anti-Rabbit IgG secondary antibody (Product # A-11008) at a dilution of 1:400 for 30 minutes at room temperature (Panel a: green). Nuclei (Panel b: blue) were stained with SlowFade® Gold Antifade Mountant with DAPI (Product # S36938). Panel c is a merged image showing cell junction localization and panel d is a control without primary antibody. The images were captured using a Nikon microscope at 20X magnification.

Supportive validation
- Submitted by
- Invitrogen Antibodies (provider)
- Main image

- Experimental details
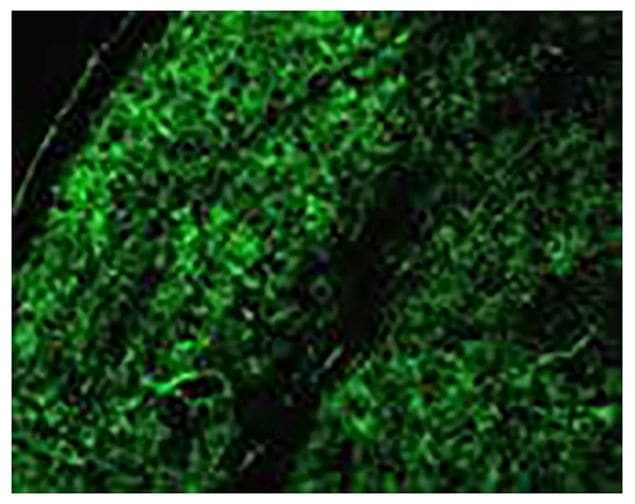
- Immunofluorescent analysis of Connexin 30 was performed on paraffin-embedded mouse thalamus tissue sections. To expose target proteins, endogenous peroxide blocking followed by heat induced epitope retrieval was performed using Tris-EDTA (pH 9. 0) buffer for 15 minutes. Following antigen retrieval, tissues were blocked in 0. 2% BSA with 0. 1% cold fish skin gelatin in 1X PBS for 1 hour in a humidified chamber. The tissues were then probed with a Connexin 30 Recombinant Rabbit Monoclonal Antibody (Product # 700258) at a dilution of 0. 5 µg/mL for 3 hours at room temperature in a humidified chamber. Detection was performed using an HRP-conjugated Goat anti-Rabbit secondary antibody (Product # G-21234), followed by colorimetric detection using DAB. Note staining of the lateral geniculate nucleus (left) and part of the ventral lateral nucleus (right).
Supportive validation
- Submitted by
- Invitrogen Antibodies (provider)
- Main image

- Experimental details
- NULL
- Submitted by
- Invitrogen Antibodies (provider)
- Main image
- Experimental details
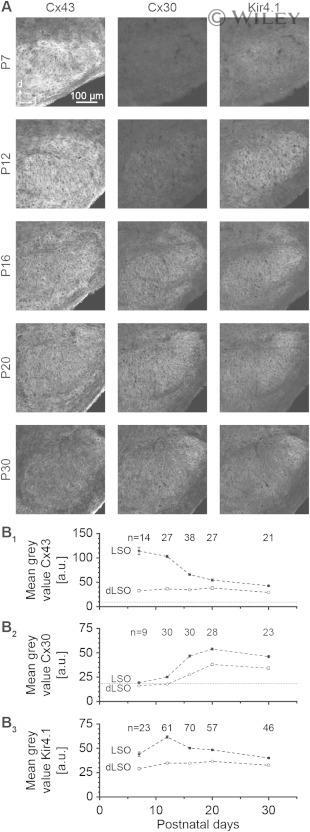
- Cx43, Cx30, and Kir4.1 immunoreactivity in the LSO. A : Immunoreactivity of all candidate proteins was elevated in the LSO. The signal intensity was lower in the white matter dorsal to the LSO. Cx43 was stronger early postnatally whereas Cx30 levels increased at later stages. Kir4.1 exhibited a moderately elevated level during the second postnatal week. B : Developmental profile of Cx43 ( B1 ) and Cx30 ( B2 ) and Kir4.1 expression ( B3 ). The dotted horizontal grey lines in B 1 - 2 denote background fluorescence signals obtained after omitting primary antibodies. n represents the numbers of analyzed slices and is provided within the diagrams; shown are mean values +- SEM.
- Submitted by
- Invitrogen Antibodies (provider)
- Main image
- Experimental details
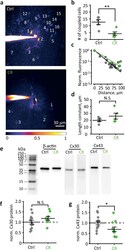
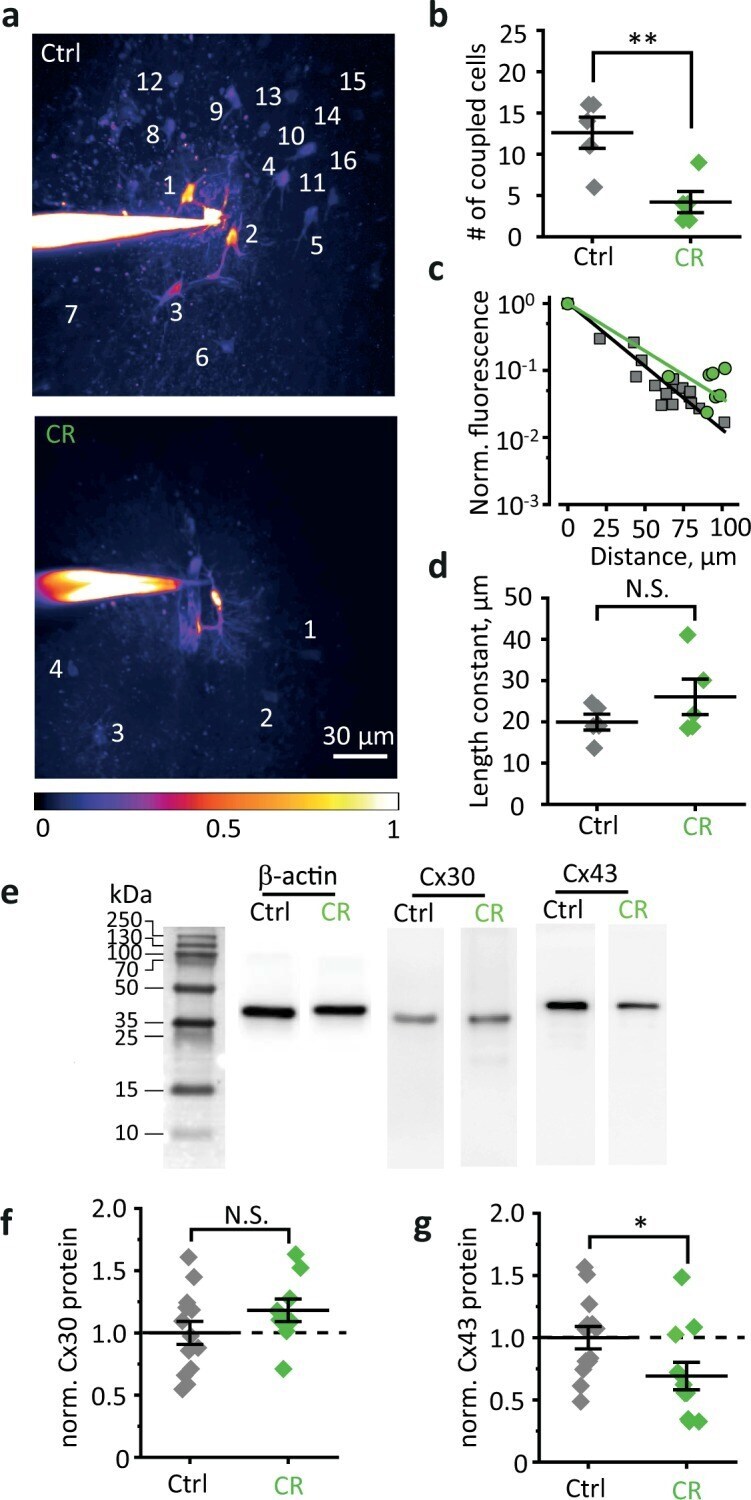
- Fig. 2 CR reduces gap-junction coupling in the astrocytic network but does not affect the gap-junction permeability. a A maximal intensity projection of z-stack of fluorescence images of an astrocyte loaded with 50 uM Alexa Fluor 594 through patch pipette in control (top) and CR (bottom) mice. The dye diffuses through gap junctions, thus staining coupled astrocytes (numbered). CR decreased the number of stained astrocytes. The image also illustrates the distance-dependent decrease in the somatic fluorescence of coupled astrocytes. The color-coding corresponds to fluorescence normalized to the patched astrocyte soma. b The summary data are showing the number of coupled astrocytes in control (gray diamonds) and CR (green diamonds) mice. c The decay of fluorescence in coupled astrocytes with distance from the patched astrocyte. The slope of the linear fit in the semilogarithmic scale determines the length constant. Gray squares--control and grin circles--CR. d The summary data are showing the length constant in control (gray diamonds) and in CR (green diamonds) mice. e Representative western blots of the mouse hippocampus homogenates stained by antibodies against beta-actin, Cx30, and Cx43. f Normalized protein level of Cx30. Gray diamonds--control, green diamonds--CR mice. g Normalized protein level of Cx43. Gray diamonds--control, green diamonds--CR mice. The data are presented as mean +- SEM; NS. p > 0.05; * p < 0.05; ** p < 0.01; two-sample t -test.
- Submitted by
- Invitrogen Antibodies (provider)
- Main image
- Experimental details
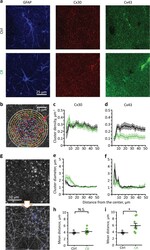
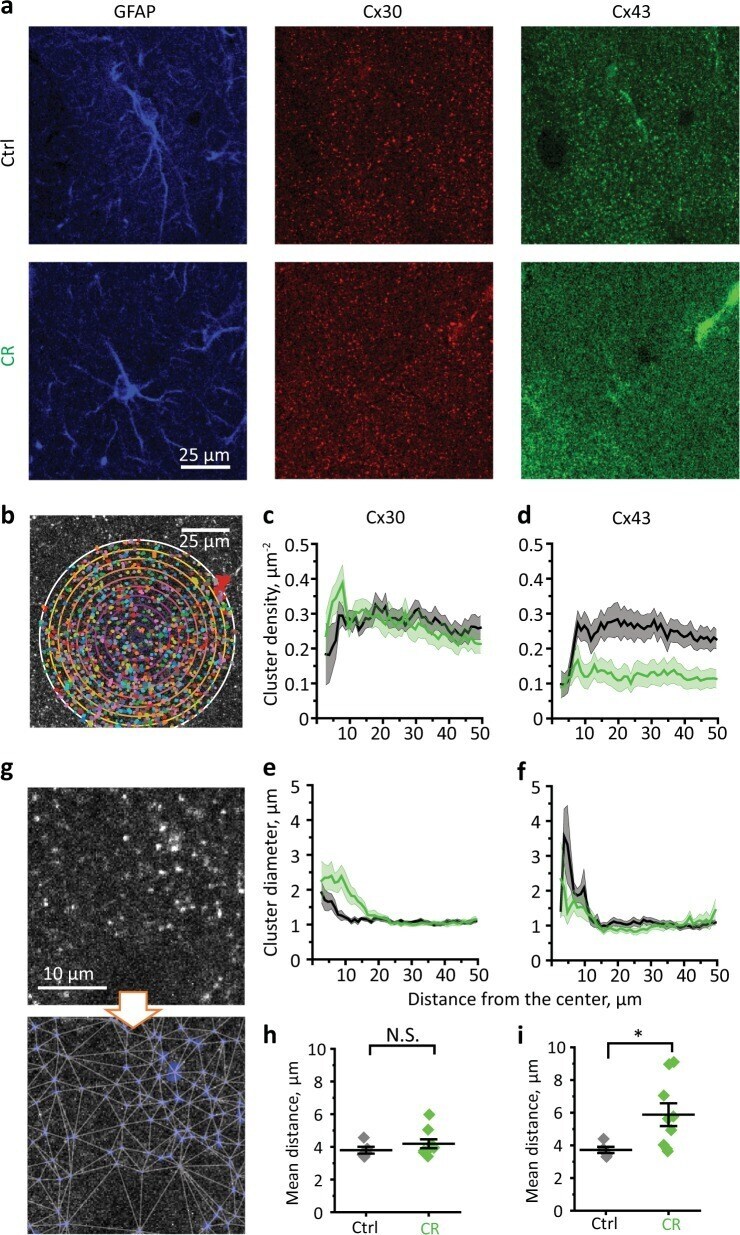
- Fig. 3 CR effect on density and diameter of Cx43 and Cx30 clusters. a Triple immunocytochemical staining (GFAP, Cx30, and Cx43) of an astrocyte in hippocampal CA1 str. radiatum in control and CR mice. b Sholl-like analysis of connexin cluster distribution around the center of astrocyte soma. The number of clusters in each ring formed by neighboring circles was counted and divided by the ring area (cluster density). The distribution of cluster density with the distance from soma for Cx30 ( c ) and Cx43 ( d ). The distribution of mean cluster diameter with the distance from soma for Cx30 ( e ) and Cx43 ( f ). g Identification and interlinking of connexin clusters. The summary data are showing no changes in the mean distances between Cx30 clusters ( h ) and increased mean distances between Cx43 clusters ( i ) after CR. Gray diamonds--control, green diamonds--CR mice. The data are presented as mean +- SEM; NS. p > 0.05; * p < 0.05; two-sample t -test.
- Submitted by
- Invitrogen Antibodies (provider)
- Main image
- Experimental details
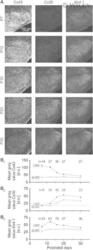
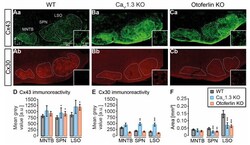
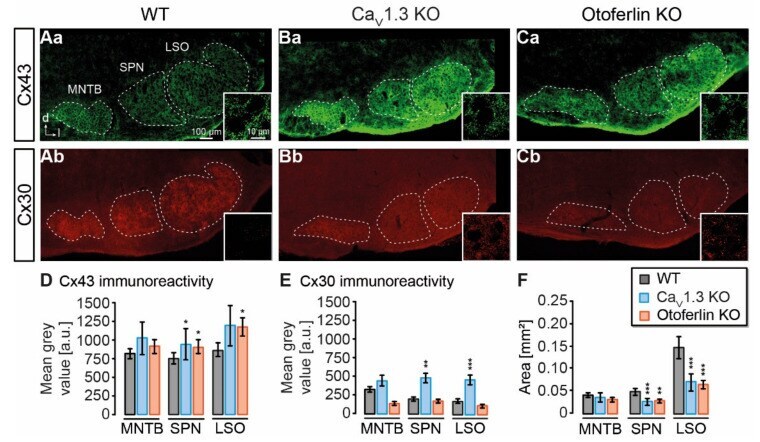
- Figure 1 Expression of astrocyte-related connexins in the superior olivary complex (SOC). ( A - C ), widefield images showing immunoreactivity of Cx43 and Cx30 in the mouse SOC from the wild type (WT) ( Aa (Cx43), Ab (Cx30)), CaV1.3 knock-out (KO) ( Ba (Cx43), Bb (Cx30)) and otoferlin KO ( Ca (Cx43), Cb (Cx30)). Regions used for mean grey value und area analysis are indicated with dashed lines. Insets: Close ups showing the punctate Cx labeling in the lateral superior olive (LSO) center. ( D ), mean grey values of Cx43 immunofluorescence. Cx43 levels were increased in the SPN from both KO models and in the LSO from otoferlin KO. ( E ), mean grey values of Cx30 immunofluorescence. Cx30 was elevated in the SPN and LSO of Ca V 1.3 KO. ( F ), area of nuclei in the SOC. SPN and LSO from both KO models exhibited a reduced area compared to the WT. Mean grey values were background subtracted. ( D - F ) show mean +- SD. Significance levels in panels ( D - F ) were Sidak corrected for two comparisons. The sample size is given in the text of Section 4.2 . * p < 0.025, ** p < 0.005, *** p < 0.0005.
- Submitted by
- Invitrogen Antibodies (provider)
- Main image

- Experimental details
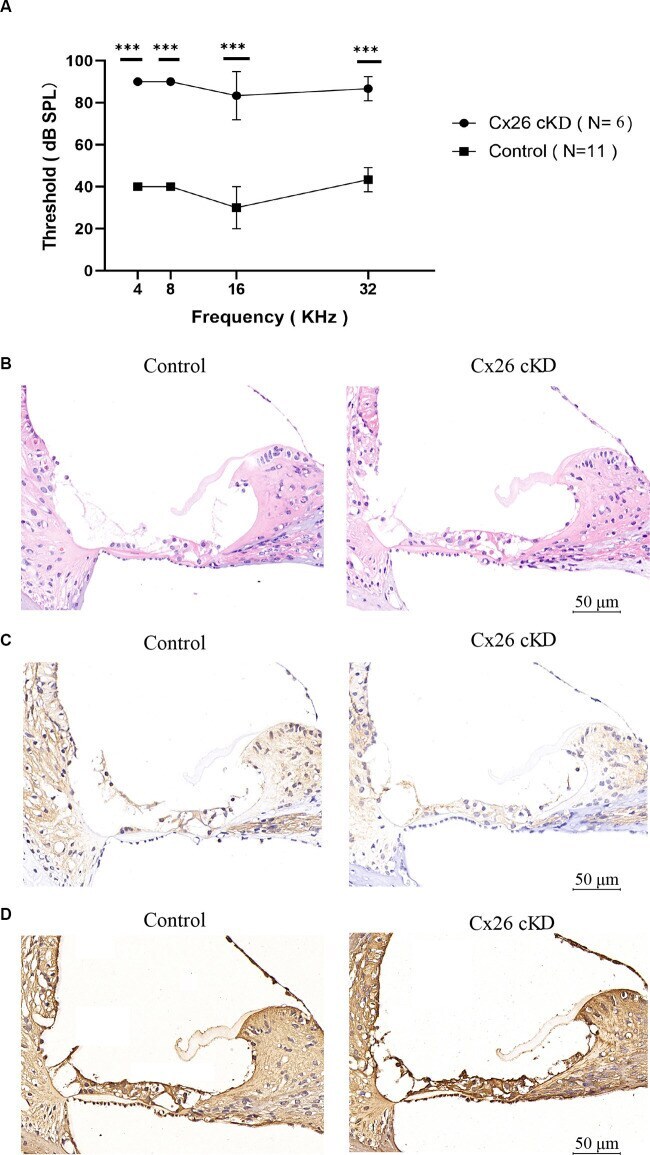
- Effect of tamoxifen injection at P0 on the auditory threshold and connexin expression at P21. (A) Auditory thresholds measured by pure tone ABRs vs. tone frequency; *** p < 0.0001. (B-D) Transverse sections of the cochlear duct stained with hematoxylin-eosin (B) or with antibodies selective for Cx26 (C) or Cx30 (D) . Scale bars = 50 mum.
- Submitted by
- Invitrogen Antibodies (provider)
- Main image
- Experimental details
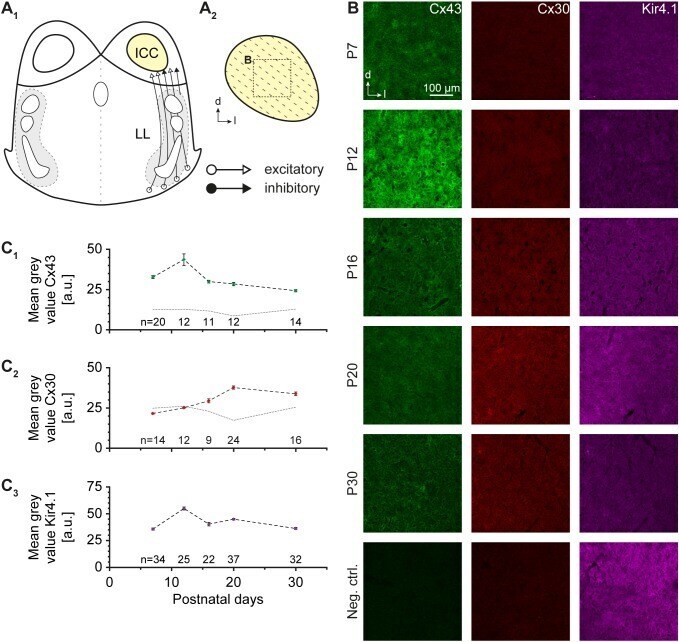
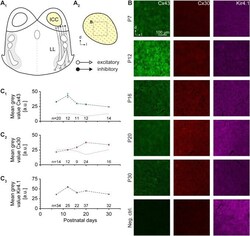
- FIGURE 1 Cx43, Cx30, and Kir4.1 immunoreactivity. (A) Schematic drawing of an auditory brainstem slice containing the central part of the inferior colliculus (ICC; A 1 ). The tonotopic organization is indicated by dotted lines (A 2 ) . The dotted box denotes the area in which Cx expression was analyzed. (B) Immunoreactivity for Cx43 was maximal at P12 and decayed with age, whereas Cx30 levels increased at later developmental stages. Kir4.1 exhibited a moderately elevated level during the second postnatal week. The last row depicts negative controls at P20, in which the primary antibodies for Cx43 and Cx30 were omitted. (C) Developmental profile of Cx43 (C 1 ) , Cx30 (C 2 ) , and Kir4.1 expression (C 3 ) . The dotted gray lines in (C 1,2 ) denote developmental background fluorescence signals at P7-30 obtained after omitting primary antibodies. n represents the number of analyzed slices and is provided within the diagrams; shown are mean values +- SEM.