 Explore
 Validate
 Learn
Learn Western blot
 Immunocytochemistry
Antibody data
- Antibody Data
- Antigen structure
- References [2]
- Comments [0]
- Validations
- Immunocytochemistry [4]
- Immunohistochemistry [2]
- Other assay [2]
Submit
Validation data
Reference
Comment
Report error
- Product number
- PA5-48035 - Provider product page

- Provider
- Invitrogen Antibodies
- Product name
- HSPA9 Polyclonal Antibody
- Antibody type
- Polyclonal
- Antigen
- Recombinant full-length protein
- Description
- Reconstitute at 0.2 mg/mL in sterile PBS.
- Reactivity
- Human, Mouse, Rat
- Host
- Goat
- Isotype
- IgG
- Vial size
- 100 μg
- Concentration
- 0.2 mg/mL
- Storage
- -20°C, Avoid Freeze/Thaw Cycles
Submitted references Caveolin-1 impairs PKA-DRP1-mediated remodelling of ER-mitochondria communication during the early phase of ER stress.
Fidelity of translation initiation is required for coordinated respiratory complex assembly.
Bravo-Sagua R, Parra V, Ortiz-Sandoval C, Navarro-Marquez M, Rodríguez AE, Diaz-Valdivia N, Sanhueza C, Lopez-Crisosto C, Tahbaz N, Rothermel BA, Hill JA, Cifuentes M, Simmen T, Quest AFG, Lavandero S
Cell death and differentiation 2019 Jul;26(7):1195-1212
Cell death and differentiation 2019 Jul;26(7):1195-1212
Fidelity of translation initiation is required for coordinated respiratory complex assembly.
Rudler DL, Hughes LA, Perks KL, Richman TR, Kuznetsova I, Ermer JA, Abudulai LN, Shearwood AJ, Viola HM, Hool LC, Siira SJ, Rackham O, Filipovska A
Science advances 2019 Dec;5(12):eaay2118
Science advances 2019 Dec;5(12):eaay2118
No comments: Submit comment
Supportive validation
- Submitted by
- Invitrogen Antibodies (provider)
- Main image

- Experimental details
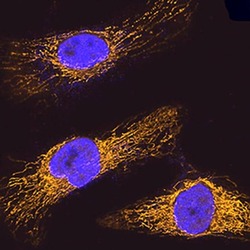
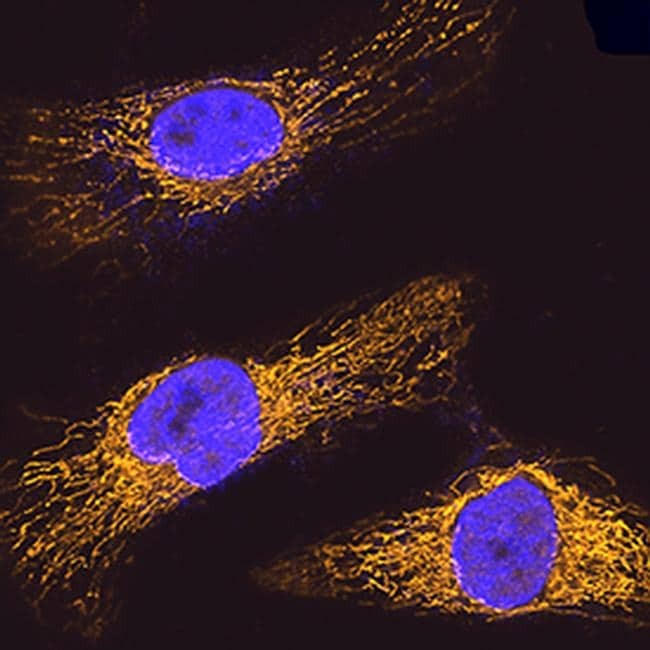
- Immunocytochemical analysis of GRP75/HSPA9B was detected in immersion fixed HeLa human cervical epithelial carcinoma cell line using Goat Anti-human/mouse/Rat GRP75/HSPA9B Antigen Affinity-purified Polyclonal Antibody (Product # PA5-48035) at 5 µg/mL for 3 hours at room temperature. Cells were stained using the 557-conjugated Anti-Goat IgG Secondary Antibody (yello and counterstained with DAPI (blue). Specific staining was localized to mitochondria.

- Submitted by
- Invitrogen Antibodies (provider)
- Main image
- Experimental details
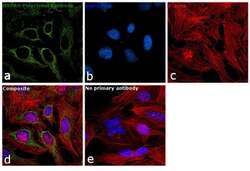
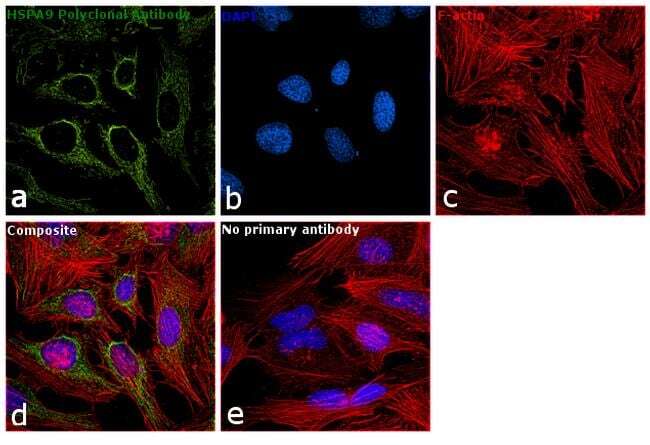
- Immunofluorescence analysis of HSPA9 was performed using 70% confluent log phase HeLa cells. The cells were fixed with 4% paraformaldehyde for 10 minutes, permeabilized with 0.1% Triton™ X-100 for 15 minutes, and blocked with 1% BSA for 1 hour at room temperature. The cells were labeled with HSPA9 Polyclonal Antibody (Product # PA5-48035) at 1:100 dilution in 0.1% BSA, incubated at 4 degree Celsius overnight and then labeled with Rabbit anti-Goat IgG (H+L) Cross-Adsorbed Secondary Antibody, Alexa Fluor 488 (Product # A-11078) at a dilution of 1:2000 for 45 minutes at room temperature (Panel a: green). Nuclei (Panel b: blue) were stained with ProLong™ Diamond Antifade Mountant with DAPI (Product # P36962). F-actin (Panel c: red) was stained with Rhodamine Phalloidin (Product # R415). Panel d represents the merged image showing mitochondrial localization. Panel e represents control cells with no primary antibody to assess background. The images were captured at 60X magnification.

- Submitted by
- Invitrogen Antibodies (provider)
- Main image
- Experimental details
- Immunocytochemical analysis of GRP75/HSPA9B was detected in immersion fixed HeLa human cervical epithelial carcinoma cell line using Goat Anti-human/mouse/Rat GRP75/HSPA9B Antigen Affinity-purified Polyclonal Antibody (Product # PA5-48035) at 5 µg/mL for 3 hours at room temperature. Cells were stained using the 557-conjugated Anti-Goat IgG Secondary Antibody (yello and counterstained with DAPI (blue). Specific staining was localized to mitochondria.
- Submitted by
- Invitrogen Antibodies (provider)
- Main image

- Experimental details
- Immunofluorescence analysis of HSPA9 was performed using 70% confluent log phase HeLa cells. The cells were fixed with 4% paraformaldehyde for 10 minutes, permeabilized with 0.1% Triton™ X-100 for 15 minutes, and blocked with 1% BSA for 1 hour at room temperature. The cells were labeled with HSPA9 Polyclonal Antibody (Product # PA5-48035) at 1:100 dilution in 0.1% BSA, incubated at 4 degree Celsius overnight and then labeled with Rabbit anti-Goat IgG (H+L) Cross-Adsorbed Secondary Antibody, Alexa Fluor 488 (Product # A-11078) at a dilution of 1:2000 for 45 minutes at room temperature (Panel a: green). Nuclei (Panel b: blue) were stained with ProLong™ Diamond Antifade Mountant with DAPI (Product # P36962). F-actin (Panel c: red) was stained with Rhodamine Phalloidin (Product # R415). Panel d represents the merged image showing mitochondrial localization. Panel e represents control cells with no primary antibody to assess background. The images were captured at 60X magnification.
Supportive validation
- Submitted by
- Invitrogen Antibodies (provider)
- Main image
- Experimental details
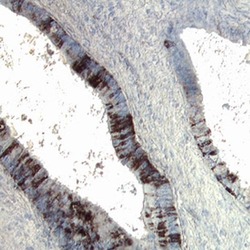
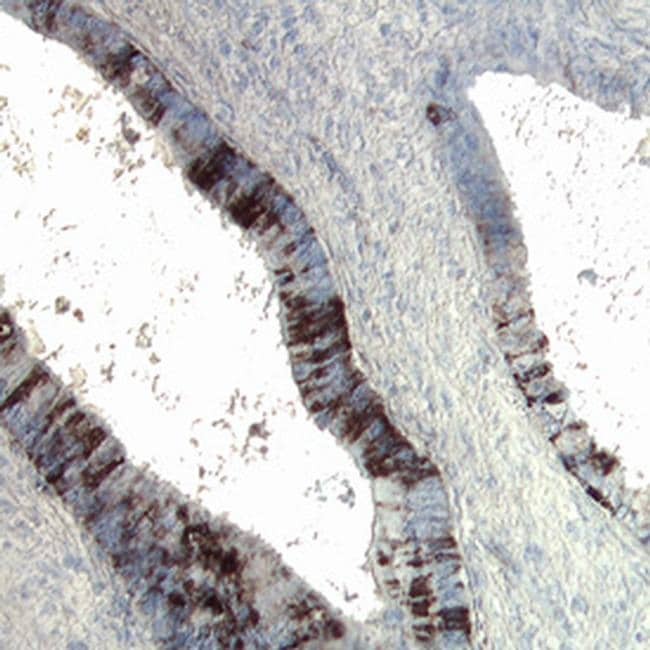
- Immunohistochemical analysis of GRP75/HSPA9B was detected in immersion fixed paraffin-embedded sections of human colon cancer tissue using Goat Anti-human/mouse/Rat GRP75/HSPA9B Antigen Affinity-purified Polyclonal Antibody (Product # PA5-48035) at 15 µg/mL overnight at 4 °C. Tissue was stained using the Anti-Goat HRP-DAB (brown and counterstained with hematoxylin (blue). Specific labeling was localized to the plasma membrane of epithelial cells.
- Submitted by
- Invitrogen Antibodies (provider)
- Main image
- Experimental details
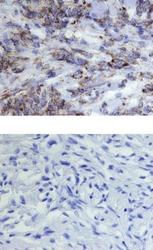
- Immunohistochemical analysis of GRP75/HSPA9B was detected in immersion fixed paraffin-embedded sections of human meningioma using 15 µg/mL Goat Anti-human/mouse/Rat GRP75/HSPA9B Antigen Affinity-purified Polyclonal Antibody (Product # PA5-48035) overnight at 4 °C. Tissue was stained with the Anti-Goat HRP-DAB (brown and counterstained with hematoxylin (blue). Lower panel shows a lack of labeling if primary antibodies are omitted and tissue is stained only with secondary antibody followed by incubation with detection reagents.

Supportive validation
- Submitted by
- Invitrogen Antibodies (provider)
- Main image
- Experimental details
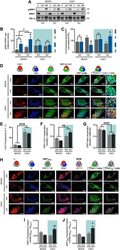
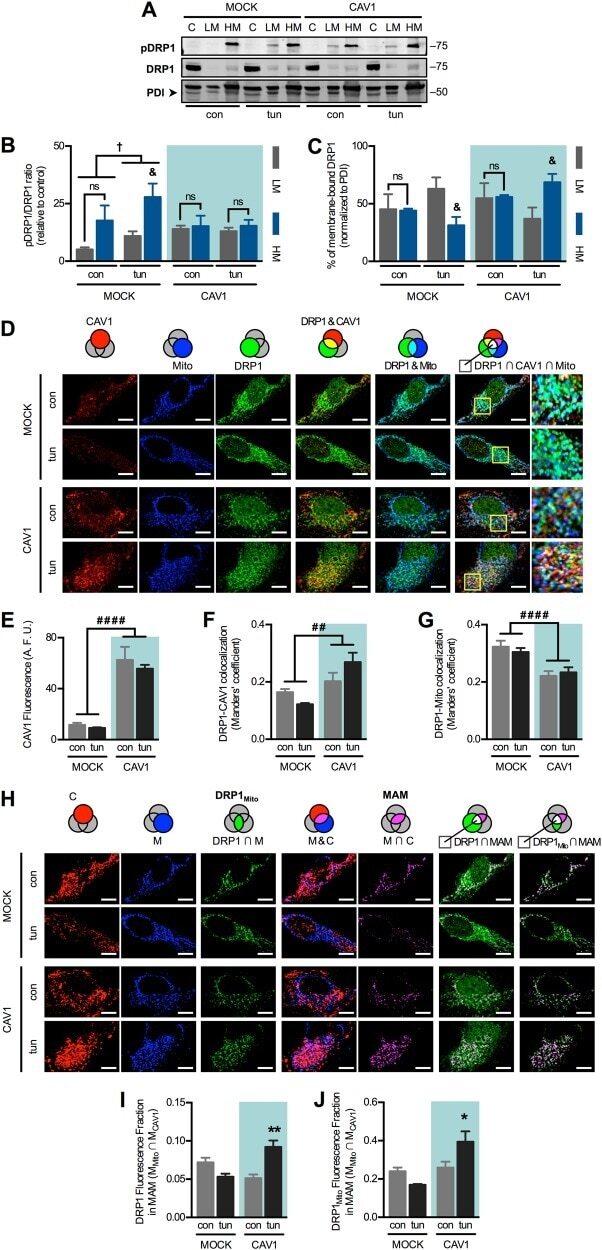
- Fig. 6 Caveolin-1 expression precludes DRP1 phosphorylation and redistribution during the early phase of ER stress. a Mock and CAV1 cells in control condition (con) or under early ER stress with tunicamycin (tun) were fractionated and processed for detection of phospho-DRP1 and DRP1 by western blotting using PDI as a loading control. C cytosol, LM light membranes (microsomes), HM heavy membranes (crude mitochondria). b Quantification of DRP1 phosphorylation analysed in ( a ) ( n = 3). c Quantification of membrane-bound DRP1 distribution analysed in a ( n = 3). d Experimental groups as in ( a ) were processed for immunofluorescence analysis. CAV1, mtHSP70 (mitochondrial marker, Mito) and DRP1 were stained with respective antibodies and then imaged using confocal microscopy. Merge between DRP1 and CAV1 images shows colocalized areas in yellow. Merge between DRP1 and Mito images shows colocalized areas in cyan. In merge images of Mito, DRP1 and CAV1, triple colocalization areas appear as white pixels. e CAV1 fluorescence per cell was quantified from images obtained in d ( n = 3). f DRP1-CAV1 colocalization was quantified as Manders' coefficients of images obtained in ( d ) ( n = 3). g DRP1-Mito colocalization was quantified as Manders' coefficients of images obtained in ( d ) ( n = 3). h From images obtained in d , thresholded CAV1 (C) and Mito (M) images were generated. The intersection between M and DRP1 corresponds to mitochondrial DRP1 (DRP1 mito ). Merge between M and C ima
- Submitted by
- Invitrogen Antibodies (provider)
- Main image
- Experimental details
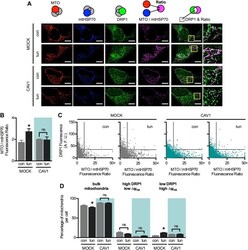
- Fig 7 DRP1 redistribution during the early phase of ER stress correlates with increased mitochondrial bioenergetics. a Mock and CAV1 cells in control condition (con) or under early ER stress with tunicamycin (tun) were processed for immunofluorescence analysis. The mitochondrial potential was stained with MitoTracker Orange (MTO) and mtHSP70 (mitochondrial marker) and DRP1 were stained with the respective antibodies and then imaged using confocal microscopy. The ratio between MTO and mtHSP70 is shown in magenta. Merge between DRP1 and ratio images shows colocalized areas in white. b MTO/mtHSP70 fluorescence ratio per cell was quantified from images obtained in a ( n = 3). c Dot plots of DRP1 fluorescence and MTO/mtHSP70 ratio of each individual mitochondria, obtained from images shown in ( a ) ( n = 3). Between 2000 and 6000 individual mitochondria per condition were analysed. d Percentage of mitochondria per cell corresponding to the quadrants defined in a . Between 25 and 45 cells were pooled for this analysis. psi mt : MTO/mtHSP70 ratio. Bulk mitochondria: low DRP1 and low psi mt . For each independent imaging experiment, 5-15 cells were analysed. Scale bars: 10 um. Results are shown as mean +- s.e.m. * P < 0.05 compared with respective con condition. ns non-significant
