Explore
 Validate
 Learn
Learn Western blot
 ELISA
ELISA Immunocytochemistry
Antibody data
- Antibody Data
- Antigen structure
- References [3]
- Comments [0]
- Validations
- Immunocytochemistry [4]
- Immunohistochemistry [3]
- Flow cytometry [1]
- Chromatin Immunoprecipitation [6]
- Other assay [4]
Submit
Validation data
Reference
Comment
Report error
- Product number
- 700247 - Provider product page

- Provider
- Invitrogen Antibodies
- Product name
- Phospho-STAT6 (Tyr641) Recombinant Rabbit Monoclonal Antibody (46H1L12)
- Antibody type
- Monoclonal
- Antigen
- Synthetic peptide
- Description
- This antibody is predicted to react with Rhesus monkey, orangutan, bovine, canine, mouse and rat based on sequence homology. Intact IgG appears on a non-reducing gel as ~150 kDa band and upon reduction generating a ~25 kDa light chain band and a ~50 kDa heavy chain. Recombinant rabbit monoclonal antibodies are produced using in vitro expression systems. The expression systems are developed by cloning in the specific antibody DNA sequences from immunoreactive rabbits. Then, individual clones are screened to select the best candidates for production. The advantages of using recombinant rabbit monoclonal antibodies include: better specificity and sensitivity, lot-to-lot consistency, animal origin-free formulations, and broader immunoreactivity to diverse targets due to larger rabbit immune repertoire.
- Reactivity
- Human, Mouse
- Host
- Rabbit
- Isotype
- IgG
- Antibody clone number
- 46H1L12
- Vial size
- 100 μg
- Concentration
- 0.5 mg/mL
- Storage
- Store at 4°C short term. For long term storage, store at -20°C, avoiding freeze/thaw cycles.
Submitted references Pharmacological Inhibition of STAT6 Ameliorates Myeloid Fibroblast Activation and Alternative Macrophage Polarization in Renal Fibrosis.
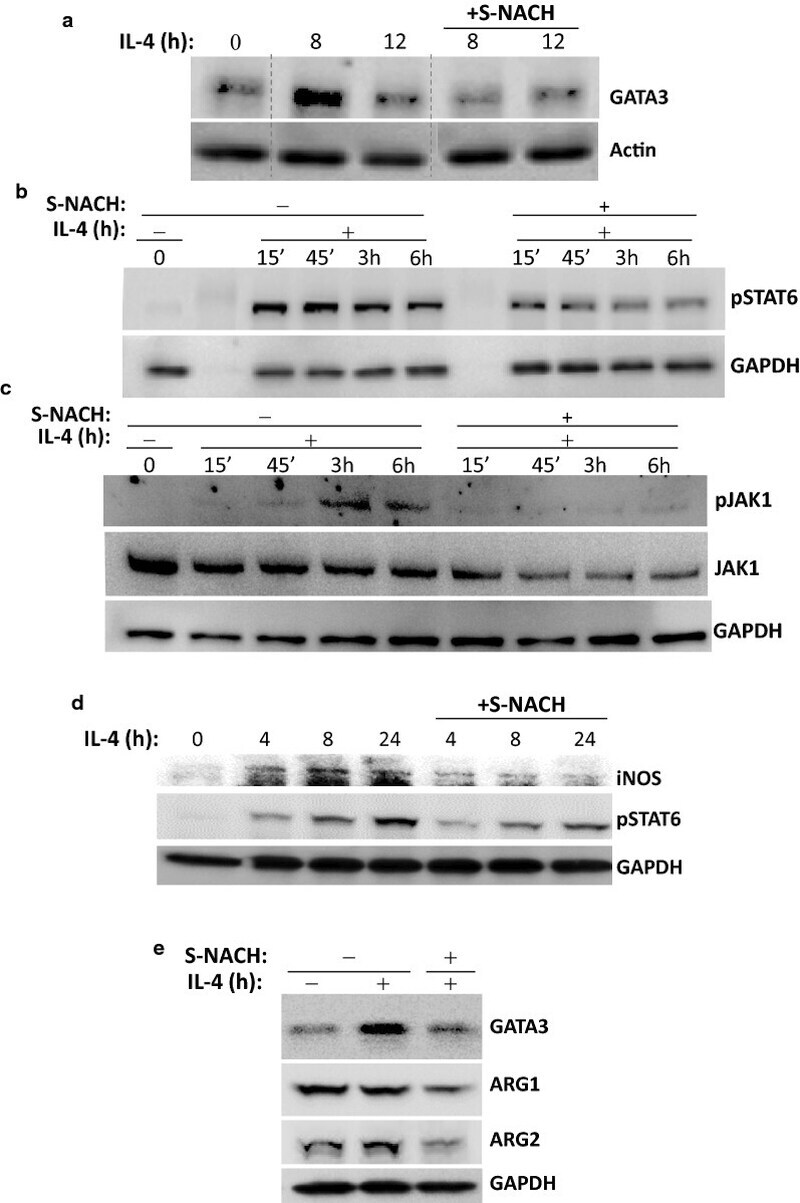
Sulfated non-anticoagulant heparin blocks Th2-induced asthma by modulating the IL-4/signal transducer and activator of transcription 6/Janus kinase 1 pathway.
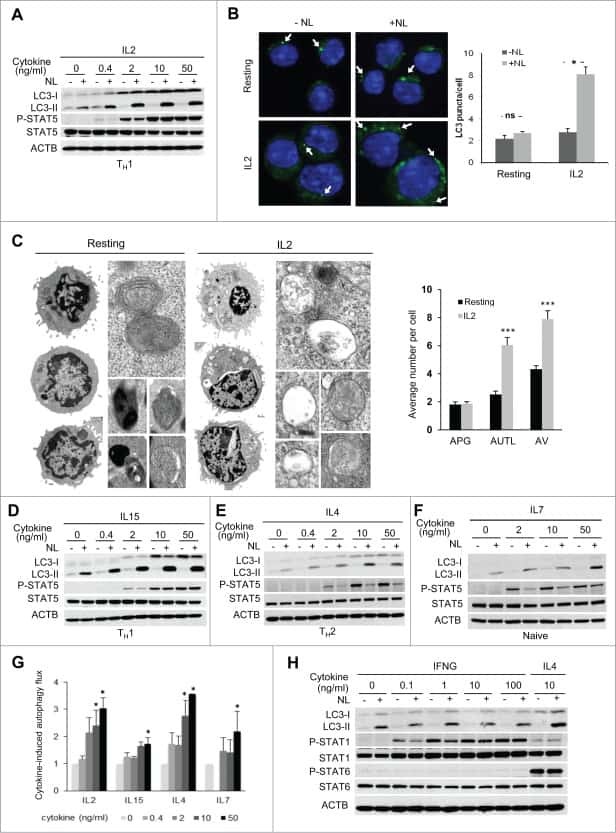
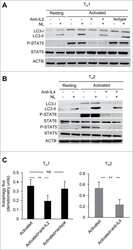
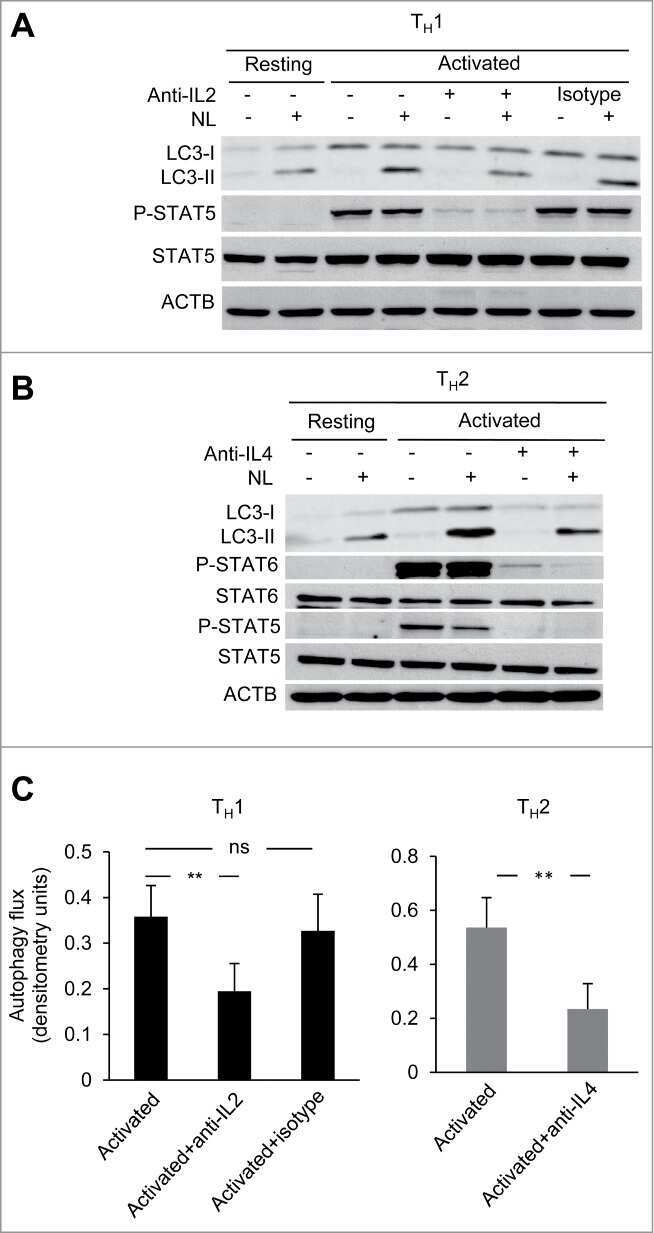
Common γ-chain cytokine signaling is required for macroautophagy induction during CD4+ T-cell activation.
Jiao B, An C, Tran M, Du H, Wang P, Zhou D, Wang Y
Frontiers in immunology 2021;12:735014
Frontiers in immunology 2021;12:735014
Sulfated non-anticoagulant heparin blocks Th2-induced asthma by modulating the IL-4/signal transducer and activator of transcription 6/Janus kinase 1 pathway.
Ghonim MA, Wang J, Ibba SV, Luu HH, Pyakurel K, Benslimane I, Mousa S, Boulares AH
Journal of translational medicine 2018 Sep 1;16(1):243
Journal of translational medicine 2018 Sep 1;16(1):243
Common γ-chain cytokine signaling is required for macroautophagy induction during CD4+ T-cell activation.
Botbol Y, Patel B, Macian F
Autophagy 2015;11(10):1864-77
Autophagy 2015;11(10):1864-77
No comments: Submit comment
Supportive validation
- Submitted by
- Invitrogen Antibodies (provider)
- Main image

- Experimental details
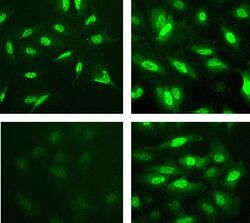
- Immunofluorescent analysis of Phospho-STAT6 pTyr641 in Ramos cells stimulated with 100 ng/mL IL-4 (top right) or unstimulated (top left) using a Phospho-STAT6 pTyr641 recombinant rabbit monoclonal antibody (Product # 700247) at a dilution of 5 µg/mL preincubated in the presence of the phosphopeptide used as immunogen (bottom left) or non-phosphopeptide (bottom right), followed by detection using an Alexa Fluor 488-conjugated goat anti-rabbit secondary antibody at a dilution of 1:1000. Prior to staining, cells were permeabilized with 100% methanol for 10 min at -20°C.

- Submitted by
- Invitrogen Antibodies (provider)
- Main image
- Experimental details
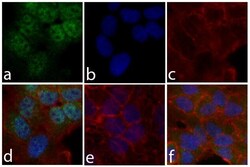
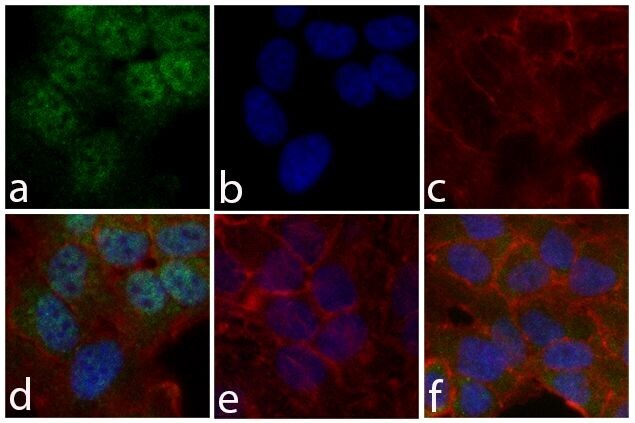
- Immunofluorescent analysis of STAT6 (pY641) was done on 70% confluent log phase HeLa cells; untreated and treated (serum starved for 16 hours followed by treatment with 20 ng/mL IFN alpha for 1 hour). The cells were fixed with 4% paraformaldehyde for 15 minutes; permeabilized with 0.25% Triton X-100 for 10 minutes followed by blocking with 5% BSA for 1 hour at room temperature. The cells were incubated with STAT6 (pY641) Recombinant Rabbit Monoclonal Antibody (Product # 700247) at 2 µg-4 µg in 1% BSA and incubated for 3 hours at room temperature and then labeled with Alexa Fluor® 488 Goat anti-Rabbit IgG Secondary Antibody (Product # A-11008) at a dilution of 1:400 for 30 minutes at room temperature (Panel a: green). Nuclei (Panel b: blue) were stained with SlowFade® Gold Antifade Mountant with DAPI (Product # S36938). F-actin (Panel c: red) was stained with Alexa Fluor® 594 Phalloidin (Product # A12381). Panel d is a merged image showing translocated STAT6 (pY641) in nucleus. Panel e shows competition with STAT6 (pY641) peptide. Panel f shows cytoplasmic localization of STAT6 (pY641) in untreated HeLa cells. The images were captured at 20X magnification.
- Submitted by
- Invitrogen Antibodies (provider)
- Main image
- Experimental details
- Immunofluorescent analysis of Phospho-STAT6 pTyr641 in Ramos cells stimulated with 100 ng/mL IL-4 (top right) or unstimulated (top left) using a Phospho-STAT6 pTyr641 recombinant rabbit monoclonal antibody (Product # 700247) at a dilution of 5 µg/mL preincubated in the presence of the phosphopeptide used as immunogen (bottom left) or non-phosphopeptide (bottom right), followed by detection using an Alexa Fluor 488-conjugated goat anti-rabbit secondary antibody at a dilution of 1:1000. Prior to staining, cells were permeabilized with 100% methanol for 10 min at -20°C.

- Submitted by
- Invitrogen Antibodies (provider)
- Main image

- Experimental details
- Immunofluorescent analysis of STAT6 (pY641) was done on 70% confluent log phase HeLa cells; untreated and treated (serum starved for 16 hours followed by treatment with 20 ng/mL IFN alpha for 1 hour). The cells were fixed with 4% paraformaldehyde for 15 minutes; permeabilized with 0.25% Triton X-100 for 10 minutes followed by blocking with 5% BSA for 1 hour at room temperature. The cells were incubated with STAT6 (pY641) Recombinant Rabbit Monoclonal Antibody (Product # 700247) at 2 µg-4 µg in 1% BSA and incubated for 3 hours at room temperature and then labeled with Alexa Fluor® 488 Goat anti-Rabbit IgG Secondary Antibody (Product # A-11008) at a dilution of 1:400 for 30 minutes at room temperature (Panel a: green). Nuclei (Panel b: blue) were stained with SlowFade® Gold Antifade Mountant with DAPI (Product # S36938). F-actin (Panel c: red) was stained with Alexa Fluor® 594 Phalloidin (Product # A12381). Panel d is a merged image showing translocated STAT6 (pY641) in nucleus. Panel e shows competition with STAT6 (pY641) peptide. Panel f shows cytoplasmic localization of STAT6 (pY641) in untreated HeLa cells. The images were captured at 20X magnification.

Supportive validation
- Submitted by
- Invitrogen Antibodies (provider)
- Main image
- Experimental details
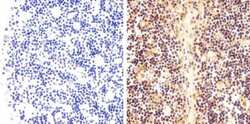
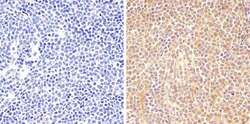
- Immunohistochemistry analysis of STAT6 (pY641) showing staining in the cytoplasm and nucleus of paraffin-embedded human thymus tissue (right) compared to a negative control without primary antibody (left). To expose target proteins, antigen retrieval was performed using 10mM sodium citrate (pH 6.0), microwaved for 8-15 min. Following antigen retrieval, tissues were blocked in 3% H2O2-methanol for 15 min at room temperature, washed with ddH2O and PBS, and then probed with a STAT6 (pY641) Monoclonal Antibody (clone 46H1L12), Recombinant (Product # 700247) diluted in 3% BSA-PBS at a dilution of 1:20 overnight at 4°C in a humidified chamber. Tissues were washed extensively in PBST and detection was performed using an HRP-conjugated secondary antibody followed by colorimetric detection using a DAB kit. Tissues were counterstained with hematoxylin and dehydrated with ethanol and xylene to prep for mounting.
- Submitted by
- Invitrogen Antibodies (provider)
- Main image
- Experimental details
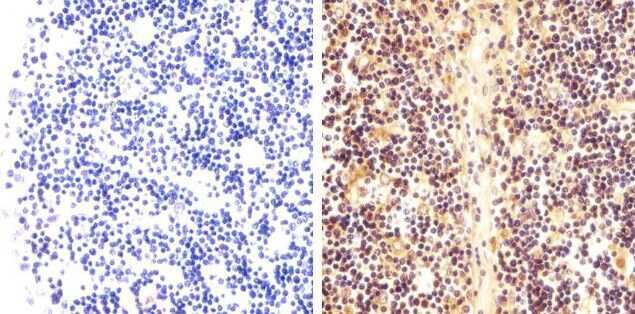
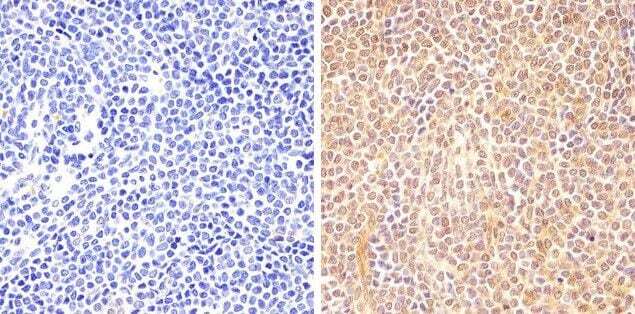
- Immunohistochemistry analysis of STAT6 (pY641) showing staining in the cytoplasm and nucleus of paraffin-embedded mouse spleen tissue (right) compared to a negative control without primary antibody (left). To expose target proteins, antigen retrieval was performed using 10mM sodium citrate (pH 6.0), microwaved for 8-15 min. Following antigen retrieval, tissues were blocked in 3% H2O2-methanol for 15 min at room temperature, washed with ddH2O and PBS, and then probed with a STAT6 (pY641) Monoclonal Antibody (clone 46H1L12), Recombinant (Product # 700247) diluted in 3% BSA-PBS at a dilution of 1:50 overnight at 4°C in a humidified chamber. Tissues were washed extensively in PBST and detection was performed using an HRP-conjugated secondary antibody followed by colorimetric detection using a DAB kit. Tissues were counterstained with hematoxylin and dehydrated with ethanol and xylene to prep for mounting.
- Submitted by
- Invitrogen Antibodies (provider)
- Main image
- Experimental details
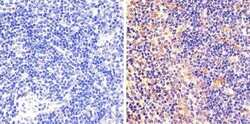
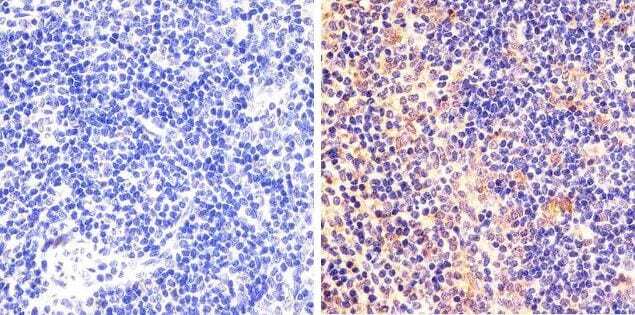
- Immunohistochemistry analysis of STAT6 (pY641) showing staining in the cytoplasm and nucleus of paraffin-embedded human T cell lymphoma (right) compared to a negative control without primary antibody (left). To expose target proteins, antigen retrieval was performed using 10mM sodium citrate (pH 6.0), microwaved for 8-15 min. Following antigen retrieval, tissues were blocked in 3% H2O2-methanol for 15 min at room temperature, washed with ddH2O and PBS, and then probed with a STAT6 (pY641) Monoclonal Antibody (clone 46H1L12), Recombinant (Product # 700247) diluted in 3% BSA-PBS at a dilution of 1:20 overnight at 4°C in a humidified chamber. Tissues were washed extensively in PBST and detection was performed using an HRP-conjugated secondary antibody followed by colorimetric detection using a DAB kit. Tissues were counterstained with hematoxylin and dehydrated with ethanol and xylene to prep for mounting.
Supportive validation
- Submitted by
- Invitrogen Antibodies (provider)
- Main image
- Experimental details
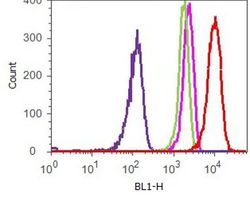
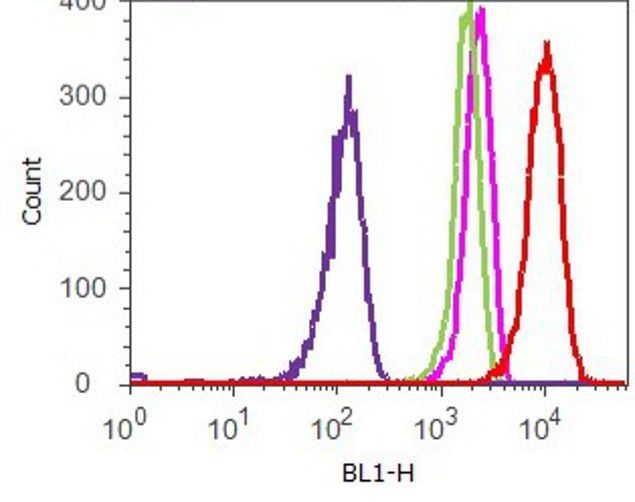
- Flow cytometry analysis of STAT6 [pY641] was done on Jurkat cells. Cells were fixed with 70% ethanol for 10 minutes, permeabilized with 0.25% Tritonª X-100 for 20 minutes, and blocked with 5% BSA for 1 hour at room temperature. Cells were labeled with ABfinityª STAT6 [pY641] Recombinant Rabbit Monoclonal Antibody (700247, red histogram) or with rabbit isotype control (pink histogram) at 2 µg-4 µg/million cells in 2.5% BSA. After incubation at room temperature for 2-3 hours, the cells were labeled with Alexa Fluor¨ 488 Goat Anti-Rabbit Secondary Antibody (A11008) at a dilution of 1:400 for 30 minutes at room temperature. The representative 10,000 cells were acquired and analyzed for each sample using an Attune¨ Acoustic Focusing Cytometer. The purple histogram represents unstained control cells and the green histogram represents no-primary-antibody control.
Supportive validation
- Submitted by
- Invitrogen Antibodies (provider)
- Main image
- Experimental details
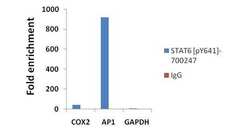
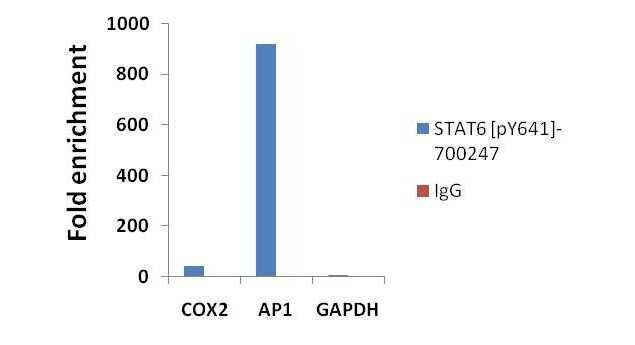
- ChIP- qPCR analysis of STAT6 (pY641) was performed with 3 µg/mL of the STAT6 (pY641) Recombinant Rabbit Monoclonal Antibody (Product # 700247) on sheared chromatin from 2 million HeLa cells treated with IFN-gamma (50 ng/mL) for 1h using the MAGnify Chromatin Immunoprecipitation System (Product # 49-2024). Normal rabbit IgG (3 µg/mL) was used as a negative IP control. The purified DNA from each ChIP sample was analyzed by StepOnePlus Real-Time PCR System (Product # 4376600) with primers for the promoter of active AP-1 and COX2 gene, used as positive control targets, and the GAPDH gene, used as negative control target. Data is presented as fold enrichment of the antibody signal versus the negative control IgG using the comparative CT method.
- Submitted by
- Invitrogen Antibodies (provider)
- Main image
- Experimental details
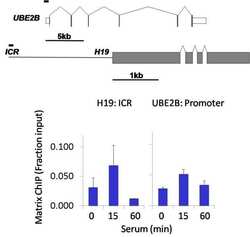
- Chromatin immunoprecipitation analysis of Phospho-STAT6 (pTyr641) was performed using cross-linked chromatin from 1 x 10^6 HCT116 human colon carcinoma cells treated with serum for 0, 15, and 60 minutes. Immunoprecipitation was performed using a multiplex microplate Matrix ChIP assay (see reference for Matrix ChIP protocol: http://www.ncbi.nlm.nih.gov/pubmed/22098709) with 1.0 µL/100 µL well volume of a Phospho-STAT6 (pTyr641) rabbit monoclonal antibody (Product # 700247). Chromatin aliquots from ~1 x 10^5 cells were used per ChIP pull-down. Quantitative PCR data were done in quadruplicate using 1 µL of eluted DNA in 2 µL SYBR real-time PCR reactions containing primers to amplify the promoter region of human UBE2B, or the imprinting control region (ICR) of the human H19 locus. PCR calibration curves were generated for each primer pair from a dilution series of sheared total genomic DNA. Quantitation of immunoprecipitated chromatin is presented as signal relative to the total amount of input chromatin. Results represent the mean +/- SEM for three experiments. A schematic representation of the human UBE2B and H19 loci are shown above the data where boxes represent exons (grey boxes = translated regions, white boxes = untranslated regions), the zigzag lines represent introns, and the straight line represents upstream sequence. Regions amplified by UBE2B and H19 primers are represented by black bars. Data courtesy of the Innovators Program.

- Submitted by
- Invitrogen Antibodies (provider)
- Main image

- Experimental details
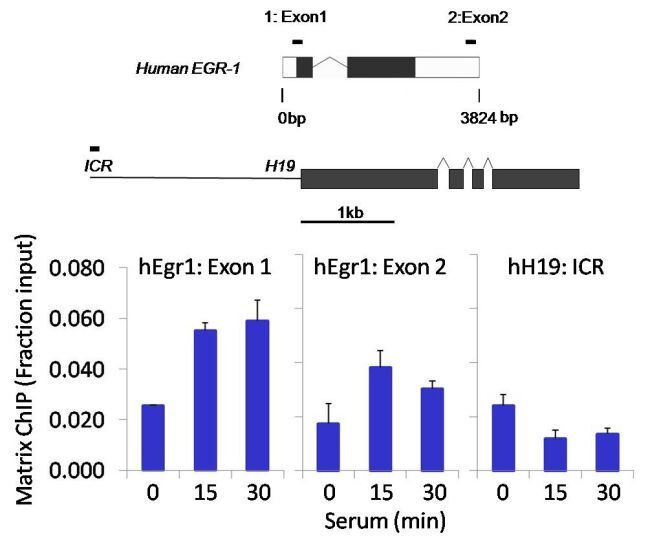
- Chromatin immunoprecipitation analysis of Phospho-STAT6 (pTyr641) was performed using cross-linked chromatin from 1 x 10^6 HCT116 human colon carcinoma cells treated with serum for 0, 15, and 30 minutes. Immunoprecipitation was performed using a multiplex microplate Matrix ChIP assay (see reference for Matrix ChIP protocol: http://www.ncbi.nlm.nih.gov/pubmed/22098709) with 1.0 µL/100 µL well volume of a Phospho-STAT6 (pTyr641) rabbit monoclonal antibody (Product # 700247). Chromatin aliquots from ~1 x 10^5 cells were used per ChIP pull-down. Quantitative PCR data were done in quadruplicate using 1 µL of eluted DNA in 2 µL SYBR real-time PCR reactions containing primers to amplify exon-1 or exon-2 of human Egr-1, or the imprinting control region (ICR) of the human H19 locus. PCR calibration curves were generated for each primer pair from a dilution series of sheared total genomic DNA. Quantitation of immunoprecipitated chromatin is presented as signal relative to the total amount of input chromatin. Results represent the mean +/- SEM for three experiments. A schematic representation of the human Egr-1 and H19 loci are shown above the data where boxes represent exons (black boxes = translated regions, white boxes = untranslated regions), the zigzag lines represent introns, and the straight line represents upstream sequence. Regions amplified by Egr-1 and H19 primers are represented by black bars. Data courtesy of the Innovators Program.

- Submitted by
- Invitrogen Antibodies (provider)
- Main image

- Experimental details
- ChIP- qPCR analysis of STAT6 (pY641) was performed with 3 µg/mL of the STAT6 (pY641) Recombinant Rabbit Monoclonal Antibody (Product # 700247) on sheared chromatin from 2 million HeLa cells treated with IFN-gamma (50 ng/mL) for 1h using the MAGnify Chromatin Immunoprecipitation System (Product # 49-2024). Normal rabbit IgG (3 µg/mL) was used as a negative IP control. The purified DNA from each ChIP sample was analyzed by StepOnePlus Real-Time PCR System (Product # 4376600) with primers for the promoter of active AP-1 and COX2 gene, used as positive control targets, and the GAPDH gene, used as negative control target. Data is presented as fold enrichment of the antibody signal versus the negative control IgG using the comparative CT method.

- Submitted by
- Invitrogen Antibodies (provider)
- Main image

- Experimental details
- Chromatin immunoprecipitation analysis of Phospho-STAT6 (pTyr641) was performed using cross-linked chromatin from 1 x 10^6 HCT116 human colon carcinoma cells treated with serum for 0, 15, and 60 minutes. Immunoprecipitation was performed using a multiplex microplate Matrix ChIP assay (see reference for Matrix ChIP protocol: http://www.ncbi.nlm.nih.gov/pubmed/22098709) with 1.0 µL/100 µL well volume of a Phospho-STAT6 (pTyr641) rabbit monoclonal antibody (Product # 700247). Chromatin aliquots from ~1 x 10^5 cells were used per ChIP pull-down. Quantitative PCR data were done in quadruplicate using 1 µL of eluted DNA in 2 µL SYBR real-time PCR reactions containing primers to amplify the promoter region of human UBE2B, or the imprinting control region (ICR) of the human H19 locus. PCR calibration curves were generated for each primer pair from a dilution series of sheared total genomic DNA. Quantitation of immunoprecipitated chromatin is presented as signal relative to the total amount of input chromatin. Results represent the mean +/- SEM for three experiments. A schematic representation of the human UBE2B and H19 loci are shown above the data where boxes represent exons (grey boxes = translated regions, white boxes = untranslated regions), the zigzag lines represent introns, and the straight line represents upstream sequence. Regions amplified by UBE2B and H19 primers are represented by black bars. Data courtesy of the Innovators Program.

- Submitted by
- Invitrogen Antibodies (provider)
- Main image

- Experimental details
- Chromatin immunoprecipitation analysis of Phospho-STAT6 (pTyr641) was performed using cross-linked chromatin from 1 x 10^6 HCT116 human colon carcinoma cells treated with serum for 0, 15, and 30 minutes. Immunoprecipitation was performed using a multiplex microplate Matrix ChIP assay (see reference for Matrix ChIP protocol: http://www.ncbi.nlm.nih.gov/pubmed/22098709) with 1.0 µL/100 µL well volume of a Phospho-STAT6 (pTyr641) rabbit monoclonal antibody (Product # 700247). Chromatin aliquots from ~1 x 10^5 cells were used per ChIP pull-down. Quantitative PCR data were done in quadruplicate using 1 µL of eluted DNA in 2 µL SYBR real-time PCR reactions containing primers to amplify exon-1 or exon-2 of human Egr-1, or the imprinting control region (ICR) of the human H19 locus. PCR calibration curves were generated for each primer pair from a dilution series of sheared total genomic DNA. Quantitation of immunoprecipitated chromatin is presented as signal relative to the total amount of input chromatin. Results represent the mean +/- SEM for three experiments. A schematic representation of the human Egr-1 and H19 loci are shown above the data where boxes represent exons (black boxes = translated regions, white boxes = untranslated regions), the zigzag lines represent introns, and the straight line represents upstream sequence. Regions amplified by Egr-1 and H19 primers are represented by black bars. Data courtesy of the Innovators Program.
Supportive validation
- Submitted by
- Invitrogen Antibodies (provider)
- Main image

- Experimental details
- NULL
- Submitted by
- Invitrogen Antibodies (provider)
- Main image
- Experimental details
- NULL
- Submitted by
- Invitrogen Antibodies (provider)
- Main image

- Experimental details
- Fig. 5 a Splenocytes isolated from naive C57BL/6 mice were stimulated with 10 ng/ml of mouse IL-4 for 0, 8, or 12 h in the absence or presence of 50 mug/ml S-NACH. Protein extracts were then prepared and subjected to immunoblot analysis with antibodies to GATA-3 or actin. b Splenocytes were treated as in ( a ) but collected after 0 min, 15 min, 45 min, 3 h, or 6 h of treatment. Protein extracts were then prepared and subjected to immunoblot analysis with antibodies to the phosphorylated form of STAT6 (p-STAT6) or GAPDH. c Protein extracts from splenocytes that were treated in a manner similar to those described in ( b ) were subjected to immunoblot analysis with antibodies to the phosphorylated form of JAK1 (p-JAK1), JAK1, or GAPDH. d A549 cells were treated with 10 ng/ml of human IL-4 for the indicated time intervals in the presence or absence of 50 mug/ml S-NACH. Protein extracts were prepared and subjected to immunoblot analysis with antibodies to iNOS, pSTAT6, or GAPDH. e A549 cells were treated as in ( d ) for 24 h. Protein extracts were subjected to immunoblot analysis with antibodies to GATA-3, ARG1, ARG2, or GAPDH
- Submitted by
- Invitrogen Antibodies (provider)
- Main image
- Experimental details
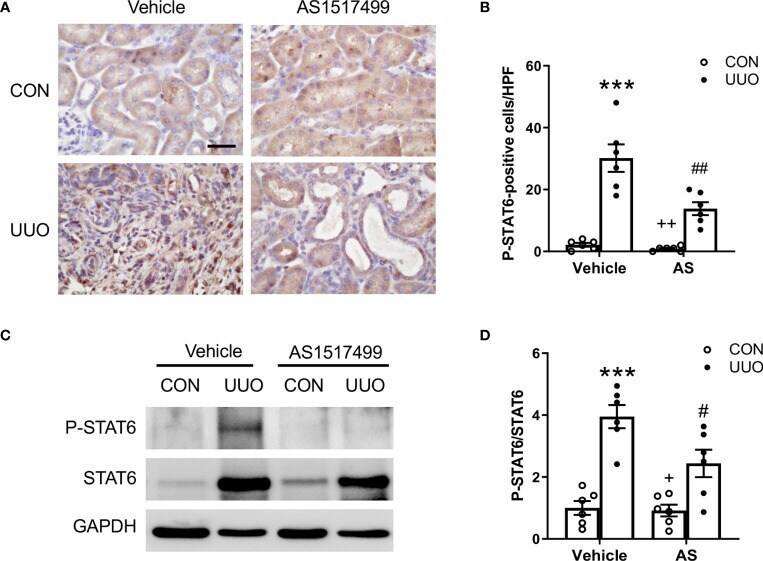
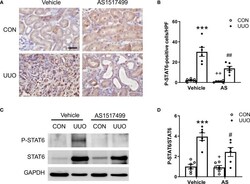
- Figure 1 AS1517499 inhibits STAT6 activation in the kidney with obstructive injury. (A) Representative photomicrographs of kidney sections at day 10 of UUO stained for phosphorylated STAT6 (brown) and counterstained with hematoxylin (blue). Scale bar, 50mum. (B) Quantitative analysis of phosphorylated STAT6-positive cells in the kidney. *** P < 0.001 vs . Vehicle-CON; ## P < 0.01 vs Vehicle-UUO; ++ P < 0.01 vs AS-UUO. n = 6 per group. (C) Representative Western blots show protein levels of p-STAT6 and STAT6 in the kidney at day 10 of UUO. (D) Quantitative analysis p-STAT6 protein levels in the kidney. *** P < 0.001 vs . Vehicle-CON; # P < 0.05 vs Vehicle-UUO; + P < 0.05 vs AS-UUO. n = 6 per group.