 Explore
 Validate
 Learn
Learn Western blot
 Immunohistochemistry
Antibody data
- Antibody Data
- Antigen structure
- References [1]
- Comments [0]
- Validations
- Immunohistochemistry [1]
- Other assay [1]
Submit
Validation data
Reference
Comment
Report error
- Product number
- PA5-36611 - Provider product page

- Provider
- Invitrogen Antibodies
- Product name
- SFRS15 Polyclonal Antibody
- Antibody type
- Polyclonal
- Antigen
- Synthetic peptide
- Description
- This antibody detects endogenous protein at a molecular weight of 126 kDa. Purity is >95% by SDS-PAGE.
- Reactivity
- Human, Mouse, Rat
- Host
- Rabbit
- Isotype
- IgG
- Vial size
- 100 μL
- Concentration
- 1 mg/mL
- Storage
- Store at 4°C short term. For long term storage, store at -20°C, avoiding freeze/thaw cycles.
Submitted references Large-scale and high-resolution mass spectrometry-based proteomics profiling defines molecular subtypes of esophageal cancer for therapeutic targeting.
Liu W, Xie L, He YH, Wu ZY, Liu LX, Bai XF, Deng DX, Xu XE, Liao LD, Lin W, Heng JH, Xu X, Peng L, Huang QF, Li CY, Zhang ZD, Wang W, Zhang GR, Gao X, Wang SH, Li CQ, Xu LY, Liu W, Li EM
Nature communications 2021 Aug 16;12(1):4961
Nature communications 2021 Aug 16;12(1):4961
No comments: Submit comment
Supportive validation
- Submitted by
- Invitrogen Antibodies (provider)
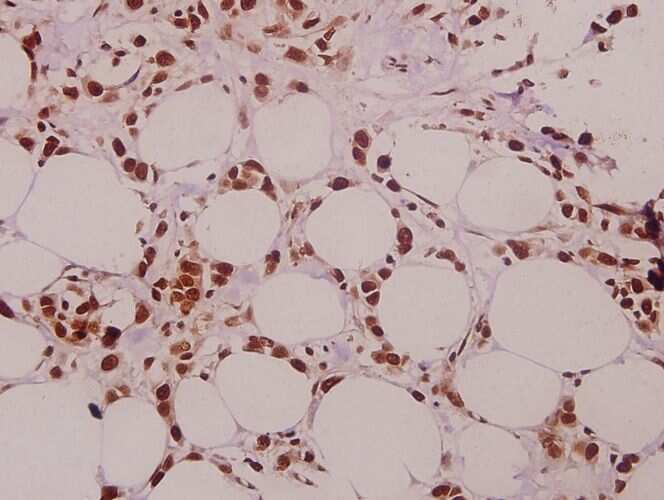
- Main image

- Experimental details
- Immunohistochemical analysis of SFRS15 in paraffin-embedded human colorectal carcinoma using SFRS15 polyclonal antibody (Product # PA5-36611) at a dilution of 1:50.
Supportive validation
- Submitted by
- Invitrogen Antibodies (provider)
- Main image
- Experimental details
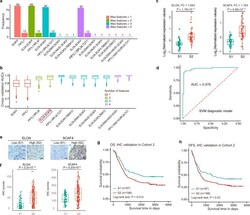
- Fig. 4 Subtype diagnostic signature composed of ELOA and SCAF4 were identified in EC. a Bar plots of the frequency of the signatures in 100 times feature selections. Red, green, cyan, and purple indicate that the maximum number of features is 1, 2, 3, and 4, respectively. b Box plots of the cross-validation AUCs (area under the ROC curve, n = 100) of the 11 signatures shown. c Box plots of log 2 -transformed protein expression ratios of ELOA (left) and SCAF4 (right) (S1, n = 61; S2, n = 63). P values are calculated by the two-sided Wilcoxon rank-sum test. d ROC curve of the SVM model with signature 4 (ELOA, SCAF4). e Representative IHC (immunohistochemistry) images of ELOA and SCAF4 protein expression in the independent EC Cohort (Cohort 2, n = 295). Scale bars, 100 um. f Box plots of IHC scores of ELOA (left) and SCAF4 (right) in the predicted S1 and S2 patients in Cohort 2 (S1, n = 97; S2, n = 198). P values are calculated by the two-sided Wilcoxon rank-sum test. g , h Kaplan-Meier curves of OS ( g ) and DFS ( h ) for each predicted subtype in the independent EC Cohort 2. P values are calculated by two-sided log-rank test. In the box plots b , c , f ), the middle bar represents the median, and the box represents the interquartile range; bars extend to 1.5x the interquartile range.
