 Explore
 Validate
 Learn
Learn Western blot
 Immunocytochemistry
Antibody data
- Antibody Data
- Antigen structure
- References [2]
- Comments [0]
- Validations
- Immunocytochemistry [3]
- Immunohistochemistry [2]
- Flow cytometry [1]
- Chromatin Immunoprecipitation [4]
Submit
Validation data
Reference
Comment
Report error
- Product number
- 700026 - Provider product page

- Provider
- Invitrogen Antibodies
- Product name
- IRAK4 Recombinant Rabbit Monoclonal Antibody (12H2L6)
- Antibody type
- Monoclonal
- Antigen
- Synthetic peptide
- Description
- This antibody is predicted to react with mouse, rat, primate, ovine, equine, porcine, bovine, canine and Xenopus based on sequence homology. Intact IgG appears on a non-reducing gel as ~150 kDa band and upon reduction generating a ~25 kDa light chain band and a ~50 kDa heavy chain. Recombinant rabbit monoclonal antibodies are produced using in vitro expression systems. The expression systems are developed by cloning in the specific antibody DNA sequences from immunoreactive rabbits. Then, individual clones are screened to select the best candidates for production. The advantages of using recombinant rabbit monoclonal antibodies include: better specificity and sensitivity, lot-to-lot consistency, animal origin-free formulations, and broader immunoreactivity to diverse targets due to larger rabbit immune repertoire.
- Reactivity
- Human
- Host
- Rabbit
- Isotype
- IgG
- Antibody clone number
- 12H2L6
- Vial size
- 100 μg
- Concentration
- 0.5 mg/mL
- Storage
- Store at 4°C short term. For long term storage, store at -20°C, avoiding freeze/thaw cycles.
Submitted references An Autochthonous Mouse Model of Myd88- and BCL2-Driven Diffuse Large B-cell Lymphoma Reveals Actionable Molecular Vulnerabilities.
Talin1 controls dendritic cell activation by regulating TLR complex assembly and signaling.
Flümann R, Rehkämper T, Nieper P, Pfeiffer P, Holzem A, Klein S, Bhatia S, Kochanek M, Kisis I, Pelzer BW, Ahlert H, Hauer J, da Palma Guerreiro A, Ryan JA, Reimann M, Riabinska A, Wiederstein J, Krüger M, Deckert M, Altmüller J, Klatt AR, Frenzel LP, Pasqualucci L, Béguelin W, Melnick AM, Sander S, Montesinos-Rongen M, Brunn A, Lohneis P, Büttner R, Kashkar H, Borkhardt A, Letai A, Persigehl T, Peifer M, Schmitt CA, Reinhardt HC, Knittel G
Blood cancer discovery 2021 Jan;2(1):70-91
Blood cancer discovery 2021 Jan;2(1):70-91
Talin1 controls dendritic cell activation by regulating TLR complex assembly and signaling.
Lim TJF, Bunjamin M, Ruedl C, Su IH
The Journal of experimental medicine 2020 Aug 3;217(8)
The Journal of experimental medicine 2020 Aug 3;217(8)
No comments: Submit comment
Supportive validation
- Submitted by
- Invitrogen Antibodies (provider)
- Main image

- Experimental details
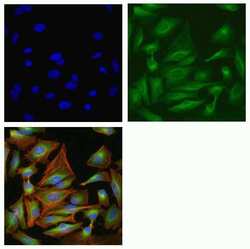
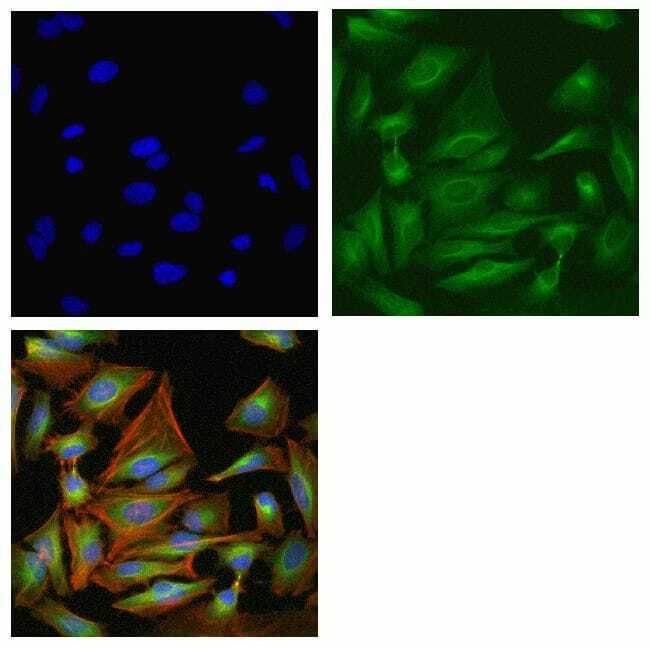
- Immunofluorescent analysis of IRAK-4 in HeLa cells using an IRAK-4 recombinant rabbit monoclonal antibody (Product # 700026) at a dilution of 5 µg/mL followed by detection using an Alexa Fluor 488-conjugated goat anti-rabbit secondary antibody at a dilution of 1:1000. Actin was stained using Alexa Fluor 568 Phalloidin at a dilution of 1:200. Panels: Hoechst only (top left), AF488 signal only (top right) and composite image with Phalloidin (bottom left).

- Submitted by
- Invitrogen Antibodies (provider)
- Main image
- Experimental details
- Immunofluorescent analysis of IRAK-4 in HeLa cells using an IRAK-4 recombinant rabbit monoclonal antibody (Product # 700026) at a dilution of 5 µg/mL followed by detection using an Alexa Fluor 488-conjugated goat anti-rabbit secondary antibody at a dilution of 1:1000. Actin was stained using Alexa Fluor 568 Phalloidin at a dilution of 1:200. Panels: Hoechst only (top left), AF488 signal only (top right) and composite image with Phalloidin (bottom left).

- Submitted by
- Invitrogen Antibodies (provider)
- Main image

- Experimental details
- Immunofluorescent analysis of IRAK-4 in HeLa cells using an IRAK-4 recombinant rabbit monoclonal antibody (Product # 700026) at a dilution of 5 µg/mL followed by detection using an Alexa Fluor 488-conjugated goat anti-rabbit secondary antibody at a dilution of 1:1000. Actin was stained using Alexa Fluor 568 Phalloidin at a dilution of 1:200. Panels: Hoechst only (top left), AF488 signal only (top right) and composite image with Phalloidin (bottom left).
Supportive validation
- Submitted by
- Invitrogen Antibodies (provider)
- Main image
- Experimental details
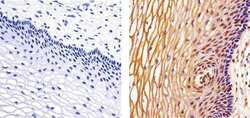
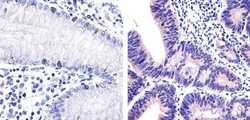
- Immunohistochemistry analysis of IRAK4 showing staining in the cytoplasm of paraffin-embedded human cervix tissue (right) compared to a negative control without primary antibody (left). To expose target proteins, antigen retrieval was performed using 10mM sodium citrate (pH 6.0), microwaved for 8-15 min. Following antigen retrieval, tissues were blocked in 3% H2O2-methanol for 15 min at room temperature, washed with ddH2O and PBS, and then probed with a IRAK4 Recombinant Rabbit Monoclonal Antibody (Product # 700026) diluted in 3% BSA-PBS at a dilution of 1:20 overnight at 4°C in a humidified chamber. Tissues were washed extensively in PBST and detection was performed using an HRP-conjugated secondary antibody followed by colorimetric detection using a DAB kit. Tissues were counterstained with hematoxylin and dehydrated with ethanol and xylene to prep for mounting.
- Submitted by
- Invitrogen Antibodies (provider)
- Main image
- Experimental details
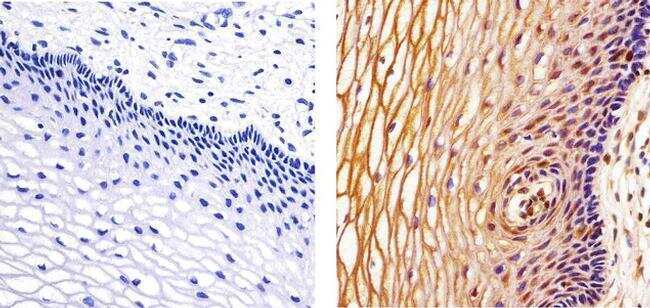
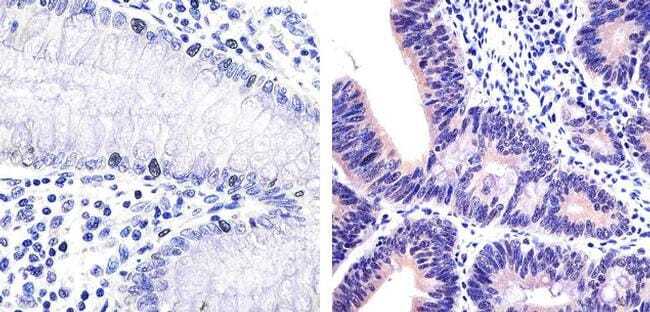
- Immunohistochemistry analysis of IRAK4 showing staining in the cytoplasm of paraffin-embedded human colon carcinoma tissue (right) compared to a negative control without primary antibody (left). To expose target proteins, antigen retrieval was performed using 10mM sodium citrate (pH 6.0), microwaved for 8-15 min. Following antigen retrieval, tissues were blocked in 3% H2O2-methanol for 15 min at room temperature, washed with ddH2O and PBS, and then probed with a IRAK4 Recombinant Rabbit Monoclonal Antibody (Product # 700026) diluted in 3% BSA-PBS at a dilution of 1:100 overnight at 4ºC in a humidified chamber. Tissues were washed extensively in PBST and detection was performed using an HRP-conjugated secondary antibody followed by colorimetric detection using a DAB kit. Tissues were counterstained with hematoxylin and dehydrated with ethanol and xylene to prep for mounting.
Supportive validation
- Submitted by
- Invitrogen Antibodies (provider)
- Main image
- Experimental details
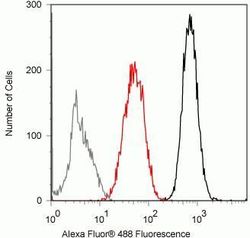
- Flow cytometry analysis of IRAK-4 in Jurkat cells using an IRAK-4 recombinant rabbit monoclonal antibody (Product # 700026) at a dilution of 0.5ug. Cells were fixed and permeabilized using FIX & PERM (Product # GAS004) reagent, and detection was performed using an Alexa Fluor 488 goat anti-rabbit IgG (black) compared to a control without primary antibody (gray). Pre-incubation with the immunogenic peptide decreased the signal (red).
Supportive validation
- Submitted by
- Invitrogen Antibodies (provider)
- Main image

- Experimental details
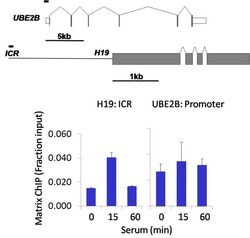
- Chromatin immunoprecipitation analysis of IRAK-4 was performed using cross-linked chromatin from 1 x 10^6 HCT116 human colon carcinoma cells treated with serum for 0, 15, and 60 minutes. Immunoprecipitation was performed using a multiplex microplate Matrix ChIP assay (see reference for Matrix ChIP protocol: http://www.ncbi.nlm.nih.gov/pubmed/22098709) with 1.0 µL/100 µL well volume of an IRAK-4 rabbit monoclonal antibody (Product # 700026). Chromatin aliquots from ~1 x 10^5 cells were used per ChIP pull-down. Quantitative PCR data were done in quadruplicate using 1 µL of eluted DNA in 2 µL SYBR real-time PCR reactions containing primers to amplify the promoter region of human UBE2B, or the imprinting control region (ICR) of the human H19 locus. PCR calibration curves were generated for each primer pair from a dilution series of sheared total genomic DNA. Quantitation of immunoprecipitated chromatin is presented as signal relative to the total amount of input chromatin. Results represent the mean +/- SEM for three experiments. A schematic representation of the human UBE2B and H19 loci are shown above the data where boxes represent exons (grey boxes = translated regions, white boxes = untranslated regions), the zigzag lines represent introns, and the straight line represents upstream sequence. Regions amplified by UBE2B and H19 primers are represented by black bars. Data courtesy of the Innovators Program.

- Submitted by
- Invitrogen Antibodies (provider)
- Main image
- Experimental details
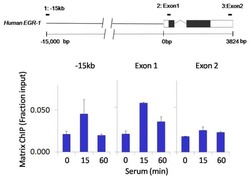
- Chromatin immunoprecipitation analysis of IRAK-4 performed using cross-linked chromatin from 1 x 10^6 HCT116 human colon carcinoma cells treated with serum for 0, 15, and 60 minutes. Immunoprecipitation was performed using a multiplex microplate Matrix ChIP assay (see reference for Matrix ChIP protocol: http://www.ncbi.nlm.nih.gov/pubmed/22098709) with 1.0 µL/100 µL well volume of an IRAK-4 rabbit monoclonal antibody (Product # 700026). Chromatin aliquots from ~1 x 10^5 cells were used per ChIP pull-down. Quantitative PCR data were done in quadruplicate using 1 µL of eluted DNA in 2 µL SYBR real-time PCR reactions containing primers to amplify -15kb upstream of the human Egr-1 locus, or exon-1 or exon-2 of Egr-1. PCR calibration curves were generated for each primer pair from a dilution series of sheared total genomic DNA. Quantitation of immunoprecipitated chromatin is presented as signal relative to the total amount of input chromatin. Results represent the mean +/- SEM for three experiments. A schematic representation of the Egr-1 locus is shown above the data where boxes represent exons (black boxes = translated regions, white boxes = untranslated regions), the zigzag line represents an intron, and the straight line represents upstream sequence. Regions amplified by Egr-1 primers are represented by black bars. Data courtesy of the Innovators Program.

- Submitted by
- Invitrogen Antibodies (provider)
- Main image
- Experimental details
- Chromatin immunoprecipitation analysis of IRAK-4 was performed using cross-linked chromatin from 1 x 10^6 HCT116 human colon carcinoma cells treated with serum for 0, 15, and 60 minutes. Immunoprecipitation was performed using a multiplex microplate Matrix ChIP assay (see reference for Matrix ChIP protocol: http://www.ncbi.nlm.nih.gov/pubmed/22098709) with 1.0 µL/100 µL well volume of an IRAK-4 rabbit monoclonal antibody (Product # 700026). Chromatin aliquots from ~1 x 10^5 cells were used per ChIP pull-down. Quantitative PCR data were done in quadruplicate using 1 µL of eluted DNA in 2 µL SYBR real-time PCR reactions containing primers to amplify the promoter region of human UBE2B, or the imprinting control region (ICR) of the human H19 locus. PCR calibration curves were generated for each primer pair from a dilution series of sheared total genomic DNA. Quantitation of immunoprecipitated chromatin is presented as signal relative to the total amount of input chromatin. Results represent the mean +/- SEM for three experiments. A schematic representation of the human UBE2B and H19 loci are shown above the data where boxes represent exons (grey boxes = translated regions, white boxes = untranslated regions), the zigzag lines represent introns, and the straight line represents upstream sequence. Regions amplified by UBE2B and H19 primers are represented by black bars. Data courtesy of the Innovators Program.

- Submitted by
- Invitrogen Antibodies (provider)
- Main image

- Experimental details
- Chromatin immunoprecipitation analysis of IRAK-4 performed using cross-linked chromatin from 1 x 10^6 HCT116 human colon carcinoma cells treated with serum for 0, 15, and 60 minutes. Immunoprecipitation was performed using a multiplex microplate Matrix ChIP assay (see reference for Matrix ChIP protocol: http://www.ncbi.nlm.nih.gov/pubmed/22098709) with 1.0 µL/100 µL well volume of an IRAK-4 rabbit monoclonal antibody (Product # 700026). Chromatin aliquots from ~1 x 10^5 cells were used per ChIP pull-down. Quantitative PCR data were done in quadruplicate using 1 µL of eluted DNA in 2 µL SYBR real-time PCR reactions containing primers to amplify -15kb upstream of the human Egr-1 locus, or exon-1 or exon-2 of Egr-1. PCR calibration curves were generated for each primer pair from a dilution series of sheared total genomic DNA. Quantitation of immunoprecipitated chromatin is presented as signal relative to the total amount of input chromatin. Results represent the mean +/- SEM for three experiments. A schematic representation of the Egr-1 locus is shown above the data where boxes represent exons (black boxes = translated regions, white boxes = untranslated regions), the zigzag line represents an intron, and the straight line represents upstream sequence. Regions amplified by Egr-1 primers are represented by black bars. Data courtesy of the Innovators Program.
