Explore
 Validate
 Learn
Learn Western blot
 Immunoprecipitation
Antibody data
- Antibody Data
- Antigen structure
- References [1]
- Comments [0]
- Validations
- Western blot [2]
- Other assay [1]
Submit
Validation data
Reference
Comment
Report error
- Product number
- OPA1-04022 - Provider product page

- Provider
- Invitrogen Antibodies
- Product name
- NMDAR2B Polyclonal Antibody
- Antibody type
- Polyclonal
- Antigen
- Other
- Description
- This antibody shows no cross-reactivity with NR2A subunit. Reconstitute with 50 µL of PBS.
- Reactivity
- Human, Mouse, Rat
- Host
- Rabbit
- Isotype
- IgG
- Vial size
- 10 µg
- Storage
- -20° C, Avoid Freeze/Thaw Cycles
Submitted references Src/CK2/PTEN-Mediated GluN2B and CREB Dephosphorylations Regulate the Responsiveness to AMPA Receptor Antagonists in Chronic Epilepsy Rats.
Kim JE, Lee DS, Park H, Kang TC
International journal of molecular sciences 2020 Dec 17;21(24)
International journal of molecular sciences 2020 Dec 17;21(24)
No comments: Submit comment
Supportive validation
- Submitted by
- Invitrogen Antibodies (provider)
- Main image
- Experimental details
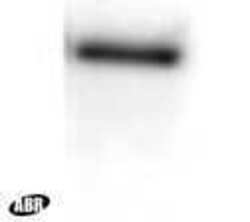
- Western blot detection of NMDA receptor 2B from rat hippocampal lysate at ~180 kDa using OPA1-04022.

- Submitted by
- Invitrogen Antibodies (provider)
- Main image

- Experimental details
- Western blot of NMDAR2B in rat hippocampal lysate (10 µg) using a NMDAR2B polyclonal antibody (Product # OPA1-04022), showing specific immunolabeling of a ~180 kDa band corresponding to the NR2B subunit of the NMDA receptor.

Supportive validation
- Submitted by
- Invitrogen Antibodies (provider)
- Main image
- Experimental details
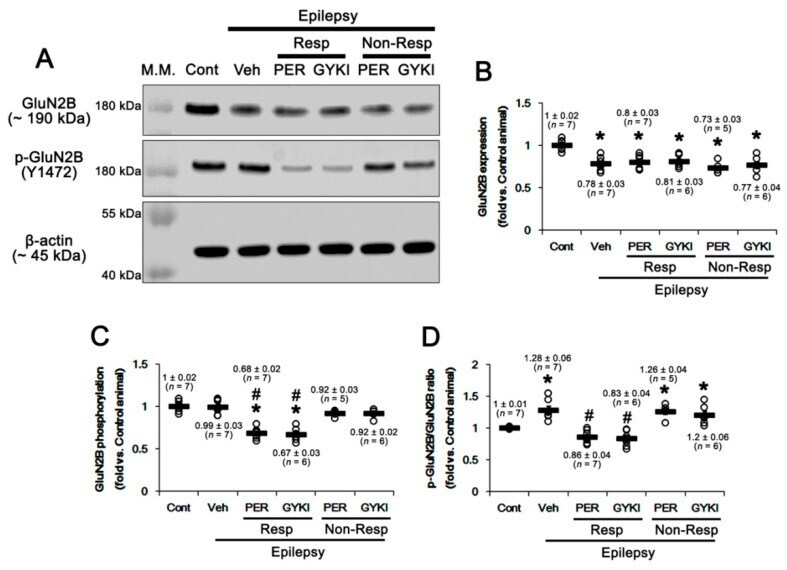
- Figure 2 The effects of perampanel (PER) and GYKI 52,466 (GYKI) on total glutamate ionotropic receptor NMDA type subunit 2B (GluN2B) expression and its tyrosine (Y) 1472 phosphorylation (p-GluN2B) in chronic epilepsy rats. ( A ) Representative images for Western blot of GluN2B and GluN2B Y1472 levels in the hippocampal tissues. ( B - D ) Quantifications of GluN2B ( B ), p-GluN2B ( C ), and p-GluN2B/GluN2B ratio ( D ) in the hippocampal tissues. Open circles indicate each individual value. Horizontal bars indicate mean value. Error bars indicate SEM ( * , # p < 0.05 vs. control and vehicle (Veh)-treated animals, respectively; one-way ANOVA with post hoc Bonferroni's multiple comparison).