Explore
 Validate
 Learn
LearnPA3-105
antibody from Invitrogen Antibodies
Targeting: GRIN2B
GluN2B, NMDAR2B
 Western blot ELISA
 Immunocytochemistry Immunoprecipitation Immunohistochemistry Flow cytometry Other assay
Antibody data
- Antibody Data
- Antigen structure
- References [3]
- Comments [0]
- Validations
- Immunocytochemistry [2]
- Immunohistochemistry [1]
- Flow cytometry [1]
- Other assay [1]
Submit
Validation data
Reference
Comment
Report error
- Product number
- PA3-105 - Provider product page

- Provider
- Invitrogen Antibodies
- Product name
- Phospho-NMDAR2B (Tyr1336) Polyclonal Antibody
- Antibody type
- Polyclonal
- Antigen
- Synthetic peptide
- Description
- PA3-105 detects Phospho-N-methyl-D-aspartate (NMDA) receptor type 2B. PA3-105 has been used successfully in Western blot, ELISA, immunoprecipitation, immunohistochemistry, and immunocytochemistry procedures. In Western blot analysis of rat brain synaptic membranes this antibody detects a ~180 kDa protein representing NMDA receptor type 2B. The PA3-105 immunogen is a synthetic phosphopeptide corresponding to residues (C) G(1328) R F M D G S P Y(p) H(1337) of rat NMDA receptor 2B.
- Reactivity
- Human, Mouse, Rat
- Host
- Rabbit
- Isotype
- IgG
- Vial size
- 200 μL
- Concentration
- Conc. Not Determined
- Storage
- -20°C, Avoid Freeze/Thaw Cycles
Submitted references Synaptic proximity enables NMDAR signalling to promote brain metastasis.
GKAP Acts as a Genetic Modulator of NMDAR Signaling to Govern Invasive Tumor Growth.
Hijacking the neuronal NMDAR signaling circuit to promote tumor growth and invasion.
Zeng Q, Michael IP, Zhang P, Saghafinia S, Knott G, Jiao W, McCabe BD, Galván JA, Robinson HPC, Zlobec I, Ciriello G, Hanahan D
Nature 2019 Sep;573(7775):526-531
Nature 2019 Sep;573(7775):526-531
GKAP Acts as a Genetic Modulator of NMDAR Signaling to Govern Invasive Tumor Growth.
Li L, Zeng Q, Bhutkar A, Galván JA, Karamitopoulou E, Noordermeer D, Peng MW, Piersigilli A, Perren A, Zlobec I, Robinson H, Iruela-Arispe ML, Hanahan D
Cancer cell 2018 Apr 9;33(4):736-751.e5
Cancer cell 2018 Apr 9;33(4):736-751.e5
Hijacking the neuronal NMDAR signaling circuit to promote tumor growth and invasion.
Li L, Hanahan D
Cell 2013 Mar 28;153(1):86-100
Cell 2013 Mar 28;153(1):86-100
No comments: Submit comment
Supportive validation
- Submitted by
- Invitrogen Antibodies (provider)
- Main image

- Experimental details
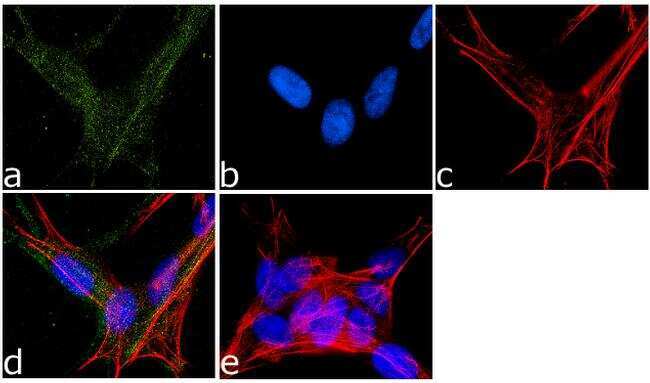
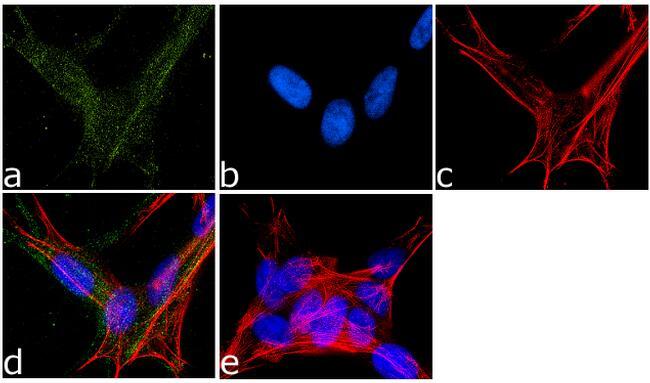
- Immunofluorescence analysis of NMDA Receptor 2B was done on 70% confluent log phase SHSY5Y cells. The cells were fixed with 4% paraformaldehyde for 15 minutes, permeabilized with 0.25% Triton™ X-100 for 10 minutes, and blocked with 5% BSA for 1 hour at room temperature. The cells were labeled with Phospho-NMDAR2B (Tyr1336) Rabbit Polyclonal Antibody (Product # PA3-105) at 1:250 dilution in 0.1% BSA and incubated for 3 hours at room temperature and then labeled with Goat anti-Rabbit IgG (H+L) Superclonal™ Secondary Antibody, Alexa Fluor® 488 conjugate (Product # A27034) at a dilution of 1:2,000 for 45 minutes at room temperature (Panel a: green). Nuclei (Panel b: blue) were stained with SlowFade® Gold Antifade Mountant with DAPI (Product # S36938). F-actin (Panel c: red) was stained with Rhodamine Phalloidin (Product # R415, 1:300). Panel d is a merged image showing membranous localization. Panel e is a no primary antibody control. The images were captured at 60X magnification.
- Submitted by
- Invitrogen Antibodies (provider)
- Main image

- Experimental details
- Immunofluorescence analysis of NMDA Receptor 2B was done on 70% confluent log phase SHSY5Y cells. The cells were fixed with 4% paraformaldehyde for 15 minutes, permeabilized with 0.25% Triton™ X-100 for 10 minutes, and blocked with 5% BSA for 1 hour at room temperature. The cells were labeled with Phospho-NMDAR2B (Tyr1336) Rabbit Polyclonal Antibody (Product # PA3-105) at 1:250 dilution in 0.1% BSA and incubated for 3 hours at room temperature and then labeled with Goat anti-Rabbit IgG (Heavy Chain) Superclonal™ Secondary Antibody, Alexa Fluor® 488 conjugate (Product # A27034) at a dilution of 1:2,000 for 45 minutes at room temperature (Panel a: green). Nuclei (Panel b: blue) were stained with SlowFade® Gold Antifade Mountant with DAPI (Product # S36938). F-actin (Panel c: red) was stained with Rhodamine Phalloidin (Product # R415, 1:300). Panel d is a merged image showing membranous localization. Panel e is a no primary antibody control. The images were captured at 60X magnification.
Supportive validation
- Submitted by
- Invitrogen Antibodies (provider)
- Main image
- Experimental details
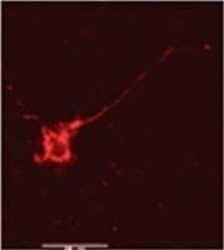
- Immunofluorescence image of NMDA receptor type 2B in rat brain tissue using Phospho-NMDAR2B (Tyr1336) Polyclonal Antibody (Product # PA3-105).

Supportive validation
- Submitted by
- Invitrogen Antibodies (provider)
- Main image
- Experimental details
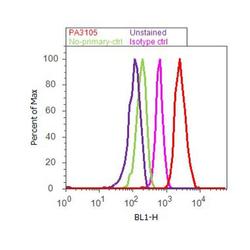
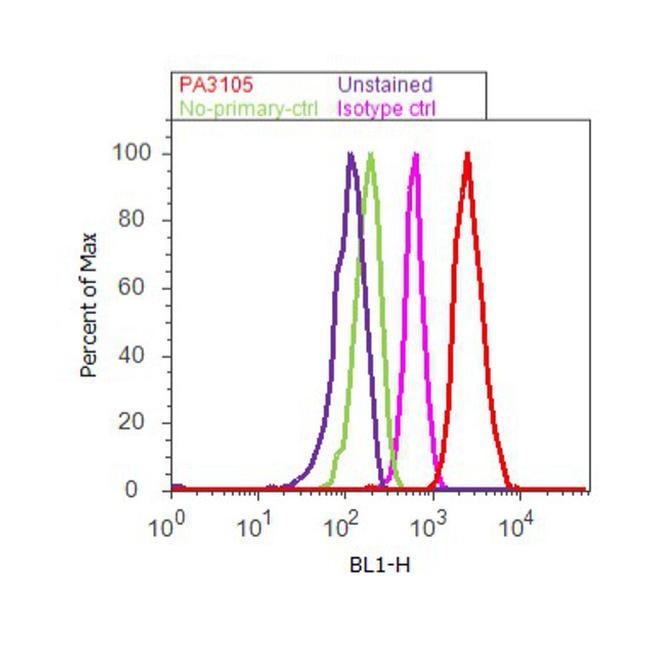
- Flow cytometry analysis of NMDA Receptor 2B was done on SH-SY5Y cells. Cells were fixed with 70% ethanol for 10 minutes, permeabilized with 0.25% Triton™ X-100 for 20 minutes, and blocked with 5% BSA for 30 minutes at room temperature. Cells were labeled with NMDA Receptor 2B Rabbit Polyclonal Antibody (PA3105, red histogram) or with rabbit isotype control (pink histogram) at 3-5 ug/million cells in 2.5% BSA. After incubation at room temperature for 2 hours, the cells were labeled with Alexa Fluor® 488 Goat Anti-Rabbit Secondary Antibody (A11008) at a dilution of 1:400 for 30 minutes at room temperature. The representative 10,000 cells were acquired and analyzed for each sample using an Attune® Acoustic Focusing Cytometer. The purple histogram represents unstained control cells and the green histogram represents no-primary-antibody control.
Supportive validation
- Submitted by
- Invitrogen Antibodies (provider)
- Main image

- Experimental details
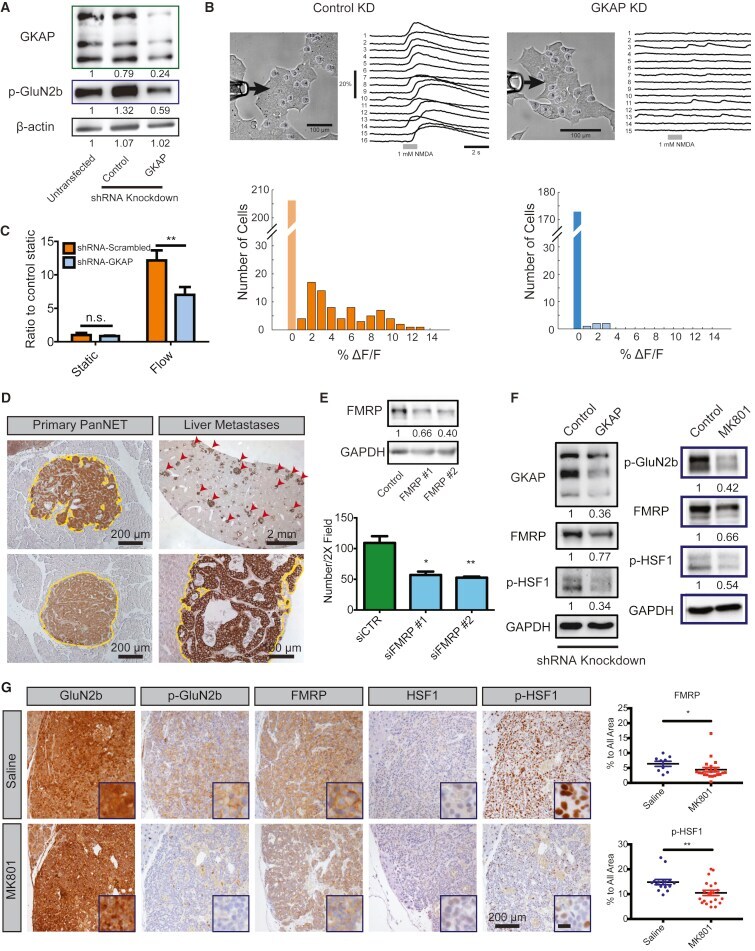
- Figure 4 GKAP Regulates Cancer Cell Invasion through NMDAR Activity and Downstream Effectors FMRP and HSF1 (A) Western blot for GKAP and p-GluN2b in control and GKAP-knockdown betaTC-3 cells under unstimulated cell culture conditions. The numbers below indicate levels of p-GluN2b and GKAP normalized to untransfected betaTC-3. (B) Fluorescence reporter assay was performed in betaTC-3 small hairpin RNA (shRNA) control and GKAP-knockdown (KD) cells lines, comparing calcium transients induced by puffing an NMDA solution onto the cells. Clusters of cultured control betaTC-3 cells or GKAP-KD betaTC-3 cells were analyzed under a bright-field microscope after an NMDA solution (1 mM, 1 s) was puffed through perfusion pipette at left (upper panels). The arrows indicate the direction of puffing. betaTC-3 shRNA control KD cells: 78 of 284 cells examined showed a response (orange bars). betaTC-3 shRNA-GKAP KD cells: 5 of 178 cells showed minor NMDA responses (light blue bars). p < 10 -11 , Wilcoxon rank-sum test. Histogram of transient amplitude, denoting time-resolved fluorescence signals (sampling frequency/frame rate = 12.5 Hz). Light orange bar and blue bar indicate cells with no response. (C) Invasion assay in control and GKAP-KD betaTC-3 cells. Two-way ANOVA, Bonferroni multiple comparisons test: ** p < 0.01; n.s., not significant (mean +- SEM, n = 3 invasion assay devices/condition in one experiment; two independent experiments were performed with consistent results). (D) IHC stai