 Explore
 Validate
 Learn
Learn Western blot
Antibody data
- Antibody Data
- Antigen structure
- References [6]
- Comments [0]
- Validations
- Western blot [3]
- Immunocytochemistry [3]
- Flow cytometry [1]
- Other assay [5]
Submit
Validation data
Reference
Comment
Report error
- Product number
- 700308 - Provider product page

- Provider
- Invitrogen Antibodies
- Product name
- EGFR Recombinant Rabbit Monoclonal Antibody (30H45L48)
- Antibody type
- Monoclonal
- Antigen
- Other
- Reactivity
- Human
- Host
- Rabbit
- Isotype
- IgG
- Antibody clone number
- 30H45L48
- Vial size
- 100 µg
- Concentration
- 0.5 mg/mL
- Storage
- Store at 4°C short term. For long term storage, store at -20°C, avoiding freeze/thaw cycles.
Submitted references Erlotinib Promotes Ligand-Induced EGFR Degradation in 3D but Not 2D Cultures of Pancreatic Ductal Adenocarcinoma Cells.
VEGF Upregulates EGFR Expression to Stimulate Chemotactic Behaviors in the rMC-1 Model of Müller Glia.
Functional evaluation of fluorescein-labeled derivatives of a peptide inhibitor of the EGF receptor dimerization.
Multiplexed Analysis for Anti-Epidermal Growth Factor Receptor Tumor Cell Growth Inhibition Based on Quantum Dot Probes.
EGF as a New Therapeutic Target for Medulloblastoma Metastasis.
Detachment of cells adhered on the photoreactive phospholipid polymer surface by photoirradiation and their functionality.
Betriu N, Andreeva A, Semino CE
Cancers 2021 Sep 7;13(18)
Cancers 2021 Sep 7;13(18)
VEGF Upregulates EGFR Expression to Stimulate Chemotactic Behaviors in the rMC-1 Model of Müller Glia.
Peña JS, Vazquez M
Brain sciences 2020 May 29;10(6)
Brain sciences 2020 May 29;10(6)
Functional evaluation of fluorescein-labeled derivatives of a peptide inhibitor of the EGF receptor dimerization.
Toyama K, Mizuguchi T, Nomura W, Tamamura H
Bioorganic & medicinal chemistry 2016 Aug 15;24(16):3406-12
Bioorganic & medicinal chemistry 2016 Aug 15;24(16):3406-12
Multiplexed Analysis for Anti-Epidermal Growth Factor Receptor Tumor Cell Growth Inhibition Based on Quantum Dot Probes.
Ren D, Xia Y, Wang B, You Z
Analytical chemistry 2016 Apr 19;88(8):4318-27
Analytical chemistry 2016 Apr 19;88(8):4318-27
EGF as a New Therapeutic Target for Medulloblastoma Metastasis.
Rico-Varela J, Singh T, McCutcheon S, Vazquez M
Cellular and molecular bioengineering 2015 Dec;8(4):553-565
Cellular and molecular bioengineering 2015 Dec;8(4):553-565
Detachment of cells adhered on the photoreactive phospholipid polymer surface by photoirradiation and their functionality.
Byambaa B, Konno T, Ishihara K
Colloids and surfaces. B, Biointerfaces 2013 Mar 1;103:489-95
Colloids and surfaces. B, Biointerfaces 2013 Mar 1;103:489-95
No comments: Submit comment
Supportive validation
- Submitted by
- Invitrogen Antibodies (provider)
- Main image
- Experimental details
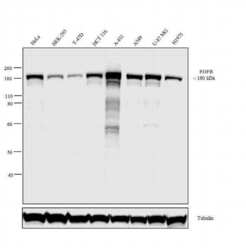
- Western blot analysis was performed on membrane enriched extracts (30 µg lysate) of HeLa (Lane 1), HEK-293 (Lane 2), T-47D (Lane 3), HCT116 (Lane 4), A-431 (Lane 5), A549 (Lane 6), U-87 MG (Lane 7) and H1975 (Lane 8). The blot was probed with Recombinant Rabbit Monoclonal EGFR Antibody (Product # 700308, 1:1000 dilution) and detected by chemiluminescence using Goat anti-Rabbit IgG (H+L) Recombinant Superclonal™ Secondary Antibody, HRP conjugate (Product # A27036, 0.25 µg/mL, 1:4000 dilution). A 180 kDa band corresponding to EGFR was observed across the cell lines tested. Known quantity of protein samples were electrophoresed using Novex®NuPAGE®10 % Bis-Tris gel (Product # NP0301BOX), XCell SureLock™ Electrophoresis System (Product # EI0002) and Novex® Sharp Pre-Stained Protein Standard (Product # LC5800). Resolved proteins were then transferred onto a nitrocellulose membrane using wet transfer system. The membrane was probed with the relevant primary and secondary antibody following blocking with 5 % skimmed milk. Chemiluminescent detection was performed using Pierce™ ECL Western blotting Substrate (Product # 32106).

- Submitted by
- Invitrogen Antibodies (provider)
- Main image
- Experimental details
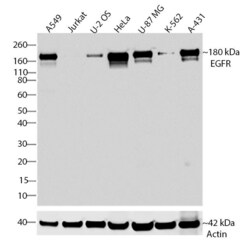
- Western blot analysis of EGFR was performed by loading 30 µg of A549, Jurkat, U-2 OS, HeLa, U-87 MG, K562 and A431 cell lysates using Novex®NuPAGE® 4-12% Bis-Tris gel (Product # NP0321BOX), XCell SureLock Electrophoresis System (Product # EI0002), and Novex® Sharp Pre-Stained Protein Standard (Product # LC5800). Proteins were transferred to a PVDF membrane and blocked with 5% skim milk for 1 hour at room temperature. EGFR was detected at ~180 kDa using EGFR Recombinant Rabbit Monoclonal Antibody (Product # 700308) at a 1:1000 dilution in 2.5% skim milk at 4°C overnight on a rocking platform. Detection was performed using an HRP-conjugated Goat anti-Rabbit secondary antibody (Product # G-21234) at a 1:5000 dilution and chemiluminescent detection was performed using Pierce™ ECL Western blotting Substrate (Product # 32106).

- Submitted by
- Invitrogen Antibodies (provider)
- Main image

- Experimental details
- Western blot analysis of EGFR in A431 cell lysate (30 µg) using an EGFR recombinant rabbit monoclonal antibody (Product # 700308) at a dilution of 1 µg/mL. NBT/BCIP was used as the substrate (Product # WB7105).

Supportive validation
- Submitted by
- Invitrogen Antibodies (provider)
- Main image
- Experimental details
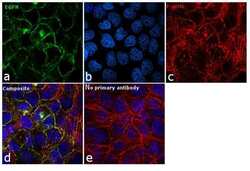
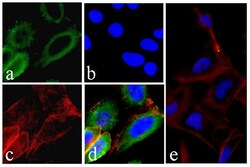
- Immunofluorescence analysis of EGFR was performed using 90% confluent log phase A-431 cells. The cells were fixed with 4% paraformaldehyde for 10 minutes, permeabilized with 0.1% Triton™ X-100 for 15 minutes, and blocked with 1% BSA for 1 hour at room temperature. The cells were labeled with EGFR Antibody (30H45L48), Recombinant Rabbit Monoclonal (Product # 700308) at 5 microgram/mL in 0.1% BSA, incubated at 4 degree Celsius overnight and then labeled with Goat anti-Rabbit IgG (H+L) Superclonal™ Secondary Antibody, Alexa Fluor® 488 conjugate (Product # A27034) at a dilution of 1:2000 for 45 minutes at room temperature (Panel a: green). Nuclei (Panel b: blue) were stained with SlowFade® Gold Antifade Mountant with DAPI (Product # S36938). F-actin (Panel c: red) was stained with Rhodamine Phalloidin (Product # R415, 1:300). Panel d represents the merged image showing membranous localization. Panel e represents control cells with no primary antibody to assess background. The images were captured at 60X magnification.

- Submitted by
- Invitrogen Antibodies (provider)
- Main image

- Experimental details
- Immunofluorescent analysis of EGFR in HeLa cells using an EGFR recombinant rabbit monoclonal antibody (Product # 700308) at a dilution of 10 µg/mL followed by detection using an Alexa Fluor 488-conjugated goat anti-rabbit secondary antibody at a dilution of 1:1000 (green), nuclei staining using DAPI (blue) and Alexa Fluor 594 Phalloidin (red).
- Submitted by
- Invitrogen Antibodies (provider)
- Main image
- Experimental details
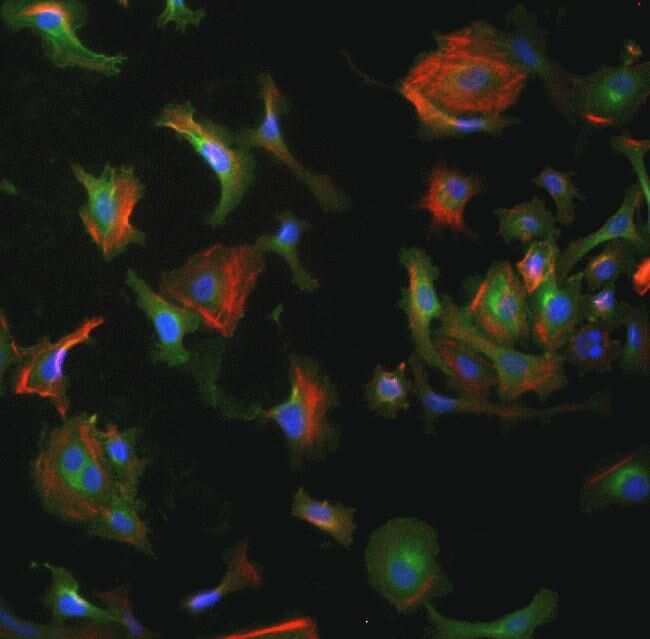
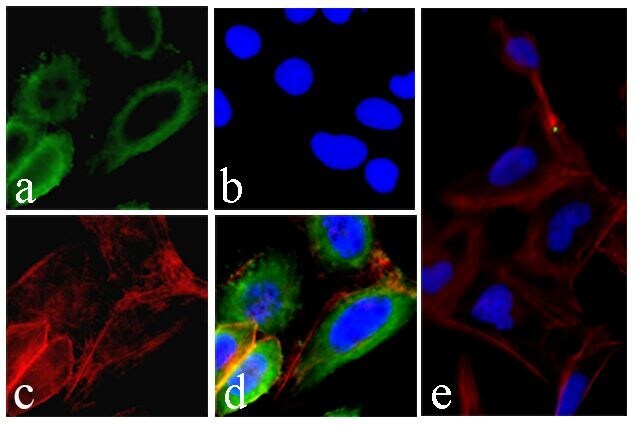
- Immunofluorescent analysis of EGFR was performed on 70% confluent log phase HeLa cells. The cells were fixed with 4% paraformaldehyde for 15 minutes, permeabilized with 0. 25% Triton X-100 for 10 minutes, and blocked with 5% BSA for 1 hour at room temperature. The cells were labeled with EGFR Recombinant Rabbit Monoclonal Antibody (Product # 700308) at a dilution of 1:400 in 1% BSA and incubated for 3 hours at room temperature and then labeled with Alexa Fluor® 488 Goat anti-Rabbit IgG secondary antibody (Product # A-11008) at a dilution of 1:400 for 30 minutes at room temperature (Panel a: green). Nuclei (Panel b: blue) were stained with SlowFade® Gold Antifade Mountant with DAPI (Product # S36938). F-actin (Panel c: red) was stained with Alexa Fluor® 594 phalloidin (Product # A12381). Panel d is a merged image showing membrane and cytoplasmic localization. Panel e is a control without primary antibody. The images were captured using a Nikon microscope at 20X magnification.
Supportive validation
- Submitted by
- Invitrogen Antibodies (provider)
- Main image

- Experimental details
- Flow cytometry analysis of EGFR was performed on A549 cells. Cells were fixed with 70% ethanol for 10 minutes, permeabilized with 0. 25% Tritonª X-100 for 20 minutes, and blocked with 5% BSA for 1 hour at room temperature. Cells were labeled with ABfinityª EGFR recombinant rabbit monoclonal antibody (Product # 700308, red histogram) or with rabbit isotype control (pink histogram) at a dilution of 1:400 in 2.5% BSA. After incubation at room temperature for 3 hours, the cells were labeled with Alexa Fluor¨ 488 goat anti-Rabbit Secondary antibody (Product # A11008) at a dilution of 1:400 for 30 minutes at room temperature. The representative 10,000 cells were acquired and analyzed for each sample using an Attune¨ Acoustic Focusing Cytometer. The purple histogram represents unstained control cells and the green histogram represents no-primary-antibody control.

Supportive validation
- Submitted by
- Invitrogen Antibodies (provider)
- Main image

- Experimental details
- Figure 2 EGFR expression in 2D and 3D cultures. ( a ) EGFR (red) and beta1-integrin (green) immunofluorescence counterstained with DAPI (grey) in BxPC-3, PANC-1 and hNDF cells cultured in 2D monolayer and ( b ) Z-projection of EGFR and beta1-integrin immunofluorescence in BxPC-3, PANC-1 and hNDF cells in 3D RAD16-I scaffold at 0.15% peptide concentration. Scale bars represent 10 um; ( c ) Western blot bands of EGFR in 2D and 3D cultures; ( d ) quantification of EGFR in 3D cultures represented as the ratio between soft and stiff cultures. GAPDH was used as loading control. One representative blot is shown. Experiments were repeated three times (N = 3), and statistical differences are indicated as **** for p < 0.0001.

- Submitted by
- Invitrogen Antibodies (provider)
- Main image

- Experimental details
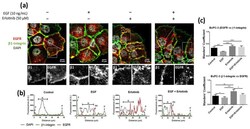
- Figure 3 Immunofluorescence analysis of the EGFR in PANC-1 cells incubated with EGF, erlotinib or both in 2D cultures. ( a ) EGFR (red) and beta1-integrin (green) immunofluorescence counterstained with DAPI (grey) in the presence of EGF, erlotinib or both in PANC-1 and close-up sections (gray pictures) of the cell periphery and the perinuclear area labeled with white and empty arrows, respectively. Scale bars represent 10 um; ( b ) fluorescence intensity profiles corresponding to the white line in pictures from ( a ). Different cell regions are indicated as P for cell periphery, N for nucleus and PN for perinuclear area; ( c ) Manders' colocalization coefficients. Statistical differences are indicated as * for p < 0.05, ** for p < 0.01 and **** for p < 0.0001.

- Submitted by
- Invitrogen Antibodies (provider)
- Main image
- Experimental details
- Figure 4 Immunofluorescence analysis of the EGFR in BxPC-3 cells incubated with EGF, erlotinib or both in 2D cultures. ( a ) EGFR (red) and beta1-integrin (green) immunofluorescence counterstained with DAPI (grey) in the presence of EGF, erlotinib or both and close-up sections (gray pictures). Scale bars represent 10 um; ( b ) fluorescence intensity profiles corresponding to the white line in pictures from ( a ). Different cell regions are indicated as: P for cell periphery, N for nucleus and PN for perinuclear area; ( c ) Manders' colocalization coefficients. Statistical differences are indicated as * for p < 0.05, ** for p < 0.01, *** for p < 0.001 and **** for p < 0.0001.

- Submitted by
- Invitrogen Antibodies (provider)
- Main image

- Experimental details
- Figure 7 Western blot analysis of the EGFR in BxPC-3, PANC-1 and hNDF cells incubated with EGF or erlotinib or both in 2D cultures and soft and stiff 3D cultures. ( a ) Western blot bands of EGFR in 2D cultures; ( b ) Western blot bands of EGFR in 0.15% and 0.5% RAD16-I 3D cultures; ( c ) densitometry of bands shown in ( a ) for 2D cultures; ( d ) densitometry of bands shown in ( b ) for 3D cultures. GAPDH was used as an internal control. One representative blot is shown. Experiments were repeated three times (N = 3), and statistical differences are indicated as * for p < 0.05, ** for p < 0.01, *** for p < 0.001 and **** for p < 0.0001.

- Submitted by
- Invitrogen Antibodies (provider)
- Main image

- Experimental details
- Figure 8 Western blot analysis of the EGFR in PANC-1 and BxPC-3 cells incubated with EGF and erlotinib in the presence of the proteasome (MG-132) and lysosomes (Bafilomycin A1) inhibitors in 0.15% RAD16-I 3D cultures. ( a ) Western blot bands of EGFR; ( b ) densitometry of bands shown in ( a ). GAPDH was used as an internal control. One representative blot is shown. Experiments were repeated three times (N = 3), and statistical differences are indicated as * for p < 0.05, ** for p < 0.01, *** for p < 0.001 and **** for p < 0.0001.
