Explore
 Validate
 Learn
Learn Western blot
 ELISA
ELISA Immunocytochemistry
Antibody data
- Antibody Data
- Antigen structure
- References [23]
- Comments [0]
- Validations
- Immunocytochemistry [1]
- Flow cytometry [1]
- Other assay [13]
Submit
Validation data
Reference
Comment
Report error
- Product number
- 44-794G - Provider product page

- Provider
- Invitrogen Antibodies
- Product name
- Phospho-EGFR (Tyr1173) Polyclonal Antibody
- Antibody type
- Polyclonal
- Antigen
- Synthetic peptide
- Reactivity
- Human, Mouse, Rat
- Host
- Rabbit
- Isotype
- IgG
- Vial size
- 100 µL
- Storage
- -20°C
Submitted references Lamellipodin-RICTOR Signaling Mediates Glioblastoma Cell Invasion and Radiosensitivity Downstream of EGFR.
Reciprocal expression of Annexin A6 and RasGRF2 discriminates rapidly growing from invasive triple negative breast cancer subsets.
Adenoviral transduction of EGFR into pregnancy-adapted uterine artery endothelial cells remaps growth factor induction of endothelial dysfunction.
Cooperative Blockade of PKCα and JAK2 Drives Apoptosis in Glioblastoma.
M2 macrophages reduce the radiosensitivity of head and neck cancer by releasing HB‑EGF.
Evidence for functional selectivity in TUDC- and norUDCA-induced signal transduction via α(5)β(1) integrin towards choleresis.
Appropriate Sequence for Afatinib and Cisplatin Combination Improves Anticancer Activity in Head and Neck Squamous Cell Carcinoma.
Fc-mediated activity of EGFR x c-Met bispecific antibody JNJ-61186372 enhanced killing of lung cancer cells.
Opposing Effects of Inhibitors of Aurora-A and EGFR in Autosomal-Dominant Polycystic Kidney Disease.
Intracellular activation of EGFR by fatty acid synthase dependent palmitoylation.
Compounds identified by virtual docking to a tetrameric EGFR extracellular domain can modulate Grb2 internalization.
A Monoclonal Antibody to ADAM17 Inhibits Tumor Growth by Inhibiting EGFR and Non-EGFR-Mediated Pathways.
Inhibiting heat shock protein 90 (HSP90) limits the formation of liver cysts induced by conditional deletion of Pkd1 in mice.
Involvement of de novo synthesized palmitate and mitochondrial EGFR in EGF induced mitochondrial fusion of cancer cells.
Identification of prognostic biomarkers for glioblastomas using protein expression profiling.
Characterization of kinase inhibitors using reverse phase protein arrays.
Enhanced activation of epidermal growth factor receptor caused by tumor-derived E-cadherin mutations.
Tumor growth inhibition with cetuximab and chemotherapy in non-small cell lung cancer xenografts expressing wild-type and mutated epidermal growth factor receptor.
Dual inhibition of epidermal growth factor receptor and vascular endothelial growth factor receptor phosphorylation by AEE788 reduces growth and metastasis of human colon carcinoma in an orthotopic nude mouse model.
Antivascular therapy for orthotopic human ovarian carcinoma through blockade of the vascular endothelial growth factor and epidermal growth factor receptors.
Molecular classification of head and neck squamous cell carcinomas using patterns of gene expression.
Molecular classification of head and neck squamous cell carcinomas using patterns of gene expression.
Aplidin induces apoptosis in human cancer cells via glutathione depletion and sustained activation of the epidermal growth factor receptor, Src, JNK, and p38 MAPK.
Moritz S, Krause M, Schlatter J, Cordes N, Vehlow A
Cancers 2021 Oct 24;13(21)
Cancers 2021 Oct 24;13(21)
Reciprocal expression of Annexin A6 and RasGRF2 discriminates rapidly growing from invasive triple negative breast cancer subsets.
Korolkova OY, Widatalla SE, Whalen DS, Nangami GN, Abimbola A, Williams SD, Beasley HK, Reisenbichler E, Washington MK, Ochieng J, Mayer IA, Lehmann BD, Sakwe AM
PloS one 2020;15(4):e0231711
PloS one 2020;15(4):e0231711
Adenoviral transduction of EGFR into pregnancy-adapted uterine artery endothelial cells remaps growth factor induction of endothelial dysfunction.
Clemente L, Boeldt DS, Grummer MA, Morita M, Morgan TK, Wiepz GJ, Bertics PJ, Bird IM
Molecular and cellular endocrinology 2020 Jan 1;499:110590
Molecular and cellular endocrinology 2020 Jan 1;499:110590
Cooperative Blockade of PKCα and JAK2 Drives Apoptosis in Glioblastoma.
Wong RA, Luo X, Lu M, An Z, Haas-Kogan DA, Phillips JJ, Shokat KM, Weiss WA, Fan QW
Cancer research 2020 Feb 15;80(4):709-718
Cancer research 2020 Feb 15;80(4):709-718
M2 macrophages reduce the radiosensitivity of head and neck cancer by releasing HB‑EGF.
Fu E, Liu T, Yu S, Chen X, Song L, Lou H, Ma F, Zhang S, Hussain S, Guo J, Sun J, Yu P, Mao X, Wei L
Oncology reports 2020 Aug;44(2):698-710
Oncology reports 2020 Aug;44(2):698-710
Evidence for functional selectivity in TUDC- and norUDCA-induced signal transduction via α(5)β(1) integrin towards choleresis.
Bonus M, Sommerfeld A, Qvartskhava N, Görg B, Ludwig BS, Kessler H, Gohlke H, Häussinger D
Scientific reports 2020 Apr 2;10(1):5795
Scientific reports 2020 Apr 2;10(1):5795
Appropriate Sequence for Afatinib and Cisplatin Combination Improves Anticancer Activity in Head and Neck Squamous Cell Carcinoma.
Longton E, Schmit K, Fransolet M, Clement F, Michiels C
Frontiers in oncology 2018;8:432
Frontiers in oncology 2018;8:432
Fc-mediated activity of EGFR x c-Met bispecific antibody JNJ-61186372 enhanced killing of lung cancer cells.
Grugan KD, Dorn K, Jarantow SW, Bushey BS, Pardinas JR, Laquerre S, Moores SL, Chiu ML
mAbs 2017 Jan;9(1):114-126
mAbs 2017 Jan;9(1):114-126
Opposing Effects of Inhibitors of Aurora-A and EGFR in Autosomal-Dominant Polycystic Kidney Disease.
Nikonova AS, Deneka AY, Eckman L, Kopp MC, Hensley HH, Egleston BL, Golemis EA
Frontiers in oncology 2015;5:228
Frontiers in oncology 2015;5:228
Intracellular activation of EGFR by fatty acid synthase dependent palmitoylation.
Bollu LR, Katreddy RR, Blessing AM, Pham N, Zheng B, Wu X, Weihua Z
Oncotarget 2015 Oct 27;6(33):34992-5003
Oncotarget 2015 Oct 27;6(33):34992-5003
Compounds identified by virtual docking to a tetrameric EGFR extracellular domain can modulate Grb2 internalization.
Ramirez UD, Nikonova AS, Liu H, Pecherskaya A, Lawrence SH, Serebriiskii IG, Zhou Y, Robinson MK, Einarson MB, Golemis EA, Jaffe EK
BMC cancer 2015 May 28;15:436
BMC cancer 2015 May 28;15:436
A Monoclonal Antibody to ADAM17 Inhibits Tumor Growth by Inhibiting EGFR and Non-EGFR-Mediated Pathways.
Rios-Doria J, Sabol D, Chesebrough J, Stewart D, Xu L, Tammali R, Cheng L, Du Q, Schifferli K, Rothstein R, Leow CC, Heidbrink-Thompson J, Jin X, Gao C, Friedman J, Wilkinson B, Damschroder M, Pierce AJ, Hollingsworth RE, Tice DA, Michelotti EF
Molecular cancer therapeutics 2015 Jul;14(7):1637-49
Molecular cancer therapeutics 2015 Jul;14(7):1637-49
Inhibiting heat shock protein 90 (HSP90) limits the formation of liver cysts induced by conditional deletion of Pkd1 in mice.
Smithline ZB, Nikonova AS, Hensley HH, Cai KQ, Egleston BL, Proia DA, Seeger-Nukpezah T, Golemis EA
PloS one 2014;9(12):e114403
PloS one 2014;9(12):e114403
Involvement of de novo synthesized palmitate and mitochondrial EGFR in EGF induced mitochondrial fusion of cancer cells.
Bollu LR, Ren J, Blessing AM, Katreddy RR, Gao G, Xu L, Wang J, Su F, Weihua Z
Cell cycle (Georgetown, Tex.) 2014;13(15):2415-30
Cell cycle (Georgetown, Tex.) 2014;13(15):2415-30
Identification of prognostic biomarkers for glioblastomas using protein expression profiling.
Jung Y, Joo KM, Seong DH, Choi YL, Kong DS, Kim Y, Kim MH, Jin J, Suh YL, Seol HJ, Shin CS, Lee JI, Kim JH, Song SY, Nam DH
International journal of oncology 2012 Apr;40(4):1122-32
International journal of oncology 2012 Apr;40(4):1122-32
Characterization of kinase inhibitors using reverse phase protein arrays.
Martiny-Baron G, Haasen D, D'Dorazio D, Voshol J, Fabbro D
Methods in molecular biology (Clifton, N.J.) 2011;785:79-107
Methods in molecular biology (Clifton, N.J.) 2011;785:79-107
Enhanced activation of epidermal growth factor receptor caused by tumor-derived E-cadherin mutations.
Bremm A, Walch A, Fuchs M, Mages J, Duyster J, Keller G, Hermannstädter C, Becker KF, Rauser S, Langer R, von Weyhern CH, Höfler H, Luber B
Cancer research 2008 Feb 1;68(3):707-14
Cancer research 2008 Feb 1;68(3):707-14
Tumor growth inhibition with cetuximab and chemotherapy in non-small cell lung cancer xenografts expressing wild-type and mutated epidermal growth factor receptor.
Steiner P, Joynes C, Bassi R, Wang S, Tonra JR, Hadari YR, Hicklin DJ
Clinical cancer research : an official journal of the American Association for Cancer Research 2007 Mar 1;13(5):1540-51
Clinical cancer research : an official journal of the American Association for Cancer Research 2007 Mar 1;13(5):1540-51
Dual inhibition of epidermal growth factor receptor and vascular endothelial growth factor receptor phosphorylation by AEE788 reduces growth and metastasis of human colon carcinoma in an orthotopic nude mouse model.
Yokoi K, Thaker PH, Yazici S, Rebhun RR, Nam DH, He J, Kim SJ, Abbruzzese JL, Hamilton SR, Fidler IJ
Cancer research 2005 May 1;65(9):3716-25
Cancer research 2005 May 1;65(9):3716-25
Antivascular therapy for orthotopic human ovarian carcinoma through blockade of the vascular endothelial growth factor and epidermal growth factor receptors.
Thaker PH, Yazici S, Nilsson MB, Yokoi K, Tsan RZ, He J, Kim SJ, Fidler IJ, Sood AK
Clinical cancer research : an official journal of the American Association for Cancer Research 2005 Jul 1;11(13):4923-33
Clinical cancer research : an official journal of the American Association for Cancer Research 2005 Jul 1;11(13):4923-33
Molecular classification of head and neck squamous cell carcinomas using patterns of gene expression.
Chung CH, Parker JS, Karaca G, Wu J, Funkhouser WK, Moore D, Butterfoss D, Xiang D, Zanation A, Yin X, Shockley WW, Weissler MC, Dressler LG, Shores CG, Yarbrough WG, Perou CM
Cancer cell 2004 May;5(5):489-500
Cancer cell 2004 May;5(5):489-500
Aplidin induces apoptosis in human cancer cells via glutathione depletion and sustained activation of the epidermal growth factor receptor, Src, JNK, and p38 MAPK.
Cuadrado A, Garcia-Fernandez LF, Gonzalez L, Suarez Y, Losada A, Alcaide V, Martinez T, Fernandez-Sousa JM, Sanchez-Puelles JM, Munoz A
The Journal of biological chemistry 2003 Jan 3;278(1):241-50
The Journal of biological chemistry 2003 Jan 3;278(1):241-50
No comments: Submit comment
Supportive validation
- Submitted by
- Invitrogen Antibodies (provider)
- Main image
- Experimental details
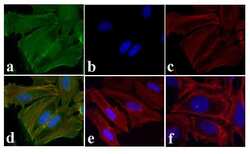
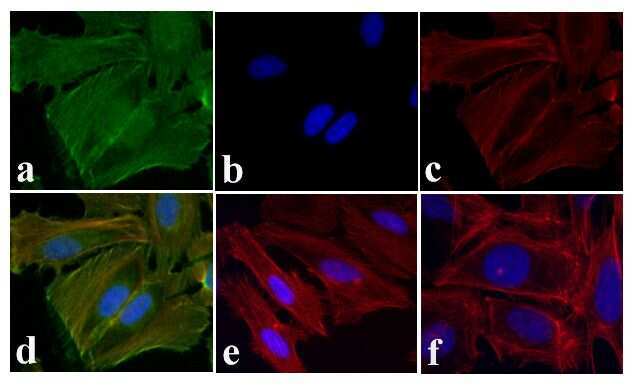
- Immunofluorescence analysis of EGFR (pY1173) was done on 70% confluent log phase HeLa cells treated with EGF (200 ng/mL for 10 min). The cells were fixed with 4% paraformaldehyde for 15 minutes, permeabilized with 0.25% Triton X-100 for 10 minutes, and blocked with 5% BSA for 1 hour at room temperature. The cells were labeled with EGFR (pY1173) Rabbit polyclonal Antibody (Product # 44-794G) at 2 µg/mL in 1% BSA and incubated for 3 hours at room temperature and then labeled with Alexa Fluor 488 Goat Anti-Rabbit IgG Secondary Antibody (Product # A-11008) at a dilution of 1:400 for 30 minutes at room temperature (Panel a: green). Nuclei (Panel b: blue) were stained with SlowFade® Gold Antifade Mountant with DAPI (Product # S36938). F-actin (Panel c: red) was stained with Alexa Fluor 594 Phalloidin (Product # A12381). Panel d is a merged image showing cytoplasmic localization of EGFR (pY1173). Panel e shows untreated cells. Panel f shows no primary antibody control. The images were captured at 20X magnification.
Supportive validation
- Submitted by
- Invitrogen Antibodies (provider)
- Main image

- Experimental details
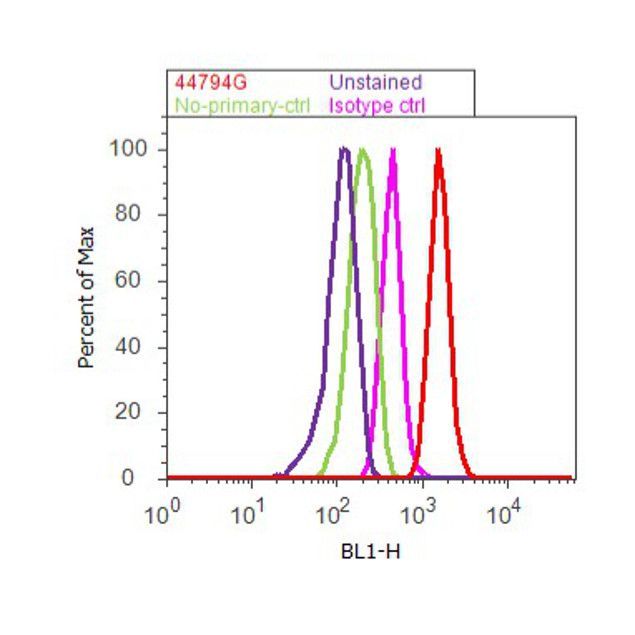
- Flow cytometry analysis of EGFR [pY1173] was done on A549 cells treated with EGF (200ng/ml, 10 minutes). Cells were fixed with 70% ethanol for 10 minutes, permeabilized with 0.25% Tritonª X-100 for 20 minutes, and blocked with 5% BSA for 30 minutes at room temperature. Cells were labeled with EGFR [pY1173] Rabbit Polyclonal Antibody (44794G, red histogram) or with rabbit isotype control (pink histogram) at 3-5 µg/million cells in 2.5% BSA. After incubation at room temperature for 2 hours, the cells were labeled with Alexa Fluor¨ 488 Goat Anti-Rabbit Secondary Antibody (A11008) at a dilution of 1:400 for 30 minutes at room temperature. The representative 10,000 cells were acquired and analyzed for each sample using an Attune¨ Acoustic Focusing Cytometer. The purple histogram represents unstained control cells and the green histogram represents no-primary-antibody control.
Supportive validation
- Submitted by
- Invitrogen Antibodies (provider)
- Main image
- Experimental details
- NULL
- Submitted by
- Invitrogen Antibodies (provider)
- Main image
- Experimental details
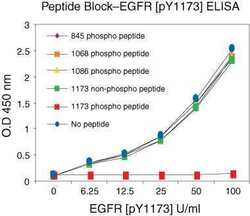
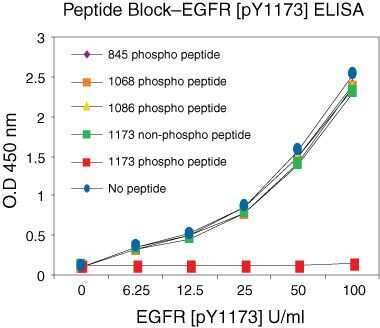
- Peptide ELISA showing of Phospho-EGFR (Tyr1173) using a polyclonal antibody (Product # 44-794G).
- Submitted by
- Invitrogen Antibodies (provider)
- Main image
- Experimental details
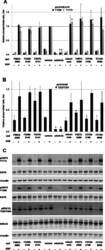
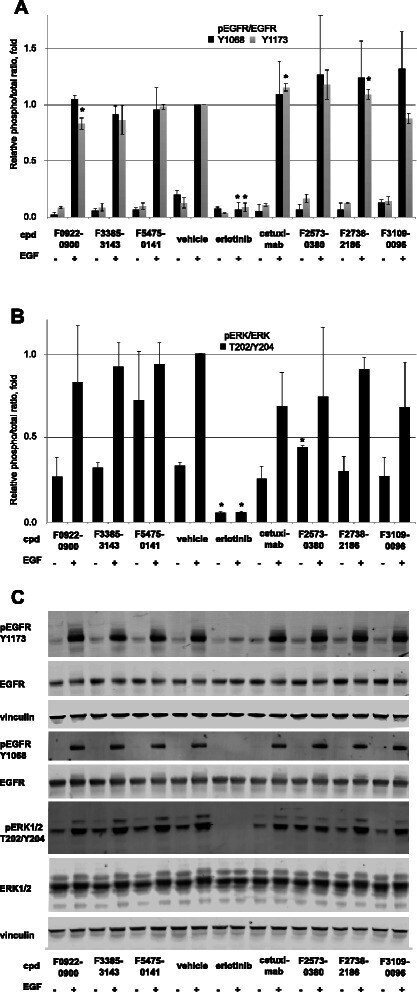
- Fig. 4 EGFR and ERK1/2 phosphorylation following treatment of SCC61 cells with test compounds. a Averaged quantification of Western blots analyzing Y 1068 - or Y 1173 -phosphorylated EGFR following 1 h pre-treatment with compounds, vehicle, cetuximab, or erlotinib, followed by 45 min treatment with vehicle or EGF +/- EGF. Values shown are normalized to total EGFR. b Averaged quantification of Western blots analyzing T 202 /Y 204 -phosphorylated ERK1/2 following 1 h pre-treatment with compounds, vehicle, cetuximab, or erlotinib, followed by 45 min treatment with vehicle or EGF +/- EGF. Values shown are normalized to total ERK1/2. c Representative Western blots for quantified data shown in parts a and b
- Submitted by
- Invitrogen Antibodies (provider)
- Main image
- Experimental details
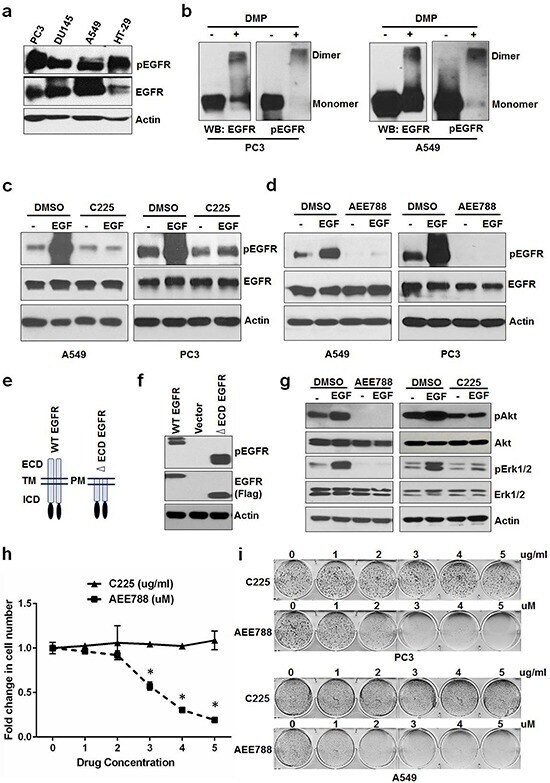
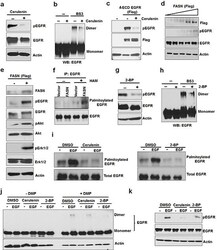
- Figure 1 Constitutive activation of EGFR sustains cell proliferation in the absence of ligands a. Serum starved PC3, DU145, A549 and HT-29 cells were tested for EGFR phosphorylation. b. PC3 and A549 cells grown in the absence of serum/ligands were tested for EGFR dimerization (crosslinked by DMP) and phosphorylation. Serum starved A549 and PC3 were treated with EGF +/- C225 at 2.5 ug/ml c. or AEE788 at 2.5 uM d. for 15 minutes and measured for EGFR phosphorylation, EGFR and Actin using Western blot. e. Schematic diagram of WT and extra cellular domain deleted EGFR (DeltaECD-EGFR). f. Western blot analysis of protein samples for pEGFR and EGFR (Flag) isolated from HEK 293 cells transfected with vector alone, WT EGFR or DeltaECD EGFR for 24 hours. g. Western blot analysis of protein samples for pAkt, Akt, pErk1/2, Erk1/2 and EGFR isolated from PC3 cells treated with EGF +/- AEE788 or EGF +/- C225 for 15 minutes similarly as cells used in c and d. h. A549 cells were treated with AEE788 or C225 for 5 days at the indicated concentrations and measured cell number. i. Colony formation assay on PC3 and A549 cells were treated with increasing concentrations of AEE788 or C225 as indicated in 6-well plate and colony formation was counted when the cells reached 80-90% confluence. Data are means of +/- SD of triplicates ( Suppl Figure 1a and 1b ). Asterisk indicates the statistical significance between treated group and DMSO ( P -value
- Submitted by
- Invitrogen Antibodies (provider)
- Main image
- Experimental details
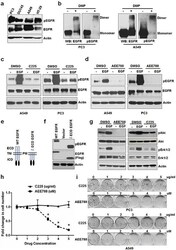
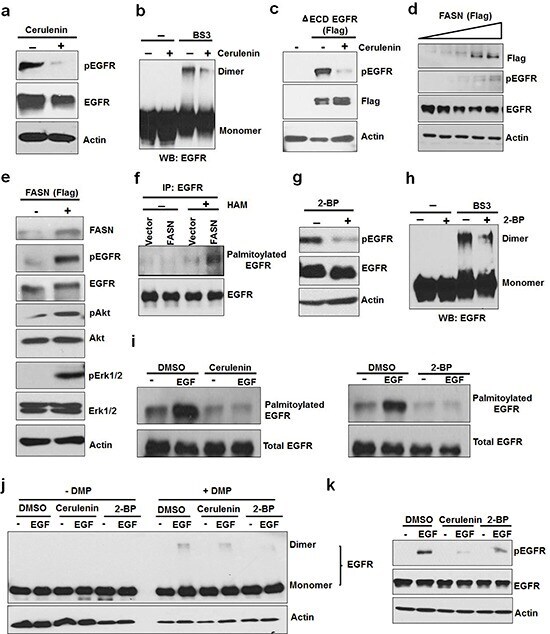
- Figure 2 Activation of EGFR by de novo fatty acid synthesis dependent palmitoylation a. Western blot analysis of protein samples for pEGFR and EGFR isolated from PC3 cells treated with FASN inhibitor, cerulenin, at 5ug/ml for 8 hours. b. PC3 cells were treated with cerulenin for 8 hours and isolated protein samples were cross linked with BS3 as described in the materials and methods section. The cross linked samples were analyzed using Western blot for EGFR dimers. For control group, protein samples were left untreated. c. HEK 293 cells were transfected with DeltaECD EGFR for 24 hours followed by treatment with cerulenin in serum free medium for overnight before protein isolation and Western blot analysis. d. Western blot analysis of protein samples for pEGFR, EGFR and Actin isolated from MCF10A cells transfected with increasing FASN (Flag tagged) concentration for 24 hours followed by serum starvation for 12 hours. e. Western blot analysis of protein samples (for indicated proteins) isolated from PC3 cells transfected with vector alone or FASN flag for 24 hours followed by serum starvation for 12 hours. f. Acyl-Biotin Exchange assay (ABE) for EGFR palmitoylation. PC3 cells were transfected with vector alone or FASN (panel 2e) and isolated samples were subjected to ABE assay for EGFR palmitoylation. HAM stands for hydroxyl amine. ABE assay was performed as described in the methods. g. Western blotting analysis of protein samples for pEGFR, EGFR and actin isolated from PC3 cel
- Submitted by
- Invitrogen Antibodies (provider)
- Main image
- Experimental details
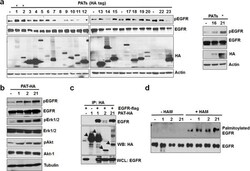
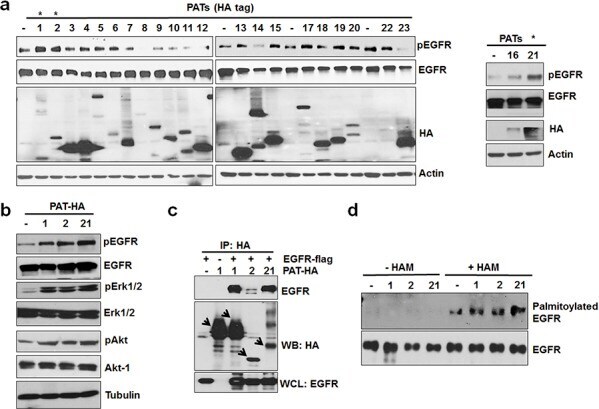
- Figure 3 PAT 1, 2 and 21 increases EGFR activation and palmitoylation a. Screening of PAT enzymes for EGFR activation. A549 cells were transfected with individual PAT (HA-tagged) constructs for 24 hours followed by 12 hours of serum starvation. Isolated protein samples were tested for EGFR activation using pEGFR antibody. b. Western blot analysis of protein samples for pEGFR, EGFR, pAkt, Akt, pErk 1/2, Erk 1/2 and Actin isolated from A549 cells transfected with PAT plasmids 1, 2, 21 or vector alone for 24 hours followed by serum starvation for 12 hours. c. Western blot analysis of immunoprecipitated samples for HA and EGFR antibodies. HEK 293 cells were transfected with EGFR-flag alone or in combination with indicated PATs as shown in the Figure 3c and PAT enzymes were immunoprecipitated with HA antibody. d. Western blotting analysis of palmitoylated EGFR from PC3 cells transfected with vector alone or PATs.
- Submitted by
- Invitrogen Antibodies (provider)
- Main image
- Experimental details
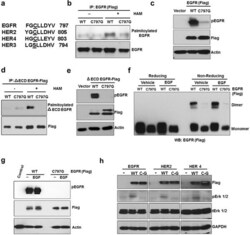
- Figure 4 C797 site is conserved in kinase active ErbB members and is important for constitutive activation and palmitoylation of EGFR a. Comparison of palmitoylation site (C797) of EGFR with HER2, HER3 and HER4. b. Western blotting analysis for palmitoylated EGFR prepared from HEK293 cells transfected with EGFR WT or C797G mutant (Flag-tagged). c. C797G mutation blocks EGFR constitutive phosphorylation when expressed in HEK 293 cells. d. C797G mutation blocks palmitoylation of DeltaECD EGFR in HEK 293 cells. e. C797G mutation blocks DeltaECD EGFR constitutive phosphorylation in HEK 293 cells. f. HEK 293 cells were transfected with WT or C797G EGFR for 24 hours and treated with DMSO or EGF at 10 ng/ml for 20 minutes and protein samples were analyzed for EGFR dimers using Western blotting under reducing or non-reducing conditions. g. The same samples from panel f were subjected to Western blot analysis. h. Western blot analysis for Flag, pErk 1/2, Erk 1/2 and GAPDH. Protein samples were prepared from HEK 293 cells transfected with WT or cysteine mutants of ErbB members.

- Submitted by
- Invitrogen Antibodies (provider)
- Main image
- Experimental details
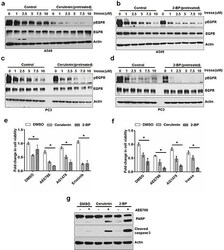
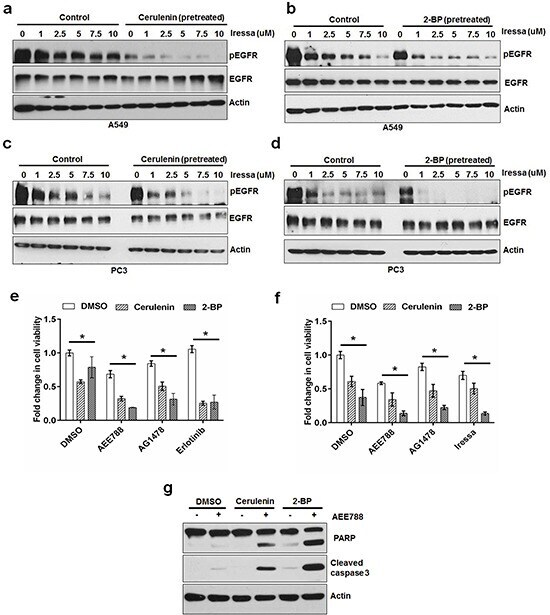
- Figure 6 FASN or PAT inhibitor sensitizes cancer cells to EGFR TKIs Western blot analysis of protein samples for pEGFR, EGFR and Actin isolated from A549 cells treated (30 minutes) with increasing concentrations of EGFR tyrosine kinase inhibitor in the presence or absence of cerulenin at 5 ug/ml a. or 2-BP at 8 uM b. The cells were pretreated with either cerulenin or 2-BP for 5 hours before the treatment with Iressa. Western blot analysis of protein samples for pEGFR, EGFR and Actin isolated from PC3 cells treated (30 minutes) with increasing concentrations of EGFR tyrosine kinase inhibitor in the presence or absence of cerulenin at 5 ug/ml c. or 2-BP at 8 uM d, e. MTS assay in PC3 cells treated with EGFR TKI alone or in combination with cerulenin or 2-BP for 48 hours. f. MTS assay in A549 cells treated with EGFR TKI alone or in combination with cerulenin or 2-BP for 48 hours. Data are means of +/- SD of triplicates. Asterisk indicates the statistical significance between treated group and DMSO ( P -value
- Submitted by
- Invitrogen Antibodies (provider)
- Main image
- Experimental details
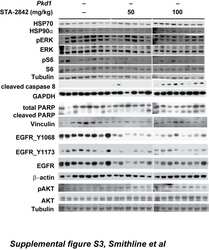
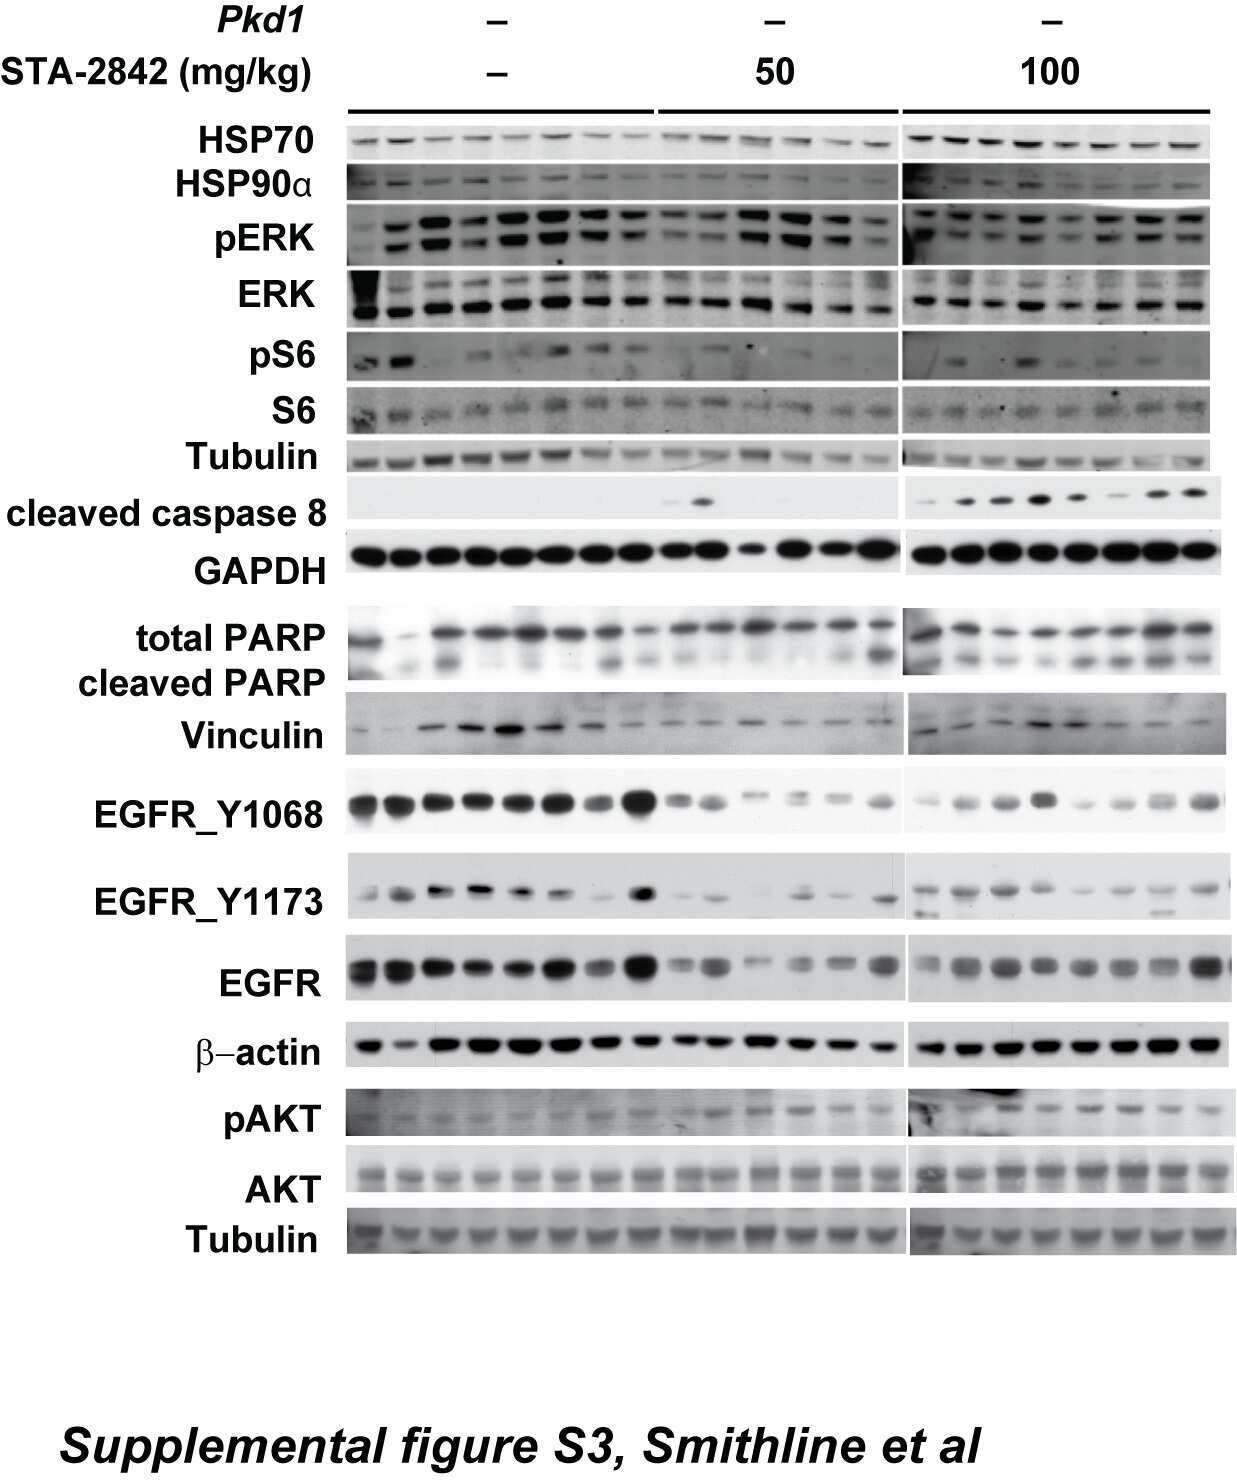
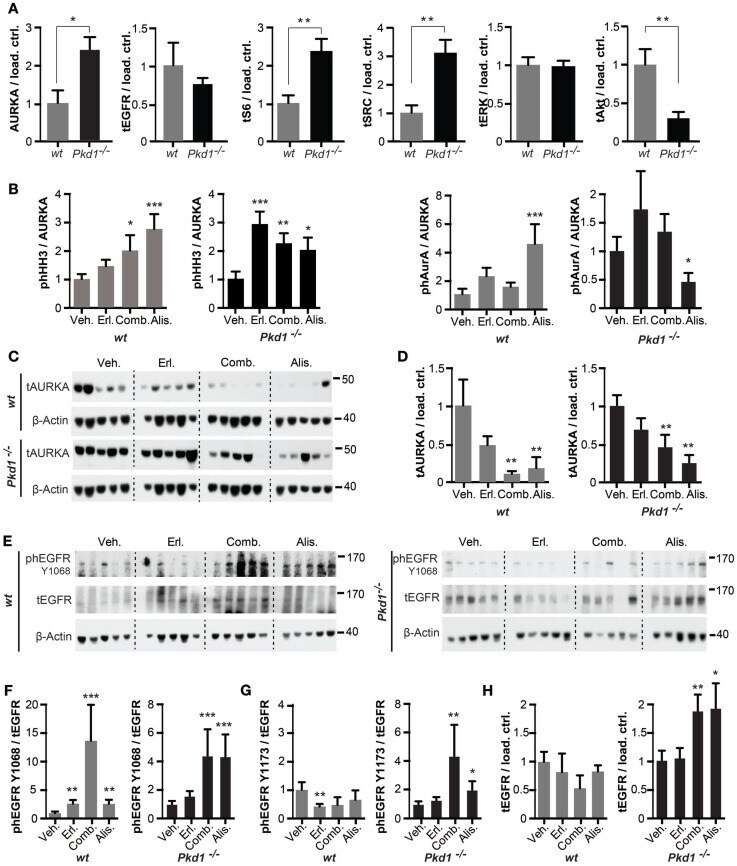
- Figure 4 Drug inhibition of targets in Pkd1 -/- and wt mice . (A) Quantification of Western data for indicated proteins from kidney lysates prepared from vehicle-treated wt or Pkd1 -/- mice, normalized to beta-actin or vinculin-loading control. * P < 0.05 and ** P < 0.01 relative to vehicle treated. (B) Aurora-A (AURKA) was immunoprecipitated from kidney lysates and used for in vitro kinase with gamma-32P-ATP to indicate autophosphorylation and phosphorylation of histone H3 kinase (HH3) (top two rows), with parallel blots probed by Western to allow normalization to total AURKA and HH3 in reaction. Quantitation of data from complete cohort of mice in each treatment group, indicating ratio of phosphorylated HH3 or AURKA to total immunoprecipitated AURKA in wt and Pkd1 -/- mice following indicated drug treatments. * P < 0.05, ** P < 0.01, and *** P < 0.001 relative to vehicle treated. (C) Western analysis showing representative expression of total Aurora-A (tAURKA) in kidney lysates after 10 weeks of treatment with indicated drugs, with beta-actin loading control. (D) Quantitation of data from complete cohort of mice in each treatment group, indicating ratio of total AURKA to beta-actin in wt and Pkd1 -/- mice following indicated drug treatments. ** P < 0.01 relative to vehicle treated. (E) Western blot with representative images of kidney lysates from each treatment cohort showing expression of EGFRphosphorylated (ph) at the indicated amino acids, total EGFR (tEGFR) or beta-act
- Submitted by
- Invitrogen Antibodies (provider)
- Main image
- Experimental details
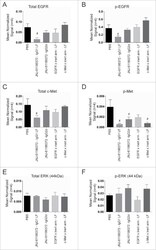
- Figure 5. Downmodulation of EGFR and c-Met in H1975-HGF xenograft tumors upon JNJ-61186372 treatment. Female nude mice bearing H1975-HGF lung cancer xenografts were treated with 10 mg/kg of the indicated antibodies or control on study days 1 and 4. Tumors were collected 24 hr after the second dose (day 4). Levels of total EGFR (A), c-Met (C) and ERK1 (p44) (E) and phosphorylated c-Met (pc-MET)(B), pEGFR (D), and pERK1 (p44) (F) were analyzed by Western blot. Graphs show densitometry analysis normalized to actin. # (p < 0.05) indicates statistical significant difference compared to vehicle control (Sidak's multiple comparisons test on normalized signal values).
- Submitted by
- Invitrogen Antibodies (provider)
- Main image
- Experimental details
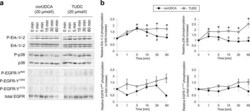
- Figure 6 Comparison between nor UDCA- and TUDC-induced Erk-1/-2, p38 MAPK and EGFR activation. Rat livers were perfused with nor UDCA or TUDC (20 umol/l each) for up to 60 min as described in ""Experimental Procedures"". Liver samples were taken at the time points indicated. Phosphorylation of Erk-1/-2, p38 MAPK , and EGFR tyrosine residues Tyr 845 , Tyr 1045 , and Tyr 1173 was analyzed by ( a ) Western blot using specific antibodies and ( b ) subsequent densitometric analysis (black squares, nor UDCA; gray squares, TUDC). Total Erk-1/-2, total p38 MAPK , and total EGFR served as respective loading controls. Phosphorylation at t = 0 was arbitrarily set to 1. Data represent the mean (mean +- SEM) of at least three independent experiments; * p < 0.05 statistical significance compared with the unstimulated control. # p < 0.05 statistical significance between nor UDCA and TUDC. Blots were cropped to focus on the area of interest, and full-length blots are presented in Supplementary Figure 10 . TUDC led to activation of Erk-1/-2, p38 MAPK , and EGFR, as indicated by phosphorylation of the EGFR tyrosine residues Tyr 845 and Tyr 1173 . nor UDCA induced a transient Erk-1/-2 phosphorylation and a weak p38 MAPK activation. No EGFR activation was observed in nor UDCA-perfused livers.

- Submitted by
- Invitrogen Antibodies (provider)
- Main image
- Experimental details
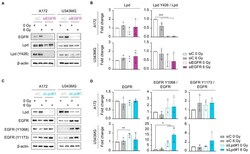
- Figure 4 The EGFR-Lpd interplay is cell-line-dependent. ( A ) Representative immunoblot of EGFR, Lpd, phosphorylated Lpd (Y426) and beta-actin in A172 and U343MG upon EGFR knockdown and 1 h after irradiation. ( B ) Densitometric analyses showing changes in Lpd expression and phosphorylation from ( A ). Fold changes of Lpd levels are calculated by normalization to beta-actin. Fold changes of phosphorylated Lpd Y426 are determined by normalization to total Lpd expression. All protein levels were related to the corresponding beta-actin. Fold changes are relative to control-treated and unirradiated samples. ( C ) Representative Western blot from Lpd-silenced A172 and U343MG showing total and phosphorylated EGFR 1 h post-X-ray irradiation. beta-actin served as loading control. Representative Western blots are shown. ( D ) Densitometry of EGFR from ( C ). Fold changes of EGFR levels are calculated by normalization to beta-actin. Fold changes of phosphorylated EGFR are calculated by normalization to total EGFR expression. All protein levels were related to the corresponding beta-actin. Fold changes are relative to control-treated and unirradiated samples. All results are mean +- SD ( n = 3, two-sided Student's t -test, * p < 0.05, ** p < 0.01, *** p < 0.001). si, small interfering RNA; C, control; Lpd, Lamellipodin.

- Submitted by
- Invitrogen Antibodies (provider)
- Main image
- Experimental details
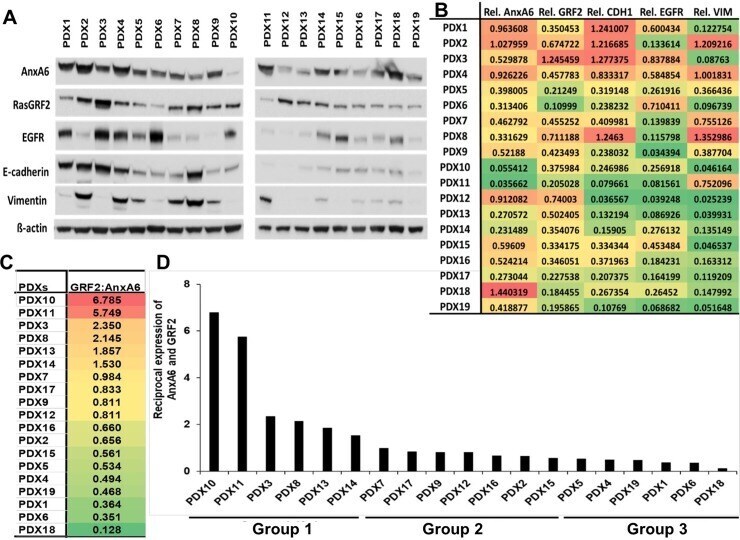
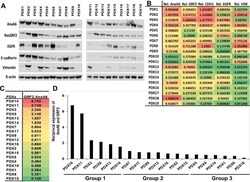
- 10.1371/journal.pone.0231711.g007 Fig 7 Reciprocal expression of AnxA6 and GRF2 in TNBC PDX models. A) Whole tissue extracts were prepared from patient derived xenografts (n = 19), and equal amounts of protein were analyzed by western blotting using antibodies to the indicated proteins. B) Densitometric analysis of the expression of the indicated proteins. Shown are protein band intensities normalized to beta-actin from a representative experiment. C) The ratio of GRF2:AnxA6 was used to classify the tumors into potentially rapidly growing or invasive tumors as in Fig 6 . D) A plot of the reciprocal expression of AnxA6 and GRF2 based on the GRF2:AnxA6 ratio for each PDX sample and showing two major groups: Group 1 with a strong potential for rapid growth and Group 3 with a strong potential for invasiveness, separated by a more diverse Group 2 with varied potentials for growth and invasiveness.