Explore
 Validate
 Learn
Learn Western blot
 Immunocytochemistry
Antibody data
- Antibody Data
- Antigen structure
- References [1]
- Comments [0]
- Validations
- Immunocytochemistry [2]
Submit
Validation data
Reference
Comment
Report error
- Product number
- MA5-15199 - Provider product page

- Provider
- Invitrogen Antibodies
- Product name
- Phospho-EGFR (Tyr1068) Monoclonal Antibody (S.684.2)
- Antibody type
- Monoclonal
- Antigen
- Synthetic peptide
- Description
- It is not recommended to aliquot this antibody.
- Reactivity
- Human, Rat
- Host
- Mouse
- Isotype
- IgG
- Antibody clone number
- S.684.2
- Vial size
- 100 μL
- Concentration
- 1865 μg/mL
- Storage
- -20°C
Submitted references Quercetin Reverses Rat Liver Preneoplastic Lesions Induced by Chemical Carcinogenesis.
Carrasco-Torres G, Monroy-Ramírez HC, Martínez-Guerra AA, Baltiérrez-Hoyos R, Romero-Tlalolini MLÁ, Villa-Treviño S, Sánchez-Chino X, Vásquez-Garzón VR
Oxidative medicine and cellular longevity 2017;2017:4674918
Oxidative medicine and cellular longevity 2017;2017:4674918
No comments: Submit comment
Supportive validation
- Submitted by
- Invitrogen Antibodies (provider)
- Main image
- Experimental details
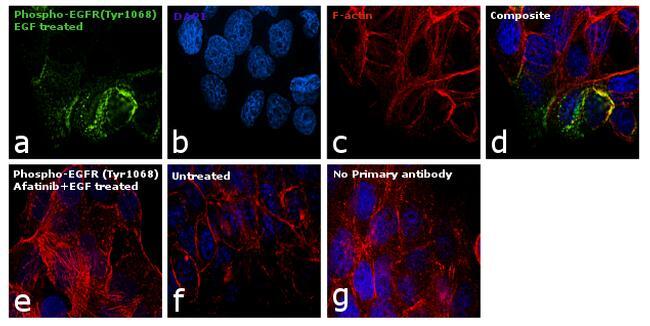
- Immunofluorescence analysis of Phospho-EGFR (Tyr1068) was performed using 90% confluent log phase A-431 cells treated with 200 ng/mL of EGF for 10 minutes. The cells were fixed with 4% paraformaldehyde for 10 minutes, permeabilized with 0.1% Triton™ X-100 for 15 minutes, and blocked with 1% BSA for 1 hour at room temperature. The cells were labeled with Phospho-EGFR (Tyr1068) Mouse Monoclonal Antibody (S.684.2) (Product # MA5-15199) at 1:100 dilution in 0.1% BSA and incubated overnight at 4 degree Celsius and then labelled with Goat anti-Mouse IgG (H+L) Superclonal™ Secondary Antibody, Alexa Fluor® 488 conjugate (Product # A28175) at a dilution of 1:2000 for 45 minutes at room temperature (Panel a: green). Nuclei (Panel b: blue) were stained with SlowFade® Gold Antifade Mountant with DAPI (Product # S36938). F-actin (Panel c: red) was stained with Rhodamine Phalloidin (Product # R415, 1:100). Panel d represents the merged image showing membrane localization. Panel e represents cells treated with antagonist, Afatinib (1µM for 6hrs) followed by EGF (200 ng/mL for 10 minutes), showing no signal. Panel f shows untreated cells with no signal. Panel g represents control cells with no primary antibody to assess background. The images were captured at 60X magnification.

- Submitted by
- Invitrogen Antibodies (provider)
- Main image
- Experimental details
- Immunofluorescence analysis of Phospho-EGFR (Tyr1068) was performed using 90% confluent log phase A-431 cells treated with 200 ng/mL of EGF for 10 minutes. The cells were fixed with 4% paraformaldehyde for 10 minutes, permeabilized with 0.1% Triton™ X-100 for 15 minutes, and blocked with 1% BSA for 1 hour at room temperature. The cells were labeled with Phospho-EGFR (Tyr1068) Mouse Monoclonal Antibody (S.684.2) (Product # MA5-15199) at 1:100 dilution in 0.1% BSA and incubated overnight at 4 degree Celsius and then labelled with Goat anti-Mouse IgG (H+L) Superclonal™ Secondary Antibody, Alexa Fluor® 488 conjugate (Product # A28175) at a dilution of 1:2000 for 45 minutes at room temperature (Panel a: green). Nuclei (Panel b: blue) were stained with SlowFade® Gold Antifade Mountant with DAPI (Product # S36938). F-actin (Panel c: red) was stained with Rhodamine Phalloidin (Product # R415, 1:100). Panel d represents the merged image showing membrane localization. Panel e represents cells treated with antagonist, Afatinib (1µM for 6hrs) followed by EGF (200 ng/mL for 10 minutes), showing no signal. Panel f shows untreated cells with no signal. Panel g represents control cells with no primary antibody to assess background. The images were captured at 60X magnification.