Explore
 Validate
 Learn
Learn Western blot
 Other assay
Antibody data
- Antibody Data
- Antigen structure
- References [1]
- Comments [0]
- Validations
- Other assay [3]
Submit
Validation data
Reference
Comment
Report error
- Product number
- PA5-71202 - Provider product page

- Provider
- Invitrogen Antibodies
- Product name
- OR7A17 Polyclonal Antibody
- Antibody type
- Polyclonal
- Antigen
- Synthetic peptide
- Description
- This target displays homology in the following species: Cow: 86%; Dog: 79%; Guinea Pig: 79%; Horse: 86%; Human: 100%; Mouse: 79%; Pig: 86%; Rabbit: 79%; Rat: 86%
- Reactivity
- Human
- Host
- Rabbit
- Isotype
- IgG
- Vial size
- 100 μL
- Concentration
- 0.5 mg/mL
- Storage
- -20°C, Avoid Freeze/Thaw Cycles
Submitted references Olfactory Receptor OR7A17 Expression Correlates with All-Trans Retinoic Acid (ATRA)-Induced Suppression of Proliferation in Human Keratinocyte Cells.
Kim H, Park SH, Oh SW, Kwon K, Park SJ, Yu E, Yang S, Park JY, Choi S, Yang S, Han SB, Song M, Cho JY, Lee J
International journal of molecular sciences 2021 Nov 14;22(22)
International journal of molecular sciences 2021 Nov 14;22(22)
No comments: Submit comment
Supportive validation
- Submitted by
- Invitrogen Antibodies (provider)
- Main image
- Experimental details
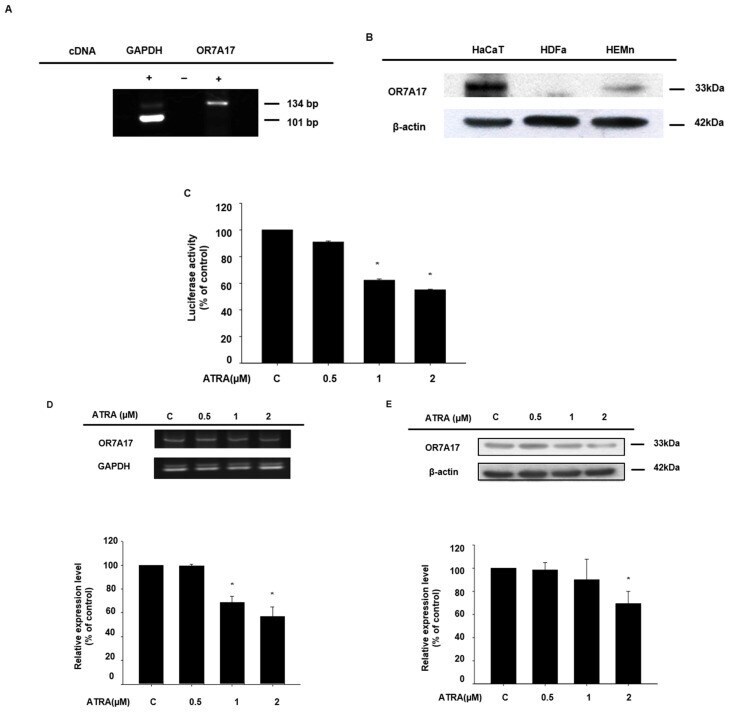
- Figure 1 All- trans retinoic acid downregulates the expression of OR7A17. ( A , B ) The expression of OR7A17 in HaCaT cells was determined via reverse transcription quantitative PCR (RT-qPCR) ( A ) and Western blot analysis ( B ). In addition, OR7A17 expression was determined in human dermal fibroblasts and human epidermal melanocytes ( B ). HDFa: human dermal fibroblasts, HEMn: human epidermal melanocytes. ( C ) After ATRA treatment for 24 h, the cells were lysed and subjected to OR7A17 luciferase reporter assays. ( D ) Changes in the mRNA levels of OR7A17 in HaCaT cells were observed following treatment with ATRA for 24 h. ( E ) Changes in OR7A17 protein levels in HaCaT cells treated with ATRA for 24 h were determined via Western blot analysis. Data are presented as the mean +- SEM of at least three independent experiments. The statistical significance of differences between groups was evaluated via one-way analysis of variance (ANOVA), followed by Tukey's multiple-comparison test, using the GraphPad Prism 5 software. * p < 0.05 vs. control.
- Submitted by
- Invitrogen Antibodies (provider)
- Main image

- Experimental details
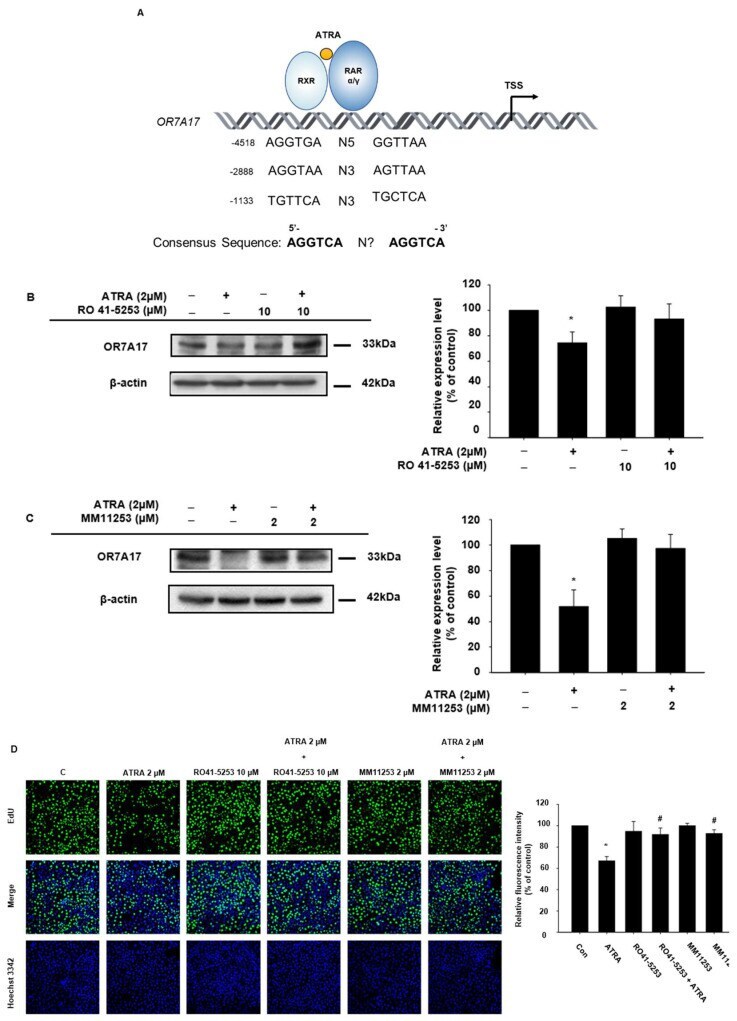
- Figure 3 ATRA-induced downregulation of OR7A17 expression is mediated via RAR signaling. ( A ) A putative RARE sequence in the promoter region of the OR7A17 gene. ( B , C ) HaCaT cells were treated with 2 uM of ATRA and either 10 uM of RAR alpha antagonist ( B ) RO 41-5253 or 2 uM of RAR gamma antagonist ( C ) MM11253 for 24 h. After 24 h of incubation, the cells were lysed, and Western blotting was performed to determine the protein levels of OR7A17. ( D ) The recovery of HaCaT proliferation following treatment with RO 41-5253/MM11253 and ATRA was observed via EdU incorporation assays. Data are presented as the mean +- SEM of more than three independent experiments. The statistical significance of differences between groups was evaluated via one-way analysis of variance (ANOVA), followed by Tukey's multiple-comparison test, using the GraphPad Prism 5 software. * p < 0.05 vs. control, # p < 0.05 vs. ATRA-treated control.
- Submitted by
- Invitrogen Antibodies (provider)
- Main image
- Experimental details
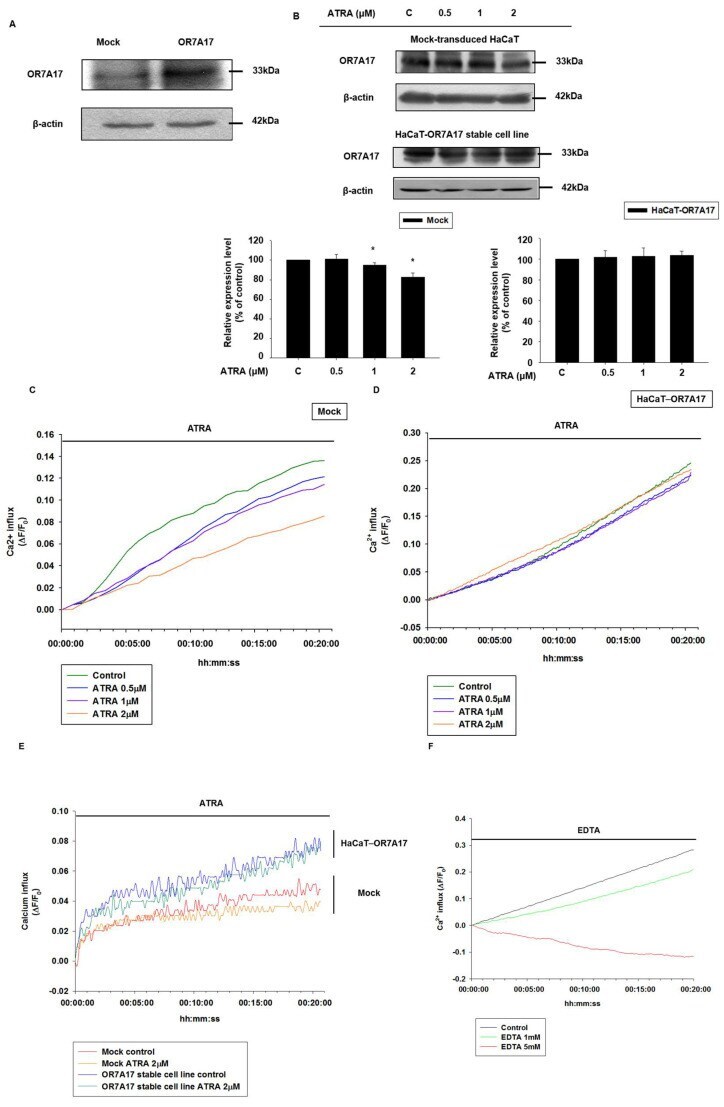
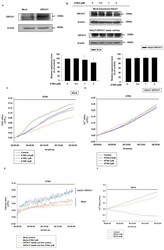
- Figure 4 Overexpression of OR7A17 interferes with the suppressive effect of ATRA on Ca 2+ influx. ( A ) HaCaT cells were transduced with either LvCMV-GFP (mock-transduced HaCaT cell line) or LvCMV-OR7A17 (HaCaT-OR7A17 stable cell line). The overexpression of OR7A17 in HaCaT-OR7A17 cells was validated via Western blot analysis. ( B ) HaCaT-OR7A17 cells and mock-transduced HaCaT cells were treated with ATRA for 24 h, and OR7A17 expression was determined via Western blot analysis. Data are presented as the mean +- SEM of more than three independent experiments. * p < 0.05 vs. control. Changes in Ca 2+ influx after ATRA treatment were observed in ( C ) mock-transduced HaCaT cells and ( D ) HaCaT-OR7A17 cells. Cells were incubated with Fluo-4 NW Ca 2+ reagent loading solution for 30 min at 37 degC and for another 30 min at room temperature. Fluorescence was measured immediately after ATRA treatment. The data presented are representative of at least three independent experiments. ( E ) Both mock-transduced HaCaT cells and HaCaT-OR7A17 cells were treated with ATRA and incubated for 24 h in an incubator at 5% CO 2 and 37 degC. After 24 h of incubation, Fluo-4 NW Ca 2+ reagent loading solution was added to the cells and they were incubated for 30 min at 37 degC and another 30 min at room temperature. Fluorescence was measured after the incubation. ( F ) Changes in Ca 2+ influx after ethylenediaminetetraacetic acid (EDTA) treatment were observed in mock-transduced HaCaT cells. Cells we