Explore
 Validate
 Learn
LearnMA5-23713
antibody from Invitrogen Antibodies
Targeting: CCL4
Act-2, AT744.1, LAG1, MIP-1-beta, SCYA4
 Western blot
 Flow cytometry
 Other assay
Antibody data
- Antibody Data
- Antigen structure
- References [1]
- Comments [0]
- Validations
- Other assay [2]
Submit
Validation data
Reference
Comment
Report error
- Product number
- MA5-23713 - Provider product page

- Provider
- Invitrogen Antibodies
- Product name
- CCL4 Monoclonal Antibody (24006)
- Antibody type
- Monoclonal
- Antigen
- Recombinant full-length protein
- Description
- In Western blots, this antibody shows less than 4% cross-reactivity with recombinant human (rh) CCL3/MIP-1 alpha and does not cross-react with recombinant mouse (rm) CCL3/MIP-1 alpha, rmCCL4/MIP-1 beta, rhCXCL8/IL-8, rhCCL5, rhCXCL1, rhCXCL2, or rhCXCL3. Reconstitute at 0.5 mg/mL in sterile PBS. Endoxin level is
- Reactivity
- Human
- Host
- Mouse
- Isotype
- IgG
- Antibody clone number
- 24006
- Vial size
- 500 μg
- Concentration
- 0.5 mg/mL
- Storage
- -20°C, Avoid Freeze/Thaw Cycles
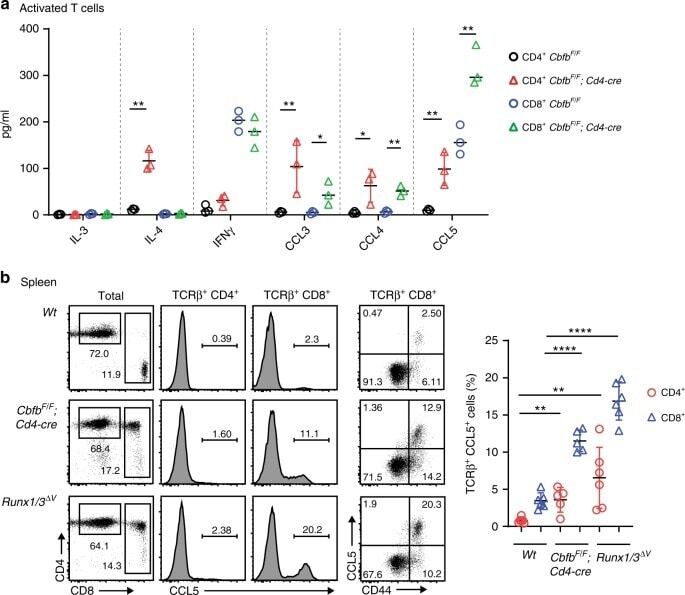
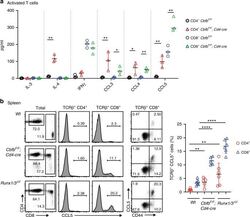
Submitted references Runx-mediated regulation of CCL5 via antagonizing two enhancers influences immune cell function and anti-tumor immunity.
Seo W, Shimizu K, Kojo S, Okeke A, Kohwi-Shigematsu T, Fujii SI, Taniuchi I
Nature communications 2020 Mar 26;11(1):1562
Nature communications 2020 Mar 26;11(1):1562
No comments: Submit comment
Supportive validation
- Submitted by
- Invitrogen Antibodies (provider)
- Main image
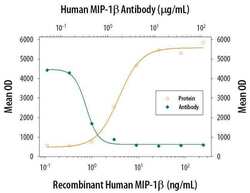
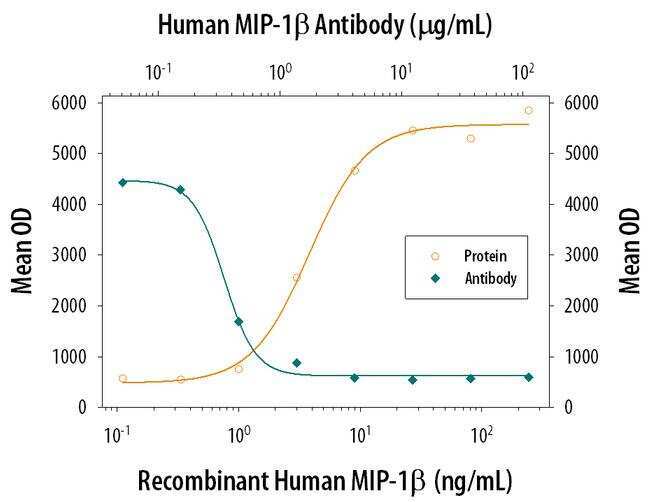
- Experimental details
- Neutralization antibody testing demonstrates the specificity of an antibody through a correlation between antibody binding and the activity of the target. Neutralization of CCL4 is shown by the decrease in fluorescence (Chemotaxis measured by Resazurin) with increasing concentrations of CCL4 Antibody (Product # MA5-23713).
- Submitted by
- Invitrogen Antibodies (provider)
- Main image
- Experimental details
- Fig. 1 Ccl5 expression from T cells is repressed by RUNX/CBFbeta complexes. a Expression profiles assessed by ELISA of CCL3, CCL4, and CCL5 and the selected cytokines IL-3, IL-4, and IFNgamma in supernatants of in vitro-stimulated CD4 + and CD8 + T cells at 5 days after stimulation. A summary of three independent measurements on three mice (with their genotypes indicated) are shown. Error bars indicate Mean +- SD and each dot represents a mouse examined over at least two independent experiments. Statistical significance is measured via unpaired two-tailed Student's t tests and is presented as follows: * p < 0.05, ** p < 0.01. b Flow cytometry analysis of total splenocytes and splenic TCRbeta + T cells in mice with their genotypes indicated. One representative profile of the CCL5 expression is shown in the histograms and dot plots. Numbers in the dot plots indicate the percentage of cells in each quadrant. Error bars indicate Mean +- SD and each dot represents a mouse examined over at least two independent experiments. Statistical significance is measured via unpaired two-tailed Student's t tests and is presented as follows: ** p < 0.01, **** p < 0.0001. Source data are provided as a Source Data file.