Explore
 Validate
 Learn
Learn Western blot
Antibody data
- Antibody Data
- Antigen structure
- References [1]
- Comments [0]
- Validations
- Western blot [1]
- Other assay [1]
Submit
Validation data
Reference
Comment
Report error
- Product number
- PA5-25465 - Provider product page

- Provider
- Invitrogen Antibodies
- Product name
- SRD5A2 Polyclonal Antibody
- Antibody type
- Polyclonal
- Antigen
- Synthetic peptide
- Reactivity
- Human, Mouse
- Host
- Rabbit
- Isotype
- IgG
- Vial size
- 400 µL
- Concentration
- 0.5 mg/mL
- Storage
- Store at 4°C short term. For long term storage, store at -20°C, avoiding freeze/thaw cycles.
Submitted references Hypermethylation of gene body CpG islands predicts high dosage of functional oncogenes in liver cancer.
Arechederra M, Daian F, Yim A, Bazai SK, Richelme S, Dono R, Saurin AJ, Habermann BH, Maina F
Nature communications 2018 Aug 8;9(1):3164
Nature communications 2018 Aug 8;9(1):3164
No comments: Submit comment
Supportive validation
- Submitted by
- Invitrogen Antibodies (provider)
- Main image
- Experimental details
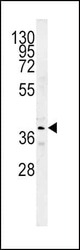
- Western blot analysis in mouse kidney tissue lysates (15 µg per lane) using a SRD5A2 polyclonal antibody (Product # PA5-25465).

Supportive validation
- Submitted by
- Invitrogen Antibodies (provider)
- Main image
- Experimental details
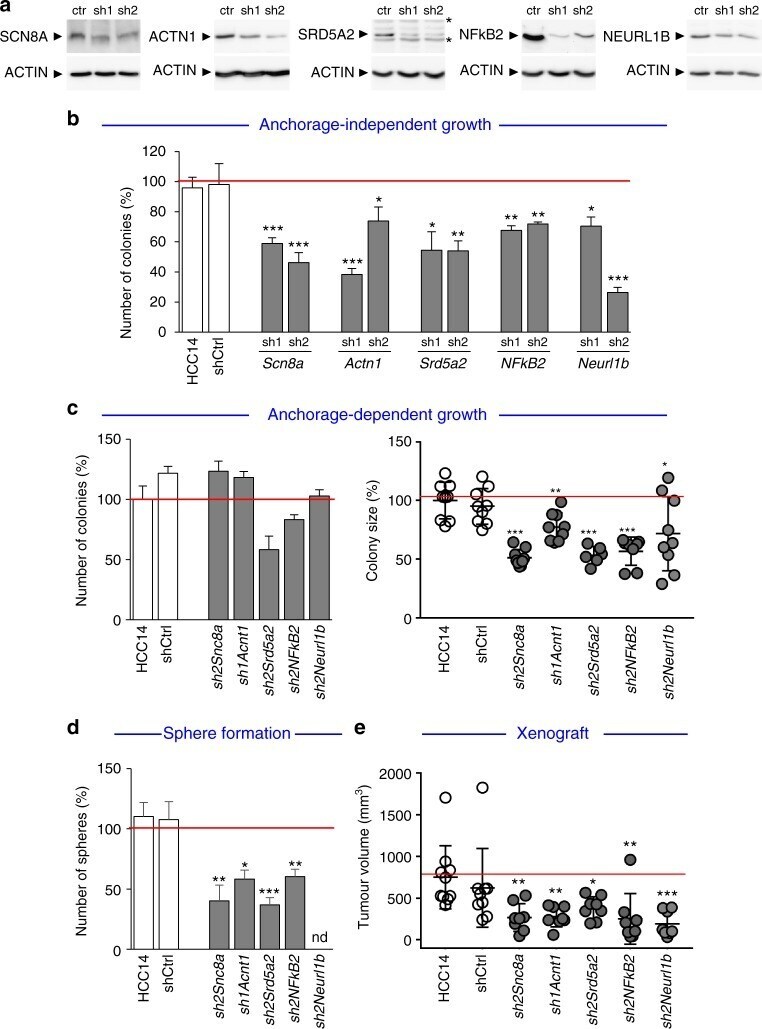
- Fig. 7 Downregulation of overexpressed genes with hypermethylated gene body CGI in Alb-R26 Met HCC cells interferes with their tumorigenic properties both in vitro and in vivo. a Western blots showing SCN8A, ACTN1, SRD5A2, NFkB2 and NEURL1B protein levels in stable clones established after transfection of Alb-R26 Met HCC14 cells with plasmids carrying a shRNA sequence targeting the corresponding gene. Protein levels were compared to control cells (ctr). ACTIN was used as a loading control in all western blots. The asterisk indicates nonspecific bands detected using anti-SRD5A2 antibodies. b - e Biological assays to assess functional properties of Alb-R26 Met HCC14 cells carrying a shRNA sequence targeting candidate genes. Effects were compared to HCC14 cells either untransfected or transfected with a control shRNA (shCtrl). b Graph reporting the number of colonies formed in anchorage-independent growth assays using 2 different shRNA targeting sequences for each candidate gene. Note a decrease in colony number formation of cells with downregulated candidate genes compared with control cells. c Graphs reporting the number (left) and the size (right) of colonies formed in anchorage-dependent growth assays. Whereas no significant changes in colony numbers were detected, note a significant decrease in colony size when the candidate gene is downregulated. d Graph reporting number of spheres formed in tumour sphere assays. Note that downregulation of candidate genes