 Explore
 Validate
 Learn
Learn Western blot
 Immunocytochemistry
 Immunoprecipitation
Antibody data
- Antibody Data
- Antigen structure
- References [3]
- Comments [0]
- Validations
- Immunocytochemistry [8]
- Other assay [2]
Submit
Validation data
Reference
Comment
Report error
- Product number
- MA1-19332 - Provider product page

- Provider
- Invitrogen Antibodies
- Product name
- Syk Monoclonal Antibody (SYK-01)
- Antibody type
- Monoclonal
- Antigen
- Recombinant protein fragment
- Description
- This antibody reacts with protein tyrosine kinase p72Syk (Syk; an intracellular antigen), which is required for the transduction of signals through the B cell antigen receptor (BCR) and the high affinity IgE receptor (FcepsilonRI).
- Reactivity
- Human, Mouse, Rat
- Host
- Mouse
- Isotype
- IgG
- Antibody clone number
- SYK-01
- Vial size
- 100 μg
- Concentration
- 1 mg/mL
- Storage
- 4°C, do not freeze
Submitted references Amyloid-β activates NLRP3 inflammasomes by affecting microglial immunometabolism through the Syk-AMPK pathway.
An Allosteric Shift in CD11c Affinity Activates a Proatherogenic State in Arrested Intermediate Monocytes.
CARD9 negatively regulates NLRP3-induced IL-1β production on Salmonella infection of macrophages.
Jung ES, Suh K, Han J, Kim H, Kang HS, Choi WS, Mook-Jung I
Aging cell 2022 May;21(5):e13623
Aging cell 2022 May;21(5):e13623
An Allosteric Shift in CD11c Affinity Activates a Proatherogenic State in Arrested Intermediate Monocytes.
Hernandez AA, Foster GA, Soderberg SR, Fernandez A, Reynolds MB, Orser MK, Bailey KA, Rogers JH, Singh GD, Wu H, Passerini AG, Simon SI
Journal of immunology (Baltimore, Md. : 1950) 2020 Nov 15;205(10):2806-2820
Journal of immunology (Baltimore, Md. : 1950) 2020 Nov 15;205(10):2806-2820
CARD9 negatively regulates NLRP3-induced IL-1β production on Salmonella infection of macrophages.
Pereira M, Tourlomousis P, Wright J, P Monie T, Bryant CE
Nature communications 2016 Sep 27;7:12874
Nature communications 2016 Sep 27;7:12874
No comments: Submit comment
Supportive validation
- Submitted by
- Invitrogen Antibodies (provider)
- Main image
- Experimental details
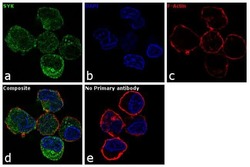
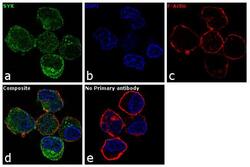
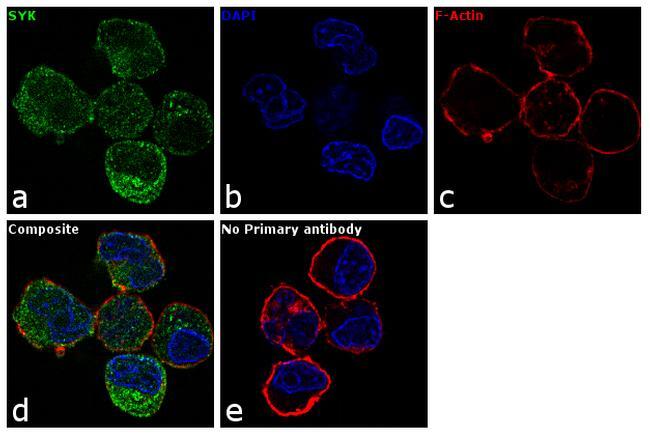
- Immunofluorescence analysis of SYK was performed using 70% confluent log phase Ramos cells. The cells were fixed with 4% paraformaldehyde for 10 minutes, permeabilized with 0.1% Triton™ X-100 for 15 minutes, and blocked with 1% BSA for 1 hour at room temperature. The cells were labeled with SYK Mouse Monoclonal Antibody(Product # MA1-19332) at 5 µg/mL in 0.1% BSA, incubated at 4 degree Celsius overnight and then labeled with Goat anti-Mouse IgG (H+L) Superclonal™ Secondary Antibody, Alexa Fluor® 488 conjugate (Product # A28175) at a dilution of 1:2000 for 45 minutes at room temperature (Panel a: green). Nuclei (Panel b: blue) were stained with SlowFade® Gold Antifade Mountant with DAPI (Product # S36938). F-actin (Panel c: red) was stained with Rhodamine Phalloidin (Product # R415, 1:300). Panel d represents the merged image showing cytoplasmic localization. Panel e represents control cells with no primary antibody to assess background. The images were captured at 60X magnification.

- Submitted by
- Invitrogen Antibodies (provider)
- Main image
- Experimental details
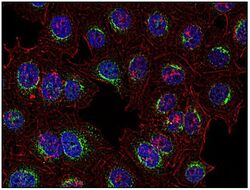
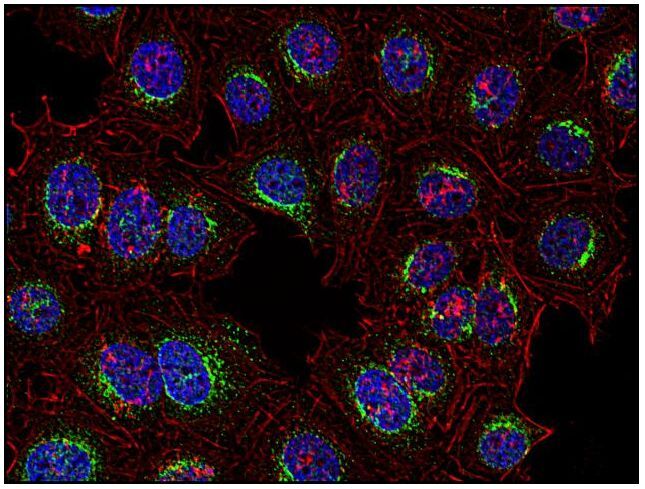
- Immunocytochemistry analysis of Syk in human HeLa cell line using anti-Syk (SYK-01; green) Monoclonal antibody (Product # MA1-19332). Actin cytoskeleton was decorated by phalloidin (red) and cell nuclei stained with DAPI (blue).

- Submitted by
- Invitrogen Antibodies (provider)
- Main image
- Experimental details
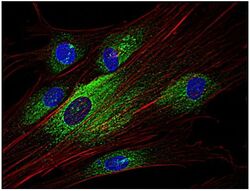
- Immunocytochemistry analysis of Syk in human primary fibroblasts using anti-Syk (SYK-01; green) Monoclonal antibody (Product # MA1-19332). Actin cytoskeleton was decorated by phalloidin (red) and cell nuclei stained with DAPI (blue).

- Submitted by
- Invitrogen Antibodies (provider)
- Main image

- Experimental details
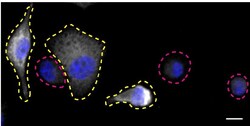
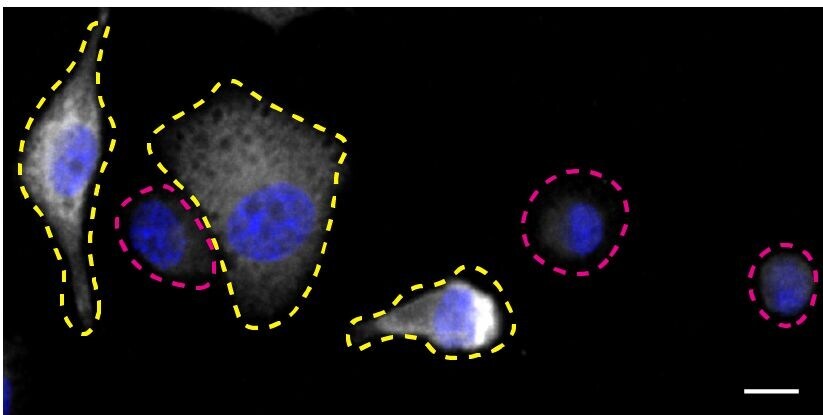
- Immunofluorescence of SYK was performed using THP-1 wild-type and SYK KO cells that were transfected with a green or a far-red fluorescent dye, respectively. Post-transfection, WT and KO cells were mixed and plated to a 1:1 ratio on coverslips as a mosaic and incubated for 24 hrs. Cells were fixed in 4% PFA (in PBS) or methanol for 15 min; cells were permeabilized with 0.1% Triton X-100 for 10 min at RT and blocked with PBS with 5% BSA, 5% goat serum, and 0.01% Triton X-100 for 30 min. Cells were stained with the SYK monoclonal antibody (Product # MA1-19332) at a 1:1,000 dilution overnight at 4°C. Secondary antibody incubation was performed using 1 µg/mL of Goat anti-Mouse IgG (H+L) Highly Cross-Adsorbed Secondary Antibody, Alexa Fluor 555 antibody (Product # A21424) together with DAPI for 1 hr. Imaging was performed with a 40X oil objective and analysis was performed using Image J. Cell image represents a single focal plane; WT and KO cells are outlined with a yellow (WT) or magenta (KO) dashed line. Data courtesy of YCharOS Inc., an open science company with the mission of characterizing commercially available antibodies using knockout validation.

- Submitted by
- Invitrogen Antibodies (provider)
- Main image
- Experimental details
- Immunofluorescence analysis of SYK was performed using 70% confluent log phase Ramos cells. The cells were fixed with 4% paraformaldehyde for 10 minutes, permeabilized with 0.1% Triton™ X-100 for 15 minutes, and blocked with 1% BSA for 1 hour at room temperature. The cells were labeled with SYK Mouse Monoclonal Antibody(Product # MA1-19332) at 5 µg/mL in 0.1% BSA, incubated at 4 degree Celsius overnight and then labeled with Goat anti-Mouse IgG (H+L) Superclonal™ Secondary Antibody, Alexa Fluor® 488 conjugate (Product # A28175) at a dilution of 1:2000 for 45 minutes at room temperature (Panel a: green). Nuclei (Panel b: blue) were stained with SlowFade® Gold Antifade Mountant with DAPI (Product # S36938). F-actin (Panel c: red) was stained with Rhodamine Phalloidin (Product # R415, 1:300). Panel d represents the merged image showing cytoplasmic localization. Panel e represents control cells with no primary antibody to assess background. The images were captured at 60X magnification.
- Submitted by
- Invitrogen Antibodies (provider)
- Main image

- Experimental details
- Immunocytochemistry analysis of Syk in human HeLa cell line using anti-Syk (SYK-01; green) Monoclonal antibody (Product # MA1-19332). Actin cytoskeleton was decorated by phalloidin (red) and cell nuclei stained with DAPI (blue).
- Submitted by
- Invitrogen Antibodies (provider)
- Main image

- Experimental details
- Immunocytochemistry analysis of Syk in human primary fibroblasts using anti-Syk (SYK-01; green) Monoclonal antibody (Product # MA1-19332). Actin cytoskeleton was decorated by phalloidin (red) and cell nuclei stained with DAPI (blue).

- Submitted by
- Invitrogen Antibodies (provider)
- Main image
- Experimental details
- Immunofluorescence of SYK was performed using THP-1 wild-type and SYK KO cells that were transfected with a green or a far-red fluorescent dye, respectively. Post-transfection, WT and KO cells were mixed and plated to a 1:1 ratio on coverslips as a mosaic and incubated for 24 hrs. Cells were fixed in 4% PFA (in PBS) or methanol for 15 min; cells were permeabilized with 0.1% Triton X-100 for 10 min at RT and blocked with PBS with 5% BSA, 5% goat serum, and 0.01% Triton X-100 for 30 min. Cells were stained with the SYK monoclonal antibody (Product # MA1-19332) at a 1:1,000 dilution overnight at 4°C. Secondary antibody incubation was performed using 1 µg/mL of Goat anti-Mouse IgG (H+L) Highly Cross-Adsorbed Secondary Antibody, Alexa Fluor 555 antibody (Product # A21424) together with DAPI for 1 hr. Imaging was performed with a 40X oil objective and analysis was performed using Image J. Cell image represents a single focal plane; WT and KO cells are outlined with a yellow (WT) or magenta (KO) dashed line. Data courtesy of YCharOS Inc., an open science company with the mission of characterizing commercially available antibodies using knockout validation.
Supportive validation
- Submitted by
- Invitrogen Antibodies (provider)
- Main image
- Experimental details
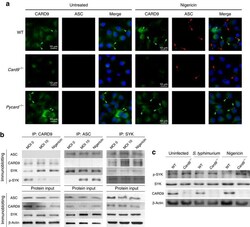
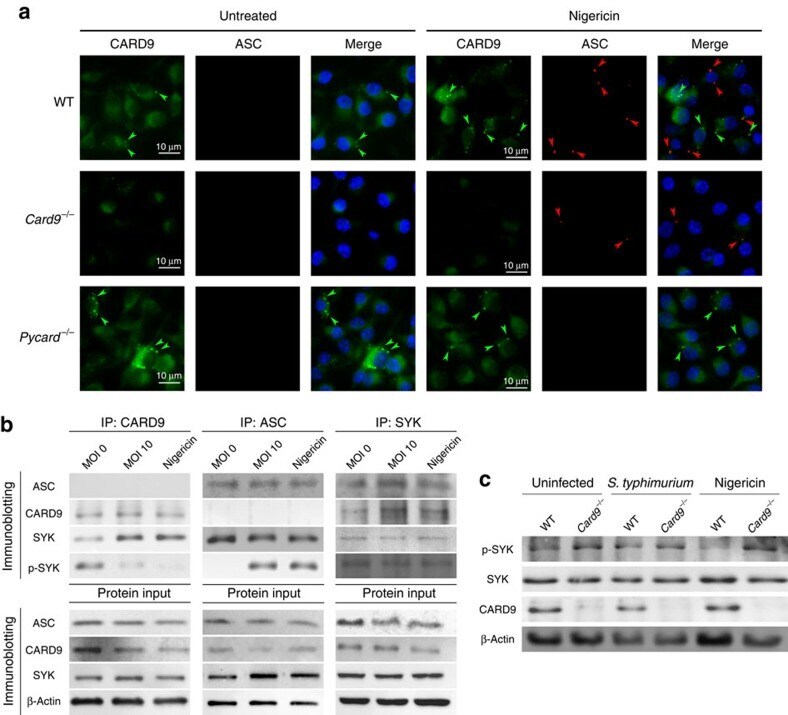
- Figure 5 CARD9 and SYK regulates NLRP3 activation upstream to speck formation. ( a ) CARD9 and ASC were immuno-labelled in WT, Card9 -/- and Pycard -/- LPS-primed macrophages after nigericin stimulation (5 muM, 30 min). Green arrows indicate CARD9 aggregates. Red arrows indicate ASC specks. ( b ) Co-immunoprecipitation of ASC, CARD9 and SYK from cell lysates of uninfected, S . Typhimurium-infected (m.o.i. 10, 30 min) or nigericin-stimulated (10 muM, 30 min) LPS-primed BMDMs. ( c ) Immunoblot analysis of LPS-primed WT and Card9 -/- uninfected, S . Typhimurium-infected (m.o.i. 10, 2 h) or nigericin-stimulated (10 muM, 30 min) BMDMs. ( a - c ) Images are representative of three independent experiments. Scale bar, 10 mum.
- Submitted by
- Invitrogen Antibodies (provider)
- Main image
- Experimental details
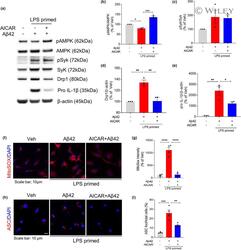
- 4 FIGURE AMPK activation restores Abeta42-induced mitochondrial hyperfission and inflammasome activation in LPS-primed microglia. LPS-primed microglia were pretreated with AICAR (1 mM) for 1 h and then treated with Abeta42 for 24 h. (a-e) Representative immunoblot (a) and densitometric quantifications (b-e) of the protein levels of pAMPK, AMPK, pSyk, Syk, Drp1, pro-IL-1beta, and beta-actin in total cell lysate. (f-g) MitoSOX (red) and DAPI (blue) staining and quantification of MitoSOX fluorescence intensity. Scale bar: 10 mum. (h) Immunostaining of ASC (red) and DAPI (blue). Scale bar: 10 mum. (i) Percentages of microglia containing ASC foci were counted. Data are shown as mean +- SEM from at least three independent experiments and are analyzed by one-way ANOVA and Tukey's multiple comparisons test. * p < 0.05, ** p < 0.01, *** p < 0.001, and **** p < 0.0001
