Explore
 Validate
 Learn
Learn Flow cytometry
Antibody data
- Antibody Data
- Antigen structure
- References [21]
- Comments [0]
- Validations
- Flow cytometry [1]
- Other assay [30]
Submit
Validation data
Reference
Comment
Report error
- Product number
- 56-0247-42 - Provider product page

- Provider
- Invitrogen Antibodies
- Product name
- CD24 Monoclonal Antibody (eBioSN3 (SN3 A5-2H10)), Alexa Fluor™ 700, eBioscience™
- Antibody type
- Monoclonal
- Antigen
- Other
- Description
- Description: The SN3 monoclonal antibody reacts with the human CD24 molecule, also known as Heat Stable Antigen (HSA). This 35-50 kDa molecule is anchored in the plasma membrane via phosphatidylinositol and is expressed by erythrocytes, thymocytes, peripheral lymphocytes and myeloid lineage. It has been reported that P-selectin (CD62P) binds to CD24.
- Conjugate
- Near infrared dye
- Antibody clone number
- eBioSN3 (SN3 A5-2H10)
- Concentration
- 5 µL/Test
Submitted references Naringin protects human nucleus pulposus cells against TNF-α-induced inflammation, oxidative stress, and loss of cellular homeostasis by enhancing autophagic flux via AMPK/SIRT1 activation.
Elevated transcription and glycosylation of B3GNT5 promotes breast cancer aggressiveness.
A CD10-OGP Membrane Peptolytic Signaling Axis in Fibroblasts Regulates Lipid Metabolism of Cancer Stem Cells via SCD1.
IGF2BP2 regulates DANCR by serving as an N6-methyladenosine reader.
Chemotherapeutic Stress Influences Epithelial-Mesenchymal Transition and Stemness in Cancer Stem Cells of Triple-Negative Breast Cancer.
Obesity-Altered Adipose Stem Cells Promote Radiation Resistance of Estrogen Receptor Positive Breast Cancer through Paracrine Signaling.
HMGB3 silence inhibits breast cancer cell proliferation and tumor growth by interacting with hypoxia-inducible factor 1α.
BRCA1 regulates the cancer stem cell fate of breast cancer cells in the context of hypoxia and histone deacetylase inhibitors.
The hypoxic tumor microenvironment in vivo selects the cancer stem cell fate of breast cancer cells.
Glutamic Pyruvate Transaminase GPT2 Promotes Tumorigenesis of Breast Cancer Cells by Activating Sonic Hedgehog Signaling.
HOXC8 regulates self-renewal, differentiation and transformation of breast cancer stem cells.
Llgl1 prevents metaplastic survival driven by epidermal growth factor dependent migration.
The Z-cad dual fluorescent sensor detects dynamic changes between the epithelial and mesenchymal cellular states.
Special AT-rich sequence-binding protein-1 participates in the maintenance of breast cancer stem cells through regulation of the Notch signaling pathway and expression of Snail1 and Twist1.
TFAP2C governs the luminal epithelial phenotype in mammary development and carcinogenesis.
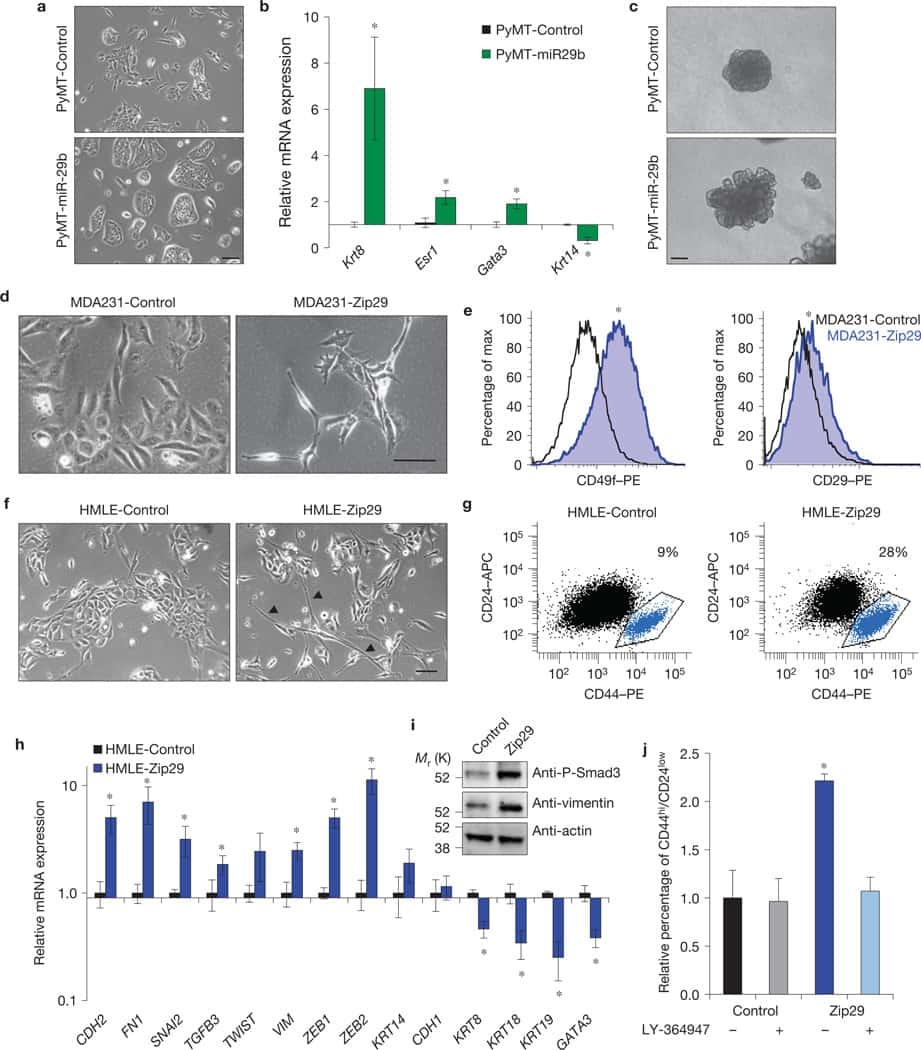
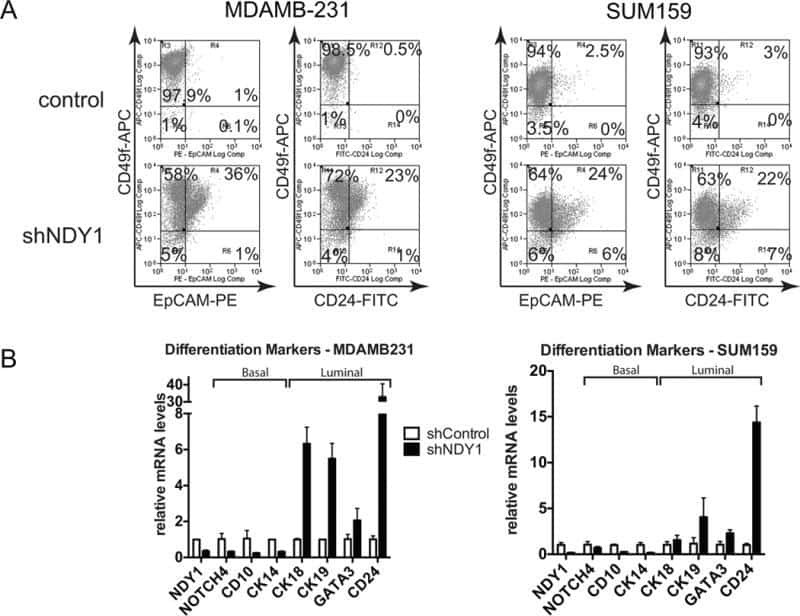
NDY1/KDM2B functions as a master regulator of polycomb complexes and controls self-renewal of breast cancer stem cells.
Increased invasion and tumorigenicity capacity of CD44+/CD24- breast cancer MCF7 cells in vitro and in nude mice.
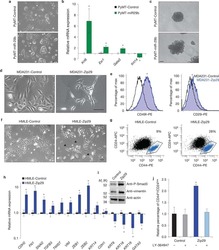
GATA3 suppresses metastasis and modulates the tumour microenvironment by regulating microRNA-29b expression.
Isolation and characterization of intestinal stem cells based on surface marker combinations and colony-formation assay.
Expression of Six1 in luminal breast cancers predicts poor prognosis and promotes increases in tumor initiating cells by activation of extracellular signal-regulated kinase and transforming growth factor-beta signaling pathways.
Expression of stem cell markers in the human fetal kidney.
Chen R, Gao S, Guan H, Zhang X, Gao Y, Su Y, Song Y, Jiang Y, Li N
Oxidative medicine and cellular longevity 2022;2022:7655142
Oxidative medicine and cellular longevity 2022;2022:7655142
Elevated transcription and glycosylation of B3GNT5 promotes breast cancer aggressiveness.
Miao Z, Cao Q, Liao R, Chen X, Li X, Bai L, Ma C, Deng X, Dai Z, Li J, Dong C
Journal of experimental & clinical cancer research : CR 2022 May 7;41(1):169
Journal of experimental & clinical cancer research : CR 2022 May 7;41(1):169
A CD10-OGP Membrane Peptolytic Signaling Axis in Fibroblasts Regulates Lipid Metabolism of Cancer Stem Cells via SCD1.
Yu S, Lu Y, Su A, Chen J, Li J, Zhou B, Liu X, Xia Q, Li Y, Li J, Huang M, Ye Y, Zhao Q, Jiang S, Yan X, Wang X, Di C, Pan J, Su S
Advanced science (Weinheim, Baden-Wurttemberg, Germany) 2021 Oct;8(19):e2101848
Advanced science (Weinheim, Baden-Wurttemberg, Germany) 2021 Oct;8(19):e2101848
IGF2BP2 regulates DANCR by serving as an N6-methyladenosine reader.
Hu X, Peng WX, Zhou H, Jiang J, Zhou X, Huang D, Mo YY, Yang L
Cell death and differentiation 2020 Jun;27(6):1782-1794
Cell death and differentiation 2020 Jun;27(6):1782-1794
Chemotherapeutic Stress Influences Epithelial-Mesenchymal Transition and Stemness in Cancer Stem Cells of Triple-Negative Breast Cancer.
Li X, Strietz J, Bleilevens A, Stickeler E, Maurer J
International journal of molecular sciences 2020 Jan 8;21(2)
International journal of molecular sciences 2020 Jan 8;21(2)
Obesity-Altered Adipose Stem Cells Promote Radiation Resistance of Estrogen Receptor Positive Breast Cancer through Paracrine Signaling.
Sabol RA, Villela VA, Denys A, Freeman BT, Hartono AB, Wise RM, Harrison MAA, Sandler MB, Hossain F, Miele L, Bunnell BA
International journal of molecular sciences 2020 Apr 15;21(8)
International journal of molecular sciences 2020 Apr 15;21(8)
HMGB3 silence inhibits breast cancer cell proliferation and tumor growth by interacting with hypoxia-inducible factor 1α.
Gu J, Xu T, Huang QH, Zhang CM, Chen HY
Cancer management and research 2019;11:5075-5089
Cancer management and research 2019;11:5075-5089
BRCA1 regulates the cancer stem cell fate of breast cancer cells in the context of hypoxia and histone deacetylase inhibitors.
Kim H, Lin Q, Yun Z
Scientific reports 2019 Jul 4;9(1):9702
Scientific reports 2019 Jul 4;9(1):9702
The hypoxic tumor microenvironment in vivo selects the cancer stem cell fate of breast cancer cells.
Kim H, Lin Q, Glazer PM, Yun Z
Breast cancer research : BCR 2018 Mar 6;20(1):16
Breast cancer research : BCR 2018 Mar 6;20(1):16
Glutamic Pyruvate Transaminase GPT2 Promotes Tumorigenesis of Breast Cancer Cells by Activating Sonic Hedgehog Signaling.
Cao Y, Lin SH, Wang Y, Chin YE, Kang L, Mi J
Theranostics 2017;7(12):3021-3033
Theranostics 2017;7(12):3021-3033
HOXC8 regulates self-renewal, differentiation and transformation of breast cancer stem cells.
Shah M, Cardenas R, Wang B, Persson J, Mongan NP, Grabowska A, Allegrucci C
Molecular cancer 2017 Feb 16;16(1):38
Molecular cancer 2017 Feb 16;16(1):38
Llgl1 prevents metaplastic survival driven by epidermal growth factor dependent migration.
Greenwood E, Maisel S, Ebertz D, Russ A, Pandey R, Schroeder J
Oncotarget 2016 Sep 20;7(38):60776-60792
Oncotarget 2016 Sep 20;7(38):60776-60792
The Z-cad dual fluorescent sensor detects dynamic changes between the epithelial and mesenchymal cellular states.
Toneff MJ, Sreekumar A, Tinnirello A, Hollander PD, Habib S, Li S, Ellis MJ, Xin L, Mani SA, Rosen JM
BMC biology 2016 Jun 17;14:47
BMC biology 2016 Jun 17;14:47
Special AT-rich sequence-binding protein-1 participates in the maintenance of breast cancer stem cells through regulation of the Notch signaling pathway and expression of Snail1 and Twist1.
Sun Z, Zhang C, Zou X, Jiang G, Xu Z, Li W, Xie H
Molecular medicine reports 2015 May;11(5):3235-542
Molecular medicine reports 2015 May;11(5):3235-542
TFAP2C governs the luminal epithelial phenotype in mammary development and carcinogenesis.
Cyr AR, Kulak MV, Park JM, Bogachek MV, Spanheimer PM, Woodfield GW, White-Baer LS, O'Malley YQ, Sugg SL, Olivier AK, Zhang W, Domann FE, Weigel RJ
Oncogene 2015 Jan 22;34(4):436-44
Oncogene 2015 Jan 22;34(4):436-44
NDY1/KDM2B functions as a master regulator of polycomb complexes and controls self-renewal of breast cancer stem cells.
Kottakis F, Foltopoulou P, Sanidas I, Keller P, Wronski A, Dake BT, Ezell SA, Shen Z, Naber SP, Hinds PW, McNiel E, Kuperwasser C, Tsichlis PN
Cancer research 2014 Jul 15;74(14):3935-46
Cancer research 2014 Jul 15;74(14):3935-46
Increased invasion and tumorigenicity capacity of CD44+/CD24- breast cancer MCF7 cells in vitro and in nude mice.
Yan W, Chen Y, Yao Y, Zhang H, Wang T
Cancer cell international 2013 Jun 24;13(1):62
Cancer cell international 2013 Jun 24;13(1):62
GATA3 suppresses metastasis and modulates the tumour microenvironment by regulating microRNA-29b expression.
Chou J, Lin JH, Brenot A, Kim JW, Provot S, Werb Z
Nature cell biology 2013 Feb;15(2):201-13
Nature cell biology 2013 Feb;15(2):201-13
Isolation and characterization of intestinal stem cells based on surface marker combinations and colony-formation assay.
Wang F, Scoville D, He XC, Mahe MM, Box A, Perry JM, Smith NR, Lei NY, Davies PS, Fuller MK, Haug JS, McClain M, Gracz AD, Ding S, Stelzner M, Dunn JC, Magness ST, Wong MH, Martin MG, Helmrath M, Li L
Gastroenterology 2013 Aug;145(2):383-95.e1-21
Gastroenterology 2013 Aug;145(2):383-95.e1-21
Expression of Six1 in luminal breast cancers predicts poor prognosis and promotes increases in tumor initiating cells by activation of extracellular signal-regulated kinase and transforming growth factor-beta signaling pathways.
Iwanaga R, Wang CA, Micalizzi DS, Harrell JC, Jedlicka P, Sartorius CA, Kabos P, Farabaugh SM, Bradford AP, Ford HL
Breast cancer research : BCR 2012 Jul 5;14(4):R100
Breast cancer research : BCR 2012 Jul 5;14(4):R100
Expression of stem cell markers in the human fetal kidney.
Metsuyanim S, Harari-Steinberg O, Buzhor E, Omer D, Pode-Shakked N, Ben-Hur H, Halperin R, Schneider D, Dekel B
PloS one 2009 Aug 21;4(8):e6709
PloS one 2009 Aug 21;4(8):e6709
No comments: Submit comment
Supportive validation
- Submitted by
- Invitrogen Antibodies (provider)
- Main image

- Experimental details
- Normal human peripheral blood cells were stained with Mouse IgG1 kappa Isotype Control, Alexa Fluor 700 (Product # 56-4714-80) (blue histogram) or CD24 Monoclonal Antibody, Alexa Fluor 700 (purple histogram). Cells in the lymphocyte gate were used for analysis.
- Conjugate
- Near infrared dye

Supportive validation
- Submitted by
- Invitrogen Antibodies (provider)
- Main image
- Experimental details
- NULL
- Conjugate
- Near infrared dye
- Submitted by
- Invitrogen Antibodies (provider)
- Main image

- Experimental details
- NULL
- Conjugate
- Near infrared dye

- Submitted by
- Invitrogen Antibodies (provider)
- Main image

- Experimental details
- NULL
- Conjugate
- Near infrared dye

- Submitted by
- Invitrogen Antibodies (provider)
- Main image

- Experimental details
- NULL
- Conjugate
- Near infrared dye

- Submitted by
- Invitrogen Antibodies (provider)
- Main image
- Experimental details
- NULL
- Conjugate
- Near infrared dye
- Submitted by
- Invitrogen Antibodies (provider)
- Main image

- Experimental details
- NULL
- Conjugate
- Near infrared dye

- Submitted by
- Invitrogen Antibodies (provider)
- Main image

- Experimental details
- Fig. 6 The Z-cad dual sensor enriches for CSCs better than either sensor alone. a Analysis strategy for identifying CD24/CD44 expression of HMLER cells first gated based on distinct Z-cad expression patterns. The CD24/CD44 plot shown here indicates the entire cellular population (Bulk) without prior Z-cad gating. CD24 and CD44 negative box is shown in gray and was identified using singly stained samples. CSC-enriched population (CD24 low/neg /CD44 hi ) is shown in the red box . b Percentage of cells falling into CSC-enriched population (CD24 lo/neg CD44 hi ) first gated on indicated Z-cad sensor fluorescence patterns. Bulk represents all cells. Data were analyzed using the paired Student''s t test ( n = 6 biological replicates). c HMLER cells were sorted into EMT and Bulk -EMT groups (shown) or CSC and NCSC (not shown) and were plated and grown under tumorsphere conditions (1000 cells per well in a 96-well plate, 5 technical replicates per biological replicate, 3 biological replicates). d After 12 days, spheres >75 mum were quantified. Data were analyzed using the paired Student''s t test
- Conjugate
- Near infrared dye

- Submitted by
- Invitrogen Antibodies (provider)
- Main image

- Experimental details
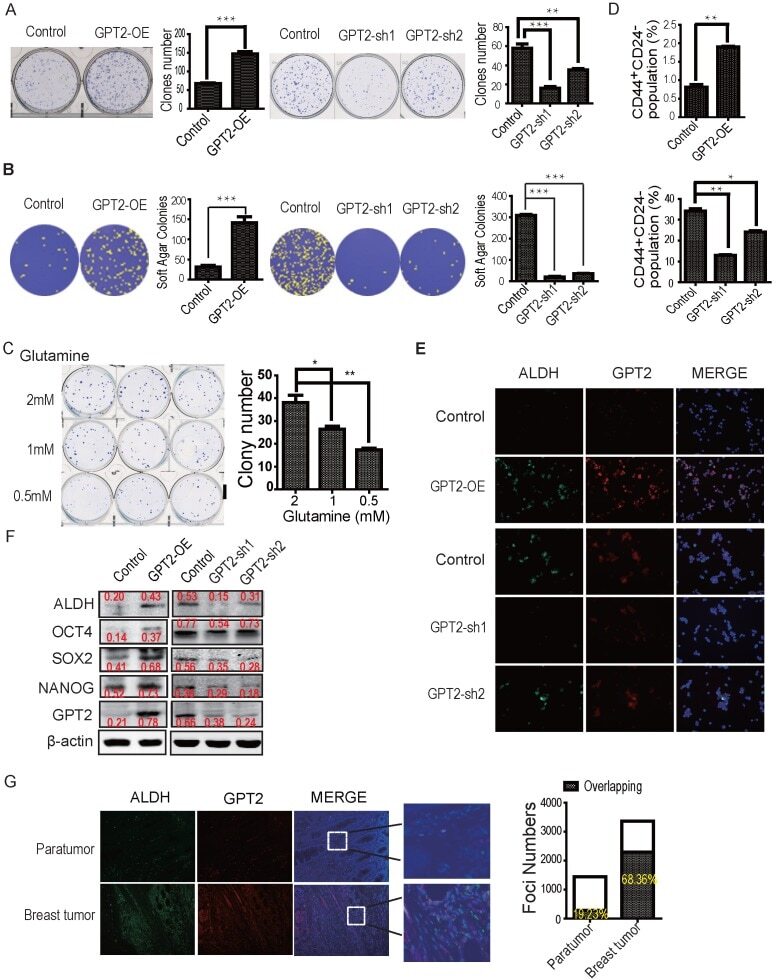
- Figure 2 GPT2-induced breast cancer cell stemness and tumorigenesis A. & B. GPT2 promotes colony formation of breast cancer cells. A. Colony formation assay (n = 3), ***: P < 0.001; **: P < 0.01. B. Soft agar assay (n = 3). ***: P < 0.001 C. The effects of glutamine on colony formation. The basic medium was without glutamine. D. Flow cytometry analysis of CD44 and CD24 expression in GPT2 overexpressing MDA-MB-231 and GPT2 knockdown MCF7 cells. The values represent percentage of CD44 + CD24 - cells. **: P < 0.01;*: P < 0.05. E. GPT2 and ALDH expression was analyzed in GPT2 overexpressing MDA-MB-231 and GPT2 knockdown MCF7 cells by immunofluorescence staining. Red and green represent GPT2 and ALDH, respectively (20 X). F. Representative Western blots show the expression of ALDH, SOX2, OCT4 and NANOG in GPT2 overexpressing MDA-MB-231 and GPT2 knockdown MCF7 cells. G. GPT2 and ALDH expression was analyzed in clinical breast tumors and paratumor tissues by immunofluorescence staining (n= 6 cases). Red and green represent GPT2 and ALDH, respectively (10 X). The values on the histogram represent cell numbers per view. The big white bars represent GPT2 positive cell numbers while the small shading bars inside indicate ALDH positive cell numbers. GPT2 overexpression cells were MDA-MB-231 while GPT2 knockdown cells were MCF7. Data in (A-G) represent three independent experiments. Error bars: standard deviation. ***: P < 0.001; **: P < 0.01; *: P < 0.05.
- Conjugate
- Near infrared dye
- Submitted by
- Invitrogen Antibodies (provider)
- Main image
- Experimental details
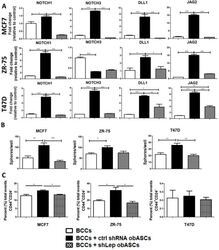
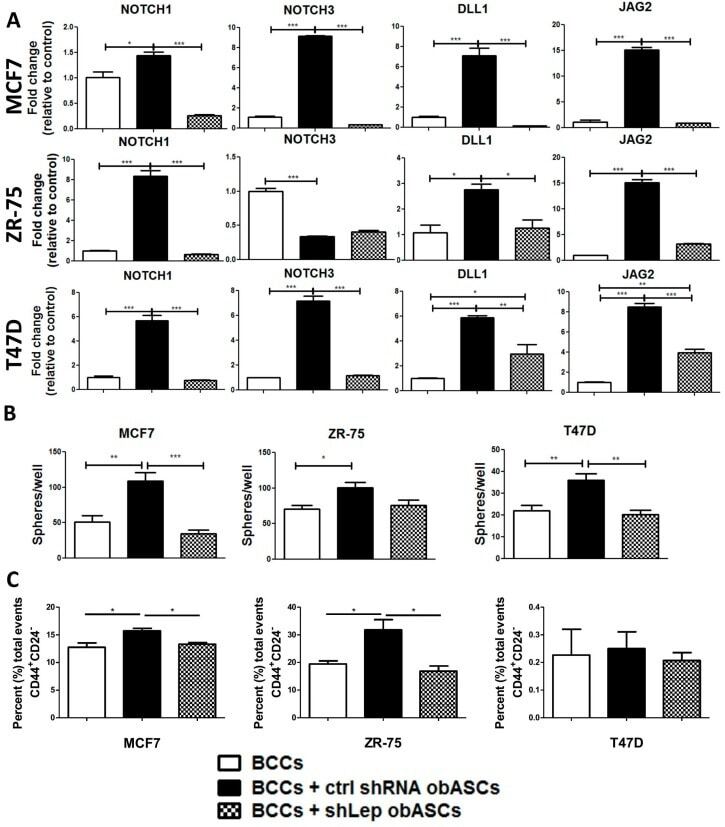
- Figure 4 obASCs promote a cancer stem-like phenotype through leptin. ( A ) Transwell co-culture with shCtrl obASCs upregulates NOTCH1, NOTCH3, DELTA1, and JAGGED2 in ER + BCCs. ( B ) BCCs have increased ability to form mammospheres after co-culture with shCtrl obASCs followed by 2 Gy radiation compared to non-co-cultured cells or cells co-cultured with shLep obASCs. ( C ) Flow cytometric analysis of the breast cancer stem cell markers CD44 + CD24 - was evaluated for BCCs after transwell co-culture with shCtrl obASCs or shLep obASCs. Values reported are the mean of three independent experiments each performed in triplicate. Bars, +- SEM. * p < 0.05, ** p < 0.01, *** p < 0.001.
- Conjugate
- Near infrared dye
- Submitted by
- Invitrogen Antibodies (provider)
- Main image
- Experimental details
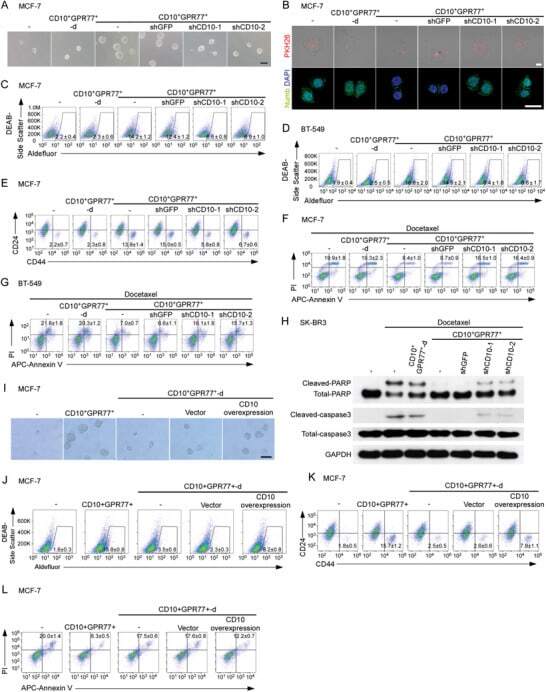
- Figure 2 CD10 in CAFs sustains cancer stemness and chemoresistance. A-E) Indicated tumor cell lines were cultured alone (-) or cocultured with CD10 + GPR77 + -depleted CAFs (CD10 + GPR77 + -d) or paired CD10 + GPR77 + CAFs transduced without (-) or with shGFP or shCD10. A) Representative images of mammosphere formation in MCF-7 cells. Scale bar, 100 um. B) Representative images of PKH26 and Numb immunofluorescence staining of MCF-7 cells. Scale bar, 50 um. C,D) Percentage of ALDH1 + cells in C) MCF-7 and D) BT-549 cells detected by flow cytometry. Numerical values are presented as percentage (mean +- SEM, n = 3). E) Percentage of CD44 high CD24 low cells in MCF-7 cells cocultured with indicated CAFs was detected by flow cytometry. Numerical values are presented as percentage (mean +- SEM, n = 3). F,G) Representative flow cytometry plots for F) MCF-7 and G) BT-549 cells treated with docetaxel after being cultured alone (-) or cocultured with the indicated CAFs. The proportion of Annexin V + /Propidium iodide - (early apoptosis) and Annexin V + /Propidium iodide + (late apoptosis) cells is shown. The numerical values indicate Annexin V + percentage. Data are represented as the mean +- SEM of F) n = 4 or G) n = 3 independent experiments. H) Representative immunoblots for cleaved/total caspase-3 and PARP in SK-BR3 cells treated with docetaxel after being cultured alone (-) or cocultured with indicated CAFs ( n = 3). I-L) MCF-7 cells were cocultured with CD10 + GPR77 + CAFs or CD1
- Conjugate
- Near infrared dye
- Submitted by
- Invitrogen Antibodies (provider)
- Main image

- Experimental details
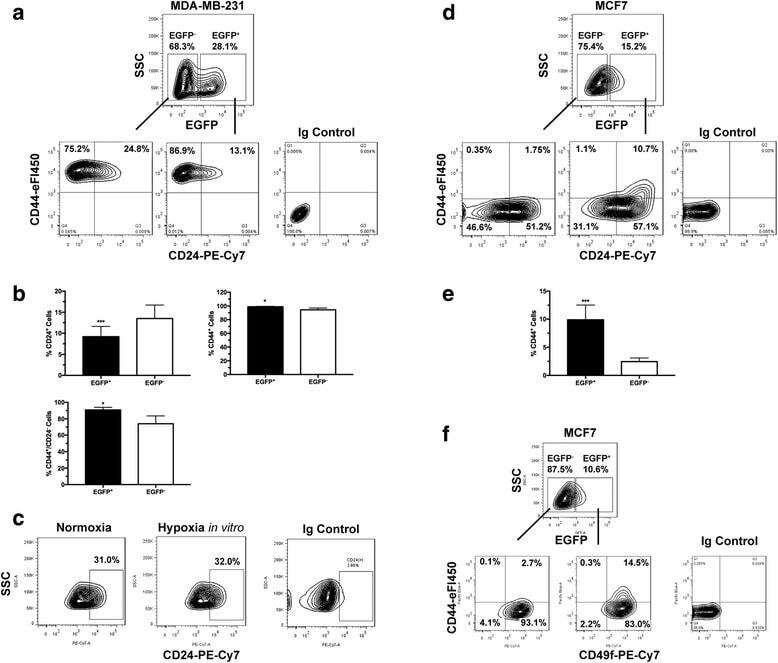
- Fig. 2 Cancer stem cell (CSC)-like cells are enriched in the hypoxic populations freshly isolated from xenografts. Tumor cells are enzymatically dissociated and isolated from either the MDA-MB-231/HRE-EGFP ( a - c ) or MCF7/HRE-EGFP ( d - f ) xenografts. Stem cell characteristics are evaluated by fluorescence-activated cell sorting (FACS) for the expression of CSC-associated surface markers CD24, CD44 and CD49f. Representative FACS plots are shown in a , c , d and f . Quantitative population analyses are shown in b ( n = 4-5; * p < 0.05, *** p < 0.001, Student's t test) and e (n = 4; *** p < 0.001, Student's t test). These results are confirmed by three or more independent experiments. EGFP, enhanced green fluorescent protein; SSC, side scatter
- Conjugate
- Near infrared dye
- Submitted by
- Invitrogen Antibodies (provider)
- Main image
- Experimental details
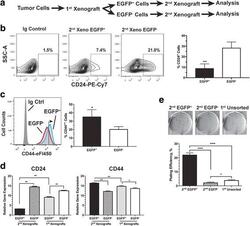
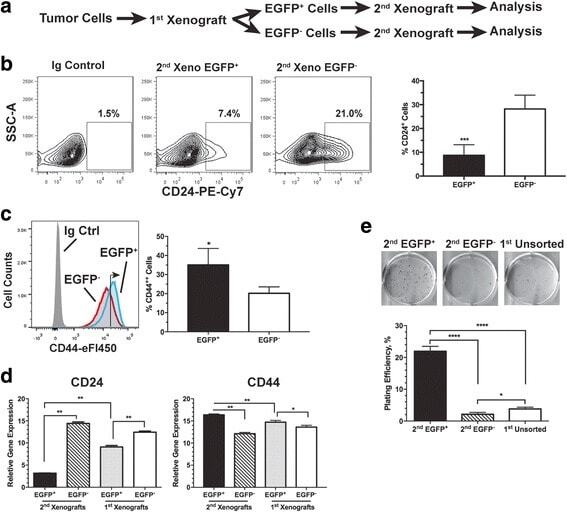
- Fig. 4 The cancer stem cell (CSC)-like population is further enriched in secondary xenografts derived from the enhanced green fluorescent protein (EGFP) + MDA-MB-231 cells. a Generation of the secondary xenografts. b , c Surface levels of CD24 and CD44 are analyzed by fluorescence-activated cell sorting. b Average CD24 + populations from six individual tumors (*** p < 0.001, Student's t test). c Average CD44 ++ (right-pointing arrow) populations from three individual tumors (* p < 0.05, Student's t test). d Quantitative RT-PCR analysis of expression of CD24 and CD44 genes in the EGFP + and EGFP - cells freshly isolated from either the 2 nd or 1 st xenografts (n = 3; * p < 0.05, ** p < 0.01, Student's t test). e Clonogenic growth of sorted EGFP + and EGFP - cells freshly isolated from the 2 nd xenografts in comparison to the unsorted tumor cells from the 1 st xenografts (n = 3; * p < 0.05, *** p < 0.0001, Student's t test)
- Conjugate
- Near infrared dye
- Submitted by
- Invitrogen Antibodies (provider)
- Main image

- Experimental details
- Fig. 5 The cancer stem cell (CSC)-like characteristics of tumor cells isolated from the secondary enhanced green fluorescent protein (EGFP) + MCF7/HRE-EGFP xenografts. a Generation of secondary MCF7/HRE-EGFP xenografts by re-implantation of sorted EGFP + and EGFP - cells isolated from the primary MCF7/HRE-EGFP xenografts. Tumor cells freshly isolated from the secondary xenografts were sorted into EGFP + and EGFP - populations for ( b ) fluorescence-activated cell sorting (FACS) analysis of the CD44 + /CD24 + and CD44 + populations ( n = 5 for EGFP + cells, n = 4 for EGFP - cells; *** p < 0.001, Student's t test). c Side population (SP) of the secondary xenograft-derived tumor cells. MCF7 tumor cells were isolated from the secondary xenografts derived from EGFP + and EGFP - tumor cells, respectively, and expanded in vitro for three passages. Cells were stained with Hoechst 33342 for side population analysis by FACS. Verapamil (50 muM) was used to block nuclear export of Hoechst 33342. These results were validated in two independent experiments. d Clonogenic potential of the freshly sorted EGFP + and EGFP - populations from the secondary xenografts ( n = 6; **** p < 0.0001, *** p < 0.001, Student's t test)
- Conjugate
- Near infrared dye

- Submitted by
- Invitrogen Antibodies (provider)
- Main image

- Experimental details
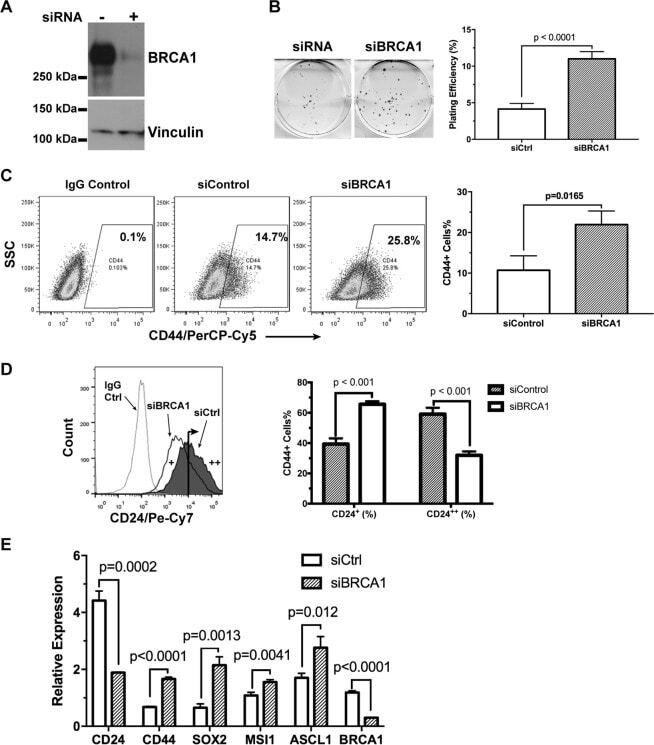
- Figure 4 Down-regulation of BRCA1 promotes cancer cell stemness in neuroblastoma cells. BRCA1 was down-regulated by RNA inference in the SK-N-BE(2)C human neuroblastoma cells (Western blot shown in A ). Effects of BRCA1 on neuroblastoma cell clonogenicity was measured by the clonogenic assay ( B , n = 6). The cell surface levels of CD44 ( C ) and CD24 ( D ) in BE(2)C +- siBRCA1 cells were analyzed by flow cytometry (n = 3). Expression of neuroendocrine cancer stem cell-associated genes in BE(2)C +- siBRCA1 cells were measured by qRT-PCR ( E , n = 3).
- Conjugate
- Near infrared dye
- Submitted by
- Invitrogen Antibodies (provider)
- Main image

- Experimental details
- Fig. 4 IGF2BP2-mediated upregulation of DANCR promotes cell proliferation and stemness-like properties. a IGF2BP2 siRNA down regulates DANCR expression in BXPC-3 cells, as determined by qRT-PCR, whereas ectopic expression of IGF2BP2 increases DANCR level ( b ). c Like IGF2BP2 siRNA, IGF2BP2 KO also suppresses DANCR expression in BXPC-3 cells. d DANCR promotes cell proliferation in BXPC-3 and SW1990 cells, as determined by CCK8 assays. e DANCR also promotes colony formation. f Ectopic expression of DANCR increases sphere formation in number and size. g DANCR-overexpression promotes expression of stemness-related genes (OCT4, NANOG, BMI 1, CD24, and CD133) in pancreatic cancer cells, as determined by qRT-PCR and at the protein level ( h ). i Percentage of CD24 + and CD133 + population in DANCR overexpression and control (NC) cells, as determined by flow cytometry. The statistical results of flow cytometry were showed on the right. Values in a , b , c , d , e , g , i are mean +- SEM. * P < 0.05; ** P < 0.01; *** P < 0.001.
- Conjugate
- Near infrared dye

- Submitted by
- Invitrogen Antibodies (provider)
- Main image

- Experimental details
- Fig. 5 DANCR KO suppresses cell proliferation and stemness-like properties of pancreatic cancer cells. a DANCR KO suppresses cell proliferation in BXPC-3 and SW1990 cells, as determined by CCK8 assays. b DANCR KO suppresses colony formation. c DANCR KO inhibits sphere formation in number and size. d DANCR KO suppresses stemness-related genes in pancreatic cancer cells, as determined by qRT-PCR and at the protein level e . f Percentage of CD24 + and CD133 + population in DANCR KO and control (NC) cells, as determined by flow cytometry. The statistical results of flow cytometry were showed on the right. Values in a , b , d , e , f are mean +- SEM. * P < 0.05; ** P < 0.01; *** P < 0.001.
- Conjugate
- Near infrared dye

- Submitted by
- Invitrogen Antibodies (provider)
- Main image

- Experimental details
- Figure 2 FACS analysis of single putative stem cell surface markers in HFK cells. (a) Representative flow-cytometry histograms of surface marker molecules (green) EpCAM, NCAM1, FZD7, NTRK2, CD90, CD34, CD24, CD133, and their respective isotype controls (red) in HFK (19 weeks of gestation). (b) Summarizing bar graph of single marker staining in HFK (15-19 weeks of gestation). Each marker was tested on at least 3 independent samples. Data were calculated as average % of expressing cell+-SD. Each marker was tested in 10 HFK.
- Conjugate
- Near infrared dye

- Submitted by
- Invitrogen Antibodies (provider)
- Main image

- Experimental details
- Figure 2 Six1 overexpression leads to an increase in TICs . ( A ) Six1 differentially regulates genes in the TIC signature. Microarray analysis was performed on MCF7-Six1 and Ctrl cells [ 17 ]. Expression data were filtered for probesets included in the CSC gene list from Shipitsin et al. [ 24 ] that had a ''present'' call in at least 50% of the microarrays. Genes were clustered using hierarchical clustering. The color scale represents the expression level of a gene above (red), below (green), and at (black) the mean expression level of that gene across all samples. ( B ) Graph of the percent CD24 low CD44 + cells found in MCF7-Six1 and MCF7-Ctrl cells. The graph represents an average of at least three independent experiments with three individual clones. Error bars represent mean +/- SEM. P values represent statistical analysis using a two-tailed t test. ( C ) Tumorsphere assays demonstrate that Six1 overexpression increases functional TICs. Secondary tumorsphere assays performed by plating cells from the primary tumorsphere in ultra low attachment plates and culturing for ten days. The graph represents three individual clones. Error bars represent mean value +/- SEM. P values represent statistical analysis using a two-tailed t test. The experiments were performed at least three times. ( D ) Six1 overexpression in MCF7 cells promotes tumor initiation in NOD/SCID mice. A total of 10 5 to 10 3 MCF7-Ctrl or MCF7-Six1 cells were injected into the #4 mammary fat pad of six-week o
- Conjugate
- Near infrared dye

- Submitted by
- Invitrogen Antibodies (provider)
- Main image

- Experimental details
- Figure 4 Inhibition of MEK1/2 signaling attenuates Six1-induced increases in TICs . ( A ) Inhibition of MEK1/2 with U0126 reduces the CD24 low CD44 + TIC population. Cells were treated with10 muM U0126 for ten days. The graph represents an average of at least three experiments with three clones. Error bars represent mean + /- SEM. P values calculated using a two-tailed t test. ( B ) Inhibition of MEK1/2 with U0126 reduces secondary tumorsphere formation in MCF7-Six1 cells. Representative secondary tumorsphere assays at d10. The cells were treated with 10 muM U0126 throughout the assay. Experiments were performed at least three times. Error bars represent mean +/ - SEM. P values calculated using a two-tailed t test. ( C ) Inhibition of MEK1/2 reverses beta-catenin dependent transcription, as measured using a beta-catenin responsive promoter (Top-flash) after normalization to renilla luciferase. Experiments were performed at least three times. Error bars represent mean +/ - SEM. P values calculated using a two-tailed t test. ( D ) Inhibition of MEK1/2 by AZD6244 decreases tumor formation efficiency in NOD/SCID mice. A total of 10 4 MCF7-Six1 or MCF7-Ctrl cells (three clones each) were injected underneath the nipple of the fourth mammary gland of six-week old female NOD/SCID mice. One week post injection, the mice were treated with AZD6244 by oral gavage twice per day for three days and once/day for the following three days (vehicle, 25 mg/kg or 50 mg/kg) and were monitored week
- Conjugate
- Near infrared dye

- Submitted by
- Invitrogen Antibodies (provider)
- Main image

- Experimental details
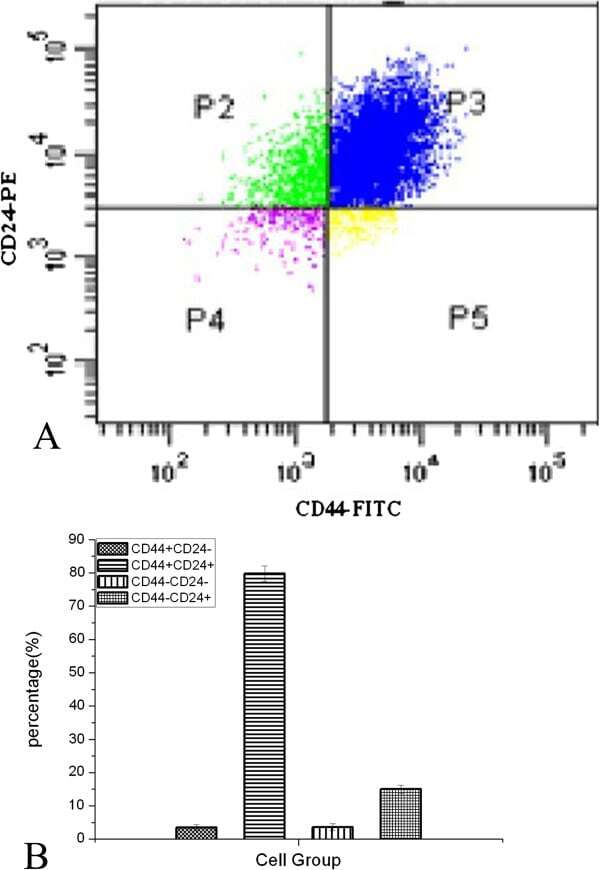
- Figure 1 Flow cytometry sorting of MCF7 cells using CD44 and CD24 markers. A , MCF7 cells were analyzed by fluorescence-activated cell sorting (FACS) using anti-CD44 and anti-CD24 antibodies. B , Quantification of the four subsets of MCF7 cells. C , Confirmation of the purity of the CD44 + /CD24 -/low cell type using flow cytometry.
- Conjugate
- Near infrared dye
- Submitted by
- Invitrogen Antibodies (provider)
- Main image

- Experimental details
- Effect of naringin on TNF- alpha -induced human NP cells. (a) Chemical structure of naringin. (b) Identification of human NP cell marker CD24 by flow cytometry. (c) CCK-8 results of human NP cells treated with different concentrations of naringin contain 0.1% DMSO for 24 h. (d) CCK-8 results of naringin pretreated human NP cells induced by TNF- alpha for 24 h. The data represent the means +- SD. Significant differences between groups are indicated as * p < 0.05, ** p < 0.01, and *** p < 0.001, n = 3.
- Conjugate
- Near infrared dye

- Submitted by
- Invitrogen Antibodies (provider)
- Main image

- Experimental details
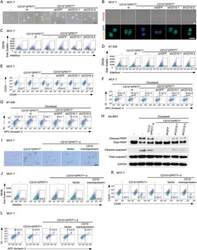
- Fig. 4 B3GNT5 promoted mammosphere formation and enhances CSC population. A , B Mammosphere formation of BT549 and MDA-MB231 cells with or without B3GNT5 knockout as well as stably B3GNT5-expressing KO cells ( A ), and representative images are shown ( B ). Scale bars, 50 mum. ( C ) Populations of CSCs (CD44 high /CD24 low ) were measured by flow cytometry in MDA-MB231 and BT549 cells with or without B3GNT5 knockout as well as stably B3GNT5-expressing KO cells. D Expression of B3GNT5 was analyzed by Western blotting in MCF7 cells with stable empty vector or B3GNT5 expression. E , F Mammosphere formation ( E ) and population of CSCs (CD44 high /CD24 low ) ( F ) were examined in MCF7 cells with stable empty vector or B3GNT5-WT-Flag cDNA. G Sequential mammosphere formation were measured in MDA-MB231 and BT549 cells with or without B3GNT5 knockout as well as stably B3GNT5-expressing KO cells. P1, P2 and P3 indicated primary, secondary and tertiary passage of mammosphere, respectively. H Limiting dilution sphere forming assay was performed by fluorescence-activated cell sorting in MDA-MB231 KO and BT549 KO cells with B3GNT5-WT-mcherry overexpression. Cells with high (mcherry high ) and low (mcherry low ) B3GNT5 expression were sorted separately. Data are presented as the percentage of wild-type or vector cell lines. * p < 0.05 by Student's t test. Data are shown as mean +- SD based on three independent experiments
- Conjugate
- Near infrared dye

- Submitted by
- Invitrogen Antibodies (provider)
- Main image

- Experimental details
- Figure 3 Stable knockdown of TFAP2C induced EMT MCF-7 cell clone 45 derived by stable expression of shRNA targeting TFAP2C (sKD-C) compared to cell clone derived with non-targeting shRNA (sKD-NT). The clone used for all data in this figure was sKD-C-clone 45. A. Expression pattern of TFAP2A and TFAP2C by RT-PCR in stable cell clones. B. Cell morphology with using the brightfield microscopy 400x magnification. C. Section of expression array comparing sKD-NT vs. sKD-C cells demonstrates down-regulation of Luminal Differentiation Markers and up-regulation of Mesenchymal Markers. D. Western blot showing protein expression of AP-2 proteins and examples of luminal differentiation and mesenchymal markers. E. Relative expression of CD44 gene by RT-PCR for TFAP2C shows increased CD44 RNA in sKD-C cells, confirming array in A and protein in D. F . Distribution of CD44/CD24 subpopulations in stable cell clones of MCF7 by flow cytometry demonstrate an increase in the CD44 +/hi /CD24 -/low population.
- Conjugate
- Near infrared dye

- Submitted by
- Invitrogen Antibodies (provider)
- Main image
- Experimental details
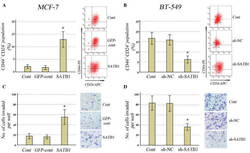
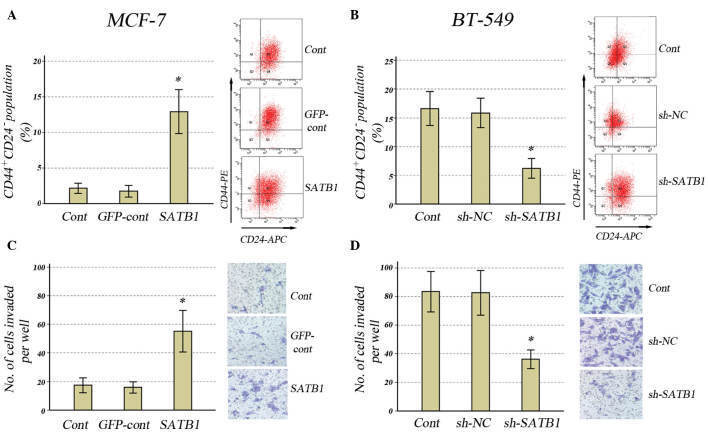
- Figure 2 Effects of SATB1 expression on the CD44 + /CD24 - population and invasive properties of human breast cancer cell lines. Populations of CD44 + /CD24 - in (A) MCF-7 cells with SATB1 overexpression and (B) BT-549 cells with SATB1 knockdown, with representative images from the CD44/CD24 flow cytometric analysis. Invasiveness in (C) MCF-7 cells with SATB1 overexpression and (D) BT-549 cells with SATB1 knockdown, and representative images taken from the invasion assays (magnification, x20). All data are presented as the mean +- standard deviation of two independent experiments in triplicate; * P
- Conjugate
- Near infrared dye
- Submitted by
- Invitrogen Antibodies (provider)
- Main image
- Experimental details
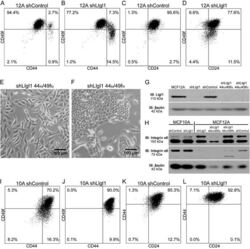
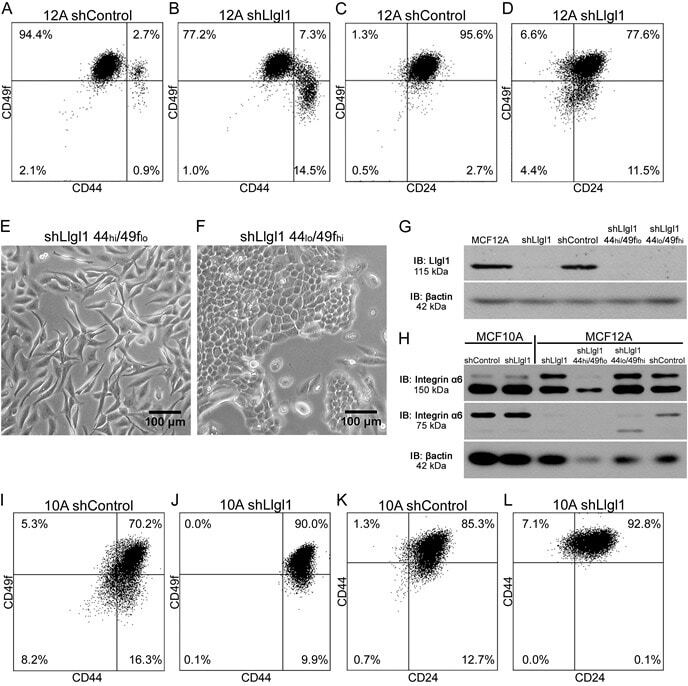
- Figure 2 Llgl1 regulates expression of cell lineage markers A. - D. , I. - L. Cells were incubated with the indicated cell lineage marker and sorted by FACS. A. - D. MCF12A shControl vs shLlgl1 (under normal growth conditions) were incubated with anti-CD49f-PE, anti-CD44-APC, and/or anti-CD24-FITC. E. and F. MCF12A shLlgl1 were sorted based on CD44/CD49f expression, CD444 hi /CD49f lo (E) and CD44 lo /CD49f hi (F). G. Protein lysates were isolated and analyzed by immunoblot using anti-Llgl1 and anti-betaactin antibodies. H. Protein lysates were analyzed by immunoblot using anti-Integrin alpha6 and anti-betaactin. (I-L) MCF10A shControl vs shLlgl1 (under normal growth conditions) were incubated with anti-CD49f-PE, anti-CD44-APC, and/or anti-CD24-FITC.
- Conjugate
- Near infrared dye
- Submitted by
- Invitrogen Antibodies (provider)
- Main image
- Experimental details
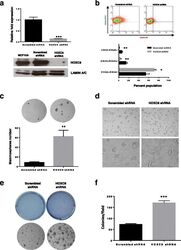
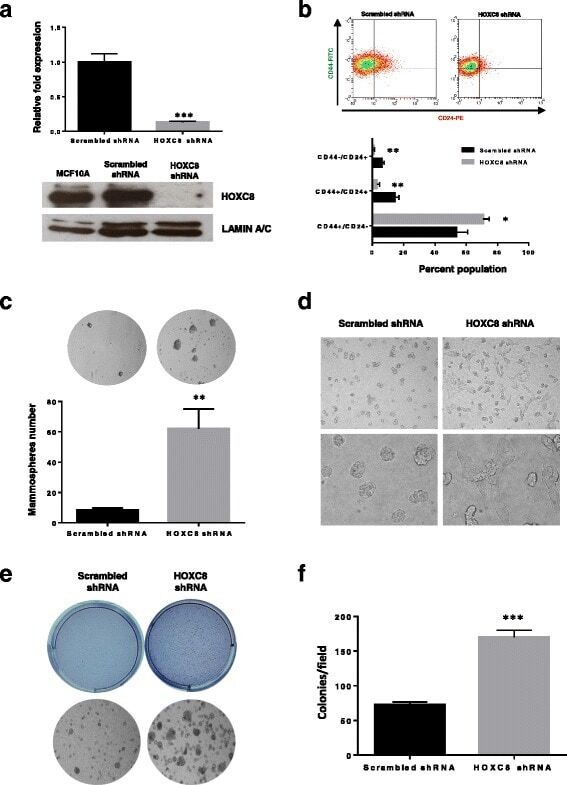
- Fig. 7 HOXC8 knockdown increase CSC proliferation and transformed phenotype. a Knockdown of HOXC8 was induced by lentiviral transduction of MCF10A cells with pLKO-Tet-HOXC8 vector and gene expression measured by TaqMan(r) qRT-PCR. Results are presented as relative fold expression relative to RPLP0 and pLKO-Tet-Scrambled vector used as calibrator ( n = 3). Results were analysed by Unpaired Student''s t -test ( n = 3). *** P < 0.001. Bottom panel shows western blotting of nuclear lysates from cells transduced with pLKO-Tet-HOXC8 vector or pLKO-Tet-Scrambled vector was conducted to detect the expression of HOXC8 (34 kDa) and LAMIN A/C (41-50 kDa) as loading control. b Percentage of CD44 + /CD24 low/- , CD44 + /CD24 + , CD44 - /CD24 + cells after HOXC8 knockdown as measured by FACS analysis. Results were analysed by comparing cell populations levels in HOXC8 shRNA transduced cells compared to Scrambled shRNA ( n = 3). Statistical analysis was performed by Unpaired Student''s t -test. * P < 0.05, ** P < 0.01. Representative FACS profiles of cells double stained with CD44-FITC and CD244-PE to analyse the CSC and non-CSC populations are also shown. c Mammospheres morphology and number obtained by self-renewal of cell after HOXC8 knockdown compared to scrambled control vector after 3 generations. Mammospheres numbers were compared by Unpaired Student''s t -test ( n = 3). ** P < 0.01. Only spheres >= 100 muM were counted, images were taken at 10X magnification. d Colonies of HOXC8 shR
- Conjugate
- Near infrared dye
- Submitted by
- Invitrogen Antibodies (provider)
- Main image
- Experimental details
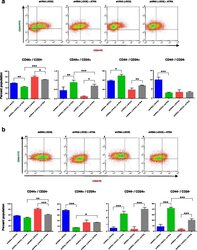
- Fig. 8 HOXC8 downregulation prevents differentiation of MCF10A cells induced by retinoic acid. a Representative FACS profiles and percentage of CD44 + /CD24 low/- , CD44 + /CD24 + , CD44 - /CD24 + cells after retinoic acid (ATRA) treatment for 4 days and HOXC8 knockdown induced by doxycyclin ( n = 3). Statistical analysis was performed by One-way ANOVA followed by Bonferroni''s multiple comparisons test. * P < 0.05, ** P < 0.01, *** P < 0.001. b Representative FACS profiles and percentage of CD44 + /CD24 low/- , CD44 + /CD24 + , CD44 - /CD24 + cells after retinoic acid (ATRA) treatment for 7 days and HOXC8 knockdown induced by doxycyclin ( n = 3). Statistical analysis was performed by One-way ANOVA followed by Bonferroni''s multiple comparisons test. * P < 0.05, ** P < 0.01, *** P < 0.001
- Conjugate
- Near infrared dye

- Submitted by
- Invitrogen Antibodies (provider)
- Main image
- Experimental details
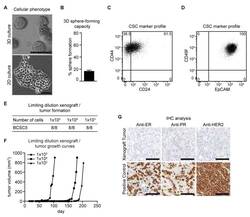
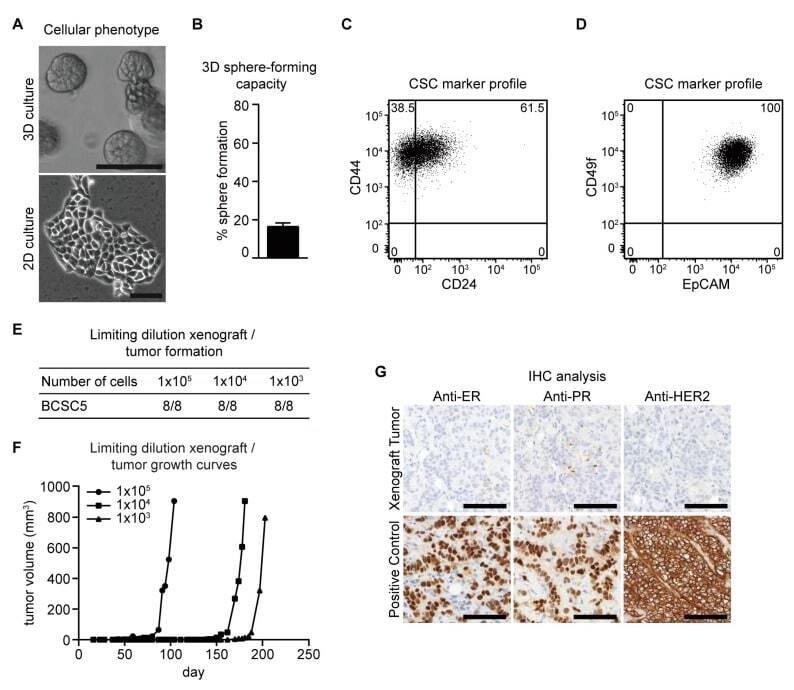
- Figure 1 Characterization of BCSC5 in vitro and in vivo. ( A ) Representative pictures of BCSC5 cultured in 3D and 2D conditions, scale bar 100 mum. ( B ) Sphere-forming capacity of BCSC5 cells in an anchorage-independent growth assay ( n = 3). Data represent means + SEM. ( C , D ) Expression patterns of CD24 and CD44 ( C ) as well as EpCAM and CD49f ( D ) in BCSC5 cells analyzed by flow cytometry. ( E ) Tumor formation in limiting dilution xenografts of BCSC5. ( F ) Representative growth curves for limiting dilution assay of BCSC5 xenografts in immunocompromised NOD/SCID mice. ( G ) Immunohistochemical (IHC) analysis of ER, PR, and HER2 on sections of the BCSC5 xenograft tumors, scale bar 100 mum.
- Conjugate
- Near infrared dye
- Submitted by
- Invitrogen Antibodies (provider)
- Main image
- Experimental details
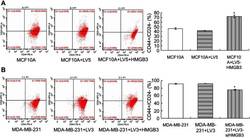
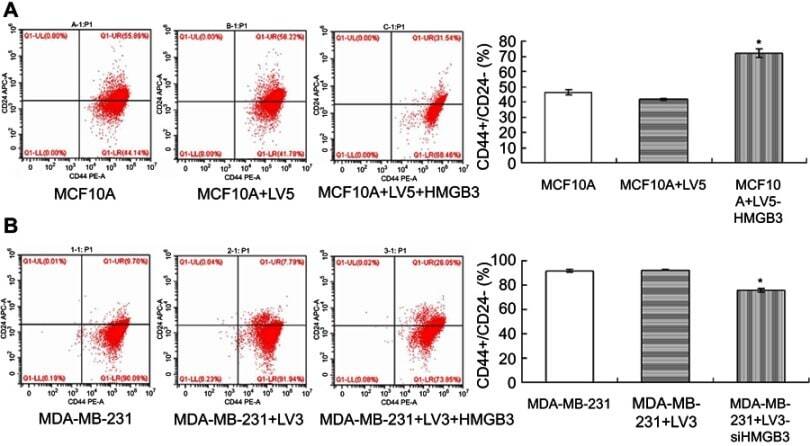
- Figure 5 CD44 + /CD24 - levels detection in MCF10A and MDA-MB-231 cells with flow cytometry assay. ( A ). CD44 + /CD24 - evaluation in HMGB3-treated MCF10A cells. ( B ). CD44 + /CD24 - evaluation in siHMGB3-treated MDA-MB-231 cells. * p
- Conjugate
- Near infrared dye
- Submitted by
- Invitrogen Antibodies (provider)
- Main image
- Experimental details
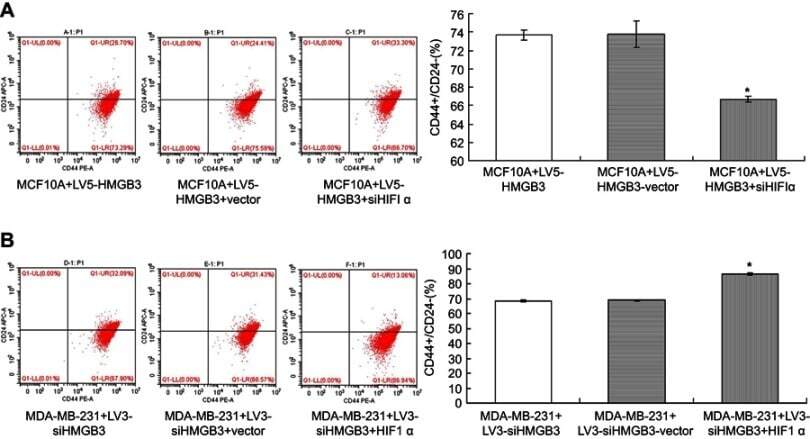
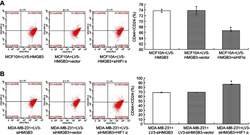
- Figure 10 Determination for CD44 + /CD24 - levels in HMGB3/siHIF1alpha-treated MCF10A cells and siHMGB3/HIF1alpha-treated MDA-MB-231 cells using flow cytometry assay. ( A ). CD44 + /CD24 - evaluation in HMGB3/siHIF1alpha-treated MCF10A cells. ( B ). CD44 + /CD24 - evaluation in siHMGB3/HIF1alpha-treated MDA-MB-231 cells. * p
- Conjugate
- Near infrared dye