Explore
 Validate
 Learn
Learn Flow cytometry
Antibody data
- Antibody Data
- Antigen structure
- References [77]
- Comments [0]
- Validations
- Flow cytometry [1]
- Other assay [31]
Submit
Validation data
Reference
Comment
Report error
- Product number
- 12-5698-82 - Provider product page

- Provider
- Invitrogen Antibodies
- Product name
- Ki-67 Monoclonal Antibody (SolA15), PE, eBioscience™
- Antibody type
- Monoclonal
- Antigen
- Other
- Description
- Description: The monoclonal antibody SolA15 recognizes mouse and rat Ki-67, a 300 kDa nuclear protein. Ki-67 is present during all active phases of the cell cycle (G1, S, G2, and mitosis), but is absent from resting cells (G0). Ki-67 is detected within the nucleus during interphase but redistributes to the chromosomes during mitosis. Ki-67 is used as a marker for determining the growth fraction of a given population of cells. In studies of tumor cells, the "Ki-67 labeling index" refers to the number of Ki-67 positive cells within the population and this is used to predict outcome of particular cancer types. Ki-67 has been shown to interact with the DNA-bound protein chromobox protein homolog 3 (CBX3) (heterochromatin). The SolA15 antibody also recognizes human, non-human primate and canine Ki-67. Applications Reported: This SolA15 antibody has been reported for use in flow cytometric analysis, and intracellular staining followed by flow cytometric analysis. Applications Tested: This SolA15 antibody has been tested by intracelllar staining and flow cytometric analysis of stimulated mouse splenocytes using the Foxp3/Transcription Factor Buffer Set (Product # 00-5523-00) and protocol. Please see Best Protocols Section (Staining intracellular Antigens for Flow Cytometry) for staining protocol (refer to Protocol B: One-step protocol for intracellular (nuclear) proteins). This can be used at less than or equal to 0.06 µg per test. A test is defined as the amount (µg) of antibody that will stain a cell sample in a final volume of 100 µL. Cell number should be determined empirically but can range from 10^5 to 10^8 cells/test. It is recommended that the antibody be carefully titrated for optimal performance in the assay of interest. Excitation: 488-561 nm; Emission: 578 nm; Laser: Blue Laser, Green Laser, Yellow-Green Laser. Filtration: 0.2 µm post-manufacturing filtered.
- Reactivity
- Human, Mouse, Rat, Canine
- Host
- Rat
- Conjugate
- Yellow dye
- Isotype
- IgG
- Antibody clone number
- SolA15
- Vial size
- 100 µg
- Concentration
- 0.2 mg/mL
- Storage
- 4° C, store in dark, DO NOT FREEZE!
Submitted references Egr2 and 3 maintain anti-tumour responses of exhausted tumour infiltrating CD8 + T cells.
TCR repertoire landscape reveals macrophage-mediated clone deletion in endotoxin tolerance.
A novel role of Fas in delaying cellular senescence.
Mass-produced gram-negative bacterial outer membrane vesicles activate cancer antigen-specific stem-like CD8(+) T cells which enables an effective combination immunotherapy with anti-PD-1.
Group 3 innate lymphocytes make a distinct contribution to type 17 immunity in bladder defence.
JAK1 signaling in dendritic cells promotes peripheral tolerance in autoimmunity through PD-L1-mediated regulatory T cell induction.
Protein phosphatase 2A catalytic subunit β suppresses PMA/ionomycin-induced T-cell activation by negatively regulating PI3K/Akt signaling.
A defined subset of clonal retinal stem cell spheres is biased to RPE differentiation.
Hydrogels Containing Gradients in Vascular Density Reveal Dose-Dependent Role of Angiocrine Cues on Stem Cell Behavior.
Novel cytokine-antibody fusion protein, N-820, to enhance the functions of ex vivo expanded natural killer cells against Burkitt lymphoma.
Connecting secretome to hematopoietic stem cell phenotype shifts in an engineered bone marrow niche.
Transcriptome dynamics of CD4(+) T cells during malaria maps gradual transit from effector to memory.
Regulatory T Cell-Derived TGF-β1 Controls Multiple Checkpoints Governing Allergy and Autoimmunity.
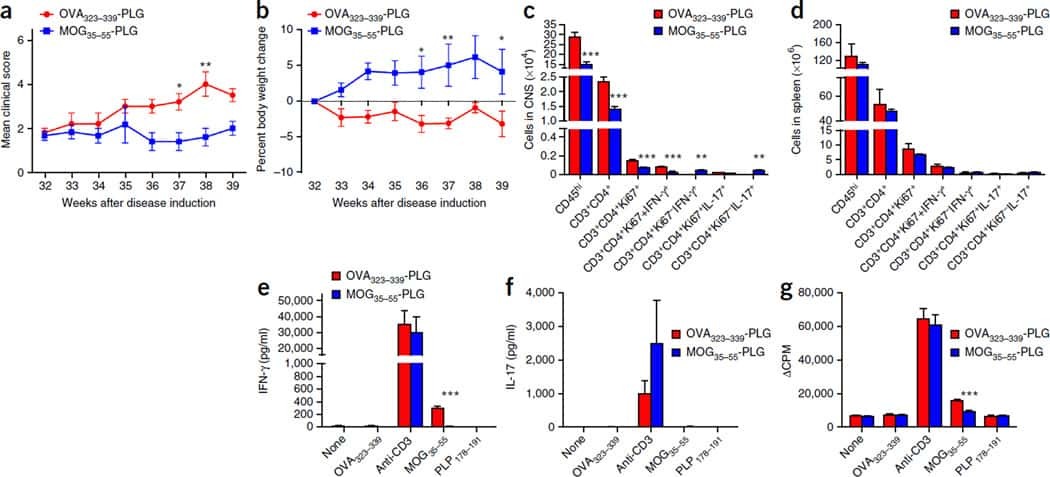
MOSPD2 is a therapeutic target for the treatment of CNS inflammation.
Macrophage NCOR1 Deficiency Ameliorates Myocardial Infarction and Neointimal Hyperplasia in Mice.
Insulin-Like Growth Factors Are Key Regulators of T Helper 17 Regulatory T Cell Balance in Autoimmunity.
Heterogeneity of human bone marrow and blood natural killer cells defined by single-cell transcriptome.
Tissue-Resident Macrophages Promote Renal Cystic Disease.
Single-cell analysis reveals T cell infiltration in old neurogenic niches.
ATP released by intestinal bacteria limits the generation of protective IgA against enteropathogens.
PRMT5 Modulates Splicing for Genome Integrity and Preserves Proteostasis of Hematopoietic Stem Cells.
PTCy ameliorates GVHD by restoring regulatory and effector T-cell homeostasis in recipients with PD-1 blockade.
Modulation of autoimmune pathogenesis by T cell-triggered inflammatory cell death.
Harnessing Hematopoietic Stem Cell Low Intracellular Calcium Improves Their Maintenance In Vitro.
Vasculature-associated fat macrophages readily adapt to inflammatory and metabolic challenges.
Multipotent Adult Progenitor Cells Suppress T Cell Activation in In Vivo Models of Homeostatic Proliferation in a Prostaglandin E2-Dependent Manner.
ATF3 Sustains IL-22-Induced STAT3 Phosphorylation to Maintain Mucosal Immunity Through Inhibiting Phosphatases.
Pax6 Lengthens G1 Phase and Decreases Oscillating Cdk6 Levels in Murine Embryonic Cortical Progenitors.
Lymphotoxin α fine-tunes T cell clonal deletion by regulating thymic entry of antigen-presenting cells.
CD150(high) Bone Marrow Tregs Maintain Hematopoietic Stem Cell Quiescence and Immune Privilege via Adenosine.
Adrenergic nerve degeneration in bone marrow drives aging of the hematopoietic stem cell niche.
Stem cell factor is selectively secreted by arterial endothelial cells in bone marrow.
The organic ester O,O'-diethyl-(S,S)-ethylenediamine-N,N'-di-2-(3-cyclohexyl)propanoate dihydrochloride attenuates murine breast cancer growth and metastasis.
Modulation of Myelopoiesis Progenitors Is an Integral Component of Trained Immunity.
MicroRNA-126 deficiency enhanced the activation and function of CD4(+) T cells by elevating IRS-1 pathway.
Quiescent Tissue Stem Cells Evade Immune Surveillance.
Fc Effector Function Contributes to the Activity of Human Anti-CTLA-4 Antibodies.
1810011o10 Rik Inhibits the Antitumor Effect of Intratumoral CD8(+) T Cells through Suppression of Notch2 Pathway in a Murine Hepatocellular Carcinoma Model.
CCR2(-) and CCR2(+) corneal macrophages exhibit distinct characteristics and balance inflammatory responses after epithelial abrasion.
A somatic mutation in erythro-myeloid progenitors causes neurodegenerative disease.
Neonatal pancreatic pericytes support β-cell proliferation.
Store-Operated Ca(2+) Entry Controls Clonal Expansion of T Cells through Metabolic Reprogramming.
Differential cytokine contributions of perivascular haematopoietic stem cell niches.
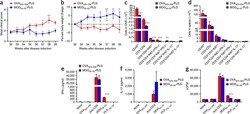
Egr2 and 3 control adaptive immune responses by temporally uncoupling expansion from T cell differentiation.
A tightly regulated IL-22 response maintains immune functions and homeostasis in systemic viral infection.
Dicer Deficiency Differentially Impacts Microglia of the Developing and Adult Brain.
Modulation of let-7 miRNAs controls the differentiation of effector CD8 T cells.
Roquin Suppresses the PI3K-mTOR Signaling Pathway to Inhibit T Helper Cell Differentiation and Conversion of Treg to Tfr Cells.
Renal Sodium Gradient Orchestrates a Dynamic Antibacterial Defense Zone.
Mutations in 5-methylcytosine oxidase TET2 and RhoA cooperatively disrupt T cell homeostasis.
Myeloid progenitor cluster formation drives emergency and leukaemic myelopoiesis.
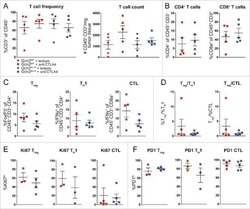
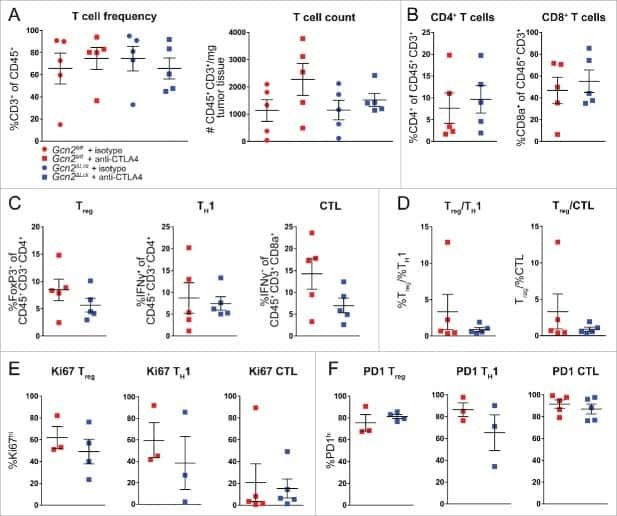
The stress kinase GCN2 does not mediate suppression of antitumor T cell responses by tryptophan catabolism in experimental melanomas.
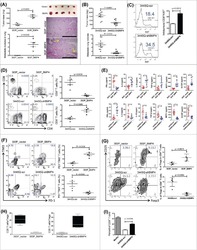
Growth and metastasis of lung adenocarcinoma is potentiated by BMP4-mediated immunosuppression.
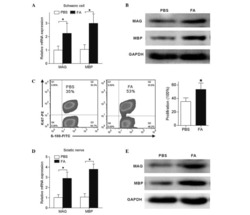
Schwann cell proliferation and differentiation that is induced by ferulic acid through MEK1/ERK1/2 signalling promotes peripheral nerve remyelination following crush injury in rats.
Host-Protozoan Interactions Protect from Mucosal Infections through Activation of the Inflammasome.
Hematopoietic Stem Cells Count and Remember Self-Renewal Divisions.
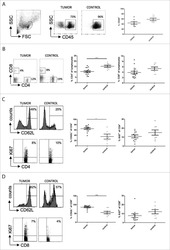
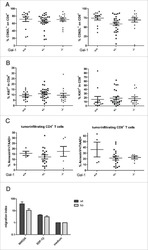
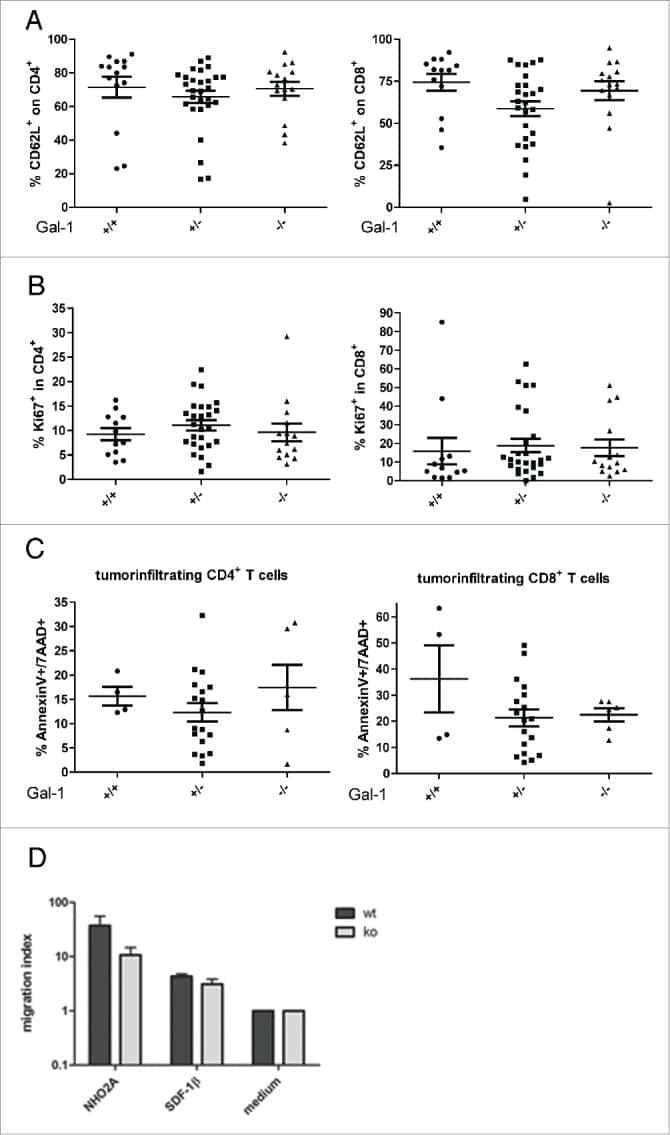
Immune response modulation by Galectin-1 in a transgenic model of neuroblastoma.
The cell proliferation antigen Ki-67 organises heterochromatin.
Interaction of natural killer cells with neutrophils exerts a significant antitumor immunity in hematopoietic stem cell transplantation recipients.
Oligodendrocyte death results in immune-mediated CNS demyelination.
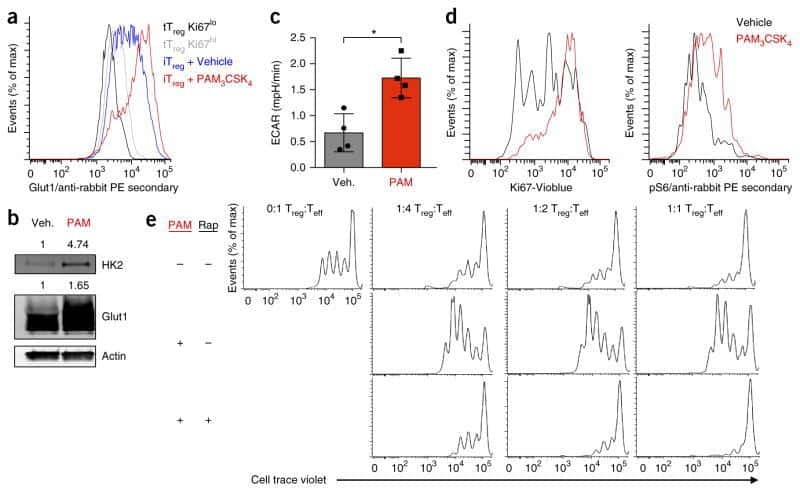
Foxp3 and Toll-like receptor signaling balance T(reg) cell anabolic metabolism for suppression.
Suppression of ischemia in arterial occlusive disease by JNK-promoted native collateral artery development.
Programmed death 1 regulates memory phenotype CD4 T cell accumulation, inhibits expansion of the effector memory phenotype subset and modulates production of effector cytokines.
Mammary Stem Cells and Tumor-Initiating Cells Are More Resistant to Apoptosis and Exhibit Increased DNA Repair Activity in Response to DNA Damage.
Inflammation rapidly reorganizes mouse bone marrow B cells and their environment in conjunction with early IgM responses.
Metastasis is regulated via microRNA-200/ZEB1 axis control of tumour cell PD-L1 expression and intratumoral immunosuppression.
Hematopoietic not systemic impairment of Roquin expression accounts for intestinal inflammation in Roquin-deficient mice.
The miR-126-VEGFR2 axis controls the innate response to pathogen-associated nucleic acids.
Suppression of Tregs by anti-glucocorticoid induced TNF receptor antibody enhances the antitumor immunity of interferon-α gene therapy for pancreatic cancer.
Inflammatory signaling regulates embryonic hematopoietic stem and progenitor cell production.
Myeloid cells expressing VEGF and arginase-1 following uptake of damaged retinal pigment epithelium suggests potential mechanism that drives the onset of choroidal angiogenesis in mice.
Small intestine inflammation in Roquin-mutant and Roquin-deficient mice.
Beneficial role of rapamycin in experimental autoimmune myositis.
Arteriolar niches maintain haematopoietic stem cell quiescence.
IL-1R signaling in dendritic cells replaces pattern-recognition receptors in promoting CD8⁺ T cell responses to influenza A virus.
Primate B-1 cells generate antigen-specific B cell responses to T cell-independent type 2 antigens.
Anti-Gr-1 antibody depletion fails to eliminate hepatic myeloid-derived suppressor cells in tumor-bearing mice.
Symonds ALJ, Miao T, Busharat Z, Li S, Wang P
Cancer immunology, immunotherapy : CII 2023 May;72(5):1139-1151
Cancer immunology, immunotherapy : CII 2023 May;72(5):1139-1151
TCR repertoire landscape reveals macrophage-mediated clone deletion in endotoxin tolerance.
Zhao J, Jia L, Tao Y, Zhao X, Yang J, Lu Y, Yan Y, Mao L, Hu L, Lu J, Guo M, Chen C, Zhou Y, Wen Z, He Z, Xu L
Inflammation research : official journal of the European Histamine Research Society ... [et al.] 2023 Mar;72(3):531-540
Inflammation research : official journal of the European Histamine Research Society ... [et al.] 2023 Mar;72(3):531-540
A novel role of Fas in delaying cellular senescence.
Saha C, Li J, Sun X, Liu X, Huang G
Heliyon 2023 Feb;9(2):e13451
Heliyon 2023 Feb;9(2):e13451
Mass-produced gram-negative bacterial outer membrane vesicles activate cancer antigen-specific stem-like CD8(+) T cells which enables an effective combination immunotherapy with anti-PD-1.
Won S, Lee C, Bae S, Lee J, Choi D, Kim MG, Song S, Lee J, Kim E, Shin H, Basukala A, Lee TR, Lee DS, Gho YS
Journal of extracellular vesicles 2023 Aug;12(8):e12357
Journal of extracellular vesicles 2023 Aug;12(8):e12357
Group 3 innate lymphocytes make a distinct contribution to type 17 immunity in bladder defence.
Riding AM, Loudon KW, Guo A, Ferdinand JR, Lok LSC, Richoz N, Stewart A, Castro-Dopico T, Tuong ZK, Fiancette R, Bowyer GS, Fleming A, Gillman ES, Suchanek O, Mahbubani KT, Saeb-Parsy K, Withers D, Dougan G, Clare S, Clatworthy MR
iScience 2022 Jul 15;25(7):104660
iScience 2022 Jul 15;25(7):104660
JAK1 signaling in dendritic cells promotes peripheral tolerance in autoimmunity through PD-L1-mediated regulatory T cell induction.
Vogel A, Martin K, Soukup K, Halfmann A, Kerndl M, Brunner JS, Hofmann M, Oberbichler L, Korosec A, Kuttke M, Datler H, Kieler M, Musiejovsky L, Dohnal A, Sharif O, Schabbauer G
Cell reports 2022 Feb 22;38(8):110420
Cell reports 2022 Feb 22;38(8):110420
Protein phosphatase 2A catalytic subunit β suppresses PMA/ionomycin-induced T-cell activation by negatively regulating PI3K/Akt signaling.
Gao R, Li X, Gao H, Zhao K, Liu X, Liu J, Wang Q, Zhu Y, Chen H, Xiang S, Zhan Y, Yin R, Yu M, Ning H, Yang X, Li C
The FEBS journal 2022 Aug;289(15):4518-4535
The FEBS journal 2022 Aug;289(15):4518-4535
A defined subset of clonal retinal stem cell spheres is biased to RPE differentiation.
Baakdhah TW, Coles B, van der Kooy D
iScience 2021 Jun 25;24(6):102574
iScience 2021 Jun 25;24(6):102574
Hydrogels Containing Gradients in Vascular Density Reveal Dose-Dependent Role of Angiocrine Cues on Stem Cell Behavior.
Ngo MT, Barnhouse VR, Gilchrist AE, Mahadik BP, Hunter CJ, Hensold JN, Petrikas N, Harley BAC
Advanced functional materials 2021 Dec 16;31(51)
Advanced functional materials 2021 Dec 16;31(51)
Novel cytokine-antibody fusion protein, N-820, to enhance the functions of ex vivo expanded natural killer cells against Burkitt lymphoma.
Chu Y, Nayyar G, Kham Su N, Rosenblum JM, Soon-Shiong P, Lee J, Safrit JT, Barth M, Lee D, Cairo MS
Journal for immunotherapy of cancer 2020 Oct;8(2)
Journal for immunotherapy of cancer 2020 Oct;8(2)
Connecting secretome to hematopoietic stem cell phenotype shifts in an engineered bone marrow niche.
Gilchrist AE, Harley BAC
Integrative biology : quantitative biosciences from nano to macro 2020 Jul 10;12(7):175-187
Integrative biology : quantitative biosciences from nano to macro 2020 Jul 10;12(7):175-187
Transcriptome dynamics of CD4(+) T cells during malaria maps gradual transit from effector to memory.
Soon MSF, Lee HJ, Engel JA, Straube J, Thomas BS, Pernold CPS, Clarke LS, Laohamonthonkul P, Haldar RN, Williams CG, Lansink LIM, Moreira ML, Bramhall M, Koufariotis LT, Wood S, Chen X, James KR, Lönnberg T, Lane SW, Belz GT, Engwerda CR, Khoury DS, Davenport MP, Svensson V, Teichmann SA, Haque A
Nature immunology 2020 Dec;21(12):1597-1610
Nature immunology 2020 Dec;21(12):1597-1610
Regulatory T Cell-Derived TGF-β1 Controls Multiple Checkpoints Governing Allergy and Autoimmunity.
Turner JA, Stephen-Victor E, Wang S, Rivas MN, Abdel-Gadir A, Harb H, Cui Y, Fanny M, Charbonnier LM, Fong JJH, Benamar M, Wang L, Burton OT, Bansal K, Bry L, Zhu C, Li QZ, Clement RL, Oettgen HC, Crestani E, Rachid R, Sage PT, Chatila TA
Immunity 2020 Dec 15;53(6):1202-1214.e6
Immunity 2020 Dec 15;53(6):1202-1214.e6
MOSPD2 is a therapeutic target for the treatment of CNS inflammation.
Yacov N, Kafri P, Salem Y, Propheta-Meiran O, Feldman B, Breitbart E, Mendel I
Clinical and experimental immunology 2020 Aug;201(2):105-120
Clinical and experimental immunology 2020 Aug;201(2):105-120
Macrophage NCOR1 Deficiency Ameliorates Myocardial Infarction and Neointimal Hyperplasia in Mice.
Du LJ, Sun JY, Zhang WC, Wang YL, Zhu H, Liu T, Gao MZ, Zheng C, Zhang YY, Liu Y, Liu Y, Shao S, Zhang XQ, Leng Q, Auwerx J, Duan SZ
Journal of the American Heart Association 2020 Aug 4;9(15):e015862
Journal of the American Heart Association 2020 Aug 4;9(15):e015862
Insulin-Like Growth Factors Are Key Regulators of T Helper 17 Regulatory T Cell Balance in Autoimmunity.
DiToro D, Harbour SN, Bando JK, Benavides G, Witte S, Laufer VA, Moseley C, Singer JR, Frey B, Turner H, Bruning J, Darley-Usmar V, Gao M, Conover C, Hatton RD, Frank S, Colonna M, Weaver CT
Immunity 2020 Apr 14;52(4):650-667.e10
Immunity 2020 Apr 14;52(4):650-667.e10
Heterogeneity of human bone marrow and blood natural killer cells defined by single-cell transcriptome.
Yang C, Siebert JR, Burns R, Gerbec ZJ, Bonacci B, Rymaszewski A, Rau M, Riese MJ, Rao S, Carlson KS, Routes JM, Verbsky JW, Thakar MS, Malarkannan S
Nature communications 2019 Sep 2;10(1):3931
Nature communications 2019 Sep 2;10(1):3931
Tissue-Resident Macrophages Promote Renal Cystic Disease.
Zimmerman KA, Song CJ, Li Z, Lever JM, Crossman DK, Rains A, Aloria EJ, Gonzalez NM, Bassler JR, Zhou J, Crowley MR, Revell DZ, Yan Z, Shan D, Benveniste EN, George JF, Mrug M, Yoder BK
Journal of the American Society of Nephrology : JASN 2019 Oct;30(10):1841-1856
Journal of the American Society of Nephrology : JASN 2019 Oct;30(10):1841-1856
Single-cell analysis reveals T cell infiltration in old neurogenic niches.
Dulken BW, Buckley MT, Navarro Negredo P, Saligrama N, Cayrol R, Leeman DS, George BM, Boutet SC, Hebestreit K, Pluvinage JV, Wyss-Coray T, Weissman IL, Vogel H, Davis MM, Brunet A
Nature 2019 Jul;571(7764):205-210
Nature 2019 Jul;571(7764):205-210
ATP released by intestinal bacteria limits the generation of protective IgA against enteropathogens.
Proietti M, Perruzza L, Scribano D, Pellegrini G, D'Antuono R, Strati F, Raffaelli M, Gonzalez SF, Thelen M, Hardt WD, Slack E, Nicoletti M, Grassi F
Nature communications 2019 Jan 16;10(1):250
Nature communications 2019 Jan 16;10(1):250
PRMT5 Modulates Splicing for Genome Integrity and Preserves Proteostasis of Hematopoietic Stem Cells.
Tan DQ, Li Y, Yang C, Li J, Tan SH, Chin DWL, Nakamura-Ishizu A, Yang H, Suda T
Cell reports 2019 Feb 26;26(9):2316-2328.e6
Cell reports 2019 Feb 26;26(9):2316-2328.e6
PTCy ameliorates GVHD by restoring regulatory and effector T-cell homeostasis in recipients with PD-1 blockade.
Ikegawa S, Meguri Y, Kondo T, Sugiura H, Sando Y, Nakamura M, Iwamoto M, Maeda Y, Matsuoka KI
Blood advances 2019 Dec 10;3(23):4081-4094
Blood advances 2019 Dec 10;3(23):4081-4094
Modulation of autoimmune pathogenesis by T cell-triggered inflammatory cell death.
Sasaki K, Himeno A, Nakagawa T, Sasaki Y, Kiyonari H, Iwai K
Nature communications 2019 Aug 28;10(1):3878
Nature communications 2019 Aug 28;10(1):3878
Harnessing Hematopoietic Stem Cell Low Intracellular Calcium Improves Their Maintenance In Vitro.
Luchsinger LL, Strikoudis A, Danzl NM, Bush EC, Finlayson MO, Satwani P, Sykes M, Yazawa M, Snoeck HW
Cell stem cell 2019 Aug 1;25(2):225-240.e7
Cell stem cell 2019 Aug 1;25(2):225-240.e7
Vasculature-associated fat macrophages readily adapt to inflammatory and metabolic challenges.
Silva HM, Báfica A, Rodrigues-Luiz GF, Chi J, Santos PDA, Reis BS, Hoytema van Konijnenburg DP, Crane A, Arifa RDN, Martin P, Mendes DAGB, Mansur DS, Torres VJ, Cadwell K, Cohen P, Mucida D, Lafaille JJ
The Journal of experimental medicine 2019 Apr 1;216(4):786-806
The Journal of experimental medicine 2019 Apr 1;216(4):786-806
Multipotent Adult Progenitor Cells Suppress T Cell Activation in In Vivo Models of Homeostatic Proliferation in a Prostaglandin E2-Dependent Manner.
Carty F, Corbett JM, Cunha JPMCM, Reading JL, Tree TIM, Ting AE, Stubblefield SR, English K
Frontiers in immunology 2018;9:645
Frontiers in immunology 2018;9:645
ATF3 Sustains IL-22-Induced STAT3 Phosphorylation to Maintain Mucosal Immunity Through Inhibiting Phosphatases.
Glal D, Sudhakar JN, Lu HH, Liu MC, Chiang HY, Liu YC, Cheng CF, Shui JW
Frontiers in immunology 2018;9:2522
Frontiers in immunology 2018;9:2522
Pax6 Lengthens G1 Phase and Decreases Oscillating Cdk6 Levels in Murine Embryonic Cortical Progenitors.
Mi D, Manuel M, Huang YT, Mason JO, Price DJ
Frontiers in cellular neuroscience 2018;12:419
Frontiers in cellular neuroscience 2018;12:419
Lymphotoxin α fine-tunes T cell clonal deletion by regulating thymic entry of antigen-presenting cells.
Lopes N, Charaix J, Cédile O, Sergé A, Irla M
Nature communications 2018 Mar 28;9(1):1262
Nature communications 2018 Mar 28;9(1):1262
CD150(high) Bone Marrow Tregs Maintain Hematopoietic Stem Cell Quiescence and Immune Privilege via Adenosine.
Hirata Y, Furuhashi K, Ishii H, Li HW, Pinho S, Ding L, Robson SC, Frenette PS, Fujisaki J
Cell stem cell 2018 Mar 1;22(3):445-453.e5
Cell stem cell 2018 Mar 1;22(3):445-453.e5
Adrenergic nerve degeneration in bone marrow drives aging of the hematopoietic stem cell niche.
Maryanovich M, Zahalka AH, Pierce H, Pinho S, Nakahara F, Asada N, Wei Q, Wang X, Ciero P, Xu J, Leftin A, Frenette PS
Nature medicine 2018 Jun;24(6):782-791
Nature medicine 2018 Jun;24(6):782-791
Stem cell factor is selectively secreted by arterial endothelial cells in bone marrow.
Xu C, Gao X, Wei Q, Nakahara F, Zimmerman SE, Mar J, Frenette PS
Nature communications 2018 Jun 22;9(1):2449
Nature communications 2018 Jun 22;9(1):2449
The organic ester O,O'-diethyl-(S,S)-ethylenediamine-N,N'-di-2-(3-cyclohexyl)propanoate dihydrochloride attenuates murine breast cancer growth and metastasis.
Jurisevic M, Arsenijevic A, Pantic J, Gajovic N, Milovanovic J, Milovanovic M, Poljarevic J, Sabo T, Vojvodic D, Radosavljevic GD, Arsenijevic N
Oncotarget 2018 Jun 15;9(46):28195-28212
Oncotarget 2018 Jun 15;9(46):28195-28212
Modulation of Myelopoiesis Progenitors Is an Integral Component of Trained Immunity.
Mitroulis I, Ruppova K, Wang B, Chen LS, Grzybek M, Grinenko T, Eugster A, Troullinaki M, Palladini A, Kourtzelis I, Chatzigeorgiou A, Schlitzer A, Beyer M, Joosten LAB, Isermann B, Lesche M, Petzold A, Simons K, Henry I, Dahl A, Schultze JL, Wielockx B, Zamboni N, Mirtschink P, Coskun Ü, Hajishengallis G, Netea MG, Chavakis T
Cell 2018 Jan 11;172(1-2):147-161.e12
Cell 2018 Jan 11;172(1-2):147-161.e12
MicroRNA-126 deficiency enhanced the activation and function of CD4(+) T cells by elevating IRS-1 pathway.
Chu F, Hu Y, Zhou Y, Guo M, Lu J, Zheng W, Xu H, Zhao J, Xu L
Clinical and experimental immunology 2018 Feb;191(2):166-179
Clinical and experimental immunology 2018 Feb;191(2):166-179
Quiescent Tissue Stem Cells Evade Immune Surveillance.
Agudo J, Park ES, Rose SA, Alibo E, Sweeney R, Dhainaut M, Kobayashi KS, Sachidanandam R, Baccarini A, Merad M, Brown BD
Immunity 2018 Feb 20;48(2):271-285.e5
Immunity 2018 Feb 20;48(2):271-285.e5
Fc Effector Function Contributes to the Activity of Human Anti-CTLA-4 Antibodies.
Arce Vargas F, Furness AJS, Litchfield K, Joshi K, Rosenthal R, Ghorani E, Solomon I, Lesko MH, Ruef N, Roddie C, Henry JY, Spain L, Ben Aissa A, Georgiou A, Wong YNS, Smith M, Strauss D, Hayes A, Nicol D, O'Brien T, Mårtensson L, Ljungars A, Teige I, Frendéus B, TRACERx Melanoma, TRACERx Renal, TRACERx Lung consortia, Pule M, Marafioti T, Gore M, Larkin J, Turajlic S, Swanton C, Peggs KS, Quezada SA
Cancer cell 2018 Apr 9;33(4):649-663.e4
Cancer cell 2018 Apr 9;33(4):649-663.e4
1810011o10 Rik Inhibits the Antitumor Effect of Intratumoral CD8(+) T Cells through Suppression of Notch2 Pathway in a Murine Hepatocellular Carcinoma Model.
Dai K, Huang L, Huang YB, Chen ZB, Yang LH, Jiang YA
Frontiers in immunology 2017;8:320
Frontiers in immunology 2017;8:320
CCR2(-) and CCR2(+) corneal macrophages exhibit distinct characteristics and balance inflammatory responses after epithelial abrasion.
Liu J, Xue Y, Dong D, Xiao C, Lin C, Wang H, Song F, Fu T, Wang Z, Chen J, Pan H, Li Y, Cai D, Li Z
Mucosal immunology 2017 Sep;10(5):1145-1159
Mucosal immunology 2017 Sep;10(5):1145-1159
A somatic mutation in erythro-myeloid progenitors causes neurodegenerative disease.
Mass E, Jacome-Galarza CE, Blank T, Lazarov T, Durham BH, Ozkaya N, Pastore A, Schwabenland M, Chung YR, Rosenblum MK, Prinz M, Abdel-Wahab O, Geissmann F
Nature 2017 Sep 21;549(7672):389-393
Nature 2017 Sep 21;549(7672):389-393
Neonatal pancreatic pericytes support β-cell proliferation.
Epshtein A, Rachi E, Sakhneny L, Mizrachi S, Baer D, Landsman L
Molecular metabolism 2017 Oct;6(10):1330-1338
Molecular metabolism 2017 Oct;6(10):1330-1338
Store-Operated Ca(2+) Entry Controls Clonal Expansion of T Cells through Metabolic Reprogramming.
Vaeth M, Maus M, Klein-Hessling S, Freinkman E, Yang J, Eckstein M, Cameron S, Turvey SE, Serfling E, Berberich-Siebelt F, Possemato R, Feske S
Immunity 2017 Oct 17;47(4):664-679.e6
Immunity 2017 Oct 17;47(4):664-679.e6
Differential cytokine contributions of perivascular haematopoietic stem cell niches.
Asada N, Kunisaki Y, Pierce H, Wang Z, Fernandez NF, Birbrair A, Ma'ayan A, Frenette PS
Nature cell biology 2017 Mar;19(3):214-223
Nature cell biology 2017 Mar;19(3):214-223
Egr2 and 3 control adaptive immune responses by temporally uncoupling expansion from T cell differentiation.
Miao T, Symonds ALJ, Singh R, Symonds JD, Ogbe A, Omodho B, Zhu B, Li S, Wang P
The Journal of experimental medicine 2017 Jun 5;214(6):1787-1808
The Journal of experimental medicine 2017 Jun 5;214(6):1787-1808
A tightly regulated IL-22 response maintains immune functions and homeostasis in systemic viral infection.
Yi P, Liang Y, Yuan DMK, Jie Z, Kwota Z, Chen Y, Cong Y, Fan X, Sun J
Scientific reports 2017 Jun 20;7(1):3857
Scientific reports 2017 Jun 20;7(1):3857
Dicer Deficiency Differentially Impacts Microglia of the Developing and Adult Brain.
Varol D, Mildner A, Blank T, Shemer A, Barashi N, Yona S, David E, Boura-Halfon S, Segal-Hayoun Y, Chappell-Maor L, Keren-Shaul H, Leshkowitz D, Hornstein E, Fuhrmann M, Amit I, Maggio N, Prinz M, Jung S
Immunity 2017 Jun 20;46(6):1030-1044.e8
Immunity 2017 Jun 20;46(6):1030-1044.e8
Modulation of let-7 miRNAs controls the differentiation of effector CD8 T cells.
Wells AC, Daniels KA, Angelou CC, Fagerberg E, Burnside AS, Markstein M, Alfandari D, Welsh RM, Pobezinskaya EL, Pobezinsky LA
eLife 2017 Jul 24;6
eLife 2017 Jul 24;6
Roquin Suppresses the PI3K-mTOR Signaling Pathway to Inhibit T Helper Cell Differentiation and Conversion of Treg to Tfr Cells.
Essig K, Hu D, Guimaraes JC, Alterauge D, Edelmann S, Raj T, Kranich J, Behrens G, Heiseke A, Floess S, Klein J, Maiser A, Marschall S, Hrabĕ de Angelis M, Leonhardt H, Calkhoven CF, Noessner E, Brocker T, Huehn J, Krug AB, Zavolan M, Baumjohann D, Heissmeyer V
Immunity 2017 Dec 19;47(6):1067-1082.e12
Immunity 2017 Dec 19;47(6):1067-1082.e12
Renal Sodium Gradient Orchestrates a Dynamic Antibacterial Defense Zone.
Berry MR, Mathews RJ, Ferdinand JR, Jing C, Loudon KW, Wlodek E, Dennison TW, Kuper C, Neuhofer W, Clatworthy MR
Cell 2017 Aug 24;170(5):860-874.e19
Cell 2017 Aug 24;170(5):860-874.e19
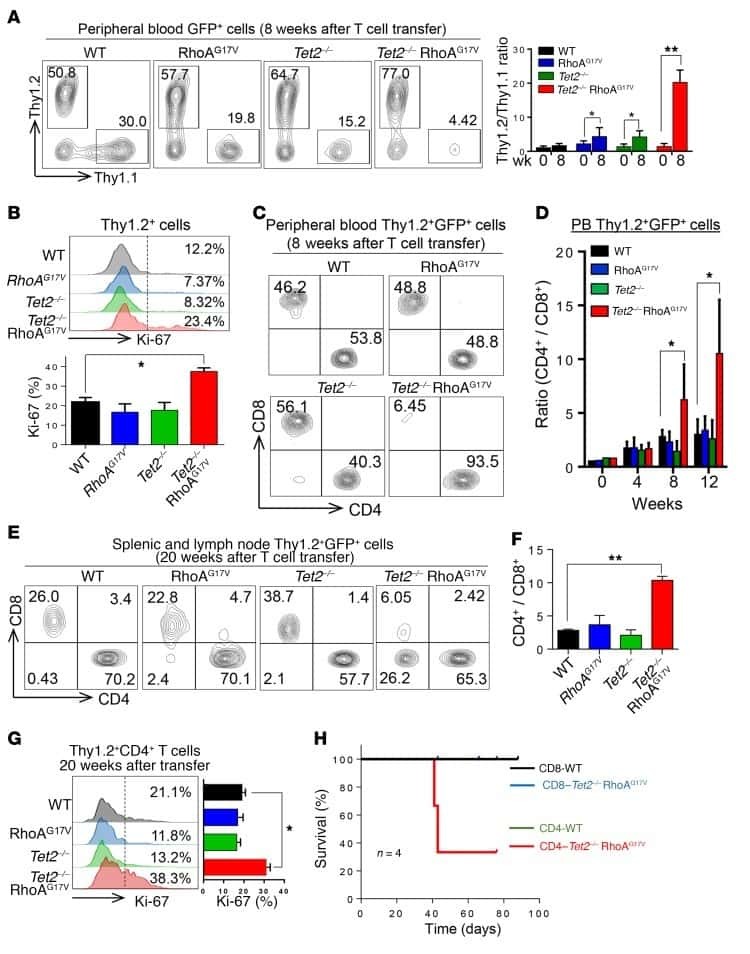
Mutations in 5-methylcytosine oxidase TET2 and RhoA cooperatively disrupt T cell homeostasis.
Zang S, Li J, Yang H, Zeng H, Han W, Zhang J, Lee M, Moczygemba M, Isgandarova S, Yang Y, Zhou Y, Rao A, You MJ, Sun D, Huang Y
The Journal of clinical investigation 2017 Aug 1;127(8):2998-3012
The Journal of clinical investigation 2017 Aug 1;127(8):2998-3012
Myeloid progenitor cluster formation drives emergency and leukaemic myelopoiesis.
Hérault A, Binnewies M, Leong S, Calero-Nieto FJ, Zhang SY, Kang YA, Wang X, Pietras EM, Chu SH, Barry-Holson K, Armstrong S, Göttgens B, Passegué E
Nature 2017 Apr 6;544(7648):53-58
Nature 2017 Apr 6;544(7648):53-58
The stress kinase GCN2 does not mediate suppression of antitumor T cell responses by tryptophan catabolism in experimental melanomas.
Sonner JK, Deumelandt K, Ott M, Thomé CM, Rauschenbach KJ, Schulz S, Munteanu B, Mohapatra S, Adam I, Hofer AC, Feuerer M, Opitz CA, Hopf C, Wick W, Platten M
Oncoimmunology 2016;5(12):e1240858
Oncoimmunology 2016;5(12):e1240858
Growth and metastasis of lung adenocarcinoma is potentiated by BMP4-mediated immunosuppression.
Chen L, Yi X, Goswami S, Ahn YH, Roybal JD, Yang Y, Diao L, Peng D, Peng D, Fradette JJ, Wang J, Byers LA, Kurie JM, Ullrich SE, Qin FX, Gibbons DL
Oncoimmunology 2016;5(11):e1234570
Oncoimmunology 2016;5(11):e1234570
Schwann cell proliferation and differentiation that is induced by ferulic acid through MEK1/ERK1/2 signalling promotes peripheral nerve remyelination following crush injury in rats.
Zhu X, Li K, Guo X, Wang J, Xiang Y
Experimental and therapeutic medicine 2016 Sep;12(3):1915-1921
Experimental and therapeutic medicine 2016 Sep;12(3):1915-1921
Host-Protozoan Interactions Protect from Mucosal Infections through Activation of the Inflammasome.
Chudnovskiy A, Mortha A, Kana V, Kennard A, Ramirez JD, Rahman A, Remark R, Mogno I, Ng R, Gnjatic S, Amir ED, Solovyov A, Greenbaum B, Clemente J, Faith J, Belkaid Y, Grigg ME, Merad M
Cell 2016 Oct 6;167(2):444-456.e14
Cell 2016 Oct 6;167(2):444-456.e14
Hematopoietic Stem Cells Count and Remember Self-Renewal Divisions.
Bernitz JM, Kim HS, MacArthur B, Sieburg H, Moore K
Cell 2016 Nov 17;167(5):1296-1309.e10
Cell 2016 Nov 17;167(5):1296-1309.e10
Immune response modulation by Galectin-1 in a transgenic model of neuroblastoma.
Büchel G, Schulte JH, Harrison L, Batzke K, Schüller U, Hansen W, Schramm A
Oncoimmunology 2016 May;5(5):e1131378
Oncoimmunology 2016 May;5(5):e1131378
The cell proliferation antigen Ki-67 organises heterochromatin.
Sobecki M, Mrouj K, Camasses A, Parisis N, Nicolas E, Llères D, Gerbe F, Prieto S, Krasinska L, David A, Eguren M, Birling MC, Urbach S, Hem S, Déjardin J, Malumbres M, Jay P, Dulic V, Lafontaine DLj, Feil R, Fisher D
eLife 2016 Mar 7;5:e13722
eLife 2016 Mar 7;5:e13722
Interaction of natural killer cells with neutrophils exerts a significant antitumor immunity in hematopoietic stem cell transplantation recipients.
Ueda R, Narumi K, Hashimoto H, Miyakawa R, Okusaka T, Aoki K
Cancer medicine 2016 Jan;5(1):49-60
Cancer medicine 2016 Jan;5(1):49-60
Oligodendrocyte death results in immune-mediated CNS demyelination.
Traka M, Podojil JR, McCarthy DP, Miller SD, Popko B
Nature neuroscience 2016 Jan;19(1):65-74
Nature neuroscience 2016 Jan;19(1):65-74
Foxp3 and Toll-like receptor signaling balance T(reg) cell anabolic metabolism for suppression.
Gerriets VA, Kishton RJ, Johnson MO, Cohen S, Siska PJ, Nichols AG, Warmoes MO, de Cubas AA, MacIver NJ, Locasale JW, Turka LA, Wells AD, Rathmell JC
Nature immunology 2016 Dec;17(12):1459-1466
Nature immunology 2016 Dec;17(12):1459-1466
Suppression of ischemia in arterial occlusive disease by JNK-promoted native collateral artery development.
Ramo K, Sugamura K, Craige S, Keaney JF, Davis RJ
eLife 2016 Aug 9;5
eLife 2016 Aug 9;5
Programmed death 1 regulates memory phenotype CD4 T cell accumulation, inhibits expansion of the effector memory phenotype subset and modulates production of effector cytokines.
Charlton JJ, Tsoukatou D, Mamalaki C, Chatzidakis I
PloS one 2015;10(3):e0119200
PloS one 2015;10(3):e0119200
Mammary Stem Cells and Tumor-Initiating Cells Are More Resistant to Apoptosis and Exhibit Increased DNA Repair Activity in Response to DNA Damage.
Chang CH, Zhang M, Rajapakshe K, Coarfa C, Edwards D, Huang S, Rosen JM
Stem cell reports 2015 Sep 8;5(3):378-91
Stem cell reports 2015 Sep 8;5(3):378-91
Inflammation rapidly reorganizes mouse bone marrow B cells and their environment in conjunction with early IgM responses.
Moreau JM, Berger A, Nelles ME, Mielnik M, Furlonger C, Cen SY, Besla R, Robbins CS, Paige CJ
Blood 2015 Sep 3;126(10):1184-92
Blood 2015 Sep 3;126(10):1184-92
Metastasis is regulated via microRNA-200/ZEB1 axis control of tumour cell PD-L1 expression and intratumoral immunosuppression.
Chen L, Gibbons DL, Goswami S, Cortez MA, Ahn YH, Byers LA, Zhang X, Yi X, Dwyer D, Lin W, Diao L, Wang J, Roybal J, Patel M, Ungewiss C, Peng D, Antonia S, Mediavilla-Varela M, Robertson G, Suraokar M, Welsh JW, Erez B, Wistuba II, Chen L, Peng D, Wang S, Ullrich SE, Heymach JV, Kurie JM, Qin FX
Nature communications 2014 Oct 28;5:5241
Nature communications 2014 Oct 28;5:5241
Hematopoietic not systemic impairment of Roquin expression accounts for intestinal inflammation in Roquin-deficient mice.
Montufar-Solis D, Vigneswaran N, Nakra N, Schaefer JS, Klein JR
Scientific reports 2014 May 12;4:4920
Scientific reports 2014 May 12;4:4920
The miR-126-VEGFR2 axis controls the innate response to pathogen-associated nucleic acids.
Agudo J, Ruzo A, Tung N, Salmon H, Leboeuf M, Hashimoto D, Becker C, Garrett-Sinha LA, Baccarini A, Merad M, Brown BD
Nature immunology 2014 Jan;15(1):54-62
Nature immunology 2014 Jan;15(1):54-62
Suppression of Tregs by anti-glucocorticoid induced TNF receptor antibody enhances the antitumor immunity of interferon-α gene therapy for pancreatic cancer.
Aida K, Miyakawa R, Suzuki K, Narumi K, Udagawa T, Yamamoto Y, Chikaraishi T, Yoshida T, Aoki K
Cancer science 2014 Feb;105(2):159-67
Cancer science 2014 Feb;105(2):159-67
Inflammatory signaling regulates embryonic hematopoietic stem and progenitor cell production.
Li Y, Esain V, Teng L, Xu J, Kwan W, Frost IM, Yzaguirre AD, Cai X, Cortes M, Maijenburg MW, Tober J, Dzierzak E, Orkin SH, Tan K, North TE, Speck NA
Genes & development 2014 Dec 1;28(23):2597-612
Genes & development 2014 Dec 1;28(23):2597-612
Myeloid cells expressing VEGF and arginase-1 following uptake of damaged retinal pigment epithelium suggests potential mechanism that drives the onset of choroidal angiogenesis in mice.
Liu J, Copland DA, Horie S, Wu WK, Chen M, Xu Y, Paul Morgan B, Mack M, Xu H, Nicholson LB, Dick AD
PloS one 2013;8(8):e72935
PloS one 2013;8(8):e72935
Small intestine inflammation in Roquin-mutant and Roquin-deficient mice.
Schaefer JS, Montufar-Solis D, Nakra N, Vigneswaran N, Klein JR
PloS one 2013;8(2):e56436
PloS one 2013;8(2):e56436
Beneficial role of rapamycin in experimental autoimmune myositis.
Prevel N, Allenbach Y, Klatzmann D, Salomon B, Benveniste O
PloS one 2013;8(11):e74450
PloS one 2013;8(11):e74450
Arteriolar niches maintain haematopoietic stem cell quiescence.
Kunisaki Y, Bruns I, Scheiermann C, Ahmed J, Pinho S, Zhang D, Mizoguchi T, Wei Q, Lucas D, Ito K, Mar JC, Bergman A, Frenette PS
Nature 2013 Oct 31;502(7473):637-43
Nature 2013 Oct 31;502(7473):637-43
IL-1R signaling in dendritic cells replaces pattern-recognition receptors in promoting CD8⁺ T cell responses to influenza A virus.
Pang IK, Ichinohe T, Iwasaki A
Nature immunology 2013 Mar;14(3):246-53
Nature immunology 2013 Mar;14(3):246-53
Primate B-1 cells generate antigen-specific B cell responses to T cell-independent type 2 antigens.
Yammani RD, Haas KM
Journal of immunology (Baltimore, Md. : 1950) 2013 Apr 1;190(7):3100-8
Journal of immunology (Baltimore, Md. : 1950) 2013 Apr 1;190(7):3100-8
Anti-Gr-1 antibody depletion fails to eliminate hepatic myeloid-derived suppressor cells in tumor-bearing mice.
Ma C, Kapanadze T, Gamrekelashvili J, Manns MP, Korangy F, Greten TF
Journal of leukocyte biology 2012 Dec;92(6):1199-206
Journal of leukocyte biology 2012 Dec;92(6):1199-206
No comments: Submit comment
Supportive validation
- Submitted by
- Invitrogen Antibodies (provider)
- Main image
- Experimental details
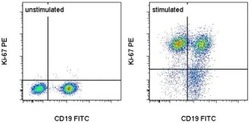
- C57Bl/6 splenocytes were unstimulated (left) or stimulated for 2 days with Anti-Mouse CD3 Functional Grade Purified (Product # 16-0031-82) (right). Cells were surface stained with Anti-Mouse CD19 FITC (Product # 11-0193-82) then fixed and permeabilized with the Foxp3 Staining Buffer Set (Product # 00-5523-00) and intracellularly stained with 0.03 µg of Anti-Mouse/Rat Ki-67 PE. Total viable cells, as determined by Fixable Viability Dye eFluor® 450 (Product # 65-0863-14), were used for analysis.
- Conjugate
- Yellow dye

Supportive validation
- Submitted by
- Invitrogen Antibodies (provider)
- Main image

- Experimental details
- NULL
- Conjugate
- Yellow dye
- Submitted by
- Invitrogen Antibodies (provider)
- Main image
- Experimental details
- NULL
- Conjugate
- Yellow dye
- Submitted by
- Invitrogen Antibodies (provider)
- Main image
- Experimental details
- NULL
- Conjugate
- Yellow dye
- Submitted by
- Invitrogen Antibodies (provider)
- Main image
- Experimental details
- NULL
- Conjugate
- Yellow dye
- Submitted by
- Invitrogen Antibodies (provider)
- Main image
- Experimental details
- NULL
- Conjugate
- Yellow dye

- Submitted by
- Invitrogen Antibodies (provider)
- Main image
- Experimental details
- NULL
- Conjugate
- Yellow dye
- Submitted by
- Invitrogen Antibodies (provider)
- Main image
- Experimental details
- NULL
- Conjugate
- Yellow dye
- Submitted by
- Invitrogen Antibodies (provider)
- Main image
- Experimental details
- NULL
- Conjugate
- Yellow dye
- Submitted by
- Invitrogen Antibodies (provider)
- Main image
- Experimental details
- NULL
- Conjugate
- Yellow dye

- Submitted by
- Invitrogen Antibodies (provider)
- Main image
- Experimental details
- NULL
- Conjugate
- Yellow dye
- Submitted by
- Invitrogen Antibodies (provider)
- Main image

- Experimental details
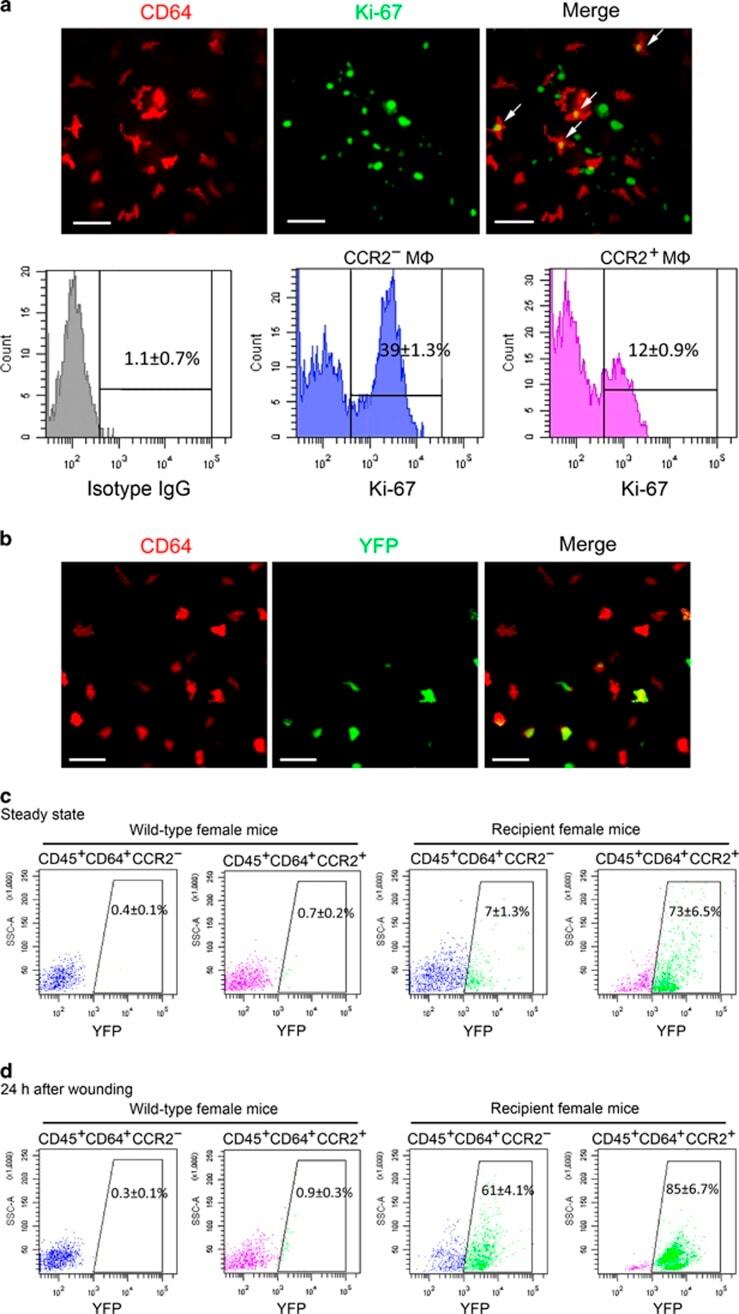
- Figure 4 Maintenance mechanisms of corneal macrophages at steady state or after corneal wounding. ( a ) Costaining of cornea from 8-week-old mice with CD64-PE and Ki-67-FITC (the upper three images) (bars=50 mum). Flow cytometric analysis of the percentage of Ki-67-positive cells in CCR2 - and CCR2 + corneal macrophages (lower three images). Control isotype antibodies are shown on the left. ( b ) Staining of cornea from recipient female mice with anti-mouse CD64-PE (bars=100 mum). ( c ) Percentage of YFP + cells in corneal macrophages from wild and recipient mice at steady state, and ( d ) after corneal epithelial wounding. All samples in this figure were obtained at the same time. FITC, fluorescein isothiocyanate; IgG, immunoglobulin G; PE, phycoerythrin; SSC, side scatter; YFP, yellow fluorescent protein.
- Conjugate
- Yellow dye
- Submitted by
- Invitrogen Antibodies (provider)
- Main image
- Experimental details
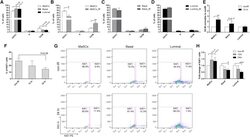
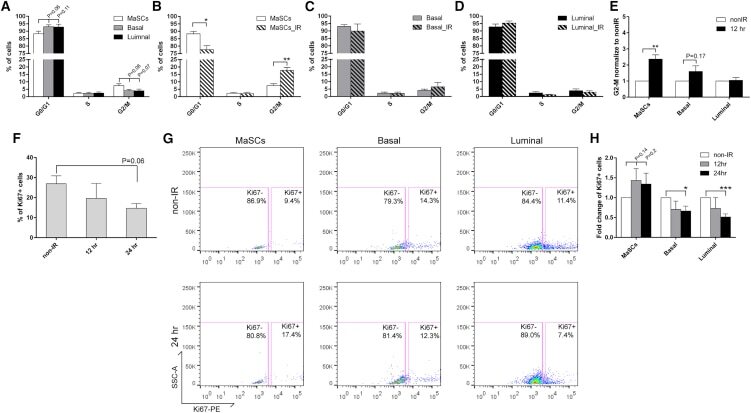
- Figure 2 Wild-Type MaSCs Exhibit Increased G2 Arrest and Evade Damage-Induced Quiescence after IR (A) Cell-cycle distributions of different subpopulations from MECs before IR were examined using PI staining (data are represented as mean +- SEM; n = 5). (B) A significant increase of cells in G2/M was observed in MaSCs 12 hr after IR (data are shown as mean +- SEM; n = 3; ** p < 0.01; * p < 0.05). (C and D) The cell-cycle profiles of basal and luminal compartments before and 12 hr after IR (data are shown as mean +- SEM; n = 3). (E) The fold change of cells in G2/M phase 12 hr after IR as compared to non-IR samples (data are shown as mean +- SEM; n = 3; ** p < 0.01). (F) Percentage of Ki67-positive MECs before and after IR (data are shown as mean +- SEM; n = 3). (G) Representative FACS plots of Ki67 in different subpopulations before and after IR. (H) Quantification of Ki67 positivity shows that basal and luminal cells became significantly more quiescent after IR (data are shown as mean +- SEM; n = 3; *** p < 0.001; * p < 0.05).
- Conjugate
- Yellow dye
- Submitted by
- Invitrogen Antibodies (provider)
- Main image
- Experimental details
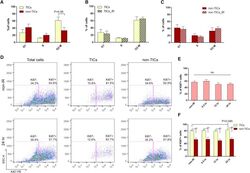
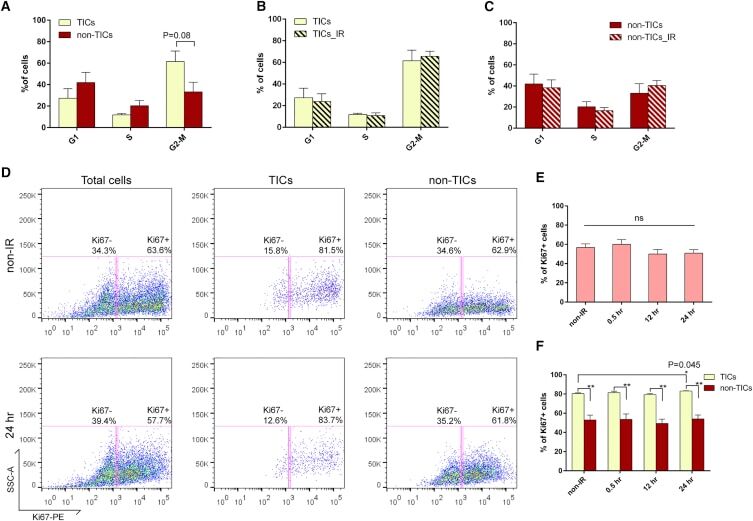
- Figure 6 p53- Tumor Cells Are Highly Proliferative and Fail to Exhibit Proper Cell-cycle Regulation after IR (A) Cell-cycle distribution of TICs and non-TICs before IR (data are shown as mean +- SEM; n = 4). (B and C) Twelve hours after IR, both subpopulations exhibit similar cell-cycle profiles as compared to their non-IR counterparts (data are shown as mean +- SEM; n = 4). (D) Representative FACS plots of Ki67 staining in total tumor cells, TICs, and non-TICs before and after IR. (E) Percentage of Ki67-positive cells in total tumor cells before and after IR (data are shown as mean +- SEM; n = 3). (F) Percentage of Ki67-positive cells in TICs and non-TICs before and after IR (data are shown as mean +- SEM; n = 3; * p < 0.05; ** p < 0.01).
- Conjugate
- Yellow dye
- Submitted by
- Invitrogen Antibodies (provider)
- Main image
- Experimental details
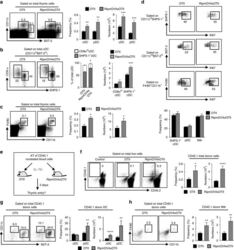
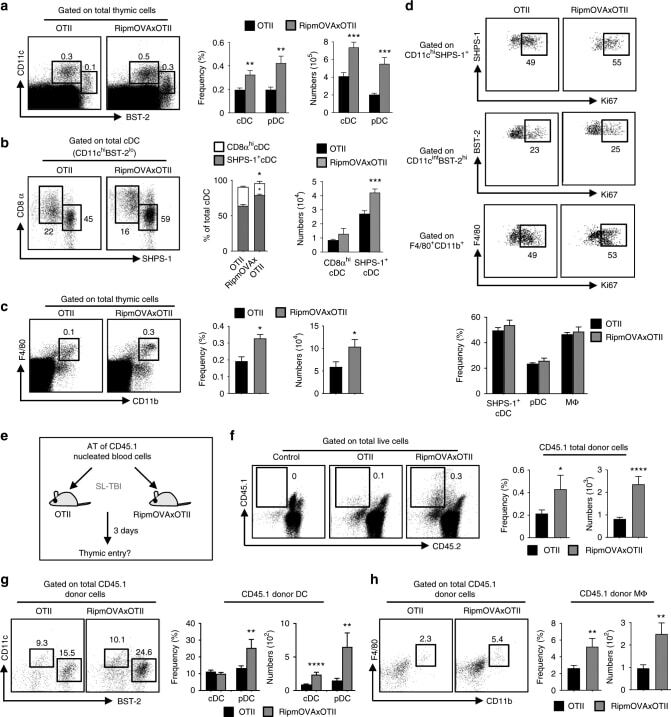
- Fig. 1 Ag-specific interactions between mTECs and CD4 + T cells increase the thymic entry of circulating DCs and macrophages. a - c Flow cytometry profiles, frequencies and numbers of cDCs (CD11c hi BST-2 lo ), pDCs (CD11c int BST-2 hi ) ( a ), resident cDCs (CD8alpha hi SHPS-1 - ), migratory cDCs (CD8alpha lo SHPS-1 + ) ( b ) and macrophages (F4/80 + CD11b + ) ( c ) in the thymus from OTII- Rag2 -/- and RipmOVAxOTII- Rag2 -/- mice. Data are representative of three independent experiments ( n = 3 mice per group and per experiment). d Flow cytometry profiles and frequencies of proliferating Ki-67 + thymic DC subsets and macrophages. Data are representative of two independent experiments ( n = 3 mice per group and per experiment). e Experimental setup: nucleated blood cells from CD45.1 WT congenic mice were adoptively transferred into sublethally irradiated CD45.2 OTII- Rag2 -/- and RipmOVAxOTII- Rag2 -/- recipients. Three days after i.v . adoptive transfer (AT), the thymic entry of DCs and macrophages of CD45.1 donor origin was analysed. SL-TBI: sublethal total body irradiation. f - h Flow cytometry profiles, frequencies and numbers of CD45.1 total donor cells ( f ) as well as cDCs, pDCs ( g ) and macrophages ( h ) of CD45.1 donor origin in the thymus from OTII- Rag2 -/- and RipmOVAxOTII- Rag2 -/- recipients. Control: non-injected irradiated OTII- Rag2 -/- mice. Data are representative of three independent experiments ( n = 3-4 mice per group and per experiment). d , h MPhi: m
- Conjugate
- Yellow dye
- Submitted by
- Invitrogen Antibodies (provider)
- Main image
- Experimental details
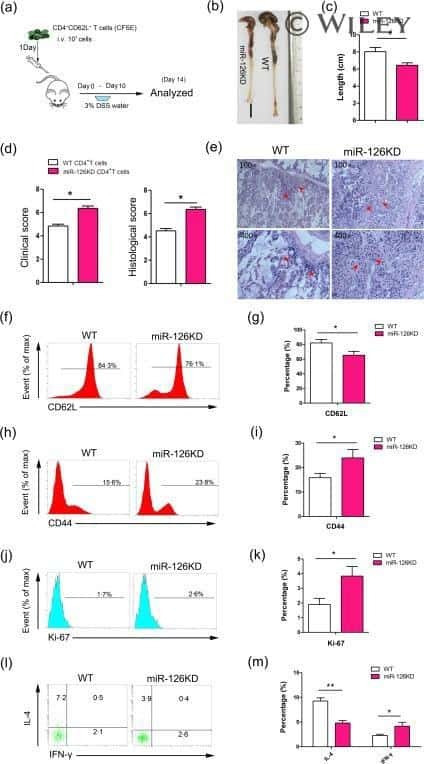
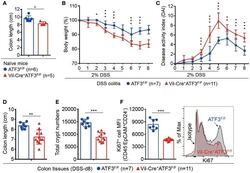
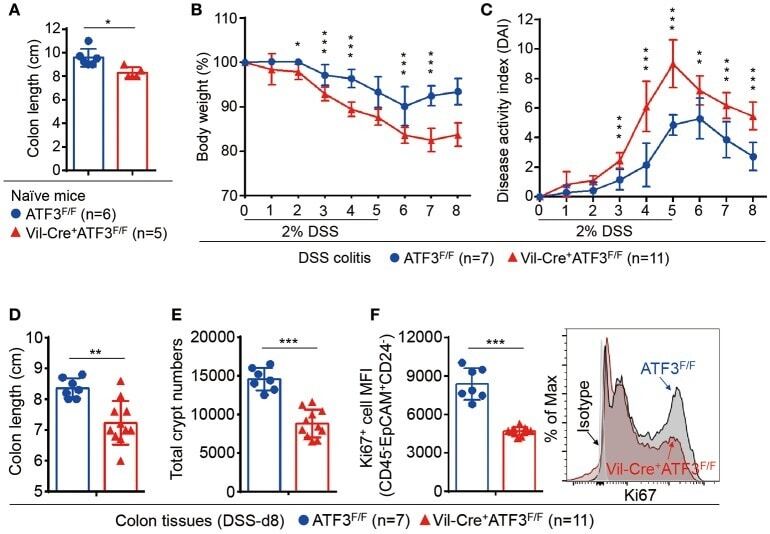
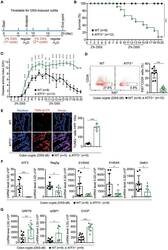
- Figure 4 Epithelial ATF3 is required for protection against DSS colitis. (A) Comparison of colon length between 3-month-old naive mice as indicated. (B-F) Analysis of colitis severity during DSS treatment. (B) Percentage of body weight loss during DSS colitis. (C) Disease activity index (weight loss percentage, stool consistency, and blood in stools) was indicated in each group of mice during DSS colitis. (D) Colon length, (E) total colon crypt numbers, and (F) Ki67 + proliferating crypt cells by flow cytometry analysis, were measured at day-8 post DSS treatment. Results were from two independent experiments. ""n"" refers to the number of mice analyzed. Statistical analysis was done using Multiple T -test on Prism software. * P < 0.05, ** P < 0.005, *** P < 0.0005.
- Conjugate
- Yellow dye
- Submitted by
- Invitrogen Antibodies (provider)
- Main image
- Experimental details
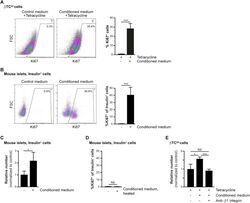
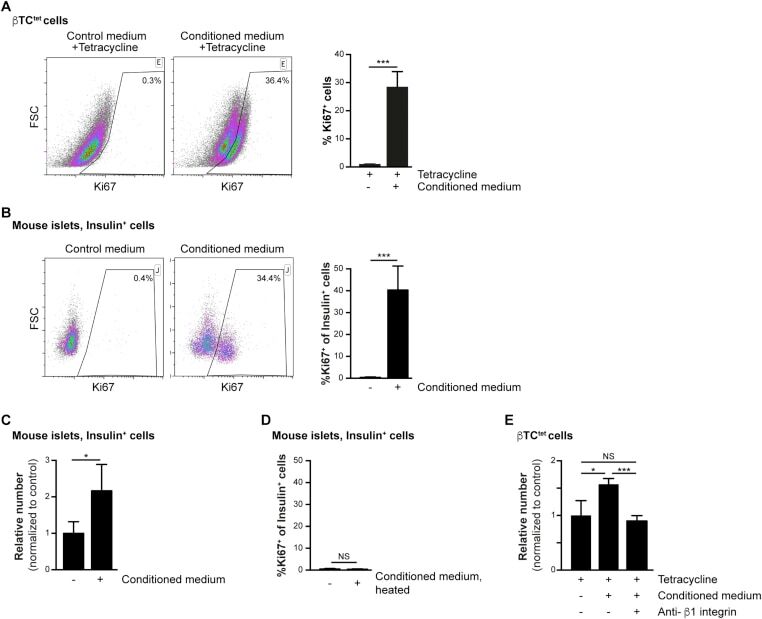
- Figure 2 Increased beta-cell proliferation upon exposure to pericyte-conditioned medium . A ) Tetracycline-treated betaTC-tet cells were cultured in either control (complete DMEM; 'Control medium') or neonatal pericyte-conditioned ('Conditioned medium'; described in Figure 1 B) medium, both supplemented with tetracycline. After incubation for 96 h, cells were fixed and stained for the proliferative marker Ki67. Left , representative dotplots showing flow-cytometry analysis of Ki67 expression by betaTC-tet cells. Gated are Ki67 + cells; the numbers represent the percentage of gated cells out of the analyzed cell population. Right , Bar diagrams (mean +- SD) represent the percentage of Ki67 + cells. N = 3. ***P < 0.005 (Student's t -test), as compared to the control medium. A representative of three independent experiments is shown. B ) Isolated islets from 3-month-old wild-type mice were cultured in either control (complete DMEM; 'Control medium') or neonatal pericyte-conditioned ('Conditioned medium'; described in Figure 1 B) medium for 24 h. Islets were dispersed to single cells, fixed, and stained for insulin and the proliferative marker Ki67. Left , representative dotplots showing flow-cytometry analysis of Ki67 expression by insulin + cells. Gated are Ki67 + cells; the numbers represent the percentage of gated cells out of the total insulin + cell population. Right , Bar diagrams (mean +- SD) represent the percentage of Ki67 +
- Conjugate
- Yellow dye
- Submitted by
- Invitrogen Antibodies (provider)
- Main image
- Experimental details
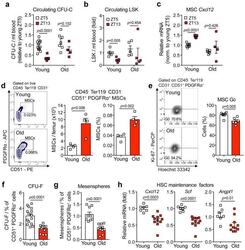
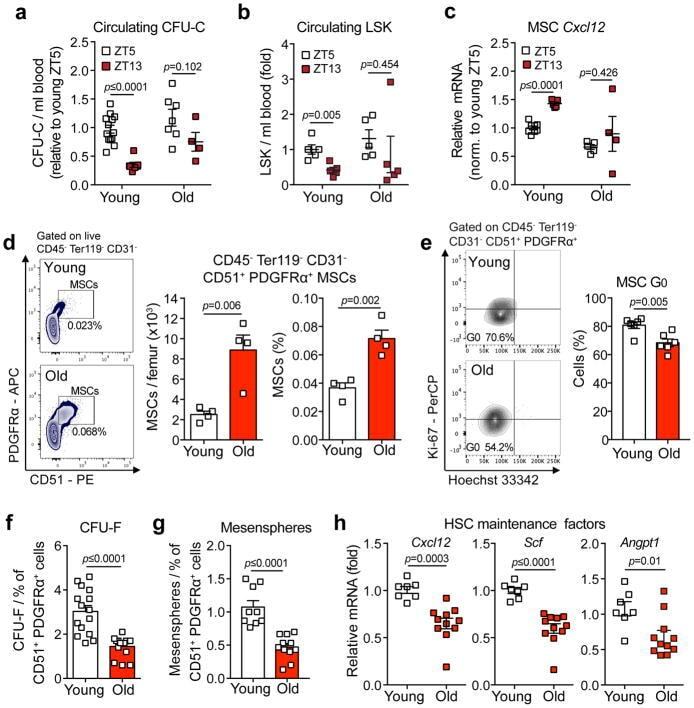
- Figure 3 Aging expands MSCs and reduces their HSC maintenance activity (a, b) Circadian oscillations of circulating CFU-C (normalized to young at ZT5; n=13 young ZT5, 7 old ZT5, 7 young ZT13 and 4 old ZT13 mice) (a) and lineage - Sca-1 + c-Kit + (LSK) progenitors (normalized to young at ZT5; n=5 mice per group) (b) in peripheral blood of young and old C57BL/6 mice. (c) Quantification of Cxcl12 mRNA levels relative to Actb in sorted MSCs from young and old C57BL/6 mice at ZT5 and ZT13 (normalized to young at ZT5; n=8 young ZT5, 5 old ZT5, 5 young ZT13 and 4 old ZT13 mice). (d) Left, representative FACS plots showing the gating strategy for CD45 - Ter119 - CD31 - CD51 + PDGFRalpha + MSCs in young (top) and old (bottom) C57BL/6 mice. Right, absolute numbers and frequency of MSCs in young and old C57BL/6 mice (n=4 mice per group). (e) Left, representative FACS plots showing the gating strategy for MSCs Ki-67 and Hoechst 33342 staining in young (top) and old (bottom) C57BL/6 mice. Right, quantification of Ki-67 - G0 MSCs in young and old C57BL/6 mice (n=6 mice per group). (f, g) Frequency of CFU-F (n=15 cultures per group) (f) and mesenspheres (n=9 young, 11 old cultures) (g) from sorted MSCs plated at equal numbers and clonal densities under CFU-F or mesensphere culture conditions (n=5 mice per group). (h) Quantification of mRNA levels of Cxcl12, Scf and Angpt1 relative to Gapdh in sorted MSCs (normalized to young; n=7 young, 11 old mice)
- Conjugate
- Yellow dye
- Submitted by
- Invitrogen Antibodies (provider)
- Main image
- Experimental details
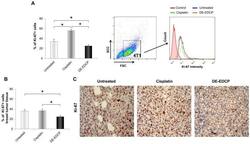
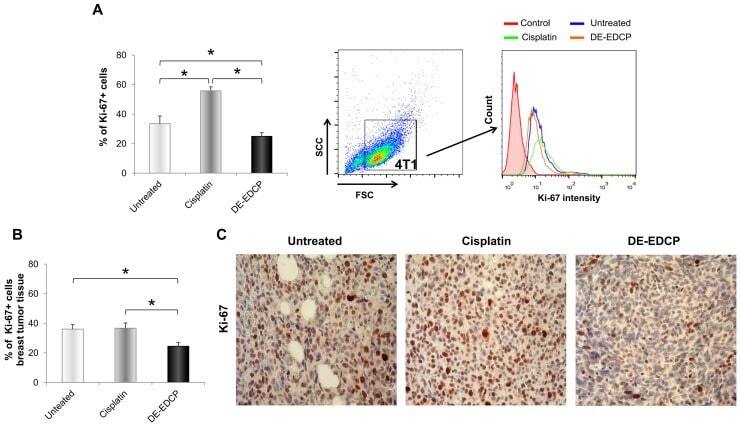
- Figure 6 DE-EDCP treatment attenuates expression of Ki-67 in murine breast cancer (A) Analysis of Ki-67 expression in 4T1 cells exposed to DE-EDCP or cisplatin (31.25 muM) for 24h using flow cytometry by first gaiting out cell debris and cell clumps in forward/side scatter plot. Data are presented as the mean +- SD, ( * DE-EDCP vs. untreated p=0.020; DE-EDCP vs. cisplatin p=0.002; cisplatin vs. untreated p=0.009). Representative histograms of three independent experiments are shown. (B, C) At 36 th day of the experiment, tumors were harvested from tumor-bearing mice treated with DE-EDCP, cisplatin and vehicle and Ki-67 expression was detected using immunohistochemical method. Representative images and quantitative analysis of the percentage of Ki-67- positive cells are shown. Ki-67-positive cells were counted in five random fields (magnification at x 400), and data were summarized as the mean percentage of positive cells (four tumors per group). Data are presented as mean +- SE. ( * DE-EDCP vs. untreated p=0.006; DE-EDCP vs. cisplatin p=0.004)
- Conjugate
- Yellow dye
- Submitted by
- Invitrogen Antibodies (provider)
- Main image
- Experimental details
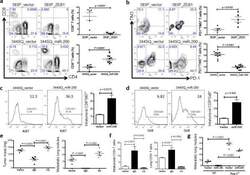
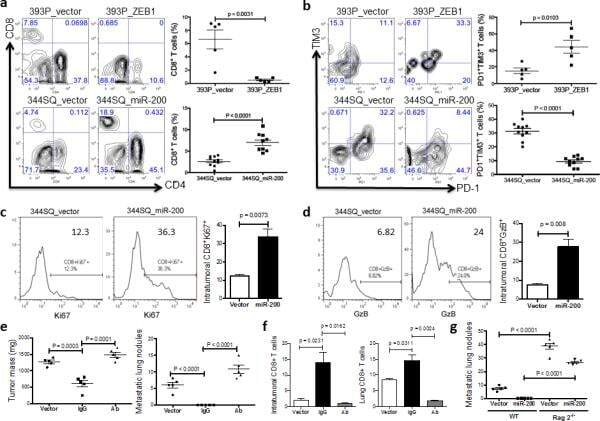
- Figure 4 The miR-200/ZEB1 axis controls tumor metastasis through regulating CD8 + TILs ( a , b ) FACS analysis of ( a ) CD8 + TIL frequency; ( b ) PD1 and TIM3 marker expression on CD8 + T cells from 393P_vector and 393P_ZEB1 (n = 5), as well as 344SQ_vector and 344SQ_miR-200 (n = 10) primary tumors. Analysis was done 2 weeks post-cancer cell injection. ( c , d ) ( c ) Intratumoral Ki67 + CD8 + T cells; ( d ) granzyme B (GzB) + CD8 + T cells in 344SQ_vector or 344SQ_miR-200 primary tumors 6 weeks post-subcutaneous injection of cancer cells into 129/Sv mice. Representative Ki67 or GzB staining in an individual tumor sample is shown on the left, and mean Ki67 + or GzB + populations of gated CD8 + T cells in total T cells are shown on the right (n = 5). ( e ) CD8 + T cell depletion results in tumor growth and metastasis in mice (n = 5) that received subcutaneous tumor cell injections. No treatment (344SQ_vector (Vector)), IgG (344SQ_miR-200 + IgG control), or Ab (344SQ_miR-200 + anti-CD8 Ab). The analysis was done 6 weeks post-injection. ( f ) Relative abundance of CD8 + T cells in the tumor (left) or lung (right) from 129/Sv mice (n =5) with syngeneic control 344SQ tumors (Vector), 344SQ_miR-200 tumors with control IgG treatment (IgG) or anti-CD8 antibody treatment (Ab). ( g ) Lung metastases of 344SQ_vector (Vector) and 344SQ_miR-200 (miR-200) tumors in wild-type (WT) or 129/Sv Rag2 -/- ( Rag2 -/- ) mice (n = 5). The analysis was done 6 weeks post-tumor cell subcutaneous injec
- Conjugate
- Yellow dye
- Submitted by
- Invitrogen Antibodies (provider)
- Main image

- Experimental details
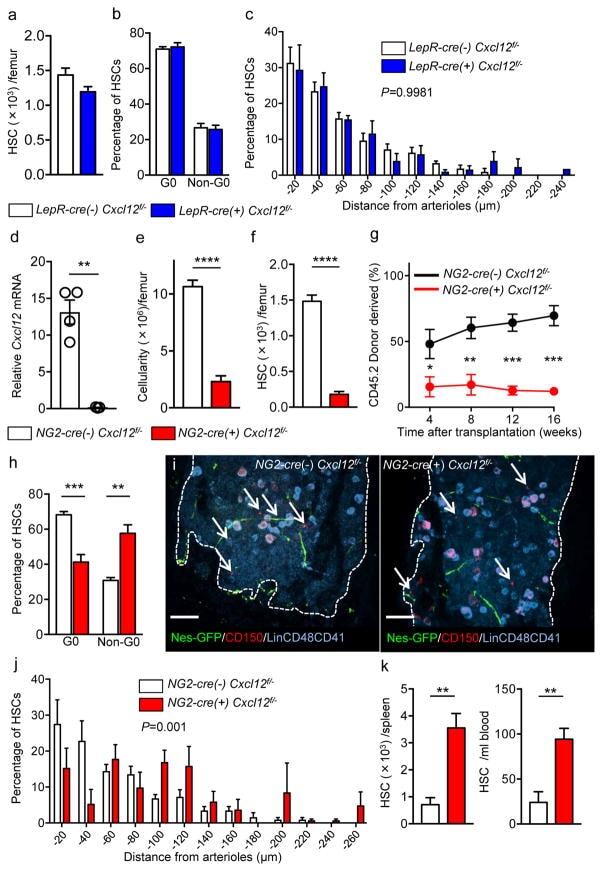
- Figure 3 Cxcl12 from distinct peri-vascular niche cells contributes differentially to HSC functions (a-c) Analyses of LepR-cre/ Cxcl12 fl/- mice. (a) Absolute numbers of HSCs in BM. n=6 mice for each group. (b) FACS analyses of cell cycle of HSCs with Ki-67 and Hoechst 33342 staining. n=5 mice per group. (c) HSC localization relative to arterioles. Error bars: n=3 mice. The p value has been calculated using n=129 HSCs for cre (-), 160 HSCs for cre (+), pooled from 3 mice per group. P =0.9981. (d-k) Analyses of NG2-cre / Cxcl12 flox/-. mice (d) Cxcl12 mRNA expression relative to beta-actin in CD45 - TER119 - CD31 - Nes-GFP + cells from NG2-cre(-) Cxcl12 f/- and NG2-cre(+) Cxcl12 f/- mice. n=4 mice for cre (-), n=3 mice for cre (+), from two independent experiments. (e,f) Bone marrow cellularity (e) and absolute numbers of phenotypic CD150 + CD48 - Lineage - Sca-1 + c-kit + (LSK) HSCs (f) per one femur. n=10 mice. (g) Percentages of donor-derived cells after competitive reconstitution. n=5 mice per group. (h) Quantification of cell cycle of HSCs with Ki-67 and Hoechst 33342 staining. n=5 mice for cre (-), n=7 mice for cre (+). (i) Representative images of whole-mount immunofluorescent staining of the sternal bone marrow from 3 mice. Arrows indicate CD150 + CD48 - CD41 - Lineage - HSCs. Dashed lines depict the border between bone and bone marrow. Scale bars, 100 muH. (j) HSC localization relative to arterioles. Error bars: n=3 mice for cre (-), n=4 mice for cre (+). The p value
- Conjugate
- Yellow dye
- Submitted by
- Invitrogen Antibodies (provider)
- Main image
- Experimental details
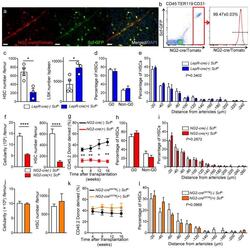
- Figure 5 NG2-cre, but not NG2-cre ERTM , targeted cells are the source of Scf in the bone marrow (a) Whole-mount sternum from NG2-cre/ iTdTomato/ Scf-GFP mice, anti-VE-cadherin. Representative images from 3 mice. Scale bars, 20 mum. (b) Representative FACS plot showing percentage of NG2-cre/ iTdTomato + cells within CD45 - TER119 - CD31 - Scf-GFP + cells. n=3 mice. (c-e) Analyses of LepR-cre/ Scf fl/- mice. (c) Numbers of HSCs (left) in BM and LSK cells in spleen (right). n=4 mice for cre (-), n=3 mice for cre (+). (d) FACS analyses of HSC (CD150 + CD48 - LSK) cell cycle with Ki-67 and Hoechst 33342 staining. n=5 mice for cre (-), n=6 mice for cre (+). (e) HSC localization relative to arterioles. Error bars: n=3 mice. P value has been calculated using n=272 HSCs for cre (-), 293 HSCs for cre (+) pooled from 3 mice per group. P =0.3402. (f-i) Analyses of NG2-cre/ Scf fl/- mice. (f) Numbers of total BM cells (left) and CD150 + CD48 - LSK HSCs (right) in BM. n=5 mice for cre (-), n=7 mice for cre (+). (g) Percentages of donor-derived cells after competitive reconstitution. n=5 mice for cre (-), n=7 mice for cre (+). (h) FACS analyses of HSC cell cycle with Ki-67 and Hoechst 33342 staining. n=6 mice for cre (-), n=7 mice for cre (+). (i) HSC localization relative to arterioles. Error bars: n=3 mice. P value has been calculated using n=224 HSCs for cre (-), 274 HSCs for cre (+) pooled from 3 mice per group. P =0.2872. (j-l) Analyses of NG2-cre ERTM / Scf fl/- mice. (j) Absolute nu
- Conjugate
- Yellow dye
- Submitted by
- Invitrogen Antibodies (provider)
- Main image
- Experimental details
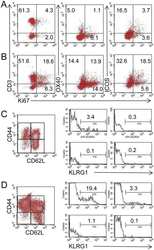
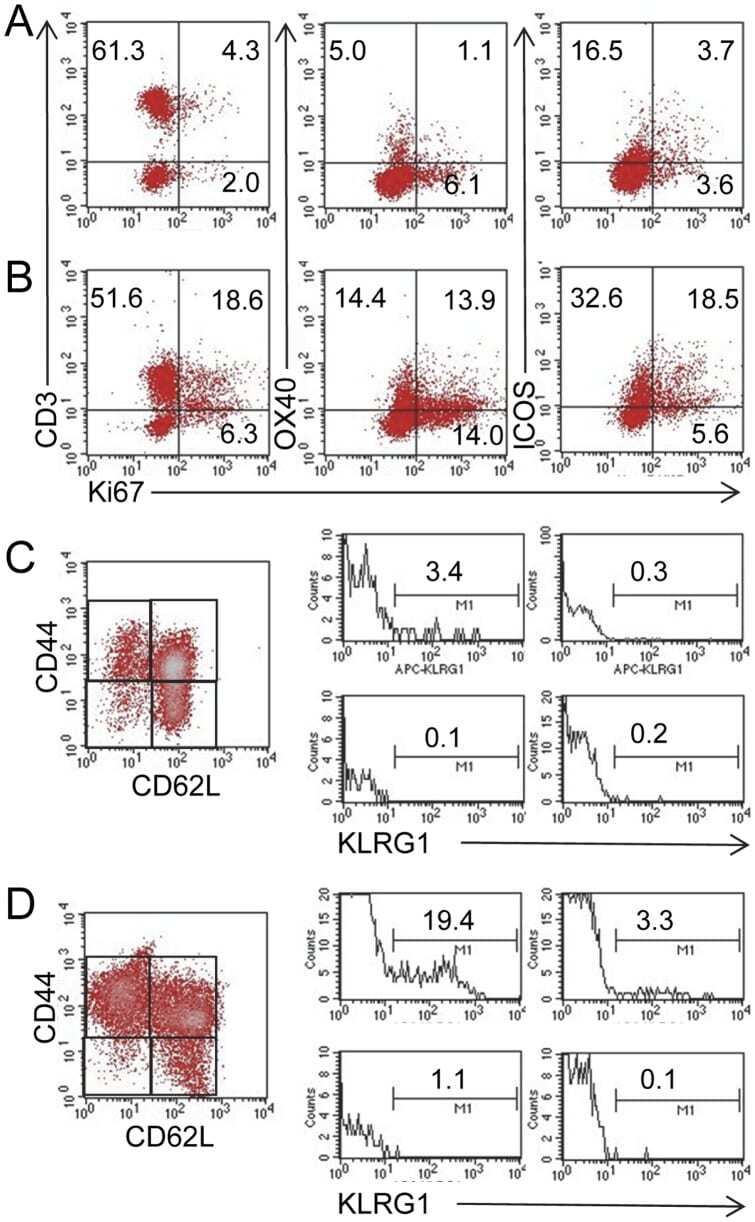
- Figure 5 MLN cells from Roquin san/san mice are proliferative and have more SLECs. Based on Ki67 staining, (panel B ) a greater proportion of OX40 + cells and ICOS + MLN cells were proliferating T cells compared to MLN cells from (panel A ) normal mice. Representative staining from 1 normal and 2 Roquin san/san mice. Similarly, there was a greater proportion of CD44 hi CD62L lo KLRG1 + SLECs present in MLN cells of (panel D ) Roquin san/san mice compared to (panel C ) normal mice. Representative data from 3 normal and 3 Roquin san/san mice.
- Conjugate
- Yellow dye
- Submitted by
- Invitrogen Antibodies (provider)
- Main image

- Experimental details
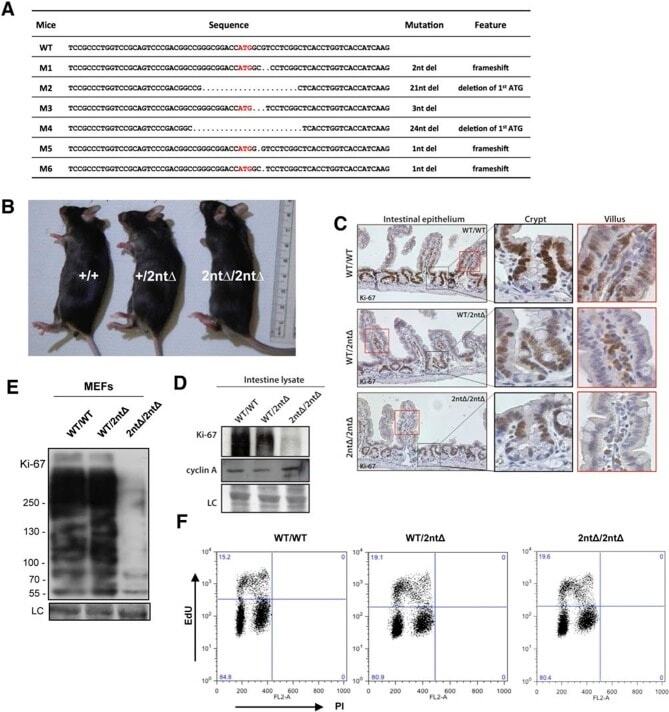
- Figure 3. Mouse development with a mutated Ki-67 gene. ( A ) Table describing Ki-67 mutant mouse lines resulting from germline transmission of mutations generated by cytoplasmic injection of TALEN-encoding mRNA into zygotes. ( B ) Macroscopic appearance of littermate female mice at 10 weeks of age. Genotypes are specified. ( C ) IHC staining of Ki-67 in sagittal section of intestine from Mki67 WT/WT , Mki67 WT/2nt and Mki67 2nt/2nt mice. ( D ) Western blots of Ki-67 and cyclin A expression from intestine isolated from Mki67 WT/WT , Mki67 WT/2nt and Mki67 2nt/2nt mice. LC, loading control. ( E ) Western blot of Ki-67 in MEFs from WT, Mki67 WT/2nt and Mki67 2nt/2nt mice. LC, loading control. ( F ) Flow cytometry profiles in WT, Mki67 WT/2nt and Mki67 2nt/2nt MEFs showing EdU incorporation upon a 1 hr pulse and DNA content. DOI: http://dx.doi.org/ Figure 3--figure supplement 1. Ki-67 mutant mice develop normally. ( A ) Pair of TALE-nucleases designed to target the initiator ATG of mouse Mki67 gene. ( B ) Sequencing traces of initiator ATG (underlined) of Mki67 gene in WT Mki67 +/+ (WT/WT), heterozygous Mki67 +/2nt (WT/2nt) and homozygous Mki67 2nt/2nt (2nt/2nt) mice. ( C ) Sequencing traces of initiator ATG (underlined) of Mki67 gene in WT Mki67 +/+ (WT/WT), heterozygous Mki67 +/21nt (WT/21nt) and homozygous Mki67 21nt/21nt (21nt/21nt) mice. ( D ) WT Mki67 +/+ (+/+), heterozygous Mki67 +/21nt (+/21nt) and homozygous Mki67 21nt/21nt (21nt/21nt) mice. DOI: http://dx.doi.org/ Figur
- Conjugate
- Yellow dye
- Submitted by
- Invitrogen Antibodies (provider)
- Main image

- Experimental details
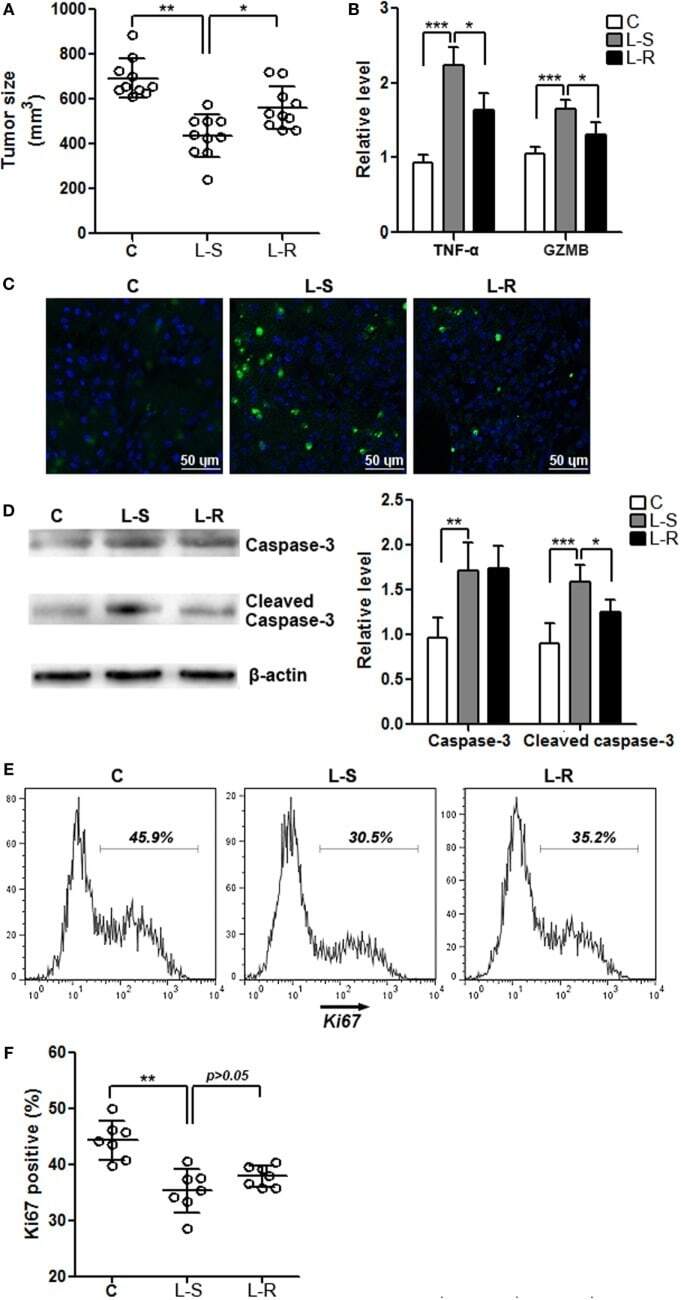
- Figure 5 Rik expression in CD8 + T cells favors tumor survival . (A) Tumor size. C: control mice receiving phosphate-buffered saline. L-S: mice receiving CD8 + T cells transduced with scramble lentiviruses. L-R: mice receiving CD8 + T cells transduced with Rik-expressing lentiviruses. Each circle represents an individual mouse. (B) mRNA levels of TNF-alpha and granzyme B in tumor tissues. N = 4 per group. (C) Tumor cell apoptosis is indicated by terminal deoxynucleotidyl transferase dUTP nick end labeling. This is a representative of three independent experiments. (D) Activation of caspase-3 in tumor tissues. Left panel: representative Immunoblot image. Right panel: statistics of caspase-3. N = 5 per group. (E,F) Tumor cell proliferation is demonstrated by Ki67 staining. Tumor implants were digested as described in Section "" Materials and Methods ."" Then the whole tissue was pressed through a 70-mum nylon mesh to prepare a single cell suspension, followed by staining with APC anti-CD45 and APC anti-CD31 antibodies. Cells were then stained for Ki67 as described in Section "" Materials and Methods ."" CD45 - CD31 - tumor cells were shown here. Representative histograms are shown in panel (E) , and statistical analysis for Ki67 + cells were shown in panel (F) . N = 7 per group (* p < 0.05; ** p < 0.01; *** p < 0.001).
- Conjugate
- Yellow dye
- Submitted by
- Invitrogen Antibodies (provider)
- Main image
- Experimental details
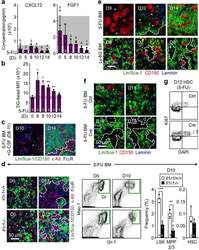
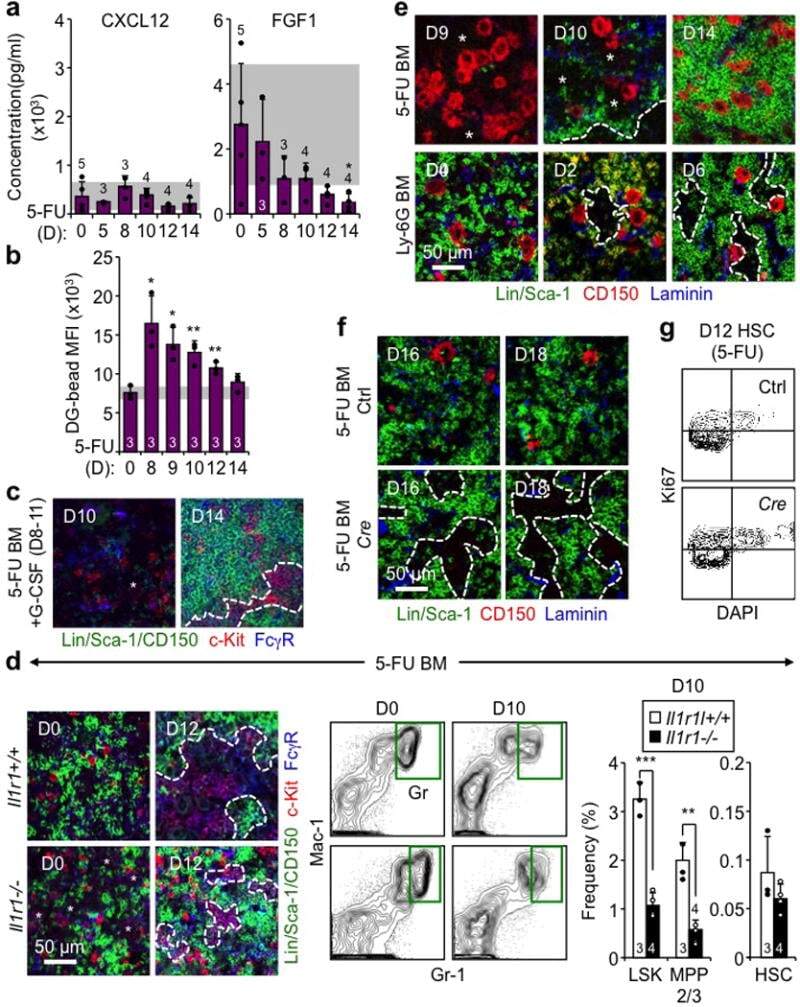
- Extended Data Fig. 9 Mechanisms controlling GMP cluster formation during regeneration a , ELISA measurement of cytokine levels in BM fluids of 5-FU-treated WT mice at the indicated days post-treatment. b , Quantification of vascular leakage in 5-FU-treated BM at the indicated days post-treatment. Results are expressed as dragon green (DG) microsphere MFI upon masking of laminin + blood vessels. c , Representative IF staining showing GMPs (purple) in 5-FU-treated BM with concomitant daily injections of G-CSF (+G) on d8-11. d , Investigation of 5-FU-treated Il1r1 +/+ and Il1r1 -/- mice at the indicated days post-treatment showing representative IF staining of GMPs (purple), FACS plots of Gr regeneration, and quantification of the indicated BM populations. e , Representative IF staining of CD150 + megakaryocytes (red) in 5-FU- and Ly-6G-treated BM. f , g , Megakaryocyte depletion studies in diphtheria toxin (DT) injected iDtr (Ctrl) and Cxcl4-Cre:iDtr ( Cre ) mice showing (f) representative IF staining of CD150 + megakaryocytes (red) at the indicated days post-5-FU, and (g) representative Ki67/DAPI staining of HSCs at d12 post-5-FU. Stars indicate pGMPs and dotted lines cGMPs. Results are expressed as mean +- S.D. (grey bars, reference range); *p
- Conjugate
- Yellow dye
- Submitted by
- Invitrogen Antibodies (provider)
- Main image
- Experimental details
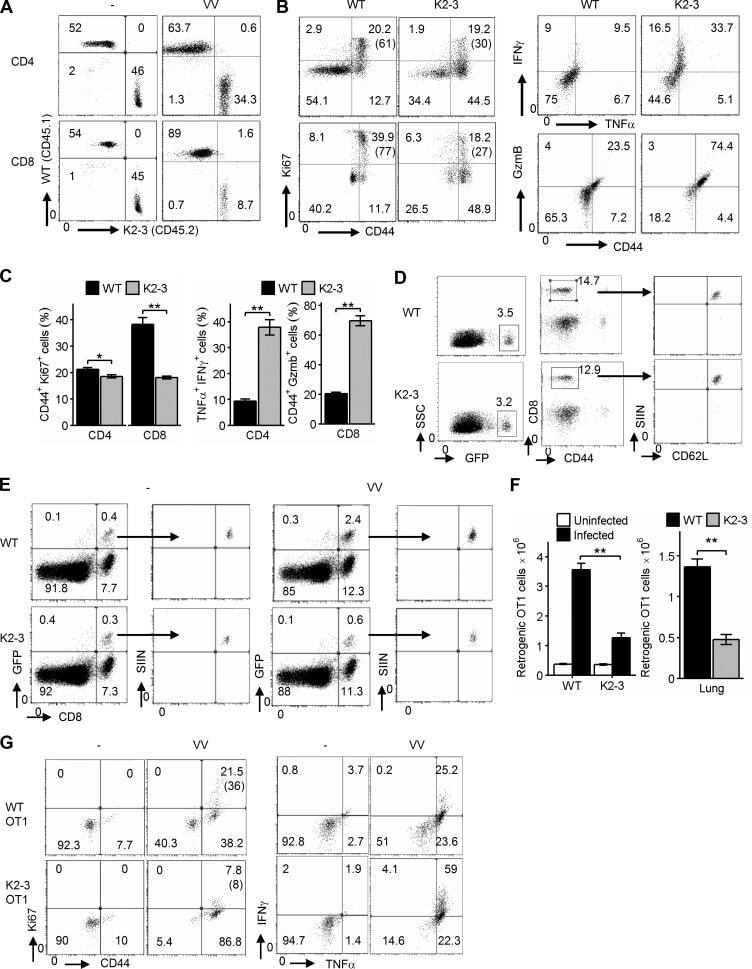
- Figure 4. Egr2 and 3 function is cell intrinsic. (A-C) Irradiated WT mice were adoptively transferred with an equal number of BM cells from WT and CD2-Egr2/3 -/- (K2-3) mice. 8 wk after transfer, mice were infected with OVA-VV WR and analyzed 7 d after infection. (A) Splenic cells from chimeric mice were stained with CD45.1, CD45.2, CD4, and CD8, and the proportion of WT (CD45.1) and K2-3 (CD45.2) CD4 and CD8 cells was determined by flow cytometry. (B and C) Gated WT (CD45.1) and K2-3 (CD45.2) CD4 and CD8 cells were analyzed for expression of the activation marker CD44 and the proliferation marker Ki67 (left) and TNF and IFNgamma for CD4 cells and granzyme B for CD8 cells (right). The percentages of Ki67 + cells among the CD44 high population are indicated in parentheses in B. (D-G) WT and K2-3 OT1 retrogenic T cells were analyzed in recipient mice before and after infection. (D) GFP + CD8 + CD44 lo cells were isolated from WT and K2-3 OT1 retrogenic mice (left and middle) and confirmed as CD62L + Kb-SIINFEKL-tetramer + cells (right). 3 x 10 5 to 5 x 10 5 WT or Egr2/3 -/- retrogenic-OT1 cells were adoptively transferred to separate naive WT mice. 1 d after transfer, mice were infected with OVA-VV WR and analyzed 7 d after infection. (E and F) Retrogenic-OT1 GFP + CD8 + Kb-SIINFEKL-tetramer + cells among spleen and lymph node cells from recipient mice were identified (E), and the numbers of WT and K2-3 retrogenic-OT1 cells in spleen and lymph nodes (left) and lung (right) were
- Conjugate
- Yellow dye
- Submitted by
- Invitrogen Antibodies (provider)
- Main image

- Experimental details
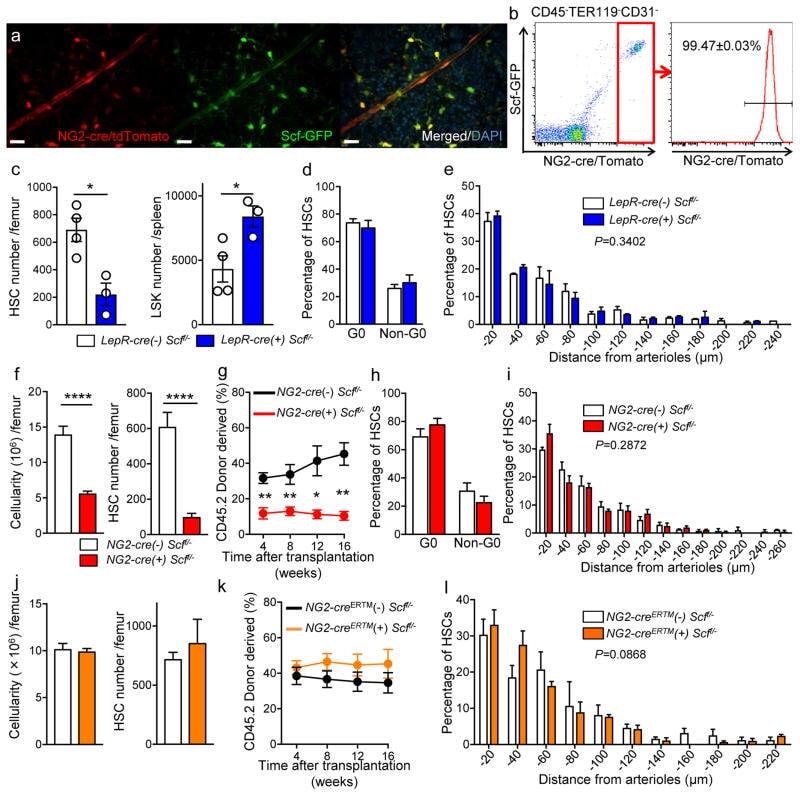
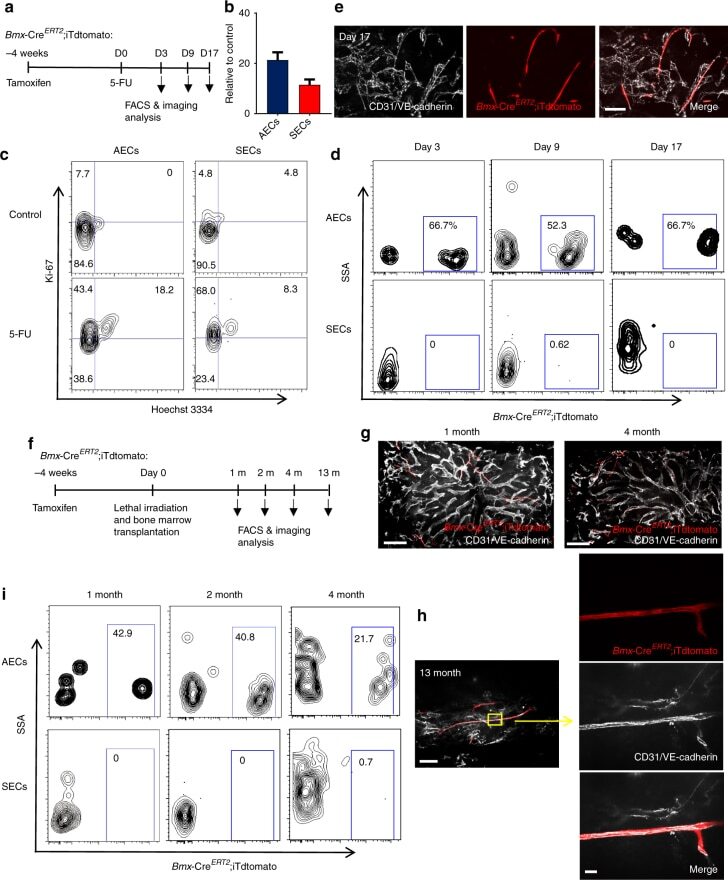
- Fig. 6 AECs self-regenerate, and do not regenerate SECs. a Scheme of experiment design. Bmx -Cre ERT2 ;iTdtomato mice were injected with Tamoxifen to activate Cre expression. Four weeks later, 5-FU was given to these mice and BM ECs were analysed by FACS and immunofluorescence analysis. b Numbers of AECs and SECs 3 days after 5-FU treatment. Data are represented as mean +- SEM. c Representative FACS plot of cell cycle analysis of AECs and SECs from control mice and mice treated with 5-FU (9 days after 5-FU) using Hoechst 3334 and Ki-67. d FACS plot of the labelling of AECs and SECs by Bmx -Cre ERT2 at different time points after 5-FU treatment. e Representative image of whole-mount sternum from mice treated as in ( a ). The bone was harvested on day 17 after 5-FU injection. Mice were injected i.v. with anti-VE-cadherin and anti-CD31. All panels show the same area for different channels. Scale bar, 50 mum. f Scheme of experiment design. Bmx -Cre ERT2 ;iTdtomato mice were injected with Tamoxifen to activate Cre expression. Four weeks later, these mice were lethally irradiated and transplanted with BM cells from wild-type mice. BM ECs were analysed by FACS and immunofluorescence analysis at different time points after lethal irradiation. g Representative images from whole-mount sternum at 1 month (left panel) and 4 months (right panel) after lethal irradiation. Mice were injected i.v. with anti-VE-cadherin and anti-CD31. Scale bar, 200 mum. h Images from whole-mount sternum in w
- Conjugate
- Yellow dye
- Submitted by
- Invitrogen Antibodies (provider)
- Main image
- Experimental details
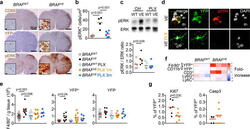
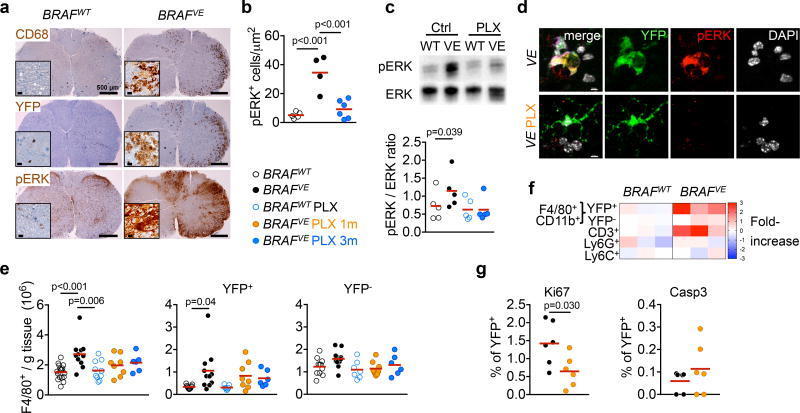
- Figure 3 ERK activation in BRAF V600E microglia (a) CD68, YFP and pERK staining in spinal cord from 7-month old mice. Scale bars=500um, 10um for insets. n=4 per group. (b) pERK + microglia in brainstem. Circles represent individual mice. One-way ANOVA. (c) ERK phosphorylation in spinal cords and brains from 6-9 month-old mice. Top: representative western blot, bottom: pERK/ERK ratio, n=5 per group. One-way ANOVA. (d) pERK expression in YFP + microglia from BRAF VE mice. n=5 per group. Scale bars=5um. (e) Numbers of microglia from 5-9 month-old mice Circles represent individual mice. One-way ANOVA. (f) Heatmap representation of cell frequency among CD45 + cells in the brain. n=3 per group. (g) Ki67 + and cleaved Caspase 3 + (Casp3) expression in YFP + microglia from 5-9 month-old BRAF VE mice, n=6 per group. Unpaired two-tailed t -test. See also Extended data Fig. 7 .
- Conjugate
- Yellow dye
- Submitted by
- Invitrogen Antibodies (provider)
- Main image
- Experimental details
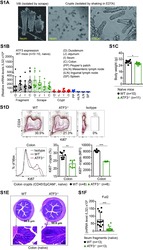
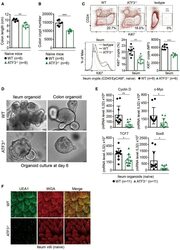
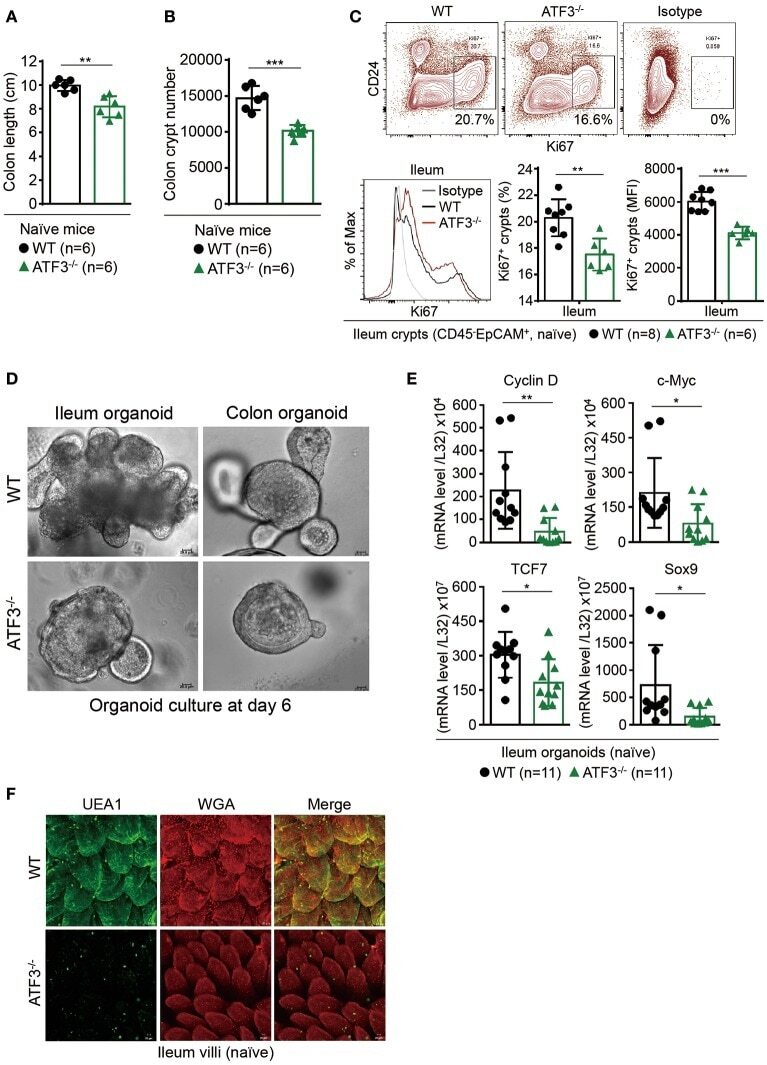
- Figure 1 ATF3 maintains intestinal homeostasis. (A) Comparison of colon length between naive mice as indicated. (B) Colon crypts from mice were isolated by shaking colon fragments in EDTA and counted under light microscopy. (C) Flow cytometry analysis of Ki67 and CD24 expression in ileum crypts, gated on the CD45 - EpCAM + populations, from the indicated naive mice. (D) Representative micrographs showing intestinal organoids derived from naive mice. (E) Quantitative real-time PCR analysis of cell cycle genes in naive ileum organoids at day 6 of culture (""n"" indicates organoids derived from 4 mice each group). (F) Representative confocal images of whole mount tissues with co-immunofluorescence staining of UEA-1 and WGA in naive ileum villi. Results were from at least two independent experiments and ""n"" refers to the number of mice unless indicated otherwise. All mice were at the age of 2~3 months old when analyzed. Statistical analysis was done using Multiple T -test on Prism software. * P < 0.05, ** P < 0.005, *** P < 0.0005.
- Conjugate
- Yellow dye
- Submitted by
- Invitrogen Antibodies (provider)
- Main image
- Experimental details
- Figure 3 ATF3 protects mice from DSS-induced colitis. (A) Experimental protocol of DSS-induced colitis was shown. (B) Survival rate in mice after DSS treatment. (C) Disease activity index (DAI), a composite measurement of weight loss percentage, stool consistency, and blood in stools, was indicated in each group of mice during DSS colitis. (D-G) Analysis of colitis severity at day-8 post DSS treatment. (D) Flow cytometry of Ki67 + proliferating crypt cells in CD24 low/- cell population. (E) TUNEL assay showing apoptotic cells in colon tissues. Magenta positive apoptotic cells were quantified per 100x high-power field (HPF) from 10 different views of colon section from each mouse. (F-G) Quantitative real-time PCR analysis of crypt cells at day-8 post DSS. (F) Expression of ATF3 and anti-microbial peptide-related genes. (G) Expression of ER stress-related genes. Results were from two independent experiments. ""n"" refers to the number of mice analyzed. Survival curve was calculated using the Kaplan-Meier method and statistical significance was calculated using Log rank (Mantel-Cox) test. Statistical analysis was done using Multiple T -test on Prism software. * P < 0.05, ** P < 0.005, *** P < 0.0005.
- Conjugate
- Yellow dye
- Submitted by
- Invitrogen Antibodies (provider)
- Main image
- Experimental details
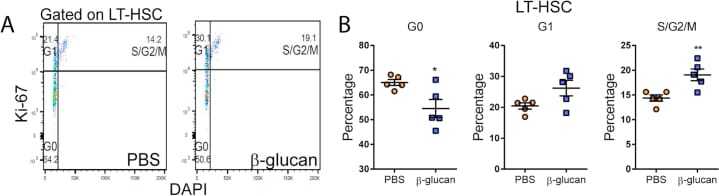
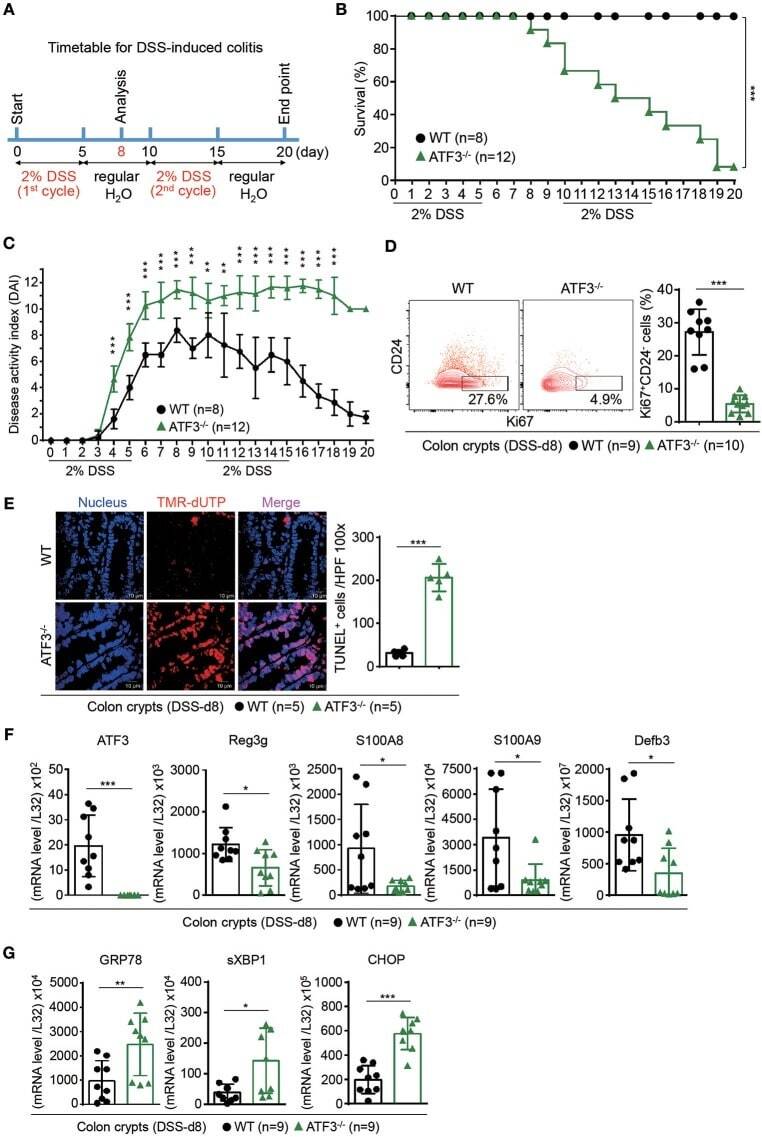
- Figure S1 Administration of beta-Glucan Promotes Cell Proliferation of LT-HSCs, Related to Figure 1 (A and B) Cell cycle analysis was performed in LT-HSC at 24h after the administration of PBS or beta-glucan by staining for Ki67 and DAPI. (A) Representative flow cytometry plots and (B) frequency of LT-HSC at different phases of the cell cycle (n = 5 mice per group). Data presented as mean +- SEM. * p < 0.05, ** p < 0.01.
- Conjugate
- Yellow dye