Explore
 Validate
 Learn
Learn Flow cytometry
Antibody data
- Antibody Data
- Antigen structure
- References [57]
- Comments [0]
- Validations
- Flow cytometry [1]
- Other assay [31]
Submit
Validation data
Reference
Comment
Report error
- Product number
- 25-5698-82 - Provider product page

- Provider
- Invitrogen Antibodies
- Product name
- Ki-67 Monoclonal Antibody (SolA15), PE-Cyanine7, eBioscience™
- Antibody type
- Monoclonal
- Antigen
- Other
- Description
- Description: The monoclonal antibody SolA15 recognizes mouse and rat Ki-67, a 300 kDa nuclear protein. Ki-67 is present during all active phases of the cell cycle (G1, S, G2, and mitosis), but is absent from resting cells (G0). Ki-67 is detected within the nucleus during interphase but redistributes to the chromosomes during mitosis. Ki-67 is used as a marker for determining the growth fraction of a given population of cells. In studies of tumor cells, the "Ki-67 labeling index" refers to the number of Ki-67 positive cells within the population and this is used to predict outcome of particular cancer types. Ki-67 has been shown to interact with the DNA-bound protein chromobox protein homolog 3 (CBX3) (heterochromatin). The SolA15 antibody also recognizes human, non-human primate and canine Ki-67. Applications Reported: This SolA15 antibody has been reported for use in intracellular staining followed by flow cytometric analysis. Applications Tested: This SolA15 antibody has been tested by intracellular staining and flow cytometric analysisusing the Foxp3/Transcription Factor Staining Buffer Set (Product # 00-5523-00) and protocol. Please see Best Protocols Section (Staining intracellular Antigens for Flow Cytometry) for staining protocol (refer to Protocol B: One-step protocol for intracellular (nuclear) proteins). This can be used at less than or equal to 0.125 µg per test. A test is defined as the amount (µg) of antibody that will stain a cell sample in a final volume of 100 µL. Cell number should be determined empirically but can range from 10^5 to 10^8 cells/test. It is recommended that the antibody be carefully titrated for optimal performance in the assay of interest. Light sensitivity: This tandem dye is sensitive photo-induced oxidation. Please protect this vial and stained samples from light. Fixation: Samples can be stored in IC Fixation Buffer (Product # 00-8222) (100 µL cell sample + 100 µL IC Fixation Buffer) or 1-step Fix/Lyse Solution (Product # 00-5333) for up to 3 days in the dark at 4°C with minimal impact on brightness and FRET efficiency/compensation. Some generalizations regarding fluorophore performance after fixation can be made, but clone specific performance should be determined empirically. Excitation: 488-561 nm; Emission: 775 nm; Laser: Blue Laser, Green Laser, Yellow-Green Laser. Filtration: 0.2 µm post-manufacturing filtered.
- Reactivity
- Human, Mouse, Rat, Canine
- Host
- Rat
- Isotype
- IgG
- Antibody clone number
- SolA15
- Vial size
- 100 µg
- Concentration
- 0.2 mg/mL
- Storage
- 4° C, store in dark, DO NOT FREEZE!
Submitted references IL-22 initiates an IL-18-dependent epithelial response circuit to enforce intestinal host defence.
Ddb1 Is Essential for the Expansion of CD4(+) Helper T Cells by Regulating Cell Cycle Progression and Cell Death.
Ubiquitin-specific peptidase 18 regulates the differentiation and function of Treg cells.
Obesity results in adipose tissue T cell exhaustion.
SRC-3 Functions as a Coactivator of T-bet by Regulating the Maturation and Antitumor Activity of Natural Killer Cells.
CX3CR1 positively regulates BCR signaling coupled with cell metabolism via negatively controlling actin remodeling.
Nanoparticle-Coupled Topical Methotrexate Can Normalize Immune Responses and Induce Tissue Remodeling in Psoriasis.
Diversity in medullary thymic epithelial cells controls the activity and availability of iNKT cells.
EBF1-deficient bone marrow stroma elicits persistent changes in HSC potential.
Microphthalmia transcription factor expression contributes to bone marrow failure in Fanconi anemia.
Gut-Innervating Nociceptor Neurons Regulate Peyer's Patch Microfold Cells and SFB Levels to Mediate Salmonella Host Defense.
Thymic iNKT single cell analyses unmask the common developmental program of mouse innate T cells.
Lumenal Galectin-9-Lamp2 interaction regulates lysosome and autophagy to prevent pathogenesis in the intestine and pancreas.
Landscape of Exhausted Virus-Specific CD8 T Cells in Chronic LCMV Infection.
Causes and Consequences of miR-150-5p Dysregulation in Myasthenia Gravis.
Calcitonin Gene-Related Peptide Negatively Regulates Alarmin-Driven Type 2 Innate Lymphoid Cell Responses.
A Subset of Skin Macrophages Contributes to the Surveillance and Regeneration of Local Nerves.
ATF3 Sustains IL-22-Induced STAT3 Phosphorylation to Maintain Mucosal Immunity Through Inhibiting Phosphatases.
Lymphotoxin α fine-tunes T cell clonal deletion by regulating thymic entry of antigen-presenting cells.
Adrenergic nerve degeneration in bone marrow drives aging of the hematopoietic stem cell niche.
Stem cell factor is selectively secreted by arterial endothelial cells in bone marrow.
The organic ester O,O'-diethyl-(S,S)-ethylenediamine-N,N'-di-2-(3-cyclohexyl)propanoate dihydrochloride attenuates murine breast cancer growth and metastasis.
Modulation of Myelopoiesis Progenitors Is an Integral Component of Trained Immunity.
MicroRNA-126 deficiency enhanced the activation and function of CD4(+) T cells by elevating IRS-1 pathway.
Fc Effector Function Contributes to the Activity of Human Anti-CTLA-4 Antibodies.
The Transcription Factor Runx3 Establishes Chromatin Accessibility of cis-Regulatory Landscapes that Drive Memory Cytotoxic T Lymphocyte Formation.
1810011o10 Rik Inhibits the Antitumor Effect of Intratumoral CD8(+) T Cells through Suppression of Notch2 Pathway in a Murine Hepatocellular Carcinoma Model.
A somatic mutation in erythro-myeloid progenitors causes neurodegenerative disease.
Neonatal pancreatic pericytes support β-cell proliferation.
Revisiting the Road Map of Medullary Thymic Epithelial Cell Differentiation.
Differential cytokine contributions of perivascular haematopoietic stem cell niches.
Egr2 and 3 control adaptive immune responses by temporally uncoupling expansion from T cell differentiation.
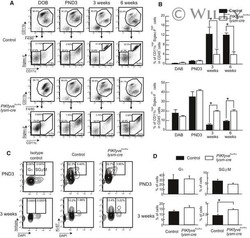
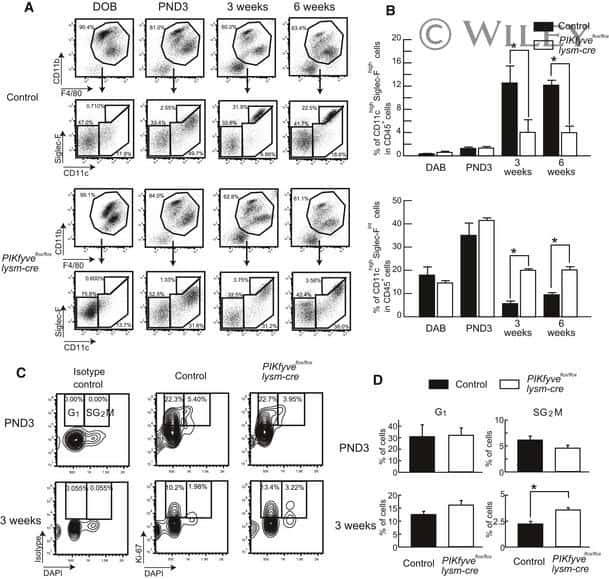
Deletion of PIKfyve alters alveolar macrophage populations and exacerbates allergic inflammation in mice.
Intestinal helminth infection induces highly functional resident memory CD4(+) T cells in mice.
Ablation of Transcription Factor IRF4 Promotes Transplant Acceptance by Driving Allogenic CD4(+) T Cell Dysfunction.
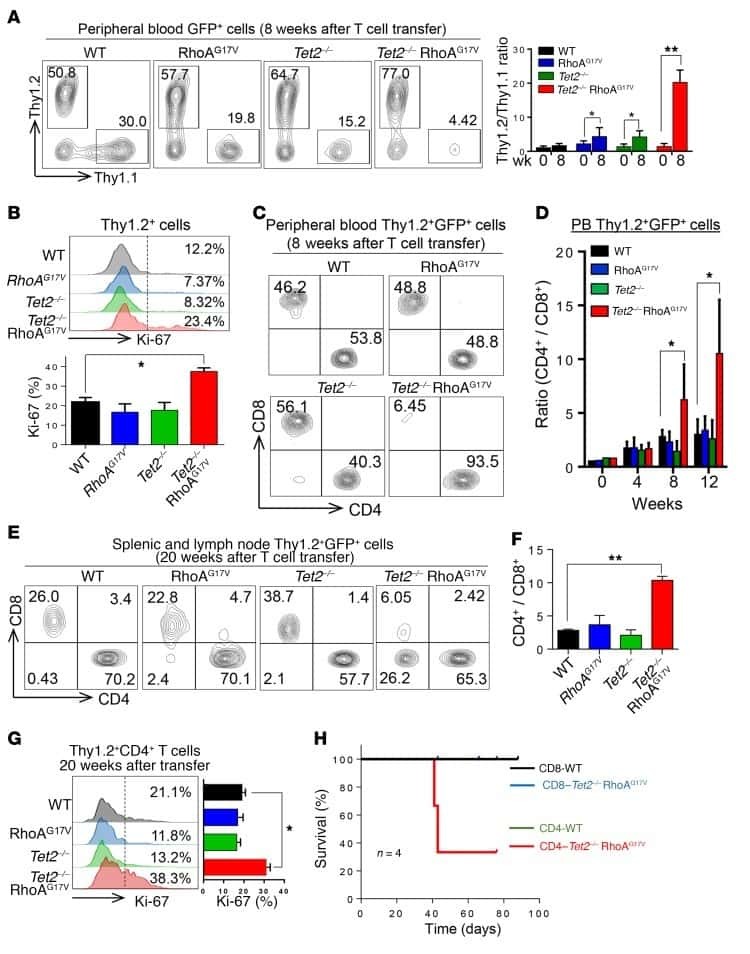
Mutations in 5-methylcytosine oxidase TET2 and RhoA cooperatively disrupt T cell homeostasis.
Myeloid progenitor cluster formation drives emergency and leukaemic myelopoiesis.
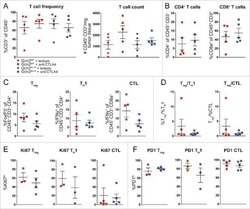
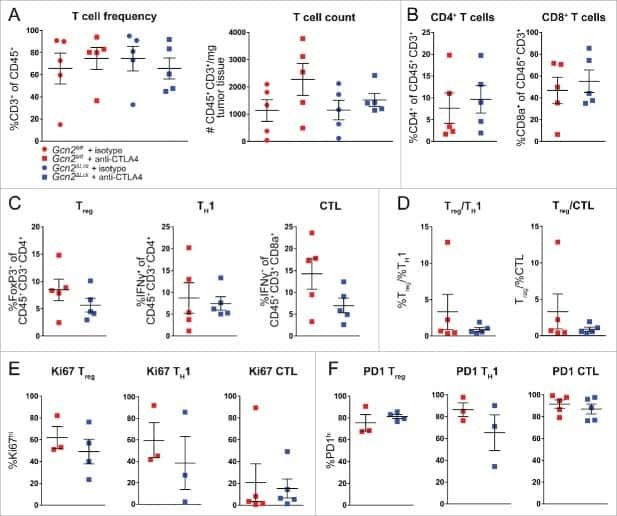
The stress kinase GCN2 does not mediate suppression of antitumor T cell responses by tryptophan catabolism in experimental melanomas.
Growth and metastasis of lung adenocarcinoma is potentiated by BMP4-mediated immunosuppression.
SWEF Proteins Distinctly Control Maintenance and Differentiation of Hematopoietic Stem Cells.
IL-2/α-IL-2 Complex Treatment Cannot Be Substituted for the Adoptive Transfer of Regulatory T cells to Promote Bone Marrow Engraftment.
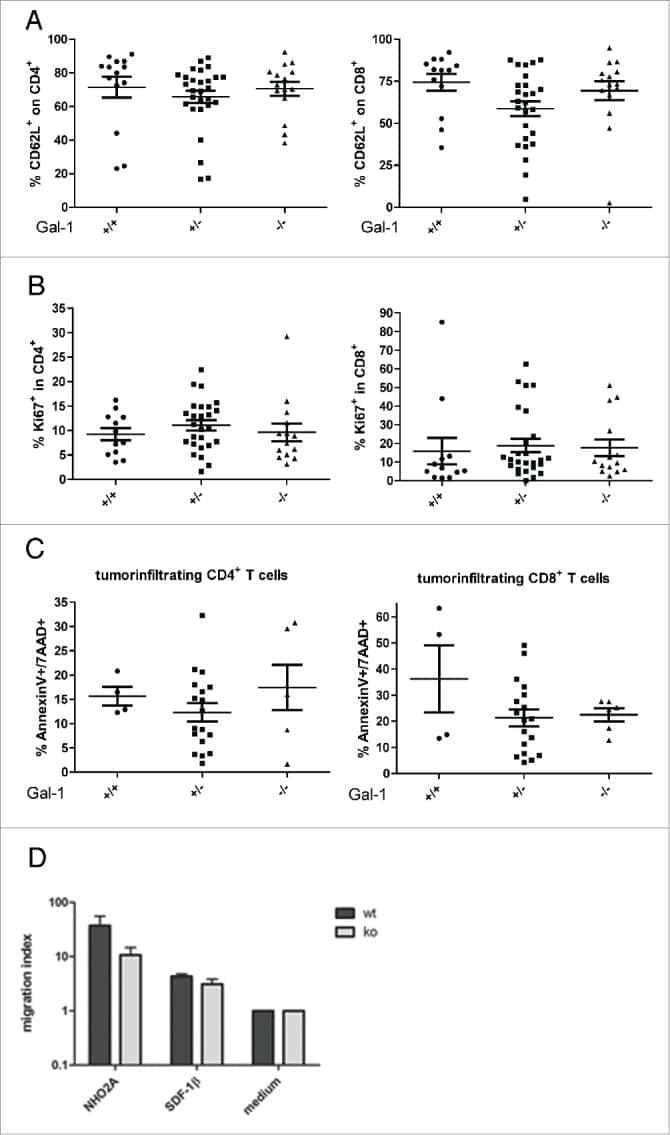
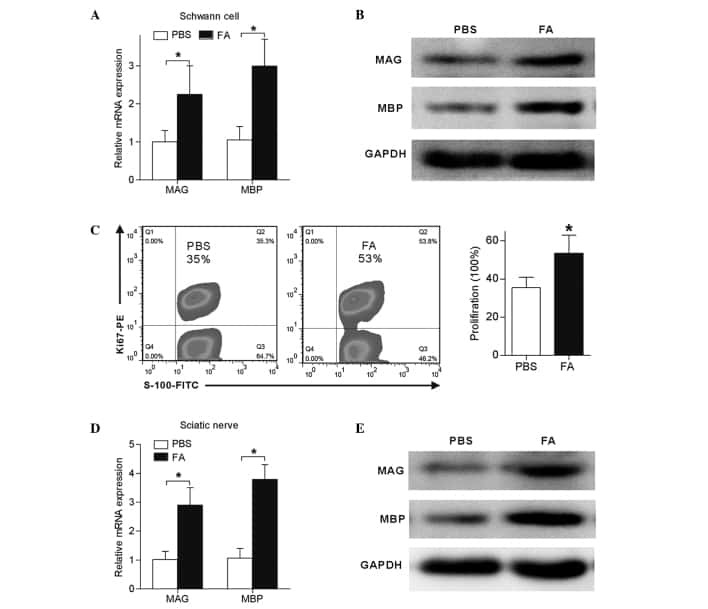
Schwann cell proliferation and differentiation that is induced by ferulic acid through MEK1/ERK1/2 signalling promotes peripheral nerve remyelination following crush injury in rats.
Macrophages transfer antigens to dendritic cells by releasing exosomes containing dead-cell-associated antigens partially through a ceramide-dependent pathway to enhance CD4(+) T-cell responses.
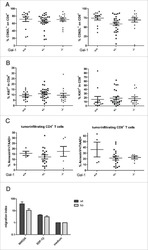
Immune response modulation by Galectin-1 in a transgenic model of neuroblastoma.
The cell proliferation antigen Ki-67 organises heterochromatin.
Efficient generation of monoclonal antibodies against peptide in the context of MHCII using magnetic enrichment.
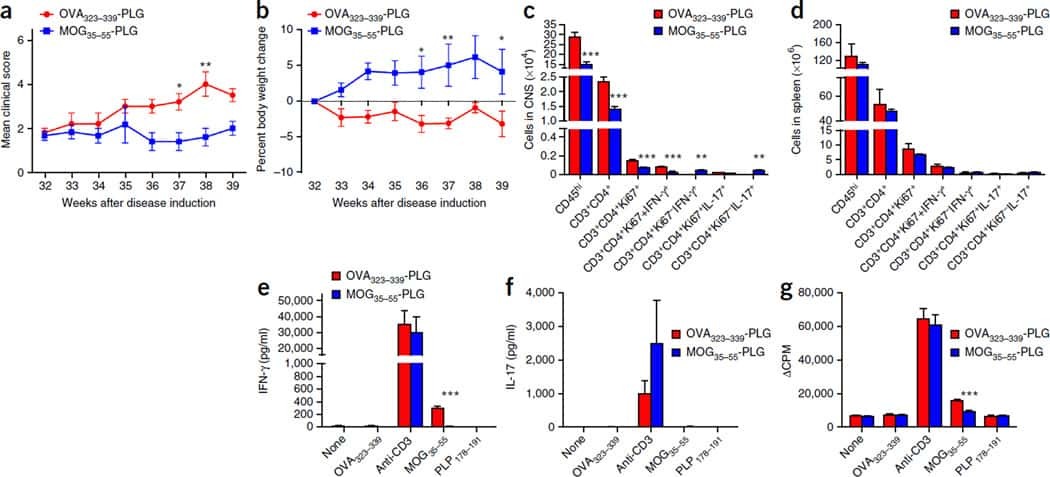
Oligodendrocyte death results in immune-mediated CNS demyelination.
CD8(+) T cells drive autoimmune hematopoietic stem cell dysfunction and bone marrow failure.
Foxp3 and Toll-like receptor signaling balance T(reg) cell anabolic metabolism for suppression.
Interdependent IL-7 and IFN-γ signalling in T-cell controls tumour eradication by combined α-CTLA-4+α-PD-1 therapy.
Mammary Stem Cells and Tumor-Initiating Cells Are More Resistant to Apoptosis and Exhibit Increased DNA Repair Activity in Response to DNA Damage.
Epidermal keratinocytes initiate wound healing and pro-inflammatory immune responses following percutaneous schistosome infection.
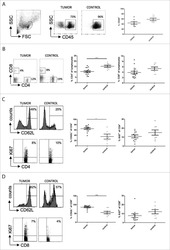
Metastasis is regulated via microRNA-200/ZEB1 axis control of tumour cell PD-L1 expression and intratumoral immunosuppression.
Myeloid cells expressing VEGF and arginase-1 following uptake of damaged retinal pigment epithelium suggests potential mechanism that drives the onset of choroidal angiogenesis in mice.
Small intestine inflammation in Roquin-mutant and Roquin-deficient mice.
IL-1R signaling in dendritic cells replaces pattern-recognition receptors in promoting CD8⁺ T cell responses to influenza A virus.
Primate B-1 cells generate antigen-specific B cell responses to T cell-independent type 2 antigens.
Chiang HY, Lu HH, Sudhakar JN, Chen YW, Shih NS, Weng YT, Shui JW
Nature communications 2022 Feb 15;13(1):874
Nature communications 2022 Feb 15;13(1):874
Ddb1 Is Essential for the Expansion of CD4(+) Helper T Cells by Regulating Cell Cycle Progression and Cell Death.
Yang L, Chen W, Li L, Xiao Y, Fan S, Zhang Q, Xia T, Li M, Hong Y, Zhao T, Li Q, Liu WH, Xiao N
Frontiers in immunology 2021;12:722273
Frontiers in immunology 2021;12:722273
Ubiquitin-specific peptidase 18 regulates the differentiation and function of Treg cells.
Yang L, Jing Y, Kang D, Jiang P, Li N, Zhou X, Chen Y, Westerberg LS, Liu C
Genes & diseases 2021 May;8(3):344-352
Genes & diseases 2021 May;8(3):344-352
Obesity results in adipose tissue T cell exhaustion.
Porsche CE, Delproposto JB, Geletka L, O'Rourke R, Lumeng CN
JCI insight 2021 Apr 22;6(8)
JCI insight 2021 Apr 22;6(8)
SRC-3 Functions as a Coactivator of T-bet by Regulating the Maturation and Antitumor Activity of Natural Killer Cells.
Hu M, Lu Y, Qi Y, Zhang Z, Wang S, Xu Y, Chen F, Tang Y, Chen S, Chen M, Du C, Shen M, Wang F, Su Y, Deng Y, Wang J
Cancer immunology research 2020 Sep;8(9):1150-1162
Cancer immunology research 2020 Sep;8(9):1150-1162
CX3CR1 positively regulates BCR signaling coupled with cell metabolism via negatively controlling actin remodeling.
Li N, Jiang P, Chen A, Luo X, Jing Y, Yang L, Kang D, Chen Q, Liu J, Chang J, Jellusova J, Miller H, Westerberg L, Wang CY, Gong Q, Liu C
Cellular and molecular life sciences : CMLS 2020 Nov;77(21):4379-4395
Cellular and molecular life sciences : CMLS 2020 Nov;77(21):4379-4395
Nanoparticle-Coupled Topical Methotrexate Can Normalize Immune Responses and Induce Tissue Remodeling in Psoriasis.
Özcan A, Sahin D, Impellizzieri D, Nguyen TT, Hafner J, Yawalkar N, Kurzbach D, Tan G, Akdis CA, Nilsson J, Boyman O, Kolios AGA
The Journal of investigative dermatology 2020 May;140(5):1003-1014.e8
The Journal of investigative dermatology 2020 May;140(5):1003-1014.e8
Diversity in medullary thymic epithelial cells controls the activity and availability of iNKT cells.
Lucas B, White AJ, Cosway EJ, Parnell SM, James KD, Jones ND, Ohigashi I, Takahama Y, Jenkinson WE, Anderson G
Nature communications 2020 May 4;11(1):2198
Nature communications 2020 May 4;11(1):2198
EBF1-deficient bone marrow stroma elicits persistent changes in HSC potential.
Derecka M, Herman JS, Cauchy P, Ramamoorthy S, Lupar E, Grün D, Grosschedl R
Nature immunology 2020 Mar;21(3):261-273
Nature immunology 2020 Mar;21(3):261-273
Microphthalmia transcription factor expression contributes to bone marrow failure in Fanconi anemia.
Oppezzo A, Bourseguin J, Renaud E, Pawlikowska P, Rosselli F
The Journal of clinical investigation 2020 Mar 2;130(3):1377-1391
The Journal of clinical investigation 2020 Mar 2;130(3):1377-1391
Gut-Innervating Nociceptor Neurons Regulate Peyer's Patch Microfold Cells and SFB Levels to Mediate Salmonella Host Defense.
Lai NY, Musser MA, Pinho-Ribeiro FA, Baral P, Jacobson A, Ma P, Potts DE, Chen Z, Paik D, Soualhi S, Yan Y, Misra A, Goldstein K, Lagomarsino VN, Nordstrom A, Sivanathan KN, Wallrapp A, Kuchroo VK, Nowarski R, Starnbach MN, Shi H, Surana NK, An D, Wu C, Huh JR, Rao M, Chiu IM
Cell 2020 Jan 9;180(1):33-49.e22
Cell 2020 Jan 9;180(1):33-49.e22
Thymic iNKT single cell analyses unmask the common developmental program of mouse innate T cells.
Harsha Krovi S, Zhang J, Michaels-Foster MJ, Brunetti T, Loh L, Scott-Browne J, Gapin L
Nature communications 2020 Dec 7;11(1):6238
Nature communications 2020 Dec 7;11(1):6238
Lumenal Galectin-9-Lamp2 interaction regulates lysosome and autophagy to prevent pathogenesis in the intestine and pancreas.
Sudhakar JN, Lu HH, Chiang HY, Suen CS, Hwang MJ, Wu SY, Shen CN, Chang YM, Li FA, Liu FT, Shui JW
Nature communications 2020 Aug 27;11(1):4286
Nature communications 2020 Aug 27;11(1):4286
Landscape of Exhausted Virus-Specific CD8 T Cells in Chronic LCMV Infection.
Sandu I, Cerletti D, Oetiker N, Borsa M, Wagen F, Spadafora I, Welten SPM, Stolz U, Oxenius A, Claassen M
Cell reports 2020 Aug 25;32(8):108078
Cell reports 2020 Aug 25;32(8):108078
Causes and Consequences of miR-150-5p Dysregulation in Myasthenia Gravis.
Cron MA, Maillard S, Truffault F, Gualeni AV, Gloghini A, Fadel E, Guihaire J, Behin A, Berrih-Aknin S, Le Panse R
Frontiers in immunology 2019;10:539
Frontiers in immunology 2019;10:539
Calcitonin Gene-Related Peptide Negatively Regulates Alarmin-Driven Type 2 Innate Lymphoid Cell Responses.
Wallrapp A, Burkett PR, Riesenfeld SJ, Kim SJ, Christian E, Abdulnour RE, Thakore PI, Schnell A, Lambden C, Herbst RH, Khan P, Tsujikawa K, Xavier RJ, Chiu IM, Levy BD, Regev A, Kuchroo VK
Immunity 2019 Oct 15;51(4):709-723.e6
Immunity 2019 Oct 15;51(4):709-723.e6
A Subset of Skin Macrophages Contributes to the Surveillance and Regeneration of Local Nerves.
Kolter J, Feuerstein R, Zeis P, Hagemeyer N, Paterson N, d'Errico P, Baasch S, Amann L, Masuda T, Lösslein A, Gharun K, Meyer-Luehmann M, Waskow C, Franzke CW, Grün D, Lämmermann T, Prinz M, Henneke P
Immunity 2019 Jun 18;50(6):1482-1497.e7
Immunity 2019 Jun 18;50(6):1482-1497.e7
ATF3 Sustains IL-22-Induced STAT3 Phosphorylation to Maintain Mucosal Immunity Through Inhibiting Phosphatases.
Glal D, Sudhakar JN, Lu HH, Liu MC, Chiang HY, Liu YC, Cheng CF, Shui JW
Frontiers in immunology 2018;9:2522
Frontiers in immunology 2018;9:2522
Lymphotoxin α fine-tunes T cell clonal deletion by regulating thymic entry of antigen-presenting cells.
Lopes N, Charaix J, Cédile O, Sergé A, Irla M
Nature communications 2018 Mar 28;9(1):1262
Nature communications 2018 Mar 28;9(1):1262
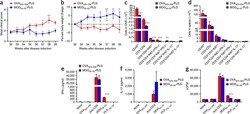
Adrenergic nerve degeneration in bone marrow drives aging of the hematopoietic stem cell niche.
Maryanovich M, Zahalka AH, Pierce H, Pinho S, Nakahara F, Asada N, Wei Q, Wang X, Ciero P, Xu J, Leftin A, Frenette PS
Nature medicine 2018 Jun;24(6):782-791
Nature medicine 2018 Jun;24(6):782-791
Stem cell factor is selectively secreted by arterial endothelial cells in bone marrow.
Xu C, Gao X, Wei Q, Nakahara F, Zimmerman SE, Mar J, Frenette PS
Nature communications 2018 Jun 22;9(1):2449
Nature communications 2018 Jun 22;9(1):2449
The organic ester O,O'-diethyl-(S,S)-ethylenediamine-N,N'-di-2-(3-cyclohexyl)propanoate dihydrochloride attenuates murine breast cancer growth and metastasis.
Jurisevic M, Arsenijevic A, Pantic J, Gajovic N, Milovanovic J, Milovanovic M, Poljarevic J, Sabo T, Vojvodic D, Radosavljevic GD, Arsenijevic N
Oncotarget 2018 Jun 15;9(46):28195-28212
Oncotarget 2018 Jun 15;9(46):28195-28212
Modulation of Myelopoiesis Progenitors Is an Integral Component of Trained Immunity.
Mitroulis I, Ruppova K, Wang B, Chen LS, Grzybek M, Grinenko T, Eugster A, Troullinaki M, Palladini A, Kourtzelis I, Chatzigeorgiou A, Schlitzer A, Beyer M, Joosten LAB, Isermann B, Lesche M, Petzold A, Simons K, Henry I, Dahl A, Schultze JL, Wielockx B, Zamboni N, Mirtschink P, Coskun Ü, Hajishengallis G, Netea MG, Chavakis T
Cell 2018 Jan 11;172(1-2):147-161.e12
Cell 2018 Jan 11;172(1-2):147-161.e12
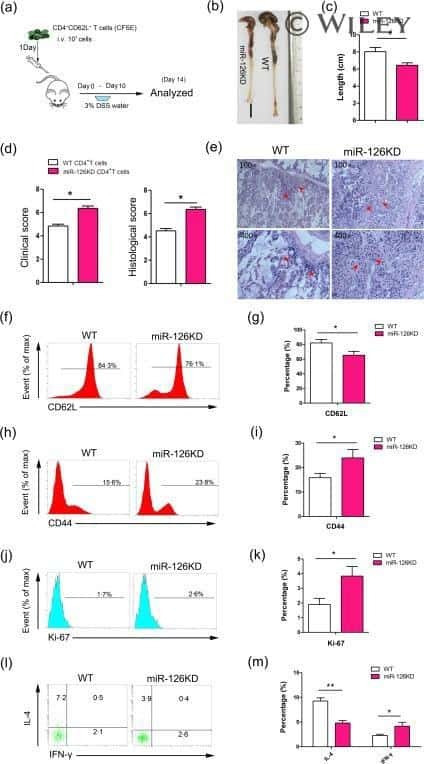
MicroRNA-126 deficiency enhanced the activation and function of CD4(+) T cells by elevating IRS-1 pathway.
Chu F, Hu Y, Zhou Y, Guo M, Lu J, Zheng W, Xu H, Zhao J, Xu L
Clinical and experimental immunology 2018 Feb;191(2):166-179
Clinical and experimental immunology 2018 Feb;191(2):166-179
Fc Effector Function Contributes to the Activity of Human Anti-CTLA-4 Antibodies.
Arce Vargas F, Furness AJS, Litchfield K, Joshi K, Rosenthal R, Ghorani E, Solomon I, Lesko MH, Ruef N, Roddie C, Henry JY, Spain L, Ben Aissa A, Georgiou A, Wong YNS, Smith M, Strauss D, Hayes A, Nicol D, O'Brien T, Mårtensson L, Ljungars A, Teige I, Frendéus B, TRACERx Melanoma, TRACERx Renal, TRACERx Lung consortia, Pule M, Marafioti T, Gore M, Larkin J, Turajlic S, Swanton C, Peggs KS, Quezada SA
Cancer cell 2018 Apr 9;33(4):649-663.e4
Cancer cell 2018 Apr 9;33(4):649-663.e4
The Transcription Factor Runx3 Establishes Chromatin Accessibility of cis-Regulatory Landscapes that Drive Memory Cytotoxic T Lymphocyte Formation.
Wang D, Diao H, Getzler AJ, Rogal W, Frederick MA, Milner J, Yu B, Crotty S, Goldrath AW, Pipkin ME
Immunity 2018 Apr 17;48(4):659-674.e6
Immunity 2018 Apr 17;48(4):659-674.e6
1810011o10 Rik Inhibits the Antitumor Effect of Intratumoral CD8(+) T Cells through Suppression of Notch2 Pathway in a Murine Hepatocellular Carcinoma Model.
Dai K, Huang L, Huang YB, Chen ZB, Yang LH, Jiang YA
Frontiers in immunology 2017;8:320
Frontiers in immunology 2017;8:320
A somatic mutation in erythro-myeloid progenitors causes neurodegenerative disease.
Mass E, Jacome-Galarza CE, Blank T, Lazarov T, Durham BH, Ozkaya N, Pastore A, Schwabenland M, Chung YR, Rosenblum MK, Prinz M, Abdel-Wahab O, Geissmann F
Nature 2017 Sep 21;549(7672):389-393
Nature 2017 Sep 21;549(7672):389-393
Neonatal pancreatic pericytes support β-cell proliferation.
Epshtein A, Rachi E, Sakhneny L, Mizrachi S, Baer D, Landsman L
Molecular metabolism 2017 Oct;6(10):1330-1338
Molecular metabolism 2017 Oct;6(10):1330-1338
Revisiting the Road Map of Medullary Thymic Epithelial Cell Differentiation.
Michel C, Miller CN, Küchler R, Brors B, Anderson MS, Kyewski B, Pinto S
Journal of immunology (Baltimore, Md. : 1950) 2017 Nov 15;199(10):3488-3503
Journal of immunology (Baltimore, Md. : 1950) 2017 Nov 15;199(10):3488-3503
Differential cytokine contributions of perivascular haematopoietic stem cell niches.
Asada N, Kunisaki Y, Pierce H, Wang Z, Fernandez NF, Birbrair A, Ma'ayan A, Frenette PS
Nature cell biology 2017 Mar;19(3):214-223
Nature cell biology 2017 Mar;19(3):214-223
Egr2 and 3 control adaptive immune responses by temporally uncoupling expansion from T cell differentiation.
Miao T, Symonds ALJ, Singh R, Symonds JD, Ogbe A, Omodho B, Zhu B, Li S, Wang P
The Journal of experimental medicine 2017 Jun 5;214(6):1787-1808
The Journal of experimental medicine 2017 Jun 5;214(6):1787-1808
Deletion of PIKfyve alters alveolar macrophage populations and exacerbates allergic inflammation in mice.
Kawasaki T, Ito K, Miyata H, Akira S, Kawai T
The EMBO journal 2017 Jun 14;36(12):1707-1718
The EMBO journal 2017 Jun 14;36(12):1707-1718
Intestinal helminth infection induces highly functional resident memory CD4(+) T cells in mice.
Steinfelder S, Rausch S, Michael D, Kühl AA, Hartmann S
European journal of immunology 2017 Feb;47(2):353-363
European journal of immunology 2017 Feb;47(2):353-363
Ablation of Transcription Factor IRF4 Promotes Transplant Acceptance by Driving Allogenic CD4(+) T Cell Dysfunction.
Wu J, Zhang H, Shi X, Xiao X, Fan Y, Minze LJ, Wang J, Ghobrial RM, Xia J, Sciammas R, Li XC, Chen W
Immunity 2017 Dec 19;47(6):1114-1128.e6
Immunity 2017 Dec 19;47(6):1114-1128.e6
Mutations in 5-methylcytosine oxidase TET2 and RhoA cooperatively disrupt T cell homeostasis.
Zang S, Li J, Yang H, Zeng H, Han W, Zhang J, Lee M, Moczygemba M, Isgandarova S, Yang Y, Zhou Y, Rao A, You MJ, Sun D, Huang Y
The Journal of clinical investigation 2017 Aug 1;127(8):2998-3012
The Journal of clinical investigation 2017 Aug 1;127(8):2998-3012
Myeloid progenitor cluster formation drives emergency and leukaemic myelopoiesis.
Hérault A, Binnewies M, Leong S, Calero-Nieto FJ, Zhang SY, Kang YA, Wang X, Pietras EM, Chu SH, Barry-Holson K, Armstrong S, Göttgens B, Passegué E
Nature 2017 Apr 6;544(7648):53-58
Nature 2017 Apr 6;544(7648):53-58
The stress kinase GCN2 does not mediate suppression of antitumor T cell responses by tryptophan catabolism in experimental melanomas.
Sonner JK, Deumelandt K, Ott M, Thomé CM, Rauschenbach KJ, Schulz S, Munteanu B, Mohapatra S, Adam I, Hofer AC, Feuerer M, Opitz CA, Hopf C, Wick W, Platten M
Oncoimmunology 2016;5(12):e1240858
Oncoimmunology 2016;5(12):e1240858
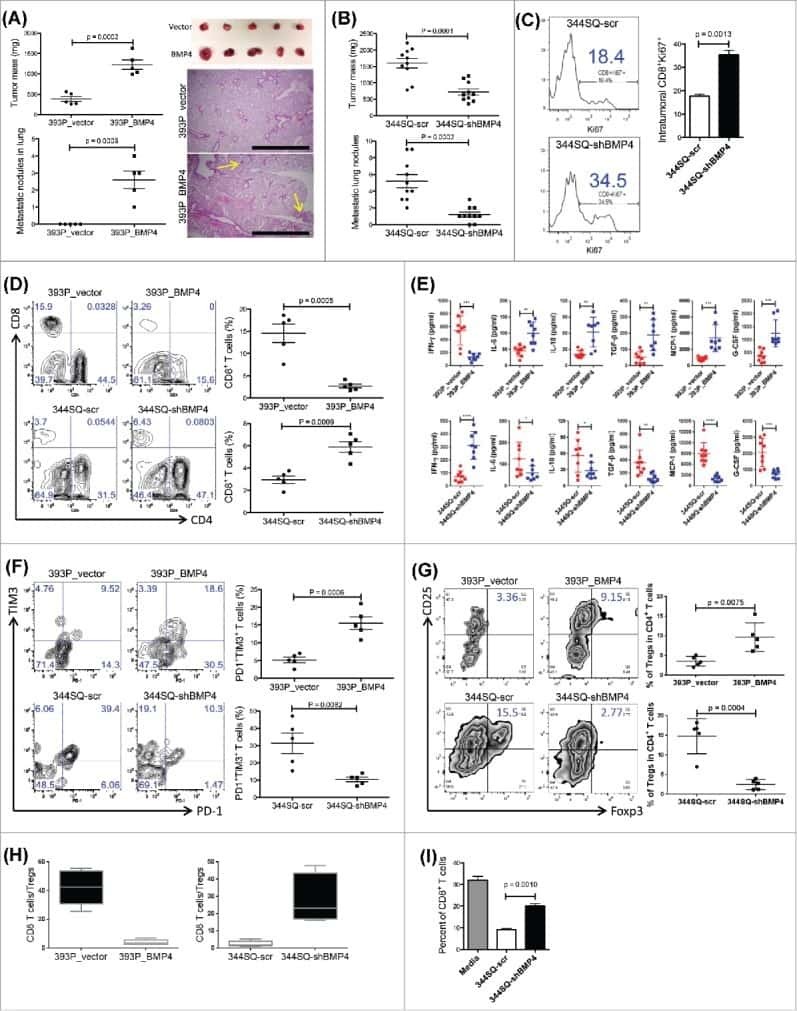
Growth and metastasis of lung adenocarcinoma is potentiated by BMP4-mediated immunosuppression.
Chen L, Yi X, Goswami S, Ahn YH, Roybal JD, Yang Y, Diao L, Peng D, Peng D, Fradette JJ, Wang J, Byers LA, Kurie JM, Ullrich SE, Qin FX, Gibbons DL
Oncoimmunology 2016;5(11):e1234570
Oncoimmunology 2016;5(11):e1234570
SWEF Proteins Distinctly Control Maintenance and Differentiation of Hematopoietic Stem Cells.
Ripich T, Chacón-Martínez CA, Fischer L, Pernis A, Kiessling N, Garbe AI, Jessberger R
PloS one 2016;11(8):e0161060
PloS one 2016;11(8):e0161060
IL-2/α-IL-2 Complex Treatment Cannot Be Substituted for the Adoptive Transfer of Regulatory T cells to Promote Bone Marrow Engraftment.
Mahr B, Unger L, Hock K, Pilat N, Baranyi U, Schwarz C, Maschke S, Farkas AM, Wekerle T
PloS one 2016;11(1):e0146245
PloS one 2016;11(1):e0146245
Schwann cell proliferation and differentiation that is induced by ferulic acid through MEK1/ERK1/2 signalling promotes peripheral nerve remyelination following crush injury in rats.
Zhu X, Li K, Guo X, Wang J, Xiang Y
Experimental and therapeutic medicine 2016 Sep;12(3):1915-1921
Experimental and therapeutic medicine 2016 Sep;12(3):1915-1921
Macrophages transfer antigens to dendritic cells by releasing exosomes containing dead-cell-associated antigens partially through a ceramide-dependent pathway to enhance CD4(+) T-cell responses.
Xu Y, Liu Y, Yang C, Kang L, Wang M, Hu J, He H, Song W, Tang H
Immunology 2016 Oct;149(2):157-71
Immunology 2016 Oct;149(2):157-71
Immune response modulation by Galectin-1 in a transgenic model of neuroblastoma.
Büchel G, Schulte JH, Harrison L, Batzke K, Schüller U, Hansen W, Schramm A
Oncoimmunology 2016 May;5(5):e1131378
Oncoimmunology 2016 May;5(5):e1131378
The cell proliferation antigen Ki-67 organises heterochromatin.
Sobecki M, Mrouj K, Camasses A, Parisis N, Nicolas E, Llères D, Gerbe F, Prieto S, Krasinska L, David A, Eguren M, Birling MC, Urbach S, Hem S, Déjardin J, Malumbres M, Jay P, Dulic V, Lafontaine DLj, Feil R, Fisher D
eLife 2016 Mar 7;5:e13722
eLife 2016 Mar 7;5:e13722
Efficient generation of monoclonal antibodies against peptide in the context of MHCII using magnetic enrichment.
Spanier JA, Frederick DR, Taylor JJ, Heffernan JR, Kotov DI, Martinov T, Osum KC, Ruggiero JL, Rust BJ, Landry SJ, Jenkins MK, McLachlan JB, Fife BT
Nature communications 2016 Jun 13;7:11804
Nature communications 2016 Jun 13;7:11804
Oligodendrocyte death results in immune-mediated CNS demyelination.
Traka M, Podojil JR, McCarthy DP, Miller SD, Popko B
Nature neuroscience 2016 Jan;19(1):65-74
Nature neuroscience 2016 Jan;19(1):65-74
CD8(+) T cells drive autoimmune hematopoietic stem cell dysfunction and bone marrow failure.
Gravano DM, Al-Kuhlani M, Davini D, Sanders PD, Manilay JO, Hoyer KK
Journal of autoimmunity 2016 Dec;75:58-67
Journal of autoimmunity 2016 Dec;75:58-67
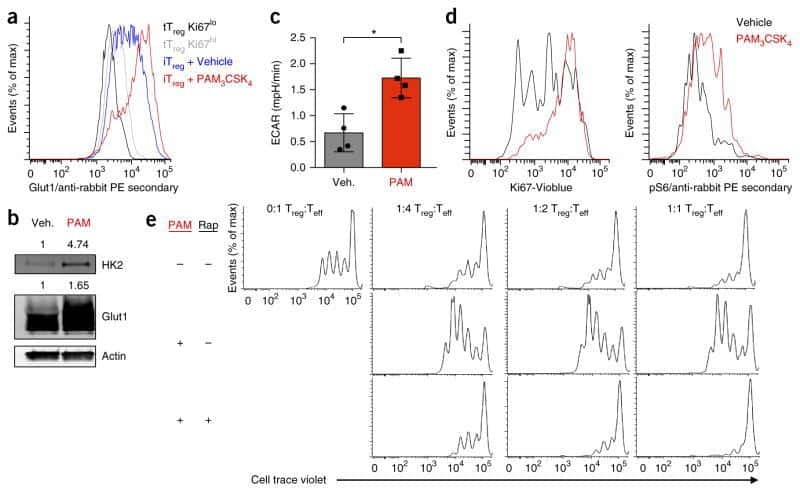
Foxp3 and Toll-like receptor signaling balance T(reg) cell anabolic metabolism for suppression.
Gerriets VA, Kishton RJ, Johnson MO, Cohen S, Siska PJ, Nichols AG, Warmoes MO, de Cubas AA, MacIver NJ, Locasale JW, Turka LA, Wells AD, Rathmell JC
Nature immunology 2016 Dec;17(12):1459-1466
Nature immunology 2016 Dec;17(12):1459-1466
Interdependent IL-7 and IFN-γ signalling in T-cell controls tumour eradication by combined α-CTLA-4+α-PD-1 therapy.
Shi LZ, Fu T, Guan B, Chen J, Blando JM, Allison JP, Xiong L, Subudhi SK, Gao J, Sharma P
Nature communications 2016 Aug 8;7:12335
Nature communications 2016 Aug 8;7:12335
Mammary Stem Cells and Tumor-Initiating Cells Are More Resistant to Apoptosis and Exhibit Increased DNA Repair Activity in Response to DNA Damage.
Chang CH, Zhang M, Rajapakshe K, Coarfa C, Edwards D, Huang S, Rosen JM
Stem cell reports 2015 Sep 8;5(3):378-91
Stem cell reports 2015 Sep 8;5(3):378-91
Epidermal keratinocytes initiate wound healing and pro-inflammatory immune responses following percutaneous schistosome infection.
Bourke CD, Prendergast CT, Sanin DE, Oulton TE, Hall RJ, Mountford AP
International journal for parasitology 2015 Mar;45(4):215-24
International journal for parasitology 2015 Mar;45(4):215-24
Metastasis is regulated via microRNA-200/ZEB1 axis control of tumour cell PD-L1 expression and intratumoral immunosuppression.
Chen L, Gibbons DL, Goswami S, Cortez MA, Ahn YH, Byers LA, Zhang X, Yi X, Dwyer D, Lin W, Diao L, Wang J, Roybal J, Patel M, Ungewiss C, Peng D, Antonia S, Mediavilla-Varela M, Robertson G, Suraokar M, Welsh JW, Erez B, Wistuba II, Chen L, Peng D, Wang S, Ullrich SE, Heymach JV, Kurie JM, Qin FX
Nature communications 2014 Oct 28;5:5241
Nature communications 2014 Oct 28;5:5241
Myeloid cells expressing VEGF and arginase-1 following uptake of damaged retinal pigment epithelium suggests potential mechanism that drives the onset of choroidal angiogenesis in mice.
Liu J, Copland DA, Horie S, Wu WK, Chen M, Xu Y, Paul Morgan B, Mack M, Xu H, Nicholson LB, Dick AD
PloS one 2013;8(8):e72935
PloS one 2013;8(8):e72935
Small intestine inflammation in Roquin-mutant and Roquin-deficient mice.
Schaefer JS, Montufar-Solis D, Nakra N, Vigneswaran N, Klein JR
PloS one 2013;8(2):e56436
PloS one 2013;8(2):e56436
IL-1R signaling in dendritic cells replaces pattern-recognition receptors in promoting CD8⁺ T cell responses to influenza A virus.
Pang IK, Ichinohe T, Iwasaki A
Nature immunology 2013 Mar;14(3):246-53
Nature immunology 2013 Mar;14(3):246-53
Primate B-1 cells generate antigen-specific B cell responses to T cell-independent type 2 antigens.
Yammani RD, Haas KM
Journal of immunology (Baltimore, Md. : 1950) 2013 Apr 1;190(7):3100-8
Journal of immunology (Baltimore, Md. : 1950) 2013 Apr 1;190(7):3100-8
No comments: Submit comment
Supportive validation
- Submitted by
- Invitrogen Antibodies (provider)
- Main image

- Experimental details
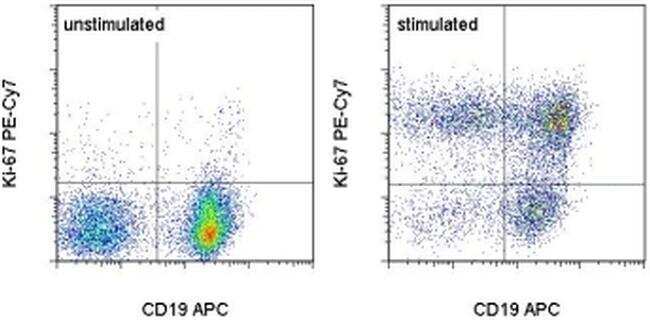
- C57Bl/6 splenocytes were unstimulated (left) or stimuated for 2 days with Anti-Mouse CD3 Functional Grade Purified (Product # 16-0031-82) (right). Cell were stained with Anti-Mouse CD19 APC (Product # 17-0193-82) followed by fixation and permeabilizatin using the Foxp3 Staining Buffer Set (Product # 00-5523-00) and subsequently stained with 0.06 µg of Anti-Mouse/Rat Ki-67 PE-Cyanine7. Cells in the lymphocyte gate were used for analysis.
Supportive validation
- Submitted by
- Invitrogen Antibodies (provider)
- Main image

- Experimental details
- NULL
- Submitted by
- Invitrogen Antibodies (provider)
- Main image
- Experimental details
- NULL
- Submitted by
- Invitrogen Antibodies (provider)
- Main image
- Experimental details
- NULL
- Submitted by
- Invitrogen Antibodies (provider)
- Main image
- Experimental details
- NULL
- Submitted by
- Invitrogen Antibodies (provider)
- Main image
- Experimental details
- NULL
- Submitted by
- Invitrogen Antibodies (provider)
- Main image
- Experimental details
- NULL

- Submitted by
- Invitrogen Antibodies (provider)
- Main image
- Experimental details
- NULL
- Submitted by
- Invitrogen Antibodies (provider)
- Main image
- Experimental details
- NULL
- Submitted by
- Invitrogen Antibodies (provider)
- Main image
- Experimental details
- NULL
- Submitted by
- Invitrogen Antibodies (provider)
- Main image
- Experimental details
- NULL

- Submitted by
- Invitrogen Antibodies (provider)
- Main image
- Experimental details
- NULL
- Submitted by
- Invitrogen Antibodies (provider)
- Main image
- Experimental details
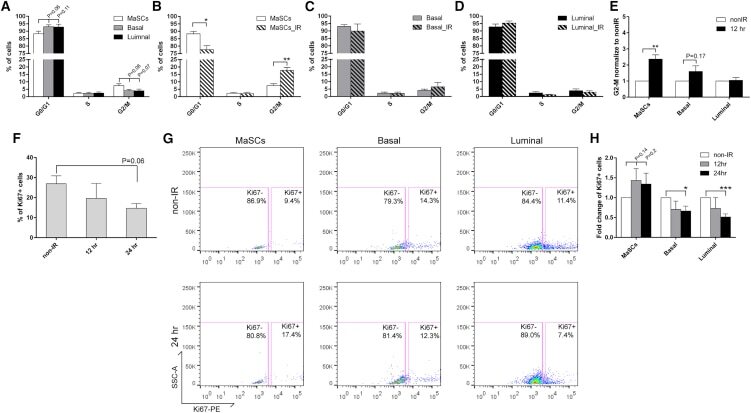
- Figure 2 Wild-Type MaSCs Exhibit Increased G2 Arrest and Evade Damage-Induced Quiescence after IR (A) Cell-cycle distributions of different subpopulations from MECs before IR were examined using PI staining (data are represented as mean +- SEM; n = 5). (B) A significant increase of cells in G2/M was observed in MaSCs 12 hr after IR (data are shown as mean +- SEM; n = 3; ** p < 0.01; * p < 0.05). (C and D) The cell-cycle profiles of basal and luminal compartments before and 12 hr after IR (data are shown as mean +- SEM; n = 3). (E) The fold change of cells in G2/M phase 12 hr after IR as compared to non-IR samples (data are shown as mean +- SEM; n = 3; ** p < 0.01). (F) Percentage of Ki67-positive MECs before and after IR (data are shown as mean +- SEM; n = 3). (G) Representative FACS plots of Ki67 in different subpopulations before and after IR. (H) Quantification of Ki67 positivity shows that basal and luminal cells became significantly more quiescent after IR (data are shown as mean +- SEM; n = 3; *** p < 0.001; * p < 0.05).
- Submitted by
- Invitrogen Antibodies (provider)
- Main image
- Experimental details
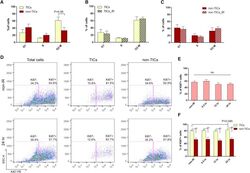
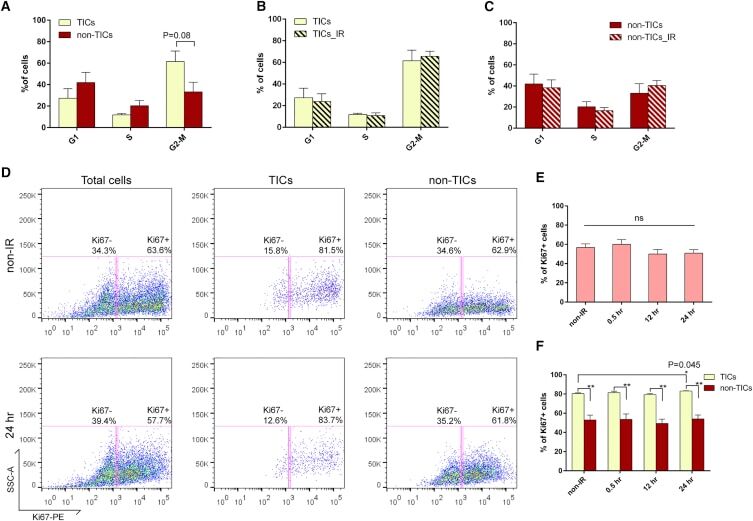
- Figure 6 p53- Tumor Cells Are Highly Proliferative and Fail to Exhibit Proper Cell-cycle Regulation after IR (A) Cell-cycle distribution of TICs and non-TICs before IR (data are shown as mean +- SEM; n = 4). (B and C) Twelve hours after IR, both subpopulations exhibit similar cell-cycle profiles as compared to their non-IR counterparts (data are shown as mean +- SEM; n = 4). (D) Representative FACS plots of Ki67 staining in total tumor cells, TICs, and non-TICs before and after IR. (E) Percentage of Ki67-positive cells in total tumor cells before and after IR (data are shown as mean +- SEM; n = 3). (F) Percentage of Ki67-positive cells in TICs and non-TICs before and after IR (data are shown as mean +- SEM; n = 3; * p < 0.05; ** p < 0.01).
- Submitted by
- Invitrogen Antibodies (provider)
- Main image
- Experimental details
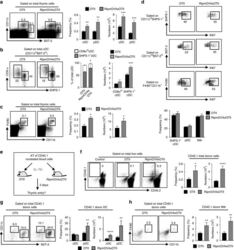
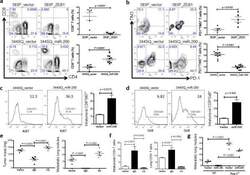
- Fig. 1 Ag-specific interactions between mTECs and CD4 + T cells increase the thymic entry of circulating DCs and macrophages. a - c Flow cytometry profiles, frequencies and numbers of cDCs (CD11c hi BST-2 lo ), pDCs (CD11c int BST-2 hi ) ( a ), resident cDCs (CD8alpha hi SHPS-1 - ), migratory cDCs (CD8alpha lo SHPS-1 + ) ( b ) and macrophages (F4/80 + CD11b + ) ( c ) in the thymus from OTII- Rag2 -/- and RipmOVAxOTII- Rag2 -/- mice. Data are representative of three independent experiments ( n = 3 mice per group and per experiment). d Flow cytometry profiles and frequencies of proliferating Ki-67 + thymic DC subsets and macrophages. Data are representative of two independent experiments ( n = 3 mice per group and per experiment). e Experimental setup: nucleated blood cells from CD45.1 WT congenic mice were adoptively transferred into sublethally irradiated CD45.2 OTII- Rag2 -/- and RipmOVAxOTII- Rag2 -/- recipients. Three days after i.v . adoptive transfer (AT), the thymic entry of DCs and macrophages of CD45.1 donor origin was analysed. SL-TBI: sublethal total body irradiation. f - h Flow cytometry profiles, frequencies and numbers of CD45.1 total donor cells ( f ) as well as cDCs, pDCs ( g ) and macrophages ( h ) of CD45.1 donor origin in the thymus from OTII- Rag2 -/- and RipmOVAxOTII- Rag2 -/- recipients. Control: non-injected irradiated OTII- Rag2 -/- mice. Data are representative of three independent experiments ( n = 3-4 mice per group and per experiment). d , h MPhi: m
- Submitted by
- Invitrogen Antibodies (provider)
- Main image
- Experimental details
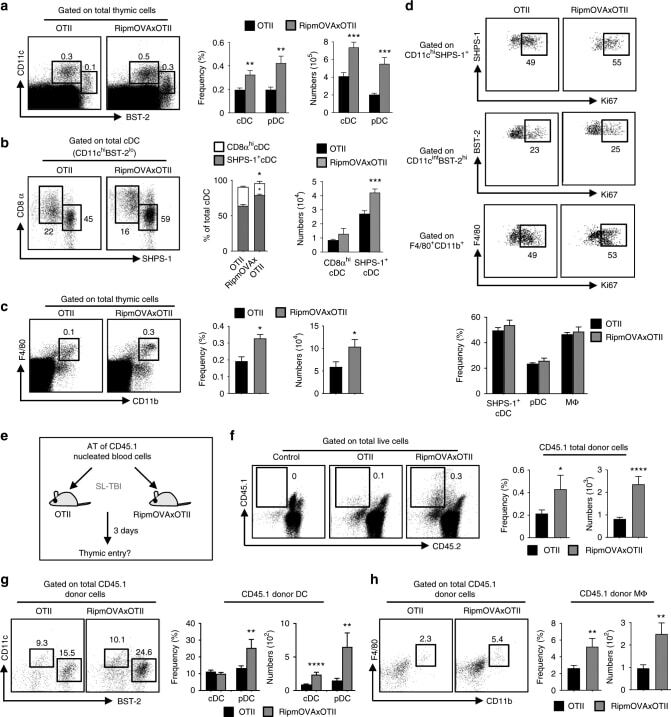
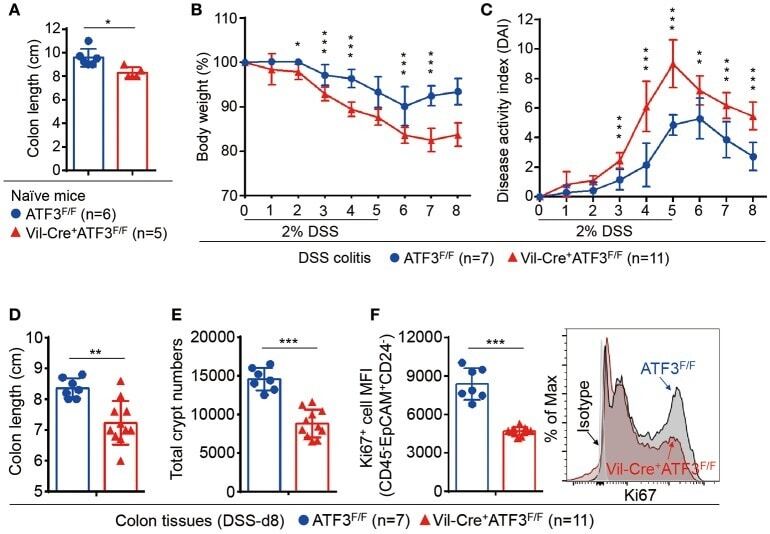
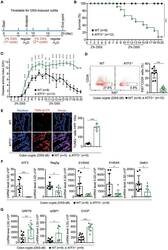
- Figure 4 Epithelial ATF3 is required for protection against DSS colitis. (A) Comparison of colon length between 3-month-old naive mice as indicated. (B-F) Analysis of colitis severity during DSS treatment. (B) Percentage of body weight loss during DSS colitis. (C) Disease activity index (weight loss percentage, stool consistency, and blood in stools) was indicated in each group of mice during DSS colitis. (D) Colon length, (E) total colon crypt numbers, and (F) Ki67 + proliferating crypt cells by flow cytometry analysis, were measured at day-8 post DSS treatment. Results were from two independent experiments. ""n"" refers to the number of mice analyzed. Statistical analysis was done using Multiple T -test on Prism software. * P < 0.05, ** P < 0.005, *** P < 0.0005.
- Submitted by
- Invitrogen Antibodies (provider)
- Main image
- Experimental details
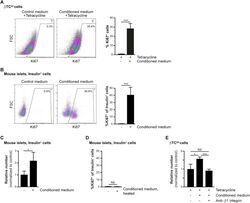
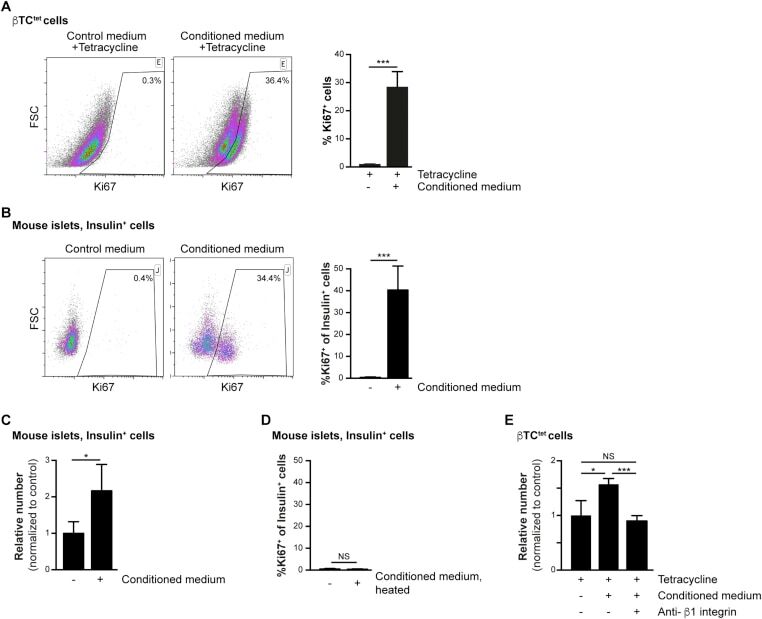
- Figure 2 Increased beta-cell proliferation upon exposure to pericyte-conditioned medium . A ) Tetracycline-treated betaTC-tet cells were cultured in either control (complete DMEM; 'Control medium') or neonatal pericyte-conditioned ('Conditioned medium'; described in Figure 1 B) medium, both supplemented with tetracycline. After incubation for 96 h, cells were fixed and stained for the proliferative marker Ki67. Left , representative dotplots showing flow-cytometry analysis of Ki67 expression by betaTC-tet cells. Gated are Ki67 + cells; the numbers represent the percentage of gated cells out of the analyzed cell population. Right , Bar diagrams (mean +- SD) represent the percentage of Ki67 + cells. N = 3. ***P < 0.005 (Student's t -test), as compared to the control medium. A representative of three independent experiments is shown. B ) Isolated islets from 3-month-old wild-type mice were cultured in either control (complete DMEM; 'Control medium') or neonatal pericyte-conditioned ('Conditioned medium'; described in Figure 1 B) medium for 24 h. Islets were dispersed to single cells, fixed, and stained for insulin and the proliferative marker Ki67. Left , representative dotplots showing flow-cytometry analysis of Ki67 expression by insulin + cells. Gated are Ki67 + cells; the numbers represent the percentage of gated cells out of the total insulin + cell population. Right , Bar diagrams (mean +- SD) represent the percentage of Ki67 +
- Submitted by
- Invitrogen Antibodies (provider)
- Main image
- Experimental details
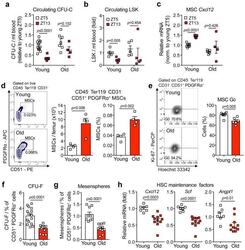
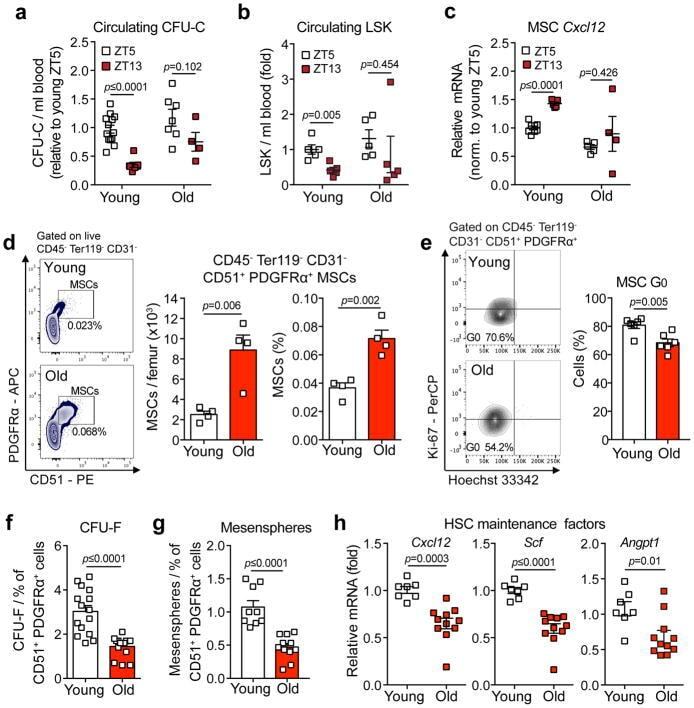
- Figure 3 Aging expands MSCs and reduces their HSC maintenance activity (a, b) Circadian oscillations of circulating CFU-C (normalized to young at ZT5; n=13 young ZT5, 7 old ZT5, 7 young ZT13 and 4 old ZT13 mice) (a) and lineage - Sca-1 + c-Kit + (LSK) progenitors (normalized to young at ZT5; n=5 mice per group) (b) in peripheral blood of young and old C57BL/6 mice. (c) Quantification of Cxcl12 mRNA levels relative to Actb in sorted MSCs from young and old C57BL/6 mice at ZT5 and ZT13 (normalized to young at ZT5; n=8 young ZT5, 5 old ZT5, 5 young ZT13 and 4 old ZT13 mice). (d) Left, representative FACS plots showing the gating strategy for CD45 - Ter119 - CD31 - CD51 + PDGFRalpha + MSCs in young (top) and old (bottom) C57BL/6 mice. Right, absolute numbers and frequency of MSCs in young and old C57BL/6 mice (n=4 mice per group). (e) Left, representative FACS plots showing the gating strategy for MSCs Ki-67 and Hoechst 33342 staining in young (top) and old (bottom) C57BL/6 mice. Right, quantification of Ki-67 - G0 MSCs in young and old C57BL/6 mice (n=6 mice per group). (f, g) Frequency of CFU-F (n=15 cultures per group) (f) and mesenspheres (n=9 young, 11 old cultures) (g) from sorted MSCs plated at equal numbers and clonal densities under CFU-F or mesensphere culture conditions (n=5 mice per group). (h) Quantification of mRNA levels of Cxcl12, Scf and Angpt1 relative to Gapdh in sorted MSCs (normalized to young; n=7 young, 11 old mice)
- Submitted by
- Invitrogen Antibodies (provider)
- Main image
- Experimental details
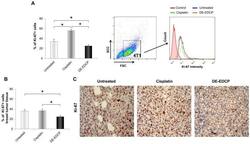
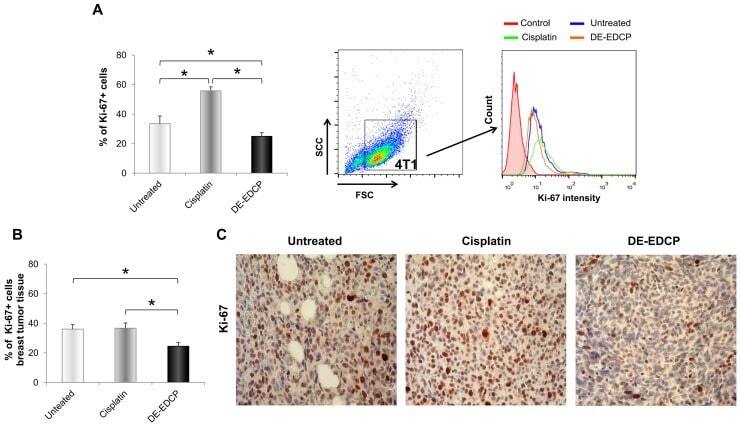
- Figure 6 DE-EDCP treatment attenuates expression of Ki-67 in murine breast cancer (A) Analysis of Ki-67 expression in 4T1 cells exposed to DE-EDCP or cisplatin (31.25 muM) for 24h using flow cytometry by first gaiting out cell debris and cell clumps in forward/side scatter plot. Data are presented as the mean +- SD, ( * DE-EDCP vs. untreated p=0.020; DE-EDCP vs. cisplatin p=0.002; cisplatin vs. untreated p=0.009). Representative histograms of three independent experiments are shown. (B, C) At 36 th day of the experiment, tumors were harvested from tumor-bearing mice treated with DE-EDCP, cisplatin and vehicle and Ki-67 expression was detected using immunohistochemical method. Representative images and quantitative analysis of the percentage of Ki-67- positive cells are shown. Ki-67-positive cells were counted in five random fields (magnification at x 400), and data were summarized as the mean percentage of positive cells (four tumors per group). Data are presented as mean +- SE. ( * DE-EDCP vs. untreated p=0.006; DE-EDCP vs. cisplatin p=0.004)
- Submitted by
- Invitrogen Antibodies (provider)
- Main image
- Experimental details
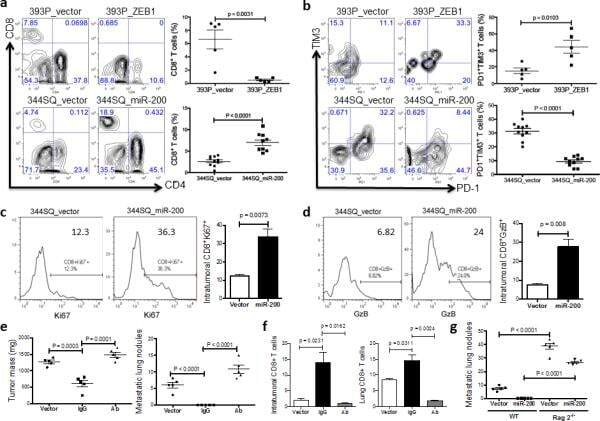
- Figure 4 The miR-200/ZEB1 axis controls tumor metastasis through regulating CD8 + TILs ( a , b ) FACS analysis of ( a ) CD8 + TIL frequency; ( b ) PD1 and TIM3 marker expression on CD8 + T cells from 393P_vector and 393P_ZEB1 (n = 5), as well as 344SQ_vector and 344SQ_miR-200 (n = 10) primary tumors. Analysis was done 2 weeks post-cancer cell injection. ( c , d ) ( c ) Intratumoral Ki67 + CD8 + T cells; ( d ) granzyme B (GzB) + CD8 + T cells in 344SQ_vector or 344SQ_miR-200 primary tumors 6 weeks post-subcutaneous injection of cancer cells into 129/Sv mice. Representative Ki67 or GzB staining in an individual tumor sample is shown on the left, and mean Ki67 + or GzB + populations of gated CD8 + T cells in total T cells are shown on the right (n = 5). ( e ) CD8 + T cell depletion results in tumor growth and metastasis in mice (n = 5) that received subcutaneous tumor cell injections. No treatment (344SQ_vector (Vector)), IgG (344SQ_miR-200 + IgG control), or Ab (344SQ_miR-200 + anti-CD8 Ab). The analysis was done 6 weeks post-injection. ( f ) Relative abundance of CD8 + T cells in the tumor (left) or lung (right) from 129/Sv mice (n =5) with syngeneic control 344SQ tumors (Vector), 344SQ_miR-200 tumors with control IgG treatment (IgG) or anti-CD8 antibody treatment (Ab). ( g ) Lung metastases of 344SQ_vector (Vector) and 344SQ_miR-200 (miR-200) tumors in wild-type (WT) or 129/Sv Rag2 -/- ( Rag2 -/- ) mice (n = 5). The analysis was done 6 weeks post-tumor cell subcutaneous injec
- Submitted by
- Invitrogen Antibodies (provider)
- Main image

- Experimental details
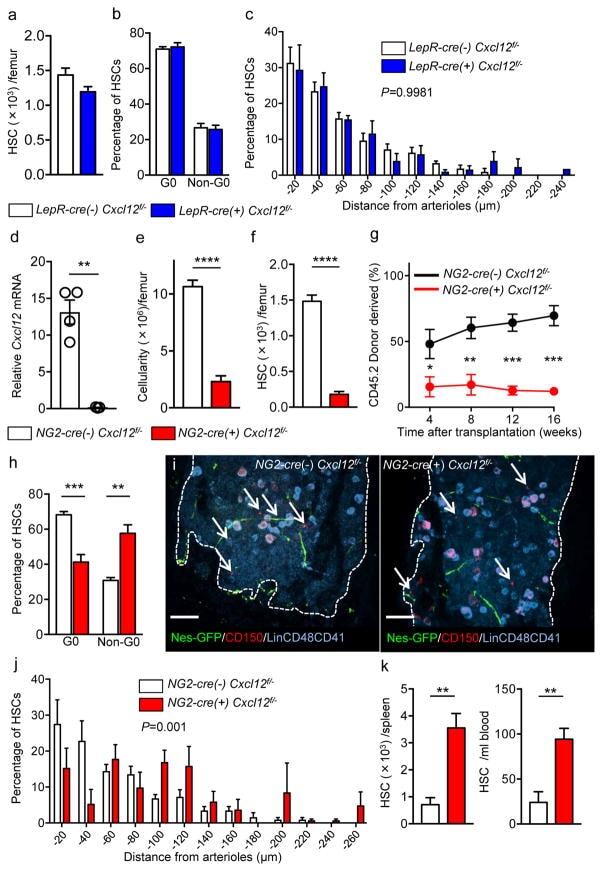
- Figure 3 Cxcl12 from distinct peri-vascular niche cells contributes differentially to HSC functions (a-c) Analyses of LepR-cre/ Cxcl12 fl/- mice. (a) Absolute numbers of HSCs in BM. n=6 mice for each group. (b) FACS analyses of cell cycle of HSCs with Ki-67 and Hoechst 33342 staining. n=5 mice per group. (c) HSC localization relative to arterioles. Error bars: n=3 mice. The p value has been calculated using n=129 HSCs for cre (-), 160 HSCs for cre (+), pooled from 3 mice per group. P =0.9981. (d-k) Analyses of NG2-cre / Cxcl12 flox/-. mice (d) Cxcl12 mRNA expression relative to beta-actin in CD45 - TER119 - CD31 - Nes-GFP + cells from NG2-cre(-) Cxcl12 f/- and NG2-cre(+) Cxcl12 f/- mice. n=4 mice for cre (-), n=3 mice for cre (+), from two independent experiments. (e,f) Bone marrow cellularity (e) and absolute numbers of phenotypic CD150 + CD48 - Lineage - Sca-1 + c-kit + (LSK) HSCs (f) per one femur. n=10 mice. (g) Percentages of donor-derived cells after competitive reconstitution. n=5 mice per group. (h) Quantification of cell cycle of HSCs with Ki-67 and Hoechst 33342 staining. n=5 mice for cre (-), n=7 mice for cre (+). (i) Representative images of whole-mount immunofluorescent staining of the sternal bone marrow from 3 mice. Arrows indicate CD150 + CD48 - CD41 - Lineage - HSCs. Dashed lines depict the border between bone and bone marrow. Scale bars, 100 muH. (j) HSC localization relative to arterioles. Error bars: n=3 mice for cre (-), n=4 mice for cre (+). The p value
- Submitted by
- Invitrogen Antibodies (provider)
- Main image
- Experimental details
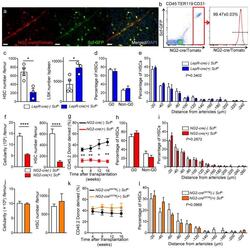
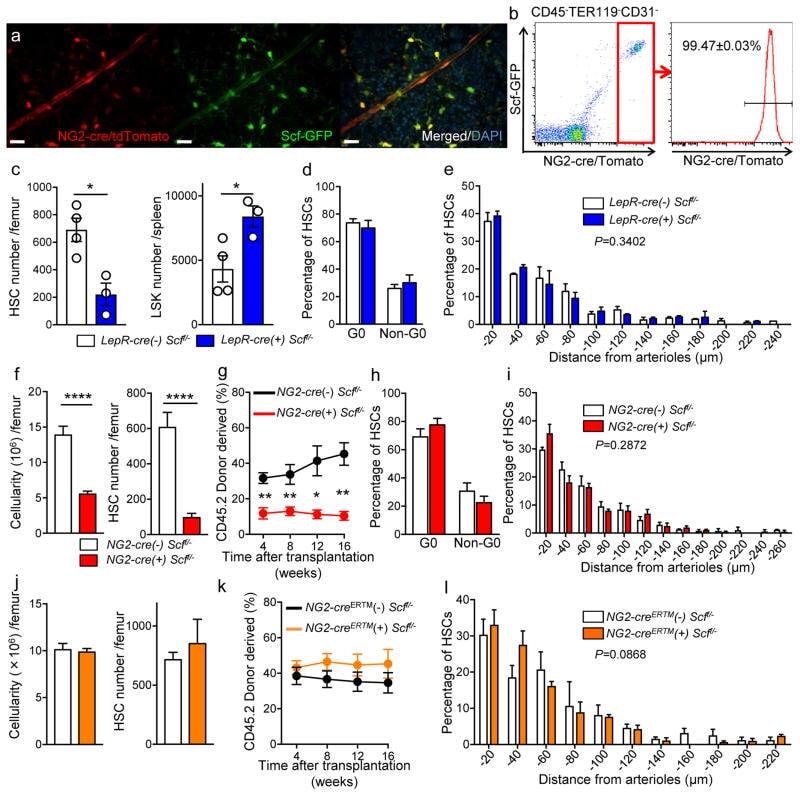
- Figure 5 NG2-cre, but not NG2-cre ERTM , targeted cells are the source of Scf in the bone marrow (a) Whole-mount sternum from NG2-cre/ iTdTomato/ Scf-GFP mice, anti-VE-cadherin. Representative images from 3 mice. Scale bars, 20 mum. (b) Representative FACS plot showing percentage of NG2-cre/ iTdTomato + cells within CD45 - TER119 - CD31 - Scf-GFP + cells. n=3 mice. (c-e) Analyses of LepR-cre/ Scf fl/- mice. (c) Numbers of HSCs (left) in BM and LSK cells in spleen (right). n=4 mice for cre (-), n=3 mice for cre (+). (d) FACS analyses of HSC (CD150 + CD48 - LSK) cell cycle with Ki-67 and Hoechst 33342 staining. n=5 mice for cre (-), n=6 mice for cre (+). (e) HSC localization relative to arterioles. Error bars: n=3 mice. P value has been calculated using n=272 HSCs for cre (-), 293 HSCs for cre (+) pooled from 3 mice per group. P =0.3402. (f-i) Analyses of NG2-cre/ Scf fl/- mice. (f) Numbers of total BM cells (left) and CD150 + CD48 - LSK HSCs (right) in BM. n=5 mice for cre (-), n=7 mice for cre (+). (g) Percentages of donor-derived cells after competitive reconstitution. n=5 mice for cre (-), n=7 mice for cre (+). (h) FACS analyses of HSC cell cycle with Ki-67 and Hoechst 33342 staining. n=6 mice for cre (-), n=7 mice for cre (+). (i) HSC localization relative to arterioles. Error bars: n=3 mice. P value has been calculated using n=224 HSCs for cre (-), 274 HSCs for cre (+) pooled from 3 mice per group. P =0.2872. (j-l) Analyses of NG2-cre ERTM / Scf fl/- mice. (j) Absolute nu
- Submitted by
- Invitrogen Antibodies (provider)
- Main image
- Experimental details
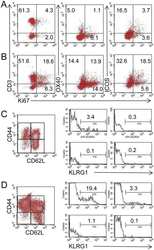
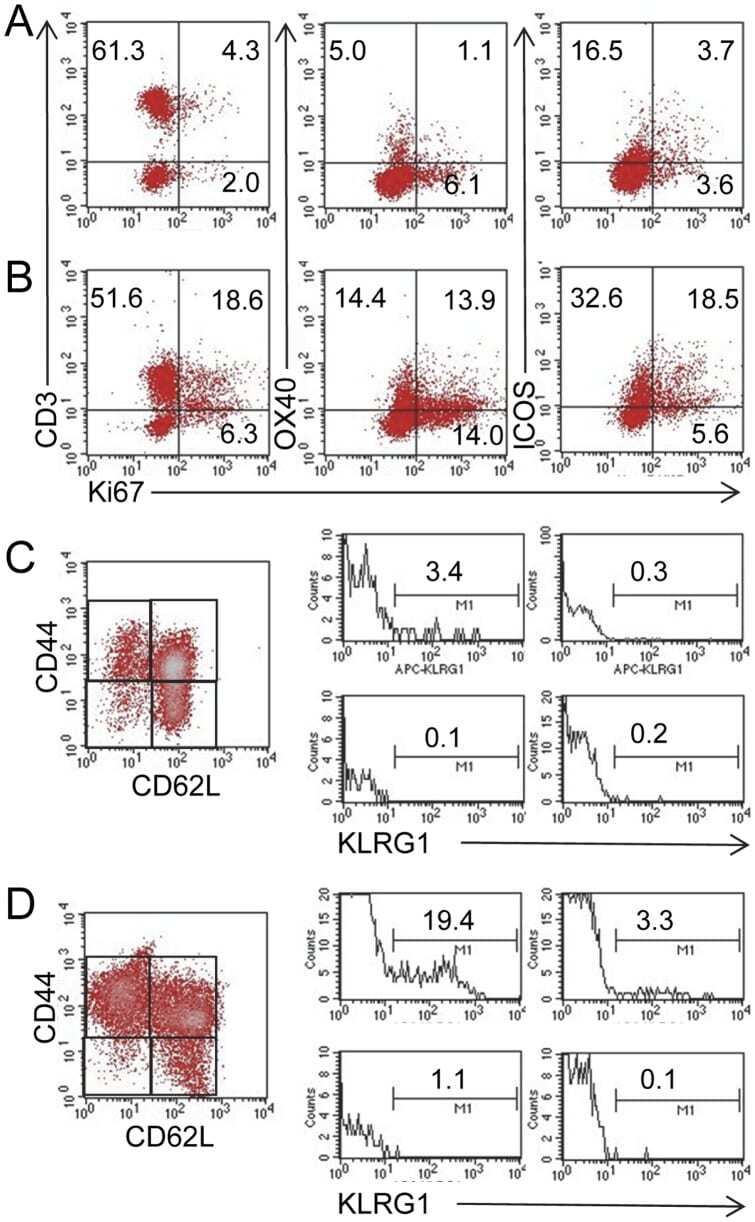
- Figure 5 MLN cells from Roquin san/san mice are proliferative and have more SLECs. Based on Ki67 staining, (panel B ) a greater proportion of OX40 + cells and ICOS + MLN cells were proliferating T cells compared to MLN cells from (panel A ) normal mice. Representative staining from 1 normal and 2 Roquin san/san mice. Similarly, there was a greater proportion of CD44 hi CD62L lo KLRG1 + SLECs present in MLN cells of (panel D ) Roquin san/san mice compared to (panel C ) normal mice. Representative data from 3 normal and 3 Roquin san/san mice.
- Submitted by
- Invitrogen Antibodies (provider)
- Main image

- Experimental details
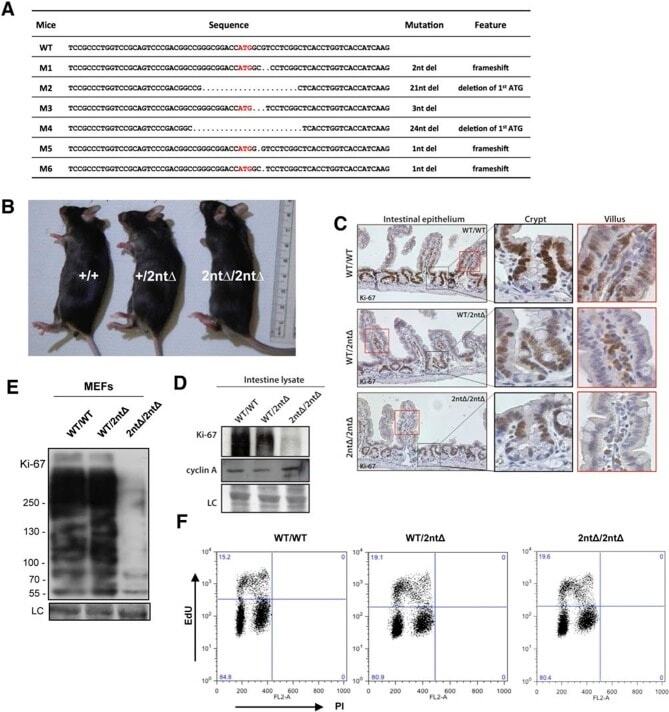
- Figure 3. Mouse development with a mutated Ki-67 gene. ( A ) Table describing Ki-67 mutant mouse lines resulting from germline transmission of mutations generated by cytoplasmic injection of TALEN-encoding mRNA into zygotes. ( B ) Macroscopic appearance of littermate female mice at 10 weeks of age. Genotypes are specified. ( C ) IHC staining of Ki-67 in sagittal section of intestine from Mki67 WT/WT , Mki67 WT/2nt and Mki67 2nt/2nt mice. ( D ) Western blots of Ki-67 and cyclin A expression from intestine isolated from Mki67 WT/WT , Mki67 WT/2nt and Mki67 2nt/2nt mice. LC, loading control. ( E ) Western blot of Ki-67 in MEFs from WT, Mki67 WT/2nt and Mki67 2nt/2nt mice. LC, loading control. ( F ) Flow cytometry profiles in WT, Mki67 WT/2nt and Mki67 2nt/2nt MEFs showing EdU incorporation upon a 1 hr pulse and DNA content. DOI: http://dx.doi.org/ Figure 3--figure supplement 1. Ki-67 mutant mice develop normally. ( A ) Pair of TALE-nucleases designed to target the initiator ATG of mouse Mki67 gene. ( B ) Sequencing traces of initiator ATG (underlined) of Mki67 gene in WT Mki67 +/+ (WT/WT), heterozygous Mki67 +/2nt (WT/2nt) and homozygous Mki67 2nt/2nt (2nt/2nt) mice. ( C ) Sequencing traces of initiator ATG (underlined) of Mki67 gene in WT Mki67 +/+ (WT/WT), heterozygous Mki67 +/21nt (WT/21nt) and homozygous Mki67 21nt/21nt (21nt/21nt) mice. ( D ) WT Mki67 +/+ (+/+), heterozygous Mki67 +/21nt (+/21nt) and homozygous Mki67 21nt/21nt (21nt/21nt) mice. DOI: http://dx.doi.org/ Figur
- Submitted by
- Invitrogen Antibodies (provider)
- Main image

- Experimental details
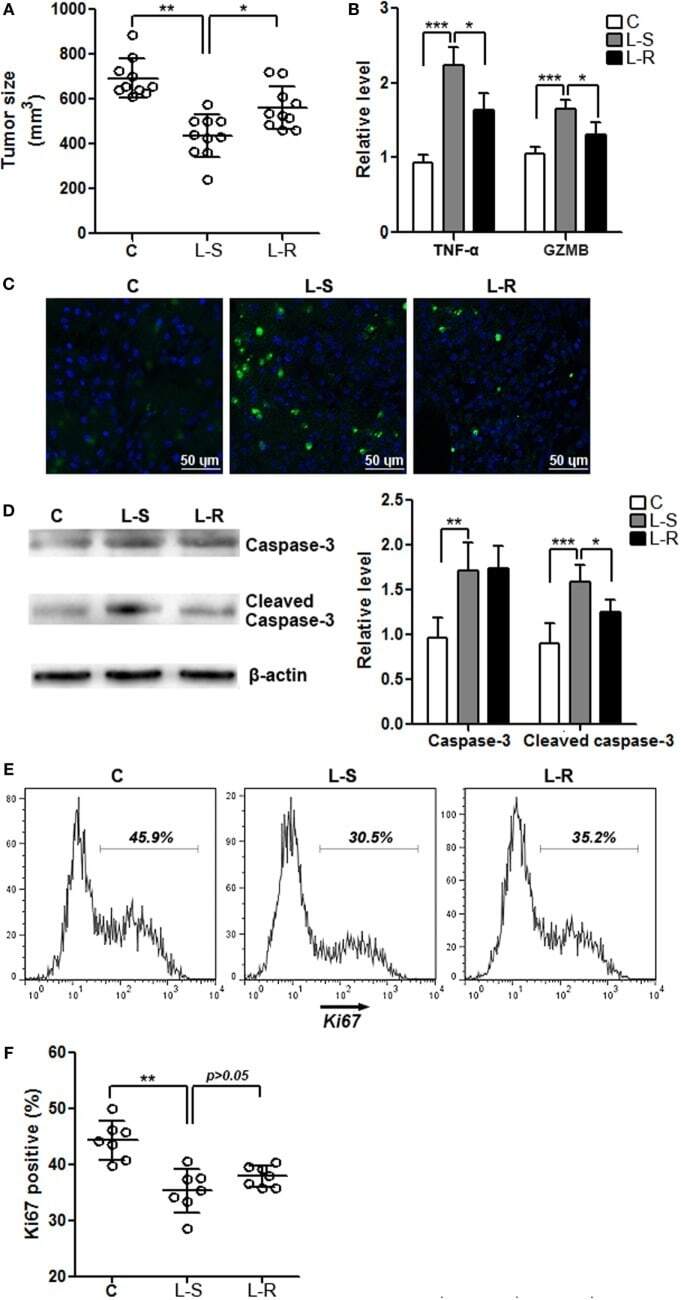
- Figure 5 Rik expression in CD8 + T cells favors tumor survival . (A) Tumor size. C: control mice receiving phosphate-buffered saline. L-S: mice receiving CD8 + T cells transduced with scramble lentiviruses. L-R: mice receiving CD8 + T cells transduced with Rik-expressing lentiviruses. Each circle represents an individual mouse. (B) mRNA levels of TNF-alpha and granzyme B in tumor tissues. N = 4 per group. (C) Tumor cell apoptosis is indicated by terminal deoxynucleotidyl transferase dUTP nick end labeling. This is a representative of three independent experiments. (D) Activation of caspase-3 in tumor tissues. Left panel: representative Immunoblot image. Right panel: statistics of caspase-3. N = 5 per group. (E,F) Tumor cell proliferation is demonstrated by Ki67 staining. Tumor implants were digested as described in Section "" Materials and Methods ."" Then the whole tissue was pressed through a 70-mum nylon mesh to prepare a single cell suspension, followed by staining with APC anti-CD45 and APC anti-CD31 antibodies. Cells were then stained for Ki67 as described in Section "" Materials and Methods ."" CD45 - CD31 - tumor cells were shown here. Representative histograms are shown in panel (E) , and statistical analysis for Ki67 + cells were shown in panel (F) . N = 7 per group (* p < 0.05; ** p < 0.01; *** p < 0.001).
- Submitted by
- Invitrogen Antibodies (provider)
- Main image
- Experimental details
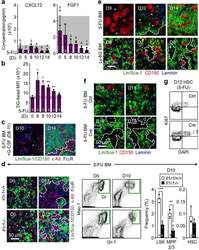
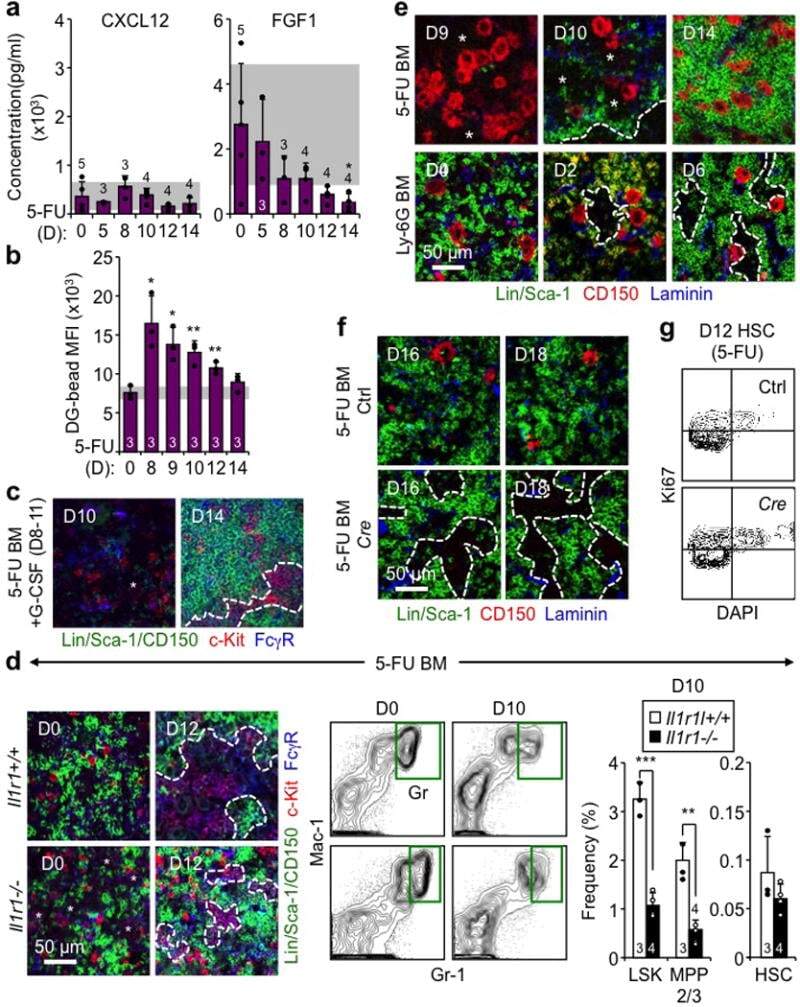
- Extended Data Fig. 9 Mechanisms controlling GMP cluster formation during regeneration a , ELISA measurement of cytokine levels in BM fluids of 5-FU-treated WT mice at the indicated days post-treatment. b , Quantification of vascular leakage in 5-FU-treated BM at the indicated days post-treatment. Results are expressed as dragon green (DG) microsphere MFI upon masking of laminin + blood vessels. c , Representative IF staining showing GMPs (purple) in 5-FU-treated BM with concomitant daily injections of G-CSF (+G) on d8-11. d , Investigation of 5-FU-treated Il1r1 +/+ and Il1r1 -/- mice at the indicated days post-treatment showing representative IF staining of GMPs (purple), FACS plots of Gr regeneration, and quantification of the indicated BM populations. e , Representative IF staining of CD150 + megakaryocytes (red) in 5-FU- and Ly-6G-treated BM. f , g , Megakaryocyte depletion studies in diphtheria toxin (DT) injected iDtr (Ctrl) and Cxcl4-Cre:iDtr ( Cre ) mice showing (f) representative IF staining of CD150 + megakaryocytes (red) at the indicated days post-5-FU, and (g) representative Ki67/DAPI staining of HSCs at d12 post-5-FU. Stars indicate pGMPs and dotted lines cGMPs. Results are expressed as mean +- S.D. (grey bars, reference range); *p
- Submitted by
- Invitrogen Antibodies (provider)
- Main image
- Experimental details
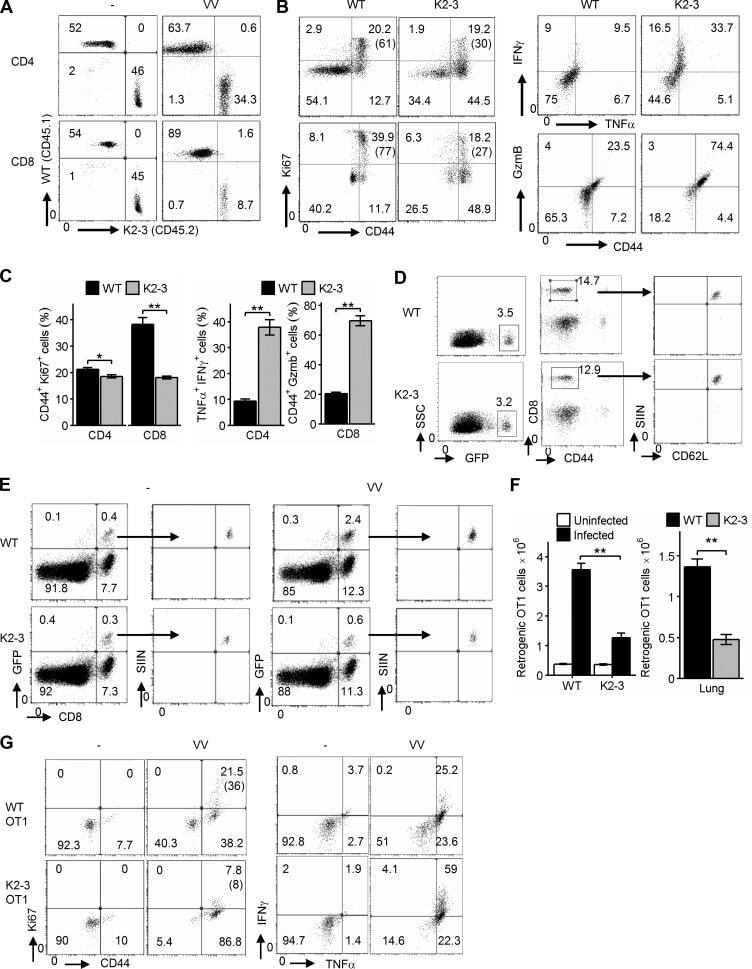
- Figure 4. Egr2 and 3 function is cell intrinsic. (A-C) Irradiated WT mice were adoptively transferred with an equal number of BM cells from WT and CD2-Egr2/3 -/- (K2-3) mice. 8 wk after transfer, mice were infected with OVA-VV WR and analyzed 7 d after infection. (A) Splenic cells from chimeric mice were stained with CD45.1, CD45.2, CD4, and CD8, and the proportion of WT (CD45.1) and K2-3 (CD45.2) CD4 and CD8 cells was determined by flow cytometry. (B and C) Gated WT (CD45.1) and K2-3 (CD45.2) CD4 and CD8 cells were analyzed for expression of the activation marker CD44 and the proliferation marker Ki67 (left) and TNF and IFNgamma for CD4 cells and granzyme B for CD8 cells (right). The percentages of Ki67 + cells among the CD44 high population are indicated in parentheses in B. (D-G) WT and K2-3 OT1 retrogenic T cells were analyzed in recipient mice before and after infection. (D) GFP + CD8 + CD44 lo cells were isolated from WT and K2-3 OT1 retrogenic mice (left and middle) and confirmed as CD62L + Kb-SIINFEKL-tetramer + cells (right). 3 x 10 5 to 5 x 10 5 WT or Egr2/3 -/- retrogenic-OT1 cells were adoptively transferred to separate naive WT mice. 1 d after transfer, mice were infected with OVA-VV WR and analyzed 7 d after infection. (E and F) Retrogenic-OT1 GFP + CD8 + Kb-SIINFEKL-tetramer + cells among spleen and lymph node cells from recipient mice were identified (E), and the numbers of WT and K2-3 retrogenic-OT1 cells in spleen and lymph nodes (left) and lung (right) were
- Submitted by
- Invitrogen Antibodies (provider)
- Main image

- Experimental details
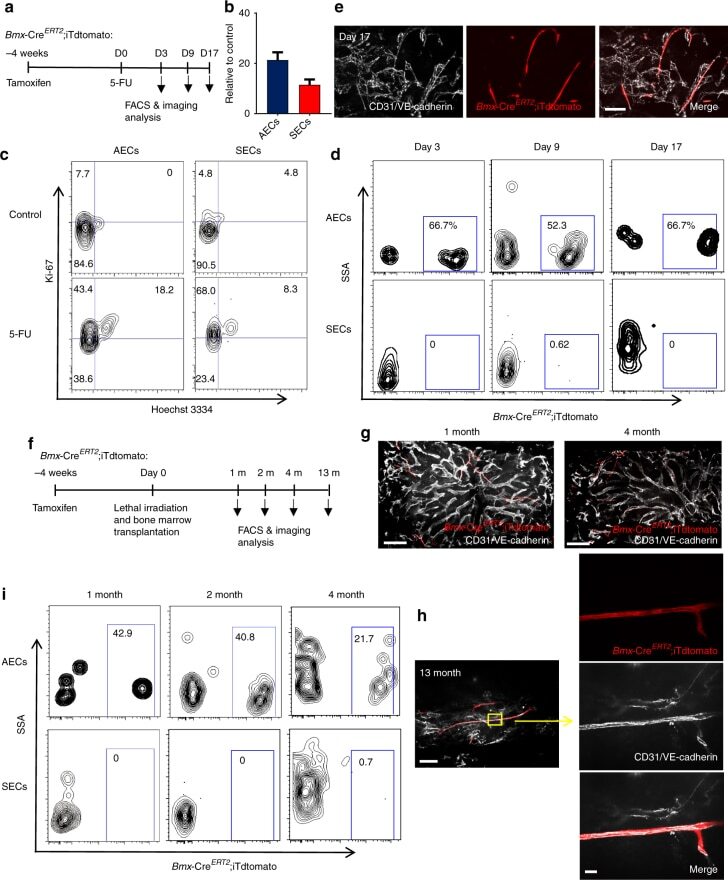
- Fig. 6 AECs self-regenerate, and do not regenerate SECs. a Scheme of experiment design. Bmx -Cre ERT2 ;iTdtomato mice were injected with Tamoxifen to activate Cre expression. Four weeks later, 5-FU was given to these mice and BM ECs were analysed by FACS and immunofluorescence analysis. b Numbers of AECs and SECs 3 days after 5-FU treatment. Data are represented as mean +- SEM. c Representative FACS plot of cell cycle analysis of AECs and SECs from control mice and mice treated with 5-FU (9 days after 5-FU) using Hoechst 3334 and Ki-67. d FACS plot of the labelling of AECs and SECs by Bmx -Cre ERT2 at different time points after 5-FU treatment. e Representative image of whole-mount sternum from mice treated as in ( a ). The bone was harvested on day 17 after 5-FU injection. Mice were injected i.v. with anti-VE-cadherin and anti-CD31. All panels show the same area for different channels. Scale bar, 50 mum. f Scheme of experiment design. Bmx -Cre ERT2 ;iTdtomato mice were injected with Tamoxifen to activate Cre expression. Four weeks later, these mice were lethally irradiated and transplanted with BM cells from wild-type mice. BM ECs were analysed by FACS and immunofluorescence analysis at different time points after lethal irradiation. g Representative images from whole-mount sternum at 1 month (left panel) and 4 months (right panel) after lethal irradiation. Mice were injected i.v. with anti-VE-cadherin and anti-CD31. Scale bar, 200 mum. h Images from whole-mount sternum in w
- Submitted by
- Invitrogen Antibodies (provider)
- Main image
- Experimental details
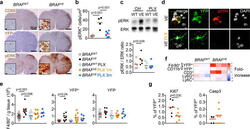
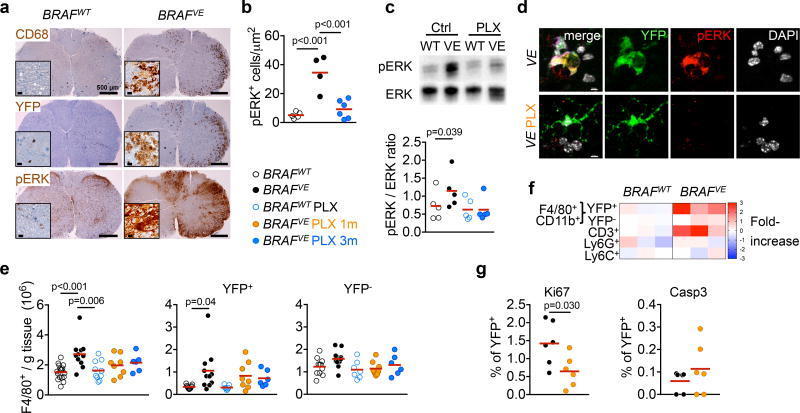
- Figure 3 ERK activation in BRAF V600E microglia (a) CD68, YFP and pERK staining in spinal cord from 7-month old mice. Scale bars=500um, 10um for insets. n=4 per group. (b) pERK + microglia in brainstem. Circles represent individual mice. One-way ANOVA. (c) ERK phosphorylation in spinal cords and brains from 6-9 month-old mice. Top: representative western blot, bottom: pERK/ERK ratio, n=5 per group. One-way ANOVA. (d) pERK expression in YFP + microglia from BRAF VE mice. n=5 per group. Scale bars=5um. (e) Numbers of microglia from 5-9 month-old mice Circles represent individual mice. One-way ANOVA. (f) Heatmap representation of cell frequency among CD45 + cells in the brain. n=3 per group. (g) Ki67 + and cleaved Caspase 3 + (Casp3) expression in YFP + microglia from 5-9 month-old BRAF VE mice, n=6 per group. Unpaired two-tailed t -test. See also Extended data Fig. 7 .
- Submitted by
- Invitrogen Antibodies (provider)
- Main image
- Experimental details
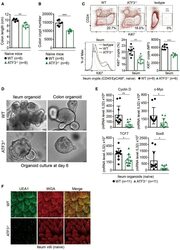
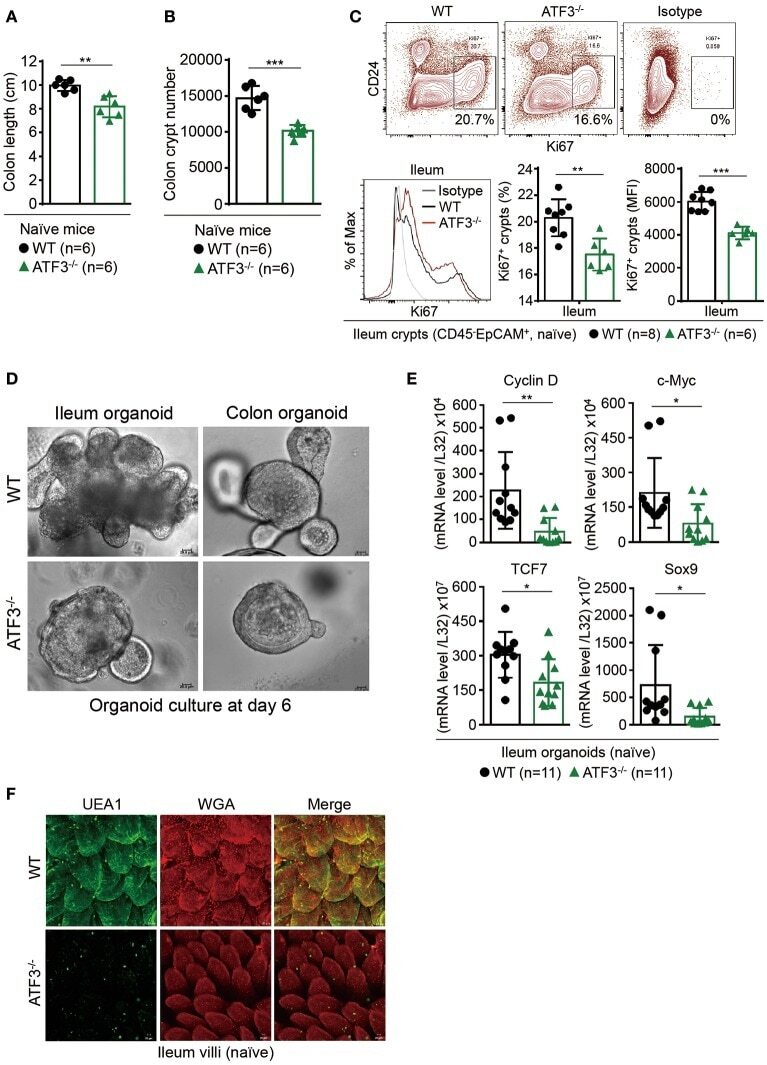
- Figure 1 ATF3 maintains intestinal homeostasis. (A) Comparison of colon length between naive mice as indicated. (B) Colon crypts from mice were isolated by shaking colon fragments in EDTA and counted under light microscopy. (C) Flow cytometry analysis of Ki67 and CD24 expression in ileum crypts, gated on the CD45 - EpCAM + populations, from the indicated naive mice. (D) Representative micrographs showing intestinal organoids derived from naive mice. (E) Quantitative real-time PCR analysis of cell cycle genes in naive ileum organoids at day 6 of culture (""n"" indicates organoids derived from 4 mice each group). (F) Representative confocal images of whole mount tissues with co-immunofluorescence staining of UEA-1 and WGA in naive ileum villi. Results were from at least two independent experiments and ""n"" refers to the number of mice unless indicated otherwise. All mice were at the age of 2~3 months old when analyzed. Statistical analysis was done using Multiple T -test on Prism software. * P < 0.05, ** P < 0.005, *** P < 0.0005.
- Submitted by
- Invitrogen Antibodies (provider)
- Main image
- Experimental details
- Figure 3 ATF3 protects mice from DSS-induced colitis. (A) Experimental protocol of DSS-induced colitis was shown. (B) Survival rate in mice after DSS treatment. (C) Disease activity index (DAI), a composite measurement of weight loss percentage, stool consistency, and blood in stools, was indicated in each group of mice during DSS colitis. (D-G) Analysis of colitis severity at day-8 post DSS treatment. (D) Flow cytometry of Ki67 + proliferating crypt cells in CD24 low/- cell population. (E) TUNEL assay showing apoptotic cells in colon tissues. Magenta positive apoptotic cells were quantified per 100x high-power field (HPF) from 10 different views of colon section from each mouse. (F-G) Quantitative real-time PCR analysis of crypt cells at day-8 post DSS. (F) Expression of ATF3 and anti-microbial peptide-related genes. (G) Expression of ER stress-related genes. Results were from two independent experiments. ""n"" refers to the number of mice analyzed. Survival curve was calculated using the Kaplan-Meier method and statistical significance was calculated using Log rank (Mantel-Cox) test. Statistical analysis was done using Multiple T -test on Prism software. * P < 0.05, ** P < 0.005, *** P < 0.0005.
- Submitted by
- Invitrogen Antibodies (provider)
- Main image
- Experimental details
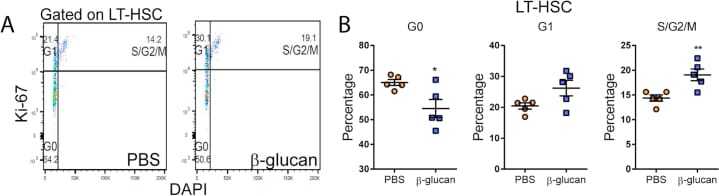
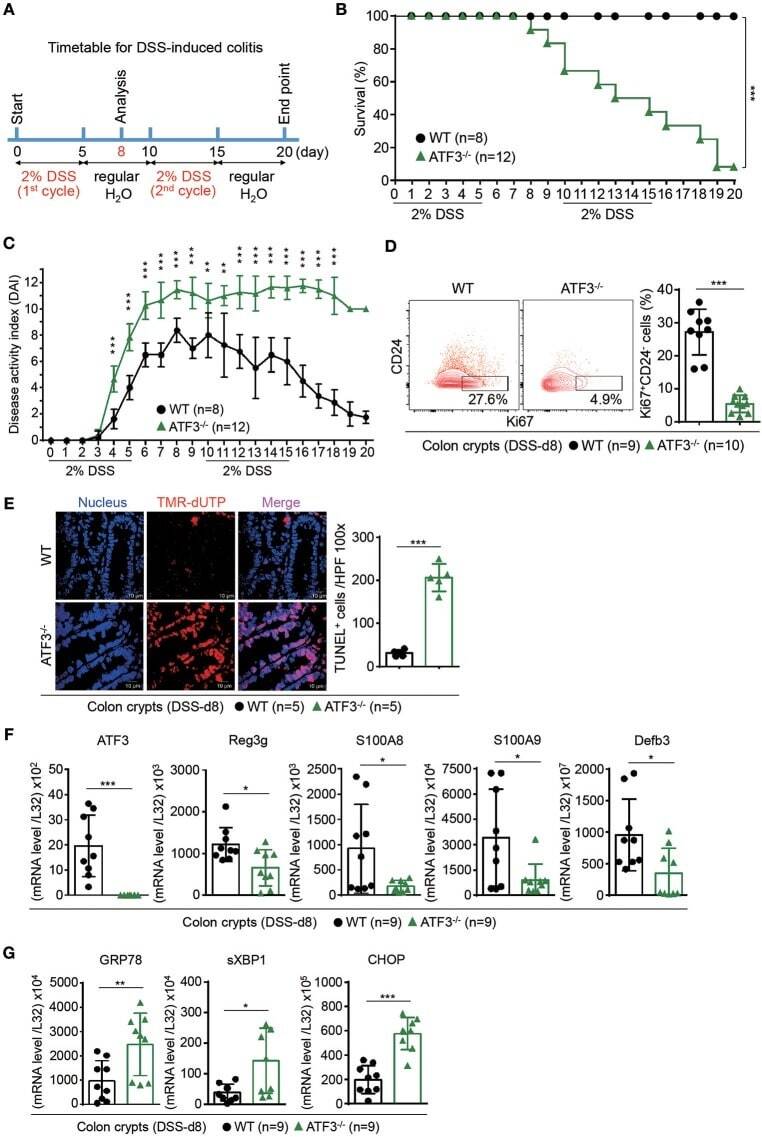
- Figure S1 Administration of beta-Glucan Promotes Cell Proliferation of LT-HSCs, Related to Figure 1 (A and B) Cell cycle analysis was performed in LT-HSC at 24h after the administration of PBS or beta-glucan by staining for Ki67 and DAPI. (A) Representative flow cytometry plots and (B) frequency of LT-HSC at different phases of the cell cycle (n = 5 mice per group). Data presented as mean +- SEM. * p < 0.05, ** p < 0.01.