Explore
 Validate
 Learn
Learn Immunocytochemistry
Antibody data
- Antibody Data
- Antigen structure
- References [148]
- Comments [0]
- Validations
- Immunocytochemistry [2]
- Immunohistochemistry [2]
- Flow cytometry [2]
- Other assay [184]
Submit
Validation data
Reference
Comment
Report error
- Product number
- 50-5698-80 - Provider product page

- Provider
- Invitrogen Antibodies
- Product name
- Ki-67 Monoclonal Antibody (SolA15), eFluor™ 660, eBioscience™
- Antibody type
- Monoclonal
- Antigen
- Other
- Description
- Description: The monoclonal antibody SolA15 recognizes mouse and rat Ki-67, a 300 kDa nuclear protein. Ki-67 is present during all active phases of the cell cycle (G1, S, G2, and mitosis), but is absent from resting cells (G0). Ki-67 is detected within the nucleus during interphase but redistributes to the chromosomes during mitosis. Ki-67 is used as a marker for determining the growth fraction of a given population of cells. In studies of tumor cells, the "Ki-67 labeling index" refers to the number of Ki-67 positive cells within the population and this is used to predict outcome of particular cancer types. Ki-67 has been shown to interact with the DNA-bound protein chromobox protein homolog 3 (CBX3) (heterochromatin). The SolA15 antibody also recognizes human, non-human primate and canine Ki-67. Applications Reported: This SolA15 antibody has been reported for use in intracellular staining followed by flow cytometric analysis, immunohistochemical staining, and immunocytochemistry. Applications Tested: This SolA15 antibody has been tested by intracellular staining and flow cytometric analysis of stimulated mouse splenocytes using the Foxp3/Transcription Factor Buffer Set (Product # 00-5523-00) and protocol. This can be used at less than or equal to 0.125 µg per test. A test is defined as the amount (µg) of antibody that will stain a cell sample in a final volume of 100 µL. Cell number should be determined empirically but can range from 10^5 to 10^8 cells/test. This SolA15 antibody has also been tested by immunocytochemistry on fixed and permeabilized C2C12 cells at less than or equal to 10 µg/mL. It is recommended that the antibody be carefully titrated for optimal performance in the assay of interest. eFluor® 660 is a replacement for Alexa Fluor® 647. eFluor® 660 emits at 659 nm and is excited with the red laser (633 nm). Please make sure that your instrument is capable of detecting this fluorochome. Excitation: 633-647 nm; Emission: 668 nm; Laser: Red Laser. Filtration: 0.2 µm post-manufacturing filtered.
- Reactivity
- Human, Mouse, Rat, Canine
- Host
- Rat
- Isotype
- IgG
- Antibody clone number
- SolA15
- Vial size
- 25 μg
- Concentration
- 0.2 mg/mL
- Storage
- 4°C, store in dark, DO NOT FREEZE!
Submitted references Flow cytometry analysis of endothelial cells and subsets of exhausted CD8+ T cells in murine tumor models.
Inhibition of LncRNA Vof-16 expression promotes nerve regeneration and functional recovery after spinal cord injury.
Application of an instructive hydrogel accelerates re-epithelialization of xenografted human skin wounds.
B-cell antigen receptor expression and phosphatidylinositol 3-kinase signaling regulate genesis and maintenance of mouse chronic lymphocytic leukemia.
Macrophage LAMTOR1 Deficiency Prevents Dietary Obesity and Insulin Resistance Through Inflammation-Induced Energy Expenditure.
Gene Signatures Detect Damaged Liver Sinusoidal Endothelial Cells in Chronic Liver Diseases.
Imbalanced Activation of Wnt-/β-Catenin-Signaling in Liver Endothelium Alters Normal Sinusoidal Differentiation.
NEIL3-deficiency increases gut permeability and contributes to a pro-atherogenic metabolic phenotype.
Age-related neurodegeneration and cognitive impairments of NRMT1 knockout mice are preceded by misregulation of RB and abnormal neural stem cell development.
TWIK-1 BAC-GFP Transgenic Mice, an Animal Model for TWIK-1 Expression.
Visualization of individual cell division history in complex tissues using iCOUNT.
IL-1beta promotes the age-associated decline of beta cell function.
Adult neural stem cells have latent inflammatory potential that is kept suppressed by Tcf4 to facilitate adult neurogenesis.
Notch Signaling between Cerebellar Granule Cell Progenitors.
Developmental Role of Adenosine Kinase in the Cerebellum.
Environmental oxygen regulates astrocyte proliferation to guide angiogenesis during retinal development.
Shikonin Derivatives from Onsoma visianii Decrease Expression of Phosphorylated STAT3 in Leukemia Cells and Exert Antitumor Activity.
Field size effects on DNA damage and proliferation in normal human cell populations irradiated with X-ray microbeams.
Mutant ASXL1 induces age-related expansion of phenotypic hematopoietic stem cells through activation of Akt/mTOR pathway.
A booster dose enhances immunogenicity of the COVID-19 vaccine candidate ChAdOx1 nCoV-19 in aged mice.
MHC Class II Antigen Presentation by Lymphatic Endothelial Cells in Tumors Promotes Intratumoral Regulatory T cell-Suppressive Functions.
HOXA11 plays critical roles in disease progression and response to cytarabine in AML.
Thrombospondin-2 spatiotemporal expression in skeletal fractures.
Targeting Phosphatidylserine Enhances the Anti-tumor Response to Tumor-Directed Radiation Therapy in a Preclinical Model of Melanoma.
CXCR4 Regulates Temporal Differentiation via PRC1 Complex in Organogenesis of Epithelial Glands.
Heterogeneity of astrocytes: Electrophysiological properties of juxtavascular astrocytes before and after brain injury.
Requirement of DNMT1 to orchestrate epigenomic reprogramming for NPM-ALK-driven lymphomagenesis.
Transcription factor old astrocyte specifically induced substance is a novel regulator of kidney fibrosis.
Dissecting phenotypic transitions in metastatic disease via photoconversion-based isolation.
An mTORC1-dependent switch orchestrates the transition between mouse spermatogonial stem cells and clones of progenitor spermatogonia.
GTSE1 is possibly involved in the DNA damage repair and cisplatin resistance in osteosarcoma.
Epicardial placement of human MSC-loaded fibrin sealant films for heart failure: Preclinical efficacy and mechanistic data.
MicroRNA-384 inhibits nasopharyngeal carcinoma growth and metastasis via binding to Smad5 and suppressing the Wnt/β-catenin axis.
CDCP1 promotes compensatory renal growth by integrating Src and Met signaling.
Delta-like 4 is required for pulmonary vascular arborization and alveolarization in the developing lung.
Ten-eleven translocation protein 1 modulates medulloblastoma progression.
Targeting Feedforward Loops Formed by Nuclear Receptor RORγ and Kinase PBK in mCRPC with Hyperactive AR Signaling.
Treatment of mice with a ligand binding blocking anti-CD28 monoclonal antibody improves healing after myocardial infarction.
Aripiprazole reduces liver cell division.
Changes in Liver Mechanical Properties and Water Diffusivity During Normal Pregnancy Are Driven by Cellular Hypertrophy.
Radiation Induced Metabolic Alterations Associate With Tumor Aggressiveness and Poor Outcome in Glioblastoma.
EphrinB2-EphB4 signalling provides Rho-mediated homeostatic control of lymphatic endothelial cell junction integrity.
The effects of hedgehog ligand neutralising antibody 5E1 in a mouse model of endometriosis.
Egr2-guided histone H2B monoubiquitination is required for peripheral nervous system myelination.
Novel enhanced GFP-positive congenic inbred strain establishment and application of tumor-bearing nude mouse model.
Mycobacterium tuberculosis-infected alveolar epithelial cells modulate dendritic cell function through the HIF-1α-NOS2 axis.
B Cell Activating Factor (BAFF) Is Required for the Development of Intra-Renal Tertiary Lymphoid Organs in Experimental Kidney Transplantation in Rats.
Regeneration of the pulmonary vascular endothelium after viral pneumonia requires COUP-TF2.
Discrete populations of isotype-switched memory B lymphocytes are maintained in murine spleen and bone marrow.
Epithelial Vegfa Specifies a Distinct Endothelial Population in the Mouse Lung.
Metastasis-initiating cells induce and exploit a fibroblast niche to fuel malignant colonization of the lungs.
Mutant ACVR1 Arrests Glial Cell Differentiation to Drive Tumorigenesis in Pediatric Gliomas.
Transcriptome analysis of basic fibroblast growth factor treated stem cells isolated from human exfoliated deciduous teeth.
Snai2 Maintains Bone Marrow Niche Cells by Repressing Osteopontin Expression.
A single-cell transcriptomic and anatomic atlas of mouse dorsal raphe Pet1 neurons.
Comparative Analysis of Age-Related Changes in Lacrimal Glands and Meibomian Glands of a C57BL/6 Male Mouse Model.
Genetic manipulation of LKB1 elicits lethal metastatic prostate cancer.
FGF2 modulates simultaneously the mode, the rate of division and the growth fraction in cultures of radial glia.
Quinazolinone derivative BNUA-3 ameliorated [NDEA+2-AAF]-induced liver carcinogenesis in SD rats by modulating AhR-CYP1B1-Nrf2-Keap1 pathway.
Follicular Regulatory T Cells Can Access the Germinal Center Independently of CXCR5.
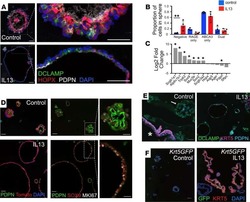
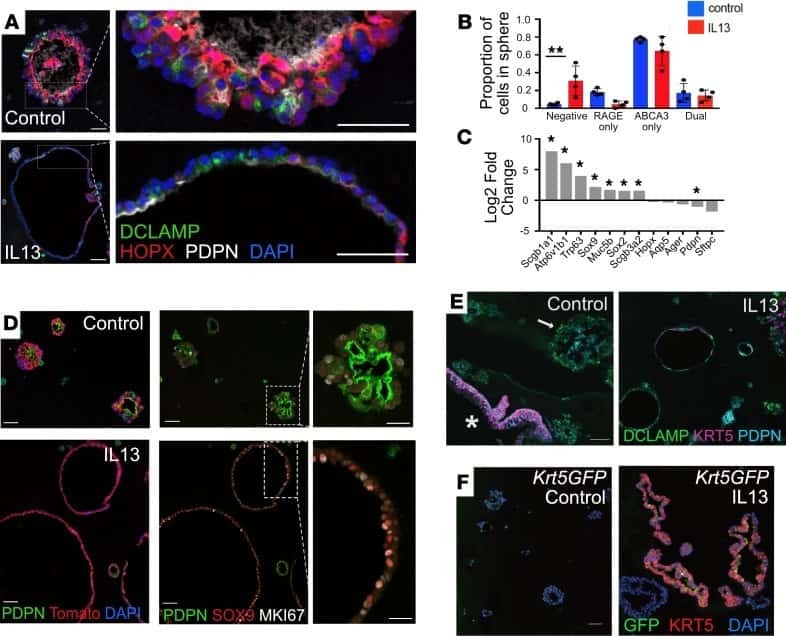
Interleukin-13 disrupts type 2 pneumocyte stem cell activity.
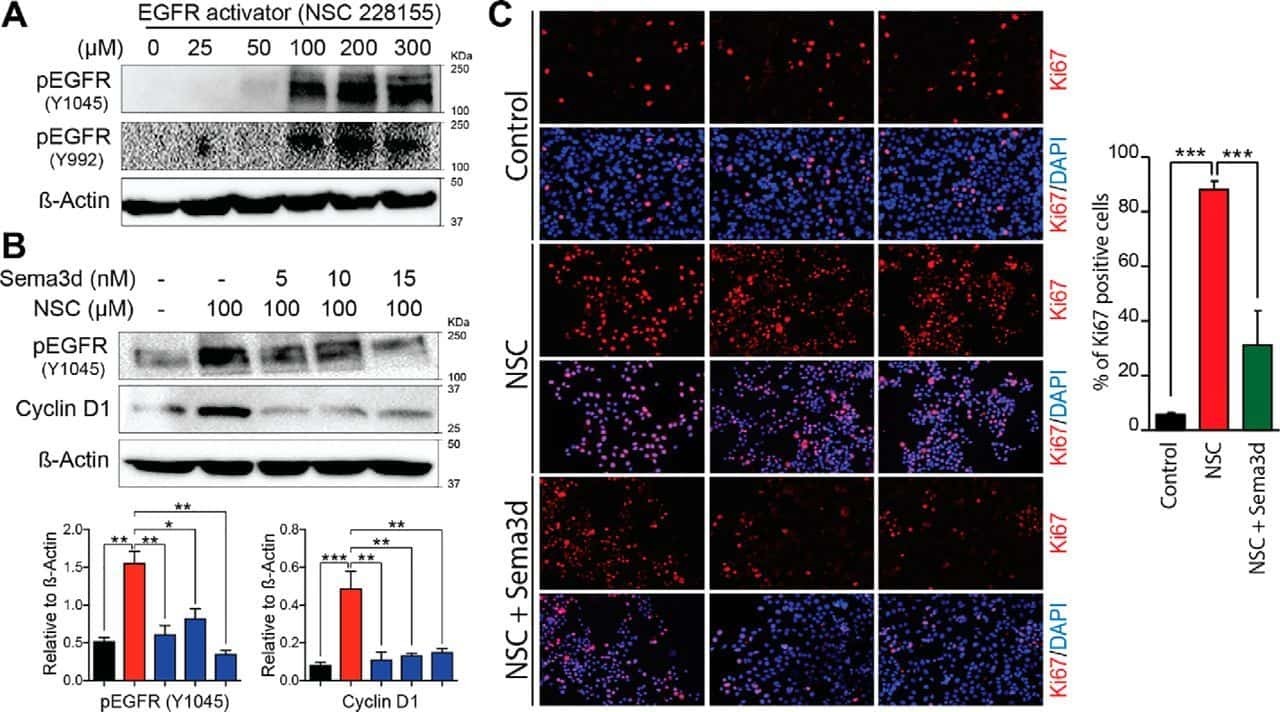
Chemosensitization of prostate cancer stem cells in mice by angiogenin and plexin-B2 inhibitors.
Multimodal single-cell analysis reveals distinct radioresistant stem-like and progenitor cell populations in murine glioma.
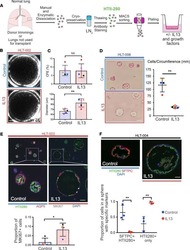
Human Lung Stem Cell-Based Alveolospheres Provide Insights into SARS-CoV-2-Mediated Interferon Responses and Pneumocyte Dysfunction.
CD103(+) cDC1 and endogenous CD8(+) T cells are necessary for improved CD40L-overexpressing CAR T cell antitumor function.
Cardiac fibroblast proliferation rates and collagen expression mature early and are unaltered with advancing age.
Elevated Serum Amino Acids Induce a Subpopulation of Alpha Cells to Initiate Pancreatic Neuroendocrine Tumor Formation.
A discrete subtype of neural progenitor crucial for cortical folding in the gyrencephalic mammalian brain.
Absence of p21(WAF1/CIP1/SDI1) protects against osteopenia and minimizes bone loss after ovariectomy in a mouse model.
Lymphoid Aggregates in the CNS of Progressive Multiple Sclerosis Patients Lack Regulatory T Cells.
Sensing of apoptotic cells through Axl causes lung basal cell proliferation in inflammatory diseases.
SORLA regulates endosomal trafficking and oncogenic fitness of HER2.
Deficiency in the secreted protein Semaphorin3d causes abnormal parathyroid development in mice.
Soluble TREM2 ameliorates pathological phenotypes by modulating microglial functions in an Alzheimer's disease model.
Live imaging of alveologenesis in precision-cut lung slices reveals dynamic epithelial cell behaviour.
Comprehensive and cell-type-based characterization of the dorsal midbrain during development.
Absence of TGFβ signaling in retinal microglia induces retinal degeneration and exacerbates choroidal neovascularization.
JAK-STAT inhibition impairs K-RAS-driven lung adenocarcinoma progression.
FCRL5(+) Memory B Cells Exhibit Robust Recall Responses.
Noc4L-Mediated Ribosome Biogenesis Controls Activation of Regulatory and Conventional T Cells.
Anti-commensal IgG Drives Intestinal Inflammation and Type 17 Immunity in Ulcerative Colitis.
Pulsatile MEK Inhibition Improves Anti-tumor Immunity and T Cell Function in Murine Kras Mutant Lung Cancer.
Intraclonal Plasticity in Mammary Tumors Revealed through Large-Scale Single-Cell Resolution 3D Imaging.
ATF3 Sustains IL-22-Induced STAT3 Phosphorylation to Maintain Mucosal Immunity Through Inhibiting Phosphatases.
C-Kit Cardiac Progenitor Cell Based Cell Sheet Improves Vascularization and Attenuates Cardiac Remodeling following Myocardial Infarction in Rats.
Pax6 Lengthens G1 Phase and Decreases Oscillating Cdk6 Levels in Murine Embryonic Cortical Progenitors.
Factors Within the Endoneurial Microenvironment Act to Suppress Tumorigenesis of MPNST.
ARTS mediates apoptosis and regeneration of the intestinal stem cell niche.
Lymphotoxin α fine-tunes T cell clonal deletion by regulating thymic entry of antigen-presenting cells.
Adrenergic nerve degeneration in bone marrow drives aging of the hematopoietic stem cell niche.
Expression of mutant Asxl1 perturbs hematopoiesis and promotes susceptibility to leukemic transformation.
Stem cell factor is selectively secreted by arterial endothelial cells in bone marrow.
The organic ester O,O'-diethyl-(S,S)-ethylenediamine-N,N'-di-2-(3-cyclohexyl)propanoate dihydrochloride attenuates murine breast cancer growth and metastasis.
Selective pharmacological inhibition of DDR1 prevents experimentally-induced glomerulonephritis in prevention and therapeutic regime.
Vitreous Cytokine Expression and a Murine Model Suggest a Key Role of Microglia in the Inflammatory Response to Retinal Detachment.
A Metabolite-Triggered Tuft Cell-ILC2 Circuit Drives Small Intestinal Remodeling.
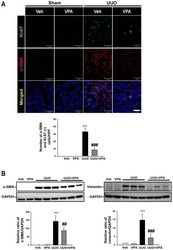
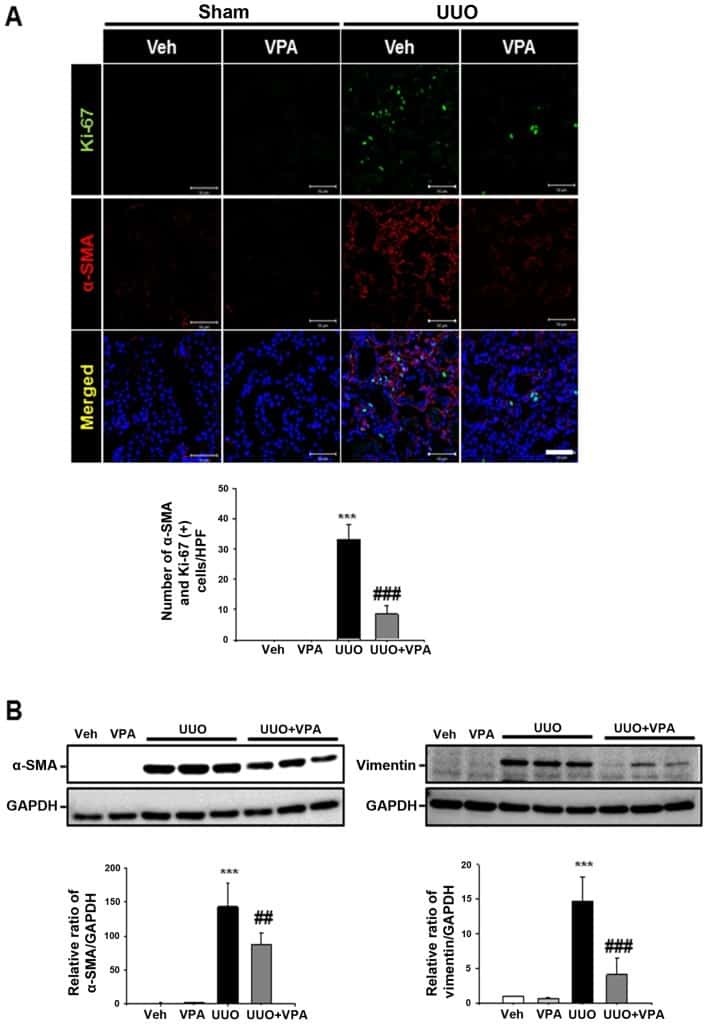
Inhibition of histone deacetylase 1 ameliorates renal tubulointerstitial fibrosis via modulation of inflammation and extracellular matrix gene transcription in mice.
Dual-targeting Wnt and uPA receptors using peptide conjugated ultra-small nanoparticle drug carriers inhibited cancer stem-cell phenotype in chemo-resistant breast cancer.
Modulation of Myelopoiesis Progenitors Is an Integral Component of Trained Immunity.
MicroRNA-126 deficiency enhanced the activation and function of CD4(+) T cells by elevating IRS-1 pathway.
Defining Lineage Potential and Fate Behavior of Precursors during Pancreas Development.
Fc Effector Function Contributes to the Activity of Human Anti-CTLA-4 Antibodies.
1810011o10 Rik Inhibits the Antitumor Effect of Intratumoral CD8(+) T Cells through Suppression of Notch2 Pathway in a Murine Hepatocellular Carcinoma Model.
The Ror1 receptor tyrosine kinase plays a critical role in regulating satellite cell proliferation during regeneration of injured muscle.
A somatic mutation in erythro-myeloid progenitors causes neurodegenerative disease.
Neonatal pancreatic pericytes support β-cell proliferation.
Histone variant H2A.J accumulates in senescent cells and promotes inflammatory gene expression.
Differential cytokine contributions of perivascular haematopoietic stem cell niches.
Egr2 and 3 control adaptive immune responses by temporally uncoupling expansion from T cell differentiation.
De Novo Epigenetic Programs Inhibit PD-1 Blockade-Mediated T Cell Rejuvenation.
IL-4 as a Repurposed Biological Drug for Myocardial Infarction through Augmentation of Reparative Cardiac Macrophages: Proof-of-Concept Data in Mice.
Viral RNA-Unprimed Rig-I Restrains Stat3 Activation in the Modulation of Regulatory T Cell/Th17 Cell Balance.
White Adipose Tissue Is a Reservoir for Memory T Cells and Promotes Protective Memory Responses to Infection.
Hypoxia-Inducible Factor 1α Signaling Promotes Repair of the Alveolar Epithelium after Acute Lung Injury.
The MEK inhibitor selumetinib complements CTLA-4 blockade by reprogramming the tumor immune microenvironment.
Mutations in 5-methylcytosine oxidase TET2 and RhoA cooperatively disrupt T cell homeostasis.
Myeloid progenitor cluster formation drives emergency and leukaemic myelopoiesis.
The stress kinase GCN2 does not mediate suppression of antitumor T cell responses by tryptophan catabolism in experimental melanomas.
Growth and metastasis of lung adenocarcinoma is potentiated by BMP4-mediated immunosuppression.
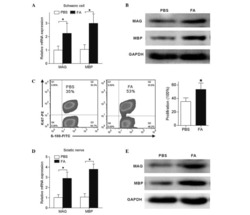
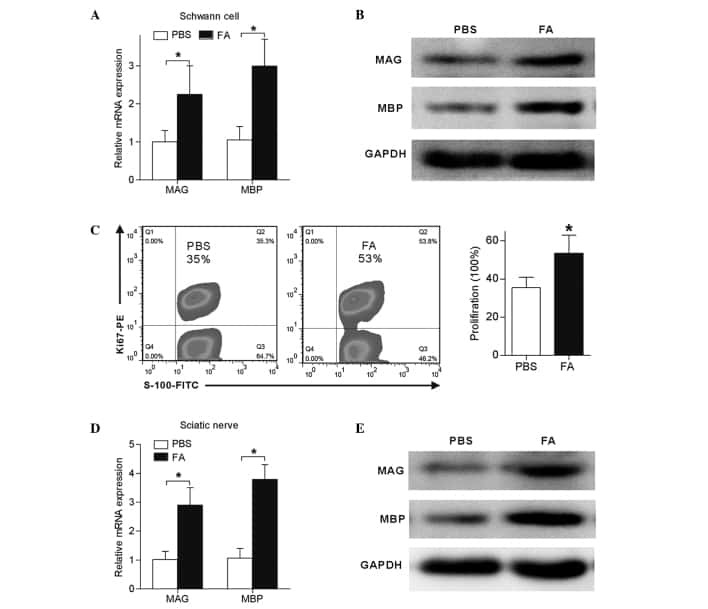
Schwann cell proliferation and differentiation that is induced by ferulic acid through MEK1/ERK1/2 signalling promotes peripheral nerve remyelination following crush injury in rats.
Host-Protozoan Interactions Protect from Mucosal Infections through Activation of the Inflammasome.
Whole Chromosome Instability induces senescence and promotes SASP.
Hyaluronan and TLR4 promote surfactant-protein-C-positive alveolar progenitor cell renewal and prevent severe pulmonary fibrosis in mice.
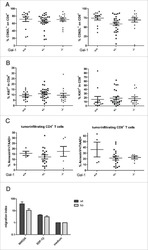
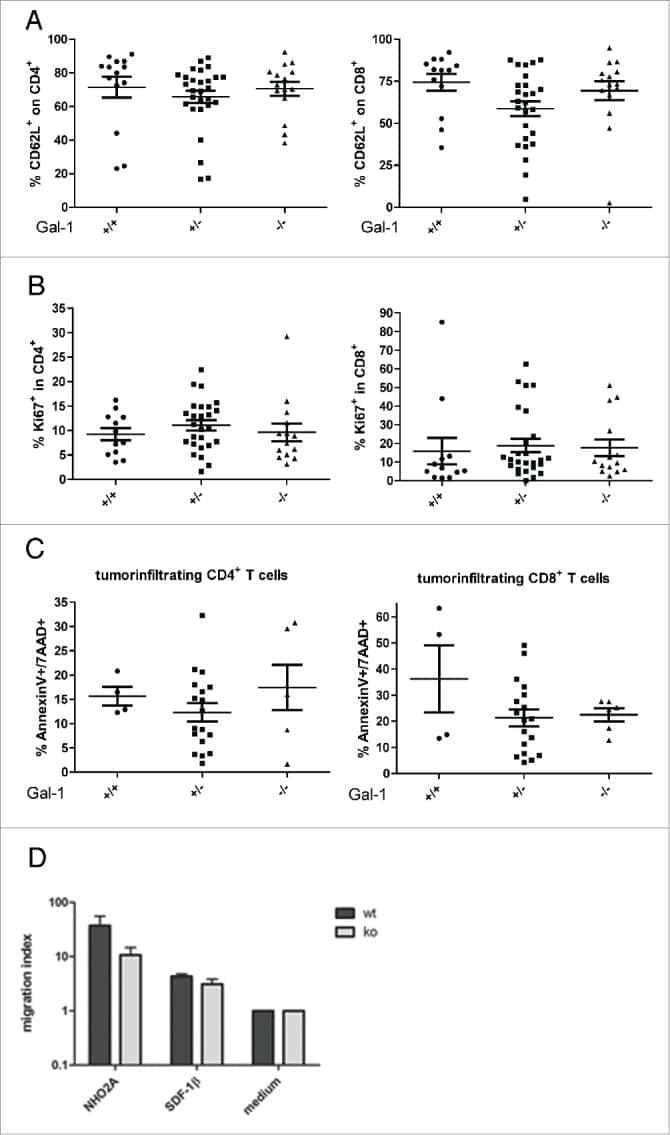
Immune response modulation by Galectin-1 in a transgenic model of neuroblastoma.
Co-culture with intestinal epithelial organoids allows efficient expansion and motility analysis of intraepithelial lymphocytes.
The cell proliferation antigen Ki-67 organises heterochromatin.
Image-based detection and targeting of therapy resistance in pancreatic adenocarcinoma.
RANKL/RANK control Brca1 mutation- .
Heterogeneous fibroblasts underlie age-dependent tertiary lymphoid tissues in the kidney.
Detection of Cell Proliferation Markers by Immunofluorescence Staining and Microscopy Imaging in Paraffin-Embedded Tissue Sections.
Oligodendrocyte death results in immune-mediated CNS demyelination.
Lineage-specific enhancers activate self-renewal genes in macrophages and embryonic stem cells.
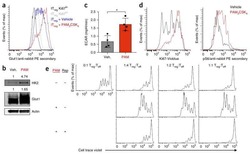
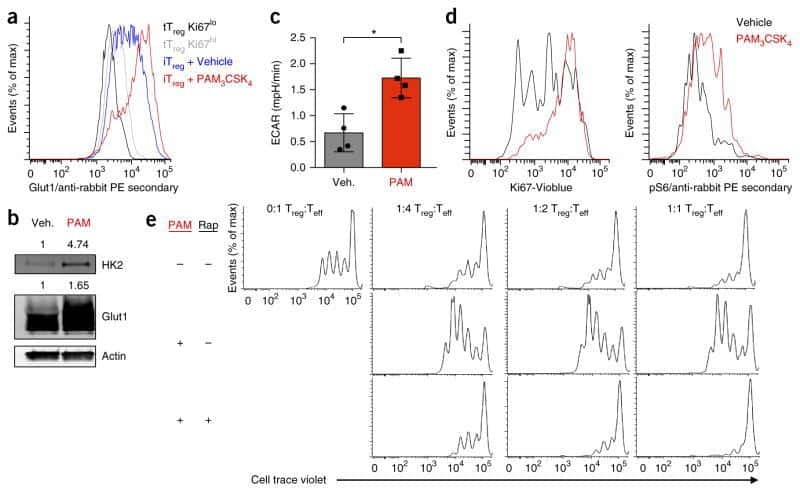
Foxp3 and Toll-like receptor signaling balance T(reg) cell anabolic metabolism for suppression.
Suppression of ischemia in arterial occlusive disease by JNK-promoted native collateral artery development.
Newborn hypoxia/anoxia inhibits cardiomyocyte proliferation and decreases cardiomyocyte endowment in the developing heart: role of endothelin-1.
Epithelial-to-mesenchymal transition induces cell cycle arrest and parenchymal damage in renal fibrosis.
Mammary Stem Cells and Tumor-Initiating Cells Are More Resistant to Apoptosis and Exhibit Increased DNA Repair Activity in Response to DNA Damage.
Low levels of endogenous or X-ray-induced DNA double-strand breaks activate apoptosis in adult neural stem cells.
NF-κB-induced microRNA-31 promotes epidermal hyperplasia by repressing protein phosphatase 6 in psoriasis.
The adhesion G protein-coupled receptor GPR56 is a cell-autonomous regulator of oligodendrocyte development.
Ubiquitous L1 mosaicism in hippocampal neurons.
Metastasis is regulated via microRNA-200/ZEB1 axis control of tumour cell PD-L1 expression and intratumoral immunosuppression.
Alveolar progenitor and stem cells in lung development, renewal and cancer.
Myeloid cells expressing VEGF and arginase-1 following uptake of damaged retinal pigment epithelium suggests potential mechanism that drives the onset of choroidal angiogenesis in mice.
Small intestine inflammation in Roquin-mutant and Roquin-deficient mice.
Dedifferentiation of committed epithelial cells into stem cells in vivo.
IL-1R signaling in dendritic cells replaces pattern-recognition receptors in promoting CD8⁺ T cell responses to influenza A virus.
Primate B-1 cells generate antigen-specific B cell responses to T cell-independent type 2 antigens.
Blanchard L, Vina E, Asrir A, Tardiveau C, Coudert J, Laffont R, Tarroux D, Bettini S, Veerman K, Lafouresse F, Pichery M, Mirey E, Bellard E, Ortega N, Girard JP
STAR protocols 2022 Jun 17;3(2):101444
STAR protocols 2022 Jun 17;3(2):101444
Inhibition of LncRNA Vof-16 expression promotes nerve regeneration and functional recovery after spinal cord injury.
Zhang XM, Zeng LN, Yang WY, Ding L, Chen KZ, Fu WJ, Zeng SQ, Liang YR, Chen GH, Wu HF
Neural regeneration research 2022 Jan;17(1):217-227
Neural regeneration research 2022 Jan;17(1):217-227
Application of an instructive hydrogel accelerates re-epithelialization of xenografted human skin wounds.
Sparks HD, Mandla S, Vizely K, Rosin N, Radisic M, Biernaskie J
Scientific reports 2022 Aug 20;12(1):14233
Scientific reports 2022 Aug 20;12(1):14233
B-cell antigen receptor expression and phosphatidylinositol 3-kinase signaling regulate genesis and maintenance of mouse chronic lymphocytic leukemia.
Schmid VK, Khadour A, Ahmed N, Brandl C, Nitschke L, Rajewsky K, Jumaa H, Hobeika E
Haematologica 2022 Aug 1;107(8):1796-1814
Haematologica 2022 Aug 1;107(8):1796-1814
Macrophage LAMTOR1 Deficiency Prevents Dietary Obesity and Insulin Resistance Through Inflammation-Induced Energy Expenditure.
Ying L, Zhang M, Ma X, Si Y, Li X, Su J, Yin J, Bao Y
Frontiers in cell and developmental biology 2021;9:672032
Frontiers in cell and developmental biology 2021;9:672032
Gene Signatures Detect Damaged Liver Sinusoidal Endothelial Cells in Chronic Liver Diseases.
Verhulst S, van Os EA, De Smet V, Eysackers N, Mannaerts I, van Grunsven LA
Frontiers in medicine 2021;8:750044
Frontiers in medicine 2021;8:750044
Imbalanced Activation of Wnt-/β-Catenin-Signaling in Liver Endothelium Alters Normal Sinusoidal Differentiation.
Koch PS, Sandorski K, Heil J, Schmid CD, Kürschner SW, Hoffmann J, Winkler M, Staniczek T, de la Torre C, Sticht C, Schledzewski K, Taketo MM, Trogisch FA, Heineke J, Géraud C, Goerdt S, Olsavszky V
Frontiers in physiology 2021;12:722394
Frontiers in physiology 2021;12:722394
NEIL3-deficiency increases gut permeability and contributes to a pro-atherogenic metabolic phenotype.
Karlsen TR, Kong XY, Holm S, Quiles-Jiménez A, Dahl TB, Yang K, Sagen EL, Skarpengland T, S Øgaard JD, Holm K, Vestad B, Olsen MB, Aukrust P, Bjørås M, Hov JR, Halvorsen B, Gregersen I
Scientific reports 2021 Oct 5;11(1):19749
Scientific reports 2021 Oct 5;11(1):19749
Age-related neurodegeneration and cognitive impairments of NRMT1 knockout mice are preceded by misregulation of RB and abnormal neural stem cell development.
Catlin JP, Marziali LN, Rein B, Yan Z, Feltri ML, Schaner Tooley CE
Cell death & disease 2021 Oct 28;12(11):1014
Cell death & disease 2021 Oct 28;12(11):1014
TWIK-1 BAC-GFP Transgenic Mice, an Animal Model for TWIK-1 Expression.
Kwon O, Yang H, Kim SC, Kim J, Sim J, Lee J, Hwang EM, Shim S, Park JY
Cells 2021 Oct 14;10(10)
Cells 2021 Oct 14;10(10)
Visualization of individual cell division history in complex tissues using iCOUNT.
Denoth-Lippuner A, Jaeger BN, Liang T, Royall LN, Chie SE, Buthey K, Machado D, Korobeynyk VI, Kruse M, Munz CM, Gerbaulet A, Simons BD, Jessberger S
Cell stem cell 2021 Nov 4;28(11):2020-2034.e12
Cell stem cell 2021 Nov 4;28(11):2020-2034.e12
IL-1beta promotes the age-associated decline of beta cell function.
Böni-Schnetzler M, Méreau H, Rachid L, Wiedemann SJ, Schulze F, Trimigliozzi K, Meier DT, Donath MY
iScience 2021 Nov 19;24(11):103250
iScience 2021 Nov 19;24(11):103250
Adult neural stem cells have latent inflammatory potential that is kept suppressed by Tcf4 to facilitate adult neurogenesis.
Shariq M, Sahasrabuddhe V, Krishna S, Radha S, Nruthyathi, Bellampalli R, Dwivedi A, Cheramangalam R, Reizis B, Hébert J, Ghosh HS
Science advances 2021 May;7(21)
Science advances 2021 May;7(21)
Notch Signaling between Cerebellar Granule Cell Progenitors.
Adachi T, Miyashita S, Yamashita M, Shimoda M, Okonechnikov K, Chavez L, Kool M, Pfister SM, Inoue T, Kawauchi D, Hoshino M
eNeuro 2021 May-Jun;8(3)
eNeuro 2021 May-Jun;8(3)
Developmental Role of Adenosine Kinase in the Cerebellum.
Gebril H, Wahba A, Zhou X, Lai T, Alharfoush E, DiCicco-Bloom E, Boison D
eNeuro 2021 May-Jun;8(3)
eNeuro 2021 May-Jun;8(3)
Environmental oxygen regulates astrocyte proliferation to guide angiogenesis during retinal development.
Perelli RM, O'Sullivan ML, Zarnick S, Kay JN
Development (Cambridge, England) 2021 May 1;148(9)
Development (Cambridge, England) 2021 May 1;148(9)
Shikonin Derivatives from Onsoma visianii Decrease Expression of Phosphorylated STAT3 in Leukemia Cells and Exert Antitumor Activity.
Todorovic Z, Milovanovic J, Arsenijevic D, Vukovic N, Vukic M, Arsenijevic A, Djurdjevic P, Milovanovic M, Arsenijevic N
Nutrients 2021 Mar 31;13(4)
Nutrients 2021 Mar 31;13(4)
Field size effects on DNA damage and proliferation in normal human cell populations irradiated with X-ray microbeams.
Ojima M, Ito A, Usami N, Ohara M, Suzuki K, Kai M
Scientific reports 2021 Mar 26;11(1):7001
Scientific reports 2021 Mar 26;11(1):7001
Mutant ASXL1 induces age-related expansion of phenotypic hematopoietic stem cells through activation of Akt/mTOR pathway.
Fujino T, Goyama S, Sugiura Y, Inoue D, Asada S, Yamasaki S, Matsumoto A, Yamaguchi K, Isobe Y, Tsuchiya A, Shikata S, Sato N, Morinaga H, Fukuyama T, Tanaka Y, Fukushima T, Takeda R, Yamamoto K, Honda H, Nishimura EK, Furukawa Y, Shibata T, Abdel-Wahab O, Suematsu M, Kitamura T
Nature communications 2021 Mar 23;12(1):1826
Nature communications 2021 Mar 23;12(1):1826
A booster dose enhances immunogenicity of the COVID-19 vaccine candidate ChAdOx1 nCoV-19 in aged mice.
Silva-Cayetano A, Foster WS, Innocentin S, Belij-Rammerstorfer S, Spencer AJ, Burton OT, Fra-Bidó S, Le Lee J, Thakur N, Conceicao C, Wright D, Barrett J, Evans-Bailey N, Noble C, Bailey D, Liston A, Gilbert SC, Lambe T, Linterman MA
Med (New York, N.Y.) 2021 Mar 12;2(3):243-262.e8
Med (New York, N.Y.) 2021 Mar 12;2(3):243-262.e8
MHC Class II Antigen Presentation by Lymphatic Endothelial Cells in Tumors Promotes Intratumoral Regulatory T cell-Suppressive Functions.
Gkountidi AO, Garnier L, Dubrot J, Angelillo J, Harlé G, Brighouse D, Wrobel LJ, Pick R, Scheiermann C, Swartz MA, Hugues S
Cancer immunology research 2021 Jul;9(7):748-764
Cancer immunology research 2021 Jul;9(7):748-764
HOXA11 plays critical roles in disease progression and response to cytarabine in AML.
Fu JF, Shih LY, Yen TH
Oncology reports 2021 Jul;46(1)
Oncology reports 2021 Jul;46(1)
Thrombospondin-2 spatiotemporal expression in skeletal fractures.
Zondervan RL, Jenkins DC, Reicha JD, Hankenson KD
Journal of orthopaedic research : official publication of the Orthopaedic Research Society 2021 Jan;39(1):30-41
Journal of orthopaedic research : official publication of the Orthopaedic Research Society 2021 Jan;39(1):30-41
Targeting Phosphatidylserine Enhances the Anti-tumor Response to Tumor-Directed Radiation Therapy in a Preclinical Model of Melanoma.
Budhu S, Giese R, Gupta A, Fitzgerald K, Zappasodi R, Schad S, Hirschhorn D, Campesato LF, De Henau O, Gigoux M, Liu C, Mazo G, Deng L, Barker CA, Wolchok JD, Merghoub T
Cell reports 2021 Jan 12;34(2):108620
Cell reports 2021 Jan 12;34(2):108620
CXCR4 Regulates Temporal Differentiation via PRC1 Complex in Organogenesis of Epithelial Glands.
Kim J, Lee SW, Park K
International journal of molecular sciences 2021 Jan 10;22(2)
International journal of molecular sciences 2021 Jan 10;22(2)
Heterogeneity of astrocytes: Electrophysiological properties of juxtavascular astrocytes before and after brain injury.
Götz S, Bribian A, López-Mascaraque L, Götz M, Grothe B, Kunz L
Glia 2021 Feb;69(2):346-361
Glia 2021 Feb;69(2):346-361
Requirement of DNMT1 to orchestrate epigenomic reprogramming for NPM-ALK-driven lymphomagenesis.
Redl E, Sheibani-Tezerji R, Cardona CJ, Hamminger P, Timelthaler G, Hassler MR, Zrimšek M, Lagger S, Dillinger T, Hofbauer L, Draganić K, Tiefenbacher A, Kothmayer M, Dietz CH, Ramsahoye BH, Kenner L, Bock C, Seiser C, Ellmeier W, Schweikert G, Egger G
Life science alliance 2021 Feb;4(2)
Life science alliance 2021 Feb;4(2)
Transcription factor old astrocyte specifically induced substance is a novel regulator of kidney fibrosis.
Yamamoto A, Morioki H, Nakae T, Miyake Y, Harada T, Noda S, Mitsuoka S, Matsumoto K, Tomimatsu M, Kanemoto S, Tanaka S, Maeda M, Conway SJ, Imaizumi K, Fujio Y, Obana M
FASEB journal : official publication of the Federation of American Societies for Experimental Biology 2021 Feb;35(2):e21158
FASEB journal : official publication of the Federation of American Societies for Experimental Biology 2021 Feb;35(2):e21158
Dissecting phenotypic transitions in metastatic disease via photoconversion-based isolation.
Sela Y, Li J, Kuri P, Merrell AJ, Li N, Lengner C, Rompolas P, Stanger BZ
eLife 2021 Feb 23;10
eLife 2021 Feb 23;10
An mTORC1-dependent switch orchestrates the transition between mouse spermatogonial stem cells and clones of progenitor spermatogonia.
Suzuki S, McCarrey JR, Hermann BP
Cell reports 2021 Feb 16;34(7):108752
Cell reports 2021 Feb 16;34(7):108752
GTSE1 is possibly involved in the DNA damage repair and cisplatin resistance in osteosarcoma.
Xie C, Xiang W, Shen H, Shen J
Journal of orthopaedic surgery and research 2021 Dec 7;16(1):713
Journal of orthopaedic surgery and research 2021 Dec 7;16(1):713
Epicardial placement of human MSC-loaded fibrin sealant films for heart failure: Preclinical efficacy and mechanistic data.
Fields L, Ito T, Kobayashi K, Ichihara Y, Podaru MN, Hussain M, Yamashita K, Machado V, Lewis-McDougall F, Suzuki K
Molecular therapy : the journal of the American Society of Gene Therapy 2021 Aug 4;29(8):2554-2570
Molecular therapy : the journal of the American Society of Gene Therapy 2021 Aug 4;29(8):2554-2570
MicroRNA-384 inhibits nasopharyngeal carcinoma growth and metastasis via binding to Smad5 and suppressing the Wnt/β-catenin axis.
Zeng X, Liao H, Wang F
Cytotechnology 2021 Apr;73(2):203-215
Cytotechnology 2021 Apr;73(2):203-215
CDCP1 promotes compensatory renal growth by integrating Src and Met signaling.
Kajiwara K, Yamano S, Aoki K, Okuzaki D, Matsumoto K, Okada M
Life science alliance 2021 Apr;4(4)
Life science alliance 2021 Apr;4(4)
Delta-like 4 is required for pulmonary vascular arborization and alveolarization in the developing lung.
Xia S, Menden HL, Townley N, Mabry SM, Johnston J, Nyp MF, Heruth DP, Korfhagen T, Sampath V
JCI insight 2021 Apr 8;6(7)
JCI insight 2021 Apr 8;6(7)
Ten-eleven translocation protein 1 modulates medulloblastoma progression.
Kim H, Kang Y, Li Y, Chen L, Lin L, Johnson ND, Zhu D, Robinson MH, McSwain L, Barwick BG, Yuan X, Liao X, Zhao J, Zhang Z, Shu Q, Chen J, Allen EG, Kenney AM, Castellino RC, Van Meir EG, Conneely KN, Vertino PM, Jin P, Li J
Genome biology 2021 Apr 29;22(1):125
Genome biology 2021 Apr 29;22(1):125
Targeting Feedforward Loops Formed by Nuclear Receptor RORγ and Kinase PBK in mCRPC with Hyperactive AR Signaling.
Zhang X, Huang Z, Wang J, Ma Z, Yang J, Corey E, Evans CP, Yu AM, Chen HW
Cancers 2021 Apr 1;13(7)
Cancers 2021 Apr 1;13(7)
Treatment of mice with a ligand binding blocking anti-CD28 monoclonal antibody improves healing after myocardial infarction.
Gladow N, Hollmann C, Ramos G, Frantz S, Kerkau T, Beyersdorf N, Hofmann U
PloS one 2020;15(4):e0227734
PloS one 2020;15(4):e0227734
Aripiprazole reduces liver cell division.
Pirc Marolt T, Kramar B, Bulc Rozman K, Šuput D, Milisav I
PloS one 2020;15(10):e0240754
PloS one 2020;15(10):e0240754
Changes in Liver Mechanical Properties and Water Diffusivity During Normal Pregnancy Are Driven by Cellular Hypertrophy.
Garczyńska K, Tzschätzsch H, Kühl AA, Morr AS, Lilaj L, Häckel A, Schellenberger E, Berndt N, Holzhütter HG, Braun J, Sack I, Guo J
Frontiers in physiology 2020;11:605205
Frontiers in physiology 2020;11:605205
Radiation Induced Metabolic Alterations Associate With Tumor Aggressiveness and Poor Outcome in Glioblastoma.
Gupta K, Vuckovic I, Zhang S, Xiong Y, Carlson BL, Jacobs J, Olson I, Petterson XM, Macura SI, Sarkaria J, Burns TC
Frontiers in oncology 2020;10:535
Frontiers in oncology 2020;10:535
EphrinB2-EphB4 signalling provides Rho-mediated homeostatic control of lymphatic endothelial cell junction integrity.
Frye M, Stritt S, Ortsäter H, Hernandez Vasquez M, Kaakinen M, Vicente A, Wiseman J, Eklund L, Martínez-Torrecuadrada JL, Vestweber D, Mäkinen T
eLife 2020 Sep 8;9
eLife 2020 Sep 8;9
The effects of hedgehog ligand neutralising antibody 5E1 in a mouse model of endometriosis.
Cousins FL, Farley JK, Kerrigan R, Mukherjee S, Darzi S, Gargett CE, Deane JA
BMC research notes 2020 Sep 25;13(1):454
BMC research notes 2020 Sep 25;13(1):454
Egr2-guided histone H2B monoubiquitination is required for peripheral nervous system myelination.
Wüst HM, Wegener A, Fröb F, Hartwig AC, Wegwitz F, Kari V, Schimmel M, Tamm ER, Johnsen SA, Wegner M, Sock E
Nucleic acids research 2020 Sep 18;48(16):8959-8976
Nucleic acids research 2020 Sep 18;48(16):8959-8976
Novel enhanced GFP-positive congenic inbred strain establishment and application of tumor-bearing nude mouse model.
Lan Q, Chen Y, Dai C, Li S, Fei X, Dong J, Shen Y, Dai X, Lu Z, Liu B, Wang Q, Wang H, Zhou Z, Ji X, Wang Z, Huang Q
Cancer science 2020 Oct;111(10):3626-3638
Cancer science 2020 Oct;111(10):3626-3638
Mycobacterium tuberculosis-infected alveolar epithelial cells modulate dendritic cell function through the HIF-1α-NOS2 axis.
Rodrigues TS, Alvarez ARP, Gembre AF, Forni MFPAD, de Melo BMS, Alves Filho JCF, Câmara NOS, Bonato VLD
Journal of leukocyte biology 2020 Oct;108(4):1225-1238
Journal of leukocyte biology 2020 Oct;108(4):1225-1238
B Cell Activating Factor (BAFF) Is Required for the Development of Intra-Renal Tertiary Lymphoid Organs in Experimental Kidney Transplantation in Rats.
Steines L, Poth H, Herrmann M, Schuster A, Banas B, Bergler T
International journal of molecular sciences 2020 Oct 28;21(21)
International journal of molecular sciences 2020 Oct 28;21(21)
Regeneration of the pulmonary vascular endothelium after viral pneumonia requires COUP-TF2.
Zhao G, Weiner AI, Neupauer KM, de Mello Costa MF, Palashikar G, Adams-Tzivelekidis S, Mangalmurti NS, Vaughan AE
Science advances 2020 Nov;6(48)
Science advances 2020 Nov;6(48)
Discrete populations of isotype-switched memory B lymphocytes are maintained in murine spleen and bone marrow.
Riedel R, Addo R, Ferreira-Gomes M, Heinz GA, Heinrich F, Kummer J, Greiff V, Schulz D, Klaeden C, Cornelis R, Menzel U, Kröger S, Stervbo U, Köhler R, Haftmann C, Kühnel S, Lehmann K, Maschmeyer P, McGrath M, Naundorf S, Hahne S, Sercan-Alp Ö, Siracusa F, Stefanowski J, Weber M, Westendorf K, Zimmermann J, Hauser AE, Reddy ST, Durek P, Chang HD, Mashreghi MF, Radbruch A
Nature communications 2020 May 22;11(1):2570
Nature communications 2020 May 22;11(1):2570
Epithelial Vegfa Specifies a Distinct Endothelial Population in the Mouse Lung.
Vila Ellis L, Cain MP, Hutchison V, Flodby P, Crandall ED, Borok Z, Zhou B, Ostrin EJ, Wythe JD, Chen J
Developmental cell 2020 Mar 9;52(5):617-630.e6
Developmental cell 2020 Mar 9;52(5):617-630.e6
Metastasis-initiating cells induce and exploit a fibroblast niche to fuel malignant colonization of the lungs.
Pein M, Insua-Rodríguez J, Hongu T, Riedel A, Meier J, Wiedmann L, Decker K, Essers MAG, Sinn HP, Spaich S, Sütterlin M, Schneeweiss A, Trumpp A, Oskarsson T
Nature communications 2020 Mar 20;11(1):1494
Nature communications 2020 Mar 20;11(1):1494
Mutant ACVR1 Arrests Glial Cell Differentiation to Drive Tumorigenesis in Pediatric Gliomas.
Fortin J, Tian R, Zarrabi I, Hill G, Williams E, Sanchez-Duffhues G, Thorikay M, Ramachandran P, Siddaway R, Wong JF, Wu A, Apuzzo LN, Haight J, You-Ten A, Snow BE, Wakeham A, Goldhamer DJ, Schramek D, Bullock AN, Dijke PT, Hawkins C, Mak TW
Cancer cell 2020 Mar 16;37(3):308-323.e12
Cancer cell 2020 Mar 16;37(3):308-323.e12
Transcriptome analysis of basic fibroblast growth factor treated stem cells isolated from human exfoliated deciduous teeth.
Nowwarote N, Manokawinchoke J, Kanjana K, Fournier BPJ, Sukarawan W, Osathanon T
Heliyon 2020 Jun;6(6):e04246
Heliyon 2020 Jun;6(6):e04246
Snai2 Maintains Bone Marrow Niche Cells by Repressing Osteopontin Expression.
Wei Q, Nakahara F, Asada N, Zhang D, Gao X, Xu C, Alfieri A, Brodin NP, Zimmerman SE, Mar JC, Guha C, Guo W, Frenette PS
Developmental cell 2020 Jun 8;53(5):503-513.e5
Developmental cell 2020 Jun 8;53(5):503-513.e5
A single-cell transcriptomic and anatomic atlas of mouse dorsal raphe Pet1 neurons.
Okaty BW, Sturrock N, Escobedo Lozoya Y, Chang Y, Senft RA, Lyon KA, Alekseyenko OV, Dymecki SM
eLife 2020 Jun 22;9
eLife 2020 Jun 22;9
Comparative Analysis of Age-Related Changes in Lacrimal Glands and Meibomian Glands of a C57BL/6 Male Mouse Model.
Yoon CH, Ryu JS, Hwang HS, Kim MK
International journal of molecular sciences 2020 Jun 11;21(11)
International journal of molecular sciences 2020 Jun 11;21(11)
Genetic manipulation of LKB1 elicits lethal metastatic prostate cancer.
Hermanova I, Zúñiga-García P, Caro-Maldonado A, Fernandez-Ruiz S, Salvador F, Martín-Martín N, Zabala-Letona A, Nuñez-Olle M, Torrano V, Camacho L, Lizcano JM, Talamillo A, Carreira S, Gurel B, Cortazar AR, Guiu M, López JI, Martinez-Romero A, Astobiza I, Valcarcel-Jimenez L, Lorente M, Arruabarrena-Aristorena A, Velasco G, Gomez-Muñoz A, Suárez-Cabrera C, Lodewijk I, Flores JM, Sutherland JD, Barrio R, de Bono JS, Paramio JM, Trka J, Graupera M, Gomis RR, Carracedo A
The Journal of experimental medicine 2020 Jun 1;217(6)
The Journal of experimental medicine 2020 Jun 1;217(6)
FGF2 modulates simultaneously the mode, the rate of division and the growth fraction in cultures of radial glia.
Ledesma-Terrón M, Peralta-Cañadas N, Míguez DG
Development (Cambridge, England) 2020 Jul 24;147(14)
Development (Cambridge, England) 2020 Jul 24;147(14)
Quinazolinone derivative BNUA-3 ameliorated [NDEA+2-AAF]-induced liver carcinogenesis in SD rats by modulating AhR-CYP1B1-Nrf2-Keap1 pathway.
Bose P, Siddique MUM, Acharya R, Jayaprakash V, Sinha BN, Lapenna A, Pattanayak SP
Clinical and experimental pharmacology & physiology 2020 Jan;47(1):143-157
Clinical and experimental pharmacology & physiology 2020 Jan;47(1):143-157
Follicular Regulatory T Cells Can Access the Germinal Center Independently of CXCR5.
Vanderleyden I, Fra-Bido SC, Innocentin S, Stebegg M, Okkenhaug H, Evans-Bailey N, Pierson W, Denton AE, Linterman MA
Cell reports 2020 Jan 21;30(3):611-619.e4
Cell reports 2020 Jan 21;30(3):611-619.e4
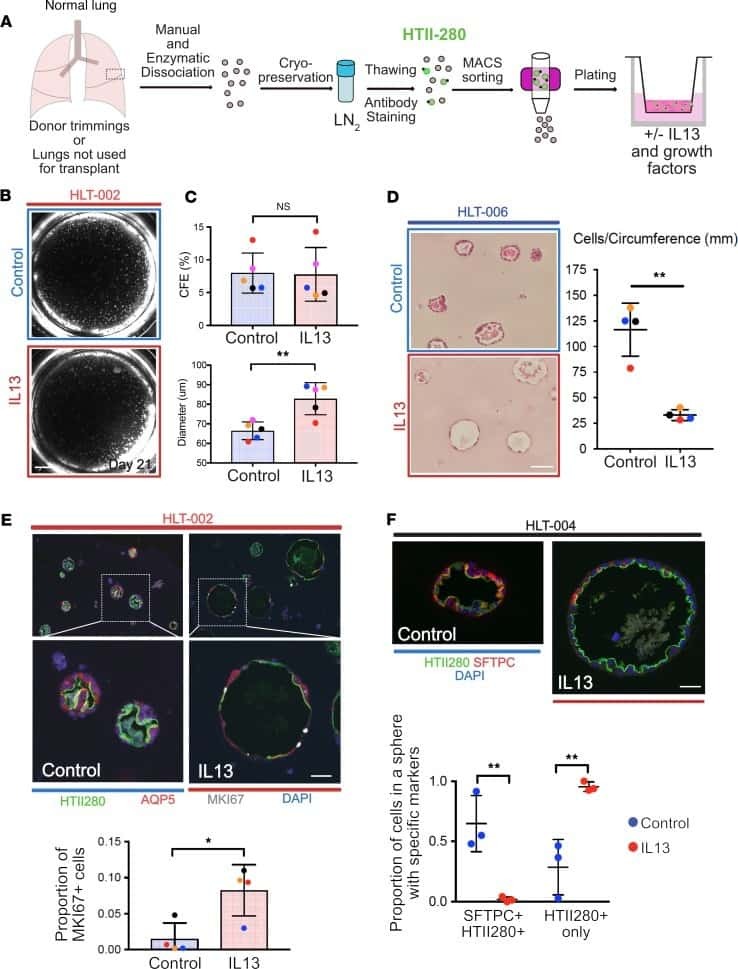
Interleukin-13 disrupts type 2 pneumocyte stem cell activity.
Glisinski KM, Schlobohm AJ, Paramore SV, Birukova A, Moseley MA, Foster MW, Barkauskas CE
JCI insight 2020 Jan 16;5(1)
JCI insight 2020 Jan 16;5(1)
Chemosensitization of prostate cancer stem cells in mice by angiogenin and plexin-B2 inhibitors.
Li S, Goncalves KA, Lyu B, Yuan L, Hu GF
Communications biology 2020 Jan 15;3(1):26
Communications biology 2020 Jan 15;3(1):26
Multimodal single-cell analysis reveals distinct radioresistant stem-like and progenitor cell populations in murine glioma.
Alexander J, LaPlant QC, Pattwell SS, Szulzewsky F, Cimino PJ, Caruso FP, Pugliese P, Chen Z, Chardon F, Hill AJ, Spurrell C, Ahrendsen D, Pietras A, Starita LM, Hambardzumyan D, Iavarone A, Shendure J, Holland EC
Glia 2020 Dec;68(12):2486-2502
Glia 2020 Dec;68(12):2486-2502
Human Lung Stem Cell-Based Alveolospheres Provide Insights into SARS-CoV-2-Mediated Interferon Responses and Pneumocyte Dysfunction.
Katsura H, Sontake V, Tata A, Kobayashi Y, Edwards CE, Heaton BE, Konkimalla A, Asakura T, Mikami Y, Fritch EJ, Lee PJ, Heaton NS, Boucher RC, Randell SH, Baric RS, Tata PR
Cell stem cell 2020 Dec 3;27(6):890-904.e8
Cell stem cell 2020 Dec 3;27(6):890-904.e8
CD103(+) cDC1 and endogenous CD8(+) T cells are necessary for improved CD40L-overexpressing CAR T cell antitumor function.
Kuhn NF, Lopez AV, Li X, Cai W, Daniyan AF, Brentjens RJ
Nature communications 2020 Dec 2;11(1):6171
Nature communications 2020 Dec 2;11(1):6171
Cardiac fibroblast proliferation rates and collagen expression mature early and are unaltered with advancing age.
Wu R, Ma F, Tosevska A, Farrell C, Pellegrini M, Deb A
JCI insight 2020 Dec 17;5(24)
JCI insight 2020 Dec 17;5(24)
Elevated Serum Amino Acids Induce a Subpopulation of Alpha Cells to Initiate Pancreatic Neuroendocrine Tumor Formation.
Smith DK, Kates L, Durinck S, Patel N, Stawiski EW, Kljavin N, Foreman O, Sipos B, Solloway MJ, Allan BB, Peterson AS
Cell reports. Medicine 2020 Aug 25;1(5):100058
Cell reports. Medicine 2020 Aug 25;1(5):100058
A discrete subtype of neural progenitor crucial for cortical folding in the gyrencephalic mammalian brain.
Matsumoto N, Tanaka S, Horiike T, Shinmyo Y, Kawasaki H
eLife 2020 Apr 21;9
eLife 2020 Apr 21;9
Absence of p21(WAF1/CIP1/SDI1) protects against osteopenia and minimizes bone loss after ovariectomy in a mouse model.
Premnath P, Ferrie L, Louie D, Boyd S, Krawetz R
PloS one 2019;14(4):e0215018
PloS one 2019;14(4):e0215018
Lymphoid Aggregates in the CNS of Progressive Multiple Sclerosis Patients Lack Regulatory T Cells.
Bell L, Lenhart A, Rosenwald A, Monoranu CM, Berberich-Siebelt F
Frontiers in immunology 2019;10:3090
Frontiers in immunology 2019;10:3090
Sensing of apoptotic cells through Axl causes lung basal cell proliferation in inflammatory diseases.
Fujino N, Brand OJ, Morgan DJ, Fujimori T, Grabiec AM, Jagger CP, Maciewicz RA, Yamada M, Itakura K, Sugiura H, Ichinose M, Hussell T
The Journal of experimental medicine 2019 Sep 2;216(9):2184-2201
The Journal of experimental medicine 2019 Sep 2;216(9):2184-2201
SORLA regulates endosomal trafficking and oncogenic fitness of HER2.
Pietilä M, Sahgal P, Peuhu E, Jäntti NZ, Paatero I, Närvä E, Al-Akhrass H, Lilja J, Georgiadou M, Andersen OM, Padzik A, Sihto H, Joensuu H, Blomqvist M, Saarinen I, Boström PJ, Taimen P, Ivaska J
Nature communications 2019 May 28;10(1):2340
Nature communications 2019 May 28;10(1):2340
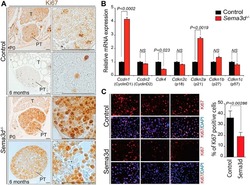
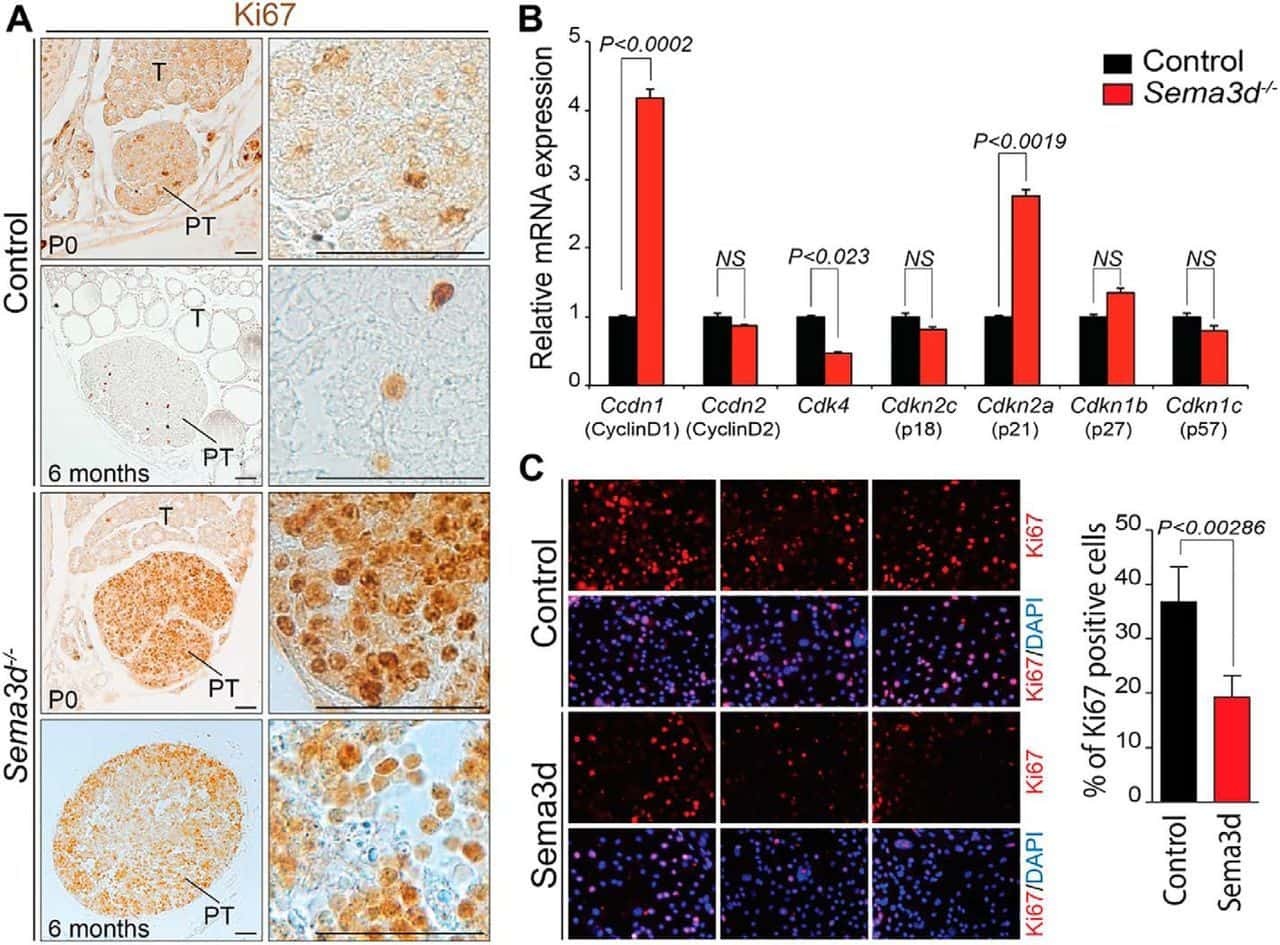
Deficiency in the secreted protein Semaphorin3d causes abnormal parathyroid development in mice.
Singh A, Mia MM, Cibi DM, Arya AK, Bhadada SK, Singh MK
The Journal of biological chemistry 2019 May 24;294(21):8336-8347
The Journal of biological chemistry 2019 May 24;294(21):8336-8347
Soluble TREM2 ameliorates pathological phenotypes by modulating microglial functions in an Alzheimer's disease model.
Zhong L, Xu Y, Zhuo R, Wang T, Wang K, Huang R, Wang D, Gao Y, Zhu Y, Sheng X, Chen K, Wang N, Zhu L, Can D, Marten Y, Shinohara M, Liu CC, Du D, Sun H, Wen L, Xu H, Bu G, Chen XF
Nature communications 2019 Mar 25;10(1):1365
Nature communications 2019 Mar 25;10(1):1365
Live imaging of alveologenesis in precision-cut lung slices reveals dynamic epithelial cell behaviour.
Akram KM, Yates LL, Mongey R, Rothery S, Gaboriau DCA, Sanderson J, Hind M, Griffiths M, Dean CH
Nature communications 2019 Mar 12;10(1):1178
Nature communications 2019 Mar 12;10(1):1178
Comprehensive and cell-type-based characterization of the dorsal midbrain during development.
Arimura N, Dewa KI, Okada M, Yanagawa Y, Taya SI, Hoshino M
Genes to cells : devoted to molecular & cellular mechanisms 2019 Jan;24(1):41-59
Genes to cells : devoted to molecular & cellular mechanisms 2019 Jan;24(1):41-59
Absence of TGFβ signaling in retinal microglia induces retinal degeneration and exacerbates choroidal neovascularization.
Ma W, Silverman SM, Zhao L, Villasmil R, Campos MM, Amaral J, Wong WT
eLife 2019 Jan 22;8
eLife 2019 Jan 22;8
JAK-STAT inhibition impairs K-RAS-driven lung adenocarcinoma progression.
Mohrherr J, Haber M, Breitenecker K, Aigner P, Moritsch S, Voronin V, Eferl R, Moriggl R, Stoiber D, Győrffy B, Brcic L, László V, Döme B, Moldvay J, Dezső K, Bilban M, Popper H, Moll HP, Casanova E
International journal of cancer 2019 Dec 15;145(12):3376-3388
International journal of cancer 2019 Dec 15;145(12):3376-3388
FCRL5(+) Memory B Cells Exhibit Robust Recall Responses.
Kim CC, Baccarella AM, Bayat A, Pepper M, Fontana MF
Cell reports 2019 Apr 30;27(5):1446-1460.e4
Cell reports 2019 Apr 30;27(5):1446-1460.e4
Noc4L-Mediated Ribosome Biogenesis Controls Activation of Regulatory and Conventional T Cells.
Zhu X, Zhang W, Guo J, Zhang X, Li L, Wang T, Yan J, Zhang F, Hou B, Gao N, Gao GF, Zhou X
Cell reports 2019 Apr 23;27(4):1205-1220.e4
Cell reports 2019 Apr 23;27(4):1205-1220.e4
Anti-commensal IgG Drives Intestinal Inflammation and Type 17 Immunity in Ulcerative Colitis.
Castro-Dopico T, Dennison TW, Ferdinand JR, Mathews RJ, Fleming A, Clift D, Stewart BJ, Jing C, Strongili K, Labzin LI, Monk EJM, Saeb-Parsy K, Bryant CE, Clare S, Parkes M, Clatworthy MR
Immunity 2019 Apr 16;50(4):1099-1114.e10
Immunity 2019 Apr 16;50(4):1099-1114.e10
Pulsatile MEK Inhibition Improves Anti-tumor Immunity and T Cell Function in Murine Kras Mutant Lung Cancer.
Choi H, Deng J, Li S, Silk T, Dong L, Brea EJ, Houghton S, Redmond D, Zhong H, Boiarsky J, Akbay EA, Smith PD, Merghoub T, Wong KK, Wolchok JD
Cell reports 2019 Apr 16;27(3):806-819.e5
Cell reports 2019 Apr 16;27(3):806-819.e5
Intraclonal Plasticity in Mammary Tumors Revealed through Large-Scale Single-Cell Resolution 3D Imaging.
Rios AC, Capaldo BD, Vaillant F, Pal B, van Ineveld R, Dawson CA, Chen Y, Nolan E, Fu NY, 3DTCLSM Group, Jackling FC, Devi S, Clouston D, Whitehead L, Smyth GK, Mueller SN, Lindeman GJ, Visvader JE
Cancer cell 2019 Apr 15;35(4):618-632.e6
Cancer cell 2019 Apr 15;35(4):618-632.e6
ATF3 Sustains IL-22-Induced STAT3 Phosphorylation to Maintain Mucosal Immunity Through Inhibiting Phosphatases.
Glal D, Sudhakar JN, Lu HH, Liu MC, Chiang HY, Liu YC, Cheng CF, Shui JW
Frontiers in immunology 2018;9:2522
Frontiers in immunology 2018;9:2522
C-Kit Cardiac Progenitor Cell Based Cell Sheet Improves Vascularization and Attenuates Cardiac Remodeling following Myocardial Infarction in Rats.
Dergilev K, Tsokolaeva Z, Makarevich P, Beloglazova I, Zubkova E, Boldyreva M, Ratner E, Dyikanov D, Menshikov M, Ovchinnikov A, Ageev F, Parfyonova Y
BioMed research international 2018;2018:3536854
BioMed research international 2018;2018:3536854
Pax6 Lengthens G1 Phase and Decreases Oscillating Cdk6 Levels in Murine Embryonic Cortical Progenitors.
Mi D, Manuel M, Huang YT, Mason JO, Price DJ
Frontiers in cellular neuroscience 2018;12:419
Frontiers in cellular neuroscience 2018;12:419
Factors Within the Endoneurial Microenvironment Act to Suppress Tumorigenesis of MPNST.
Stratton JA, Assinck P, Sinha S, Kumar R, Moulson A, Patrick N, Raharjo E, Chan JA, Midha R, Tetzlaff W, Biernaskie J
Frontiers in cellular neuroscience 2018;12:356
Frontiers in cellular neuroscience 2018;12:356
ARTS mediates apoptosis and regeneration of the intestinal stem cell niche.
Koren E, Yosefzon Y, Ankawa R, Soteriou D, Jacob A, Nevelsky A, Ben-Yosef R, Bar-Sela G, Fuchs Y
Nature communications 2018 Nov 2;9(1):4582
Nature communications 2018 Nov 2;9(1):4582
Lymphotoxin α fine-tunes T cell clonal deletion by regulating thymic entry of antigen-presenting cells.
Lopes N, Charaix J, Cédile O, Sergé A, Irla M
Nature communications 2018 Mar 28;9(1):1262
Nature communications 2018 Mar 28;9(1):1262
Adrenergic nerve degeneration in bone marrow drives aging of the hematopoietic stem cell niche.
Maryanovich M, Zahalka AH, Pierce H, Pinho S, Nakahara F, Asada N, Wei Q, Wang X, Ciero P, Xu J, Leftin A, Frenette PS
Nature medicine 2018 Jun;24(6):782-791
Nature medicine 2018 Jun;24(6):782-791
Expression of mutant Asxl1 perturbs hematopoiesis and promotes susceptibility to leukemic transformation.
Nagase R, Inoue D, Pastore A, Fujino T, Hou HA, Yamasaki N, Goyama S, Saika M, Kanai A, Sera Y, Horikawa S, Ota Y, Asada S, Hayashi Y, Kawabata KC, Takeda R, Tien HF, Honda H, Abdel-Wahab O, Kitamura T
The Journal of experimental medicine 2018 Jun 4;215(6):1729-1747
The Journal of experimental medicine 2018 Jun 4;215(6):1729-1747
Stem cell factor is selectively secreted by arterial endothelial cells in bone marrow.
Xu C, Gao X, Wei Q, Nakahara F, Zimmerman SE, Mar J, Frenette PS
Nature communications 2018 Jun 22;9(1):2449
Nature communications 2018 Jun 22;9(1):2449
The organic ester O,O'-diethyl-(S,S)-ethylenediamine-N,N'-di-2-(3-cyclohexyl)propanoate dihydrochloride attenuates murine breast cancer growth and metastasis.
Jurisevic M, Arsenijevic A, Pantic J, Gajovic N, Milovanovic J, Milovanovic M, Poljarevic J, Sabo T, Vojvodic D, Radosavljevic GD, Arsenijevic N
Oncotarget 2018 Jun 15;9(46):28195-28212
Oncotarget 2018 Jun 15;9(46):28195-28212
Selective pharmacological inhibition of DDR1 prevents experimentally-induced glomerulonephritis in prevention and therapeutic regime.
Moll S, Yasui Y, Abed A, Murata T, Shimada H, Maeda A, Fukushima N, Kanamori M, Uhles S, Badi L, Cagarelli T, Formentini I, Drawnel F, Georges G, Bergauer T, Gasser R, Bonfil RD, Fridman R, Richter H, Funk J, Moeller MJ, Chatziantoniou C, Prunotto M
Journal of translational medicine 2018 Jun 1;16(1):148
Journal of translational medicine 2018 Jun 1;16(1):148
Vitreous Cytokine Expression and a Murine Model Suggest a Key Role of Microglia in the Inflammatory Response to Retinal Detachment.
Kiang L, Ross BX, Yao J, Shanmugam S, Andrews CA, Hansen S, Besirli CG, Zacks DN, Abcouwer SF
Investigative ophthalmology & visual science 2018 Jul 2;59(8):3767-3778
Investigative ophthalmology & visual science 2018 Jul 2;59(8):3767-3778
A Metabolite-Triggered Tuft Cell-ILC2 Circuit Drives Small Intestinal Remodeling.
Schneider C, O'Leary CE, von Moltke J, Liang HE, Ang QY, Turnbaugh PJ, Radhakrishnan S, Pellizzon M, Ma A, Locksley RM
Cell 2018 Jul 12;174(2):271-284.e14
Cell 2018 Jul 12;174(2):271-284.e14
Inhibition of histone deacetylase 1 ameliorates renal tubulointerstitial fibrosis via modulation of inflammation and extracellular matrix gene transcription in mice.
Nguyễn-Thanh T, Kim D, Lee S, Kim W, Park SK, Kang KP
International journal of molecular medicine 2018 Jan;41(1):95-106
International journal of molecular medicine 2018 Jan;41(1):95-106
Dual-targeting Wnt and uPA receptors using peptide conjugated ultra-small nanoparticle drug carriers inhibited cancer stem-cell phenotype in chemo-resistant breast cancer.
Miller-Kleinhenz J, Guo X, Qian W, Zhou H, Bozeman EN, Zhu L, Ji X, Wang YA, Styblo T, O'Regan R, Mao H, Yang L
Biomaterials 2018 Jan;152:47-62
Biomaterials 2018 Jan;152:47-62
Modulation of Myelopoiesis Progenitors Is an Integral Component of Trained Immunity.
Mitroulis I, Ruppova K, Wang B, Chen LS, Grzybek M, Grinenko T, Eugster A, Troullinaki M, Palladini A, Kourtzelis I, Chatzigeorgiou A, Schlitzer A, Beyer M, Joosten LAB, Isermann B, Lesche M, Petzold A, Simons K, Henry I, Dahl A, Schultze JL, Wielockx B, Zamboni N, Mirtschink P, Coskun Ü, Hajishengallis G, Netea MG, Chavakis T
Cell 2018 Jan 11;172(1-2):147-161.e12
Cell 2018 Jan 11;172(1-2):147-161.e12
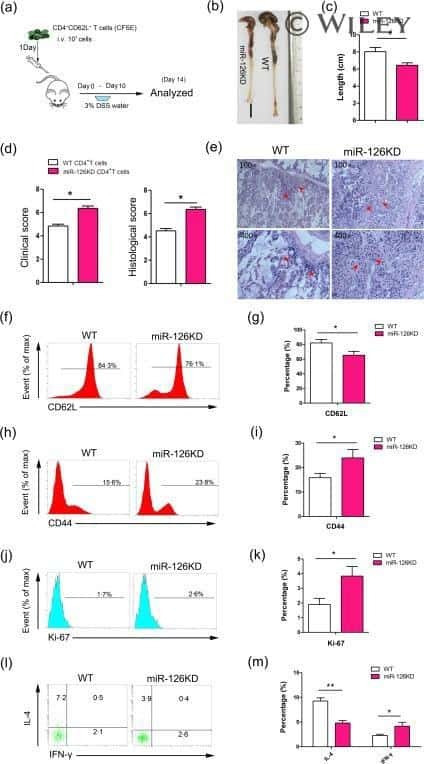
MicroRNA-126 deficiency enhanced the activation and function of CD4(+) T cells by elevating IRS-1 pathway.
Chu F, Hu Y, Zhou Y, Guo M, Lu J, Zheng W, Xu H, Zhao J, Xu L
Clinical and experimental immunology 2018 Feb;191(2):166-179
Clinical and experimental immunology 2018 Feb;191(2):166-179
Defining Lineage Potential and Fate Behavior of Precursors during Pancreas Development.
Sznurkowska MK, Hannezo E, Azzarelli R, Rulands S, Nestorowa S, Hindley CJ, Nichols J, Göttgens B, Huch M, Philpott A, Simons BD
Developmental cell 2018 Aug 6;46(3):360-375.e5
Developmental cell 2018 Aug 6;46(3):360-375.e5
Fc Effector Function Contributes to the Activity of Human Anti-CTLA-4 Antibodies.
Arce Vargas F, Furness AJS, Litchfield K, Joshi K, Rosenthal R, Ghorani E, Solomon I, Lesko MH, Ruef N, Roddie C, Henry JY, Spain L, Ben Aissa A, Georgiou A, Wong YNS, Smith M, Strauss D, Hayes A, Nicol D, O'Brien T, Mårtensson L, Ljungars A, Teige I, Frendéus B, TRACERx Melanoma, TRACERx Renal, TRACERx Lung consortia, Pule M, Marafioti T, Gore M, Larkin J, Turajlic S, Swanton C, Peggs KS, Quezada SA
Cancer cell 2018 Apr 9;33(4):649-663.e4
Cancer cell 2018 Apr 9;33(4):649-663.e4
1810011o10 Rik Inhibits the Antitumor Effect of Intratumoral CD8(+) T Cells through Suppression of Notch2 Pathway in a Murine Hepatocellular Carcinoma Model.
Dai K, Huang L, Huang YB, Chen ZB, Yang LH, Jiang YA
Frontiers in immunology 2017;8:320
Frontiers in immunology 2017;8:320
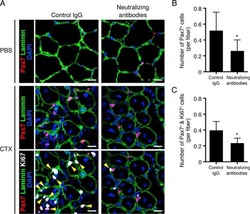
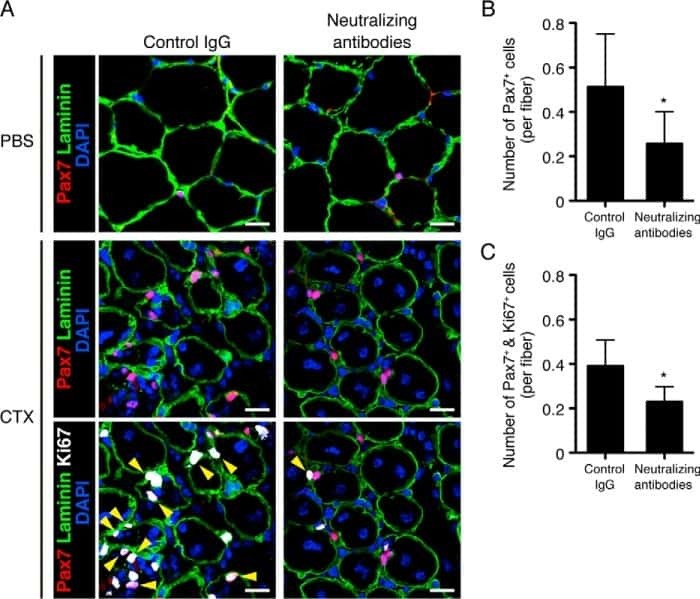
The Ror1 receptor tyrosine kinase plays a critical role in regulating satellite cell proliferation during regeneration of injured muscle.
Kamizaki K, Doi R, Hayashi M, Saji T, Kanagawa M, Toda T, Fukada SI, Ho HH, Greenberg ME, Endo M, Minami Y
The Journal of biological chemistry 2017 Sep 22;292(38):15939-15951
The Journal of biological chemistry 2017 Sep 22;292(38):15939-15951
A somatic mutation in erythro-myeloid progenitors causes neurodegenerative disease.
Mass E, Jacome-Galarza CE, Blank T, Lazarov T, Durham BH, Ozkaya N, Pastore A, Schwabenland M, Chung YR, Rosenblum MK, Prinz M, Abdel-Wahab O, Geissmann F
Nature 2017 Sep 21;549(7672):389-393
Nature 2017 Sep 21;549(7672):389-393
Neonatal pancreatic pericytes support β-cell proliferation.
Epshtein A, Rachi E, Sakhneny L, Mizrachi S, Baer D, Landsman L
Molecular metabolism 2017 Oct;6(10):1330-1338
Molecular metabolism 2017 Oct;6(10):1330-1338
Histone variant H2A.J accumulates in senescent cells and promotes inflammatory gene expression.
Contrepois K, Coudereau C, Benayoun BA, Schuler N, Roux PF, Bischof O, Courbeyrette R, Carvalho C, Thuret JY, Ma Z, Derbois C, Nevers MC, Volland H, Redon CE, Bonner WM, Deleuze JF, Wiel C, Bernard D, Snyder MP, Rübe CE, Olaso R, Fenaille F, Mann C
Nature communications 2017 May 10;8:14995
Nature communications 2017 May 10;8:14995
Differential cytokine contributions of perivascular haematopoietic stem cell niches.
Asada N, Kunisaki Y, Pierce H, Wang Z, Fernandez NF, Birbrair A, Ma'ayan A, Frenette PS
Nature cell biology 2017 Mar;19(3):214-223
Nature cell biology 2017 Mar;19(3):214-223
Egr2 and 3 control adaptive immune responses by temporally uncoupling expansion from T cell differentiation.
Miao T, Symonds ALJ, Singh R, Symonds JD, Ogbe A, Omodho B, Zhu B, Li S, Wang P
The Journal of experimental medicine 2017 Jun 5;214(6):1787-1808
The Journal of experimental medicine 2017 Jun 5;214(6):1787-1808
De Novo Epigenetic Programs Inhibit PD-1 Blockade-Mediated T Cell Rejuvenation.
Ghoneim HE, Fan Y, Moustaki A, Abdelsamed HA, Dash P, Dogra P, Carter R, Awad W, Neale G, Thomas PG, Youngblood B
Cell 2017 Jun 29;170(1):142-157.e19
Cell 2017 Jun 29;170(1):142-157.e19
IL-4 as a Repurposed Biological Drug for Myocardial Infarction through Augmentation of Reparative Cardiac Macrophages: Proof-of-Concept Data in Mice.
Shintani Y, Ito T, Fields L, Shiraishi M, Ichihara Y, Sato N, Podaru M, Kainuma S, Tanaka H, Suzuki K
Scientific reports 2017 Jul 31;7(1):6877
Scientific reports 2017 Jul 31;7(1):6877
Viral RNA-Unprimed Rig-I Restrains Stat3 Activation in the Modulation of Regulatory T Cell/Th17 Cell Balance.
Yang H, Guo HZ, Li XY, Lin J, Zhang W, Zhao JM, Zhang HX, Chen SJ, Chen Z, Zhu J
Journal of immunology (Baltimore, Md. : 1950) 2017 Jul 1;199(1):119-128
Journal of immunology (Baltimore, Md. : 1950) 2017 Jul 1;199(1):119-128
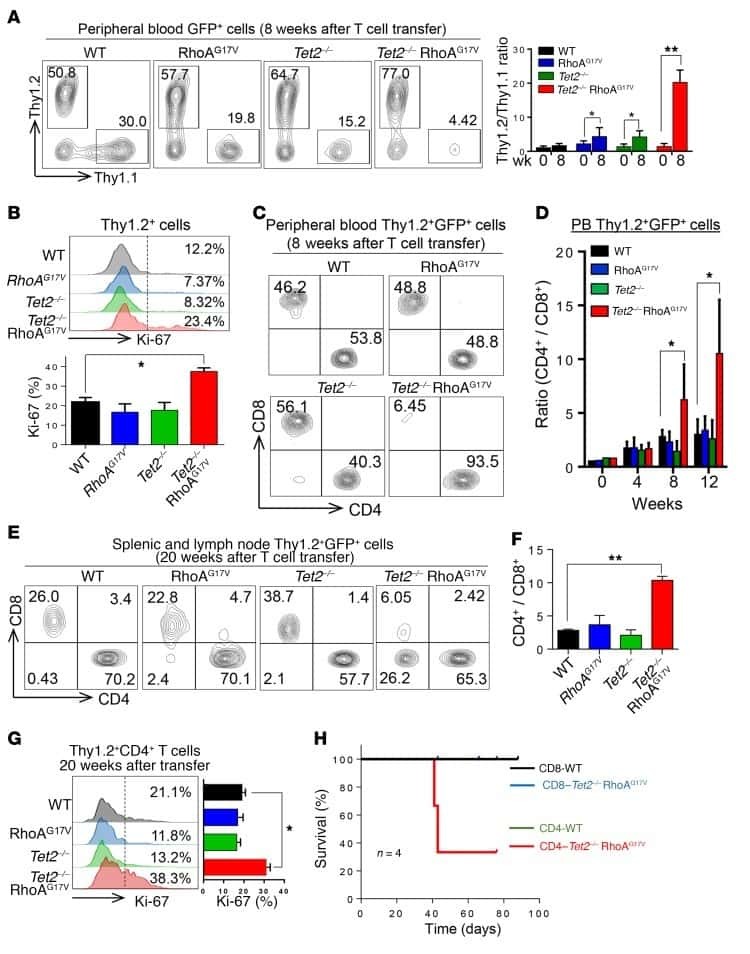
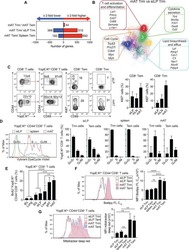
White Adipose Tissue Is a Reservoir for Memory T Cells and Promotes Protective Memory Responses to Infection.
Han SJ, Glatman Zaretsky A, Andrade-Oliveira V, Collins N, Dzutsev A, Shaik J, Morais da Fonseca D, Harrison OJ, Tamoutounour S, Byrd AL, Smelkinson M, Bouladoux N, Bliska JB, Brenchley JM, Brodsky IE, Belkaid Y
Immunity 2017 Dec 19;47(6):1154-1168.e6
Immunity 2017 Dec 19;47(6):1154-1168.e6
Hypoxia-Inducible Factor 1α Signaling Promotes Repair of the Alveolar Epithelium after Acute Lung Injury.
McClendon J, Jansing NL, Redente EF, Gandjeva A, Ito Y, Colgan SP, Ahmad A, Riches DWH, Chapman HA, Mason RJ, Tuder RM, Zemans RL
The American journal of pathology 2017 Aug;187(8):1772-1786
The American journal of pathology 2017 Aug;187(8):1772-1786
The MEK inhibitor selumetinib complements CTLA-4 blockade by reprogramming the tumor immune microenvironment.
Poon E, Mullins S, Watkins A, Williams GS, Koopmann JO, Di Genova G, Cumberbatch M, Veldman-Jones M, Grosskurth SE, Sah V, Schuller A, Reimer C, Dovedi SJ, Smith PD, Stewart R, Wilkinson RW
Journal for immunotherapy of cancer 2017 Aug 15;5(1):63
Journal for immunotherapy of cancer 2017 Aug 15;5(1):63
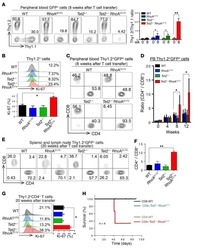
Mutations in 5-methylcytosine oxidase TET2 and RhoA cooperatively disrupt T cell homeostasis.
Zang S, Li J, Yang H, Zeng H, Han W, Zhang J, Lee M, Moczygemba M, Isgandarova S, Yang Y, Zhou Y, Rao A, You MJ, Sun D, Huang Y
The Journal of clinical investigation 2017 Aug 1;127(8):2998-3012
The Journal of clinical investigation 2017 Aug 1;127(8):2998-3012
Myeloid progenitor cluster formation drives emergency and leukaemic myelopoiesis.
Hérault A, Binnewies M, Leong S, Calero-Nieto FJ, Zhang SY, Kang YA, Wang X, Pietras EM, Chu SH, Barry-Holson K, Armstrong S, Göttgens B, Passegué E
Nature 2017 Apr 6;544(7648):53-58
Nature 2017 Apr 6;544(7648):53-58
The stress kinase GCN2 does not mediate suppression of antitumor T cell responses by tryptophan catabolism in experimental melanomas.
Sonner JK, Deumelandt K, Ott M, Thomé CM, Rauschenbach KJ, Schulz S, Munteanu B, Mohapatra S, Adam I, Hofer AC, Feuerer M, Opitz CA, Hopf C, Wick W, Platten M
Oncoimmunology 2016;5(12):e1240858
Oncoimmunology 2016;5(12):e1240858
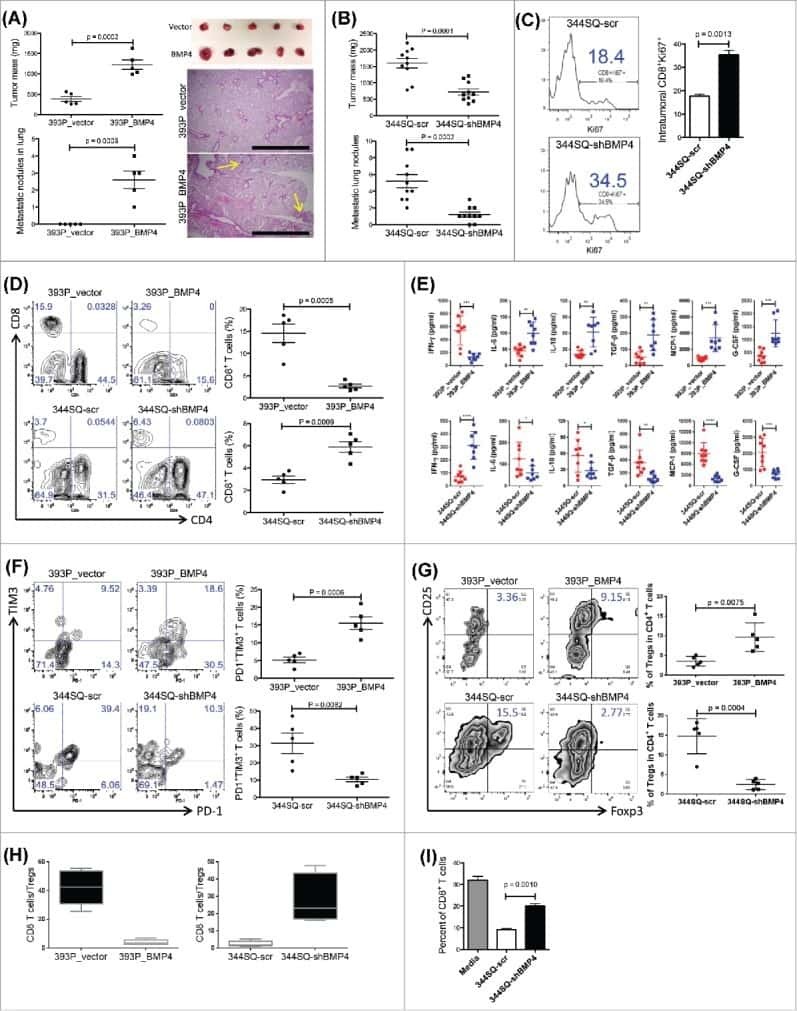
Growth and metastasis of lung adenocarcinoma is potentiated by BMP4-mediated immunosuppression.
Chen L, Yi X, Goswami S, Ahn YH, Roybal JD, Yang Y, Diao L, Peng D, Peng D, Fradette JJ, Wang J, Byers LA, Kurie JM, Ullrich SE, Qin FX, Gibbons DL
Oncoimmunology 2016;5(11):e1234570
Oncoimmunology 2016;5(11):e1234570
Schwann cell proliferation and differentiation that is induced by ferulic acid through MEK1/ERK1/2 signalling promotes peripheral nerve remyelination following crush injury in rats.
Zhu X, Li K, Guo X, Wang J, Xiang Y
Experimental and therapeutic medicine 2016 Sep;12(3):1915-1921
Experimental and therapeutic medicine 2016 Sep;12(3):1915-1921
Host-Protozoan Interactions Protect from Mucosal Infections through Activation of the Inflammasome.
Chudnovskiy A, Mortha A, Kana V, Kennard A, Ramirez JD, Rahman A, Remark R, Mogno I, Ng R, Gnjatic S, Amir ED, Solovyov A, Greenbaum B, Clemente J, Faith J, Belkaid Y, Grigg ME, Merad M
Cell 2016 Oct 6;167(2):444-456.e14
Cell 2016 Oct 6;167(2):444-456.e14
Whole Chromosome Instability induces senescence and promotes SASP.
Andriani GA, Almeida VP, Faggioli F, Mauro M, Tsai WL, Santambrogio L, Maslov A, Gadina M, Campisi J, Vijg J, Montagna C
Scientific reports 2016 Oct 12;6:35218
Scientific reports 2016 Oct 12;6:35218
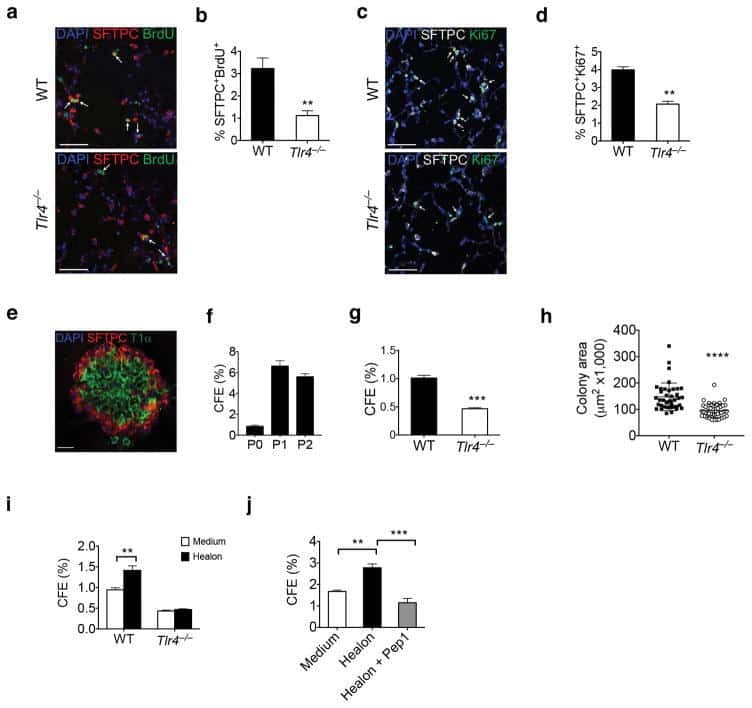
Hyaluronan and TLR4 promote surfactant-protein-C-positive alveolar progenitor cell renewal and prevent severe pulmonary fibrosis in mice.
Liang J, Zhang Y, Xie T, Liu N, Chen H, Geng Y, Kurkciyan A, Mena JM, Stripp BR, Jiang D, Noble PW
Nature medicine 2016 Nov;22(11):1285-1293
Nature medicine 2016 Nov;22(11):1285-1293
Immune response modulation by Galectin-1 in a transgenic model of neuroblastoma.
Büchel G, Schulte JH, Harrison L, Batzke K, Schüller U, Hansen W, Schramm A
Oncoimmunology 2016 May;5(5):e1131378
Oncoimmunology 2016 May;5(5):e1131378
Co-culture with intestinal epithelial organoids allows efficient expansion and motility analysis of intraepithelial lymphocytes.
Nozaki K, Mochizuki W, Matsumoto Y, Matsumoto T, Fukuda M, Mizutani T, Watanabe M, Nakamura T
Journal of gastroenterology 2016 Mar;51(3):206-13
Journal of gastroenterology 2016 Mar;51(3):206-13
The cell proliferation antigen Ki-67 organises heterochromatin.
Sobecki M, Mrouj K, Camasses A, Parisis N, Nicolas E, Llères D, Gerbe F, Prieto S, Krasinska L, David A, Eguren M, Birling MC, Urbach S, Hem S, Déjardin J, Malumbres M, Jay P, Dulic V, Lafontaine DLj, Feil R, Fisher D
eLife 2016 Mar 7;5:e13722
eLife 2016 Mar 7;5:e13722
Image-based detection and targeting of therapy resistance in pancreatic adenocarcinoma.
Fox RG, Lytle NK, Jaquish DV, Park FD, Ito T, Bajaj J, Koechlein CS, Zimdahl B, Yano M, Kopp J, Kritzik M, Sicklick J, Sander M, Grandgenett PM, Hollingsworth MA, Shibata S, Pizzo D, Valasek M, Sasik R, Scadeng M, Okano H, Kim Y, MacLeod AR, Lowy AM, Reya T
Nature 2016 Jun 16;534(7607):407-411
Nature 2016 Jun 16;534(7607):407-411
RANKL/RANK control Brca1 mutation- .
Sigl V, Owusu-Boaitey K, Joshi PA, Kavirayani A, Wirnsberger G, Novatchkova M, Kozieradzki I, Schramek D, Edokobi N, Hersl J, Sampson A, Odai-Afotey A, Lazaro C, Gonzalez-Suarez E, Pujana MA, Cimba F, Heyn H, Vidal E, Cruickshank J, Berman H, Sarao R, Ticevic M, Uribesalgo I, Tortola L, Rao S, Tan Y, Pfeiler G, Lee EY, Bago-Horvath Z, Kenner L, Popper H, Singer C, Khokha R, Jones LP, Penninger JM
Cell research 2016 Jul;26(7):761-74
Cell research 2016 Jul;26(7):761-74
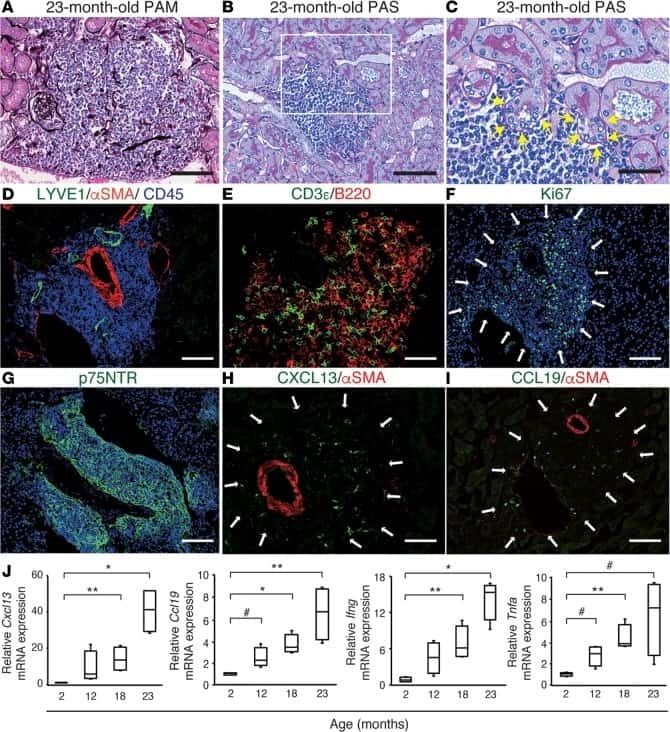
Heterogeneous fibroblasts underlie age-dependent tertiary lymphoid tissues in the kidney.
Sato Y, Mii A, Hamazaki Y, Fujita H, Nakata H, Masuda K, Nishiyama S, Shibuya S, Haga H, Ogawa O, Shimizu A, Narumiya S, Kaisho T, Arita M, Yanagisawa M, Miyasaka M, Sharma K, Minato N, Kawamoto H, Yanagita M
JCI insight 2016 Jul 21;1(11):e87680
JCI insight 2016 Jul 21;1(11):e87680
Detection of Cell Proliferation Markers by Immunofluorescence Staining and Microscopy Imaging in Paraffin-Embedded Tissue Sections.
Eminaga S, Teekakirikul P, Seidman CE, Seidman JG
Current protocols in molecular biology 2016 Jul 1;115:14.25.1-14.25.14
Current protocols in molecular biology 2016 Jul 1;115:14.25.1-14.25.14
Oligodendrocyte death results in immune-mediated CNS demyelination.
Traka M, Podojil JR, McCarthy DP, Miller SD, Popko B
Nature neuroscience 2016 Jan;19(1):65-74
Nature neuroscience 2016 Jan;19(1):65-74
Lineage-specific enhancers activate self-renewal genes in macrophages and embryonic stem cells.
Soucie EL, Weng Z, Geirsdóttir L, Molawi K, Maurizio J, Fenouil R, Mossadegh-Keller N, Gimenez G, VanHille L, Beniazza M, Favret J, Berruyer C, Perrin P, Hacohen N, Andrau JC, Ferrier P, Dubreuil P, Sidow A, Sieweke MH
Science (New York, N.Y.) 2016 Feb 12;351(6274):aad5510
Science (New York, N.Y.) 2016 Feb 12;351(6274):aad5510
Foxp3 and Toll-like receptor signaling balance T(reg) cell anabolic metabolism for suppression.
Gerriets VA, Kishton RJ, Johnson MO, Cohen S, Siska PJ, Nichols AG, Warmoes MO, de Cubas AA, MacIver NJ, Locasale JW, Turka LA, Wells AD, Rathmell JC
Nature immunology 2016 Dec;17(12):1459-1466
Nature immunology 2016 Dec;17(12):1459-1466
Suppression of ischemia in arterial occlusive disease by JNK-promoted native collateral artery development.
Ramo K, Sugamura K, Craige S, Keaney JF, Davis RJ
eLife 2016 Aug 9;5
eLife 2016 Aug 9;5
Newborn hypoxia/anoxia inhibits cardiomyocyte proliferation and decreases cardiomyocyte endowment in the developing heart: role of endothelin-1.
Paradis AN, Gay MS, Wilson CG, Zhang L
PloS one 2015;10(2):e0116600
PloS one 2015;10(2):e0116600
Epithelial-to-mesenchymal transition induces cell cycle arrest and parenchymal damage in renal fibrosis.
Lovisa S, LeBleu VS, Tampe B, Sugimoto H, Vadnagara K, Carstens JL, Wu CC, Hagos Y, Burckhardt BC, Pentcheva-Hoang T, Nischal H, Allison JP, Zeisberg M, Kalluri R
Nature medicine 2015 Sep;21(9):998-1009
Nature medicine 2015 Sep;21(9):998-1009
Mammary Stem Cells and Tumor-Initiating Cells Are More Resistant to Apoptosis and Exhibit Increased DNA Repair Activity in Response to DNA Damage.
Chang CH, Zhang M, Rajapakshe K, Coarfa C, Edwards D, Huang S, Rosen JM
Stem cell reports 2015 Sep 8;5(3):378-91
Stem cell reports 2015 Sep 8;5(3):378-91
Low levels of endogenous or X-ray-induced DNA double-strand breaks activate apoptosis in adult neural stem cells.
Barazzuol L, Rickett N, Ju L, Jeggo PA
Journal of cell science 2015 Oct 1;128(19):3597-606
Journal of cell science 2015 Oct 1;128(19):3597-606
NF-κB-induced microRNA-31 promotes epidermal hyperplasia by repressing protein phosphatase 6 in psoriasis.
Yan S, Xu Z, Lou F, Zhang L, Ke F, Bai J, Liu Z, Liu J, Wang H, Zhu H, Sun Y, Cai W, Gao Y, Su B, Li Q, Yang X, Yu J, Lai Y, Yu XZ, Zheng Y, Shen N, Chin YE, Wang H
Nature communications 2015 Jul 3;6:7652
Nature communications 2015 Jul 3;6:7652
The adhesion G protein-coupled receptor GPR56 is a cell-autonomous regulator of oligodendrocyte development.
Giera S, Deng Y, Luo R, Ackerman SD, Mogha A, Monk KR, Ying Y, Jeong SJ, Makinodan M, Bialas AR, Chang BS, Stevens B, Corfas G, Piao X
Nature communications 2015 Jan 21;6:6121
Nature communications 2015 Jan 21;6:6121
Ubiquitous L1 mosaicism in hippocampal neurons.
Upton KR, Gerhardt DJ, Jesuadian JS, Richardson SR, Sánchez-Luque FJ, Bodea GO, Ewing AD, Salvador-Palomeque C, van der Knaap MS, Brennan PM, Vanderver A, Faulkner GJ
Cell 2015 Apr 9;161(2):228-39
Cell 2015 Apr 9;161(2):228-39
Metastasis is regulated via microRNA-200/ZEB1 axis control of tumour cell PD-L1 expression and intratumoral immunosuppression.
Chen L, Gibbons DL, Goswami S, Cortez MA, Ahn YH, Byers LA, Zhang X, Yi X, Dwyer D, Lin W, Diao L, Wang J, Roybal J, Patel M, Ungewiss C, Peng D, Antonia S, Mediavilla-Varela M, Robertson G, Suraokar M, Welsh JW, Erez B, Wistuba II, Chen L, Peng D, Wang S, Ullrich SE, Heymach JV, Kurie JM, Qin FX
Nature communications 2014 Oct 28;5:5241
Nature communications 2014 Oct 28;5:5241
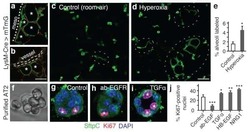
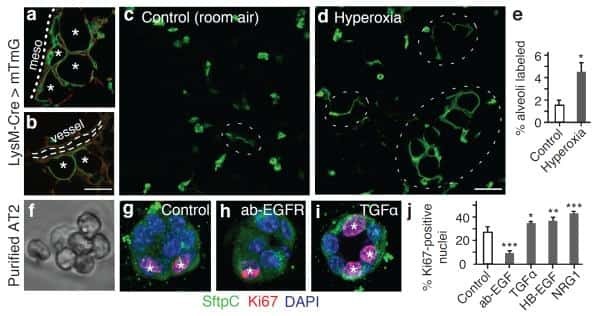
Alveolar progenitor and stem cells in lung development, renewal and cancer.
Desai TJ, Brownfield DG, Krasnow MA
Nature 2014 Mar 13;507(7491):190-4
Nature 2014 Mar 13;507(7491):190-4
Myeloid cells expressing VEGF and arginase-1 following uptake of damaged retinal pigment epithelium suggests potential mechanism that drives the onset of choroidal angiogenesis in mice.
Liu J, Copland DA, Horie S, Wu WK, Chen M, Xu Y, Paul Morgan B, Mack M, Xu H, Nicholson LB, Dick AD
PloS one 2013;8(8):e72935
PloS one 2013;8(8):e72935
Small intestine inflammation in Roquin-mutant and Roquin-deficient mice.
Schaefer JS, Montufar-Solis D, Nakra N, Vigneswaran N, Klein JR
PloS one 2013;8(2):e56436
PloS one 2013;8(2):e56436
Dedifferentiation of committed epithelial cells into stem cells in vivo.
Tata PR, Mou H, Pardo-Saganta A, Zhao R, Prabhu M, Law BM, Vinarsky V, Cho JL, Breton S, Sahay A, Medoff BD, Rajagopal J
Nature 2013 Nov 14;503(7475):218-23
Nature 2013 Nov 14;503(7475):218-23
IL-1R signaling in dendritic cells replaces pattern-recognition receptors in promoting CD8⁺ T cell responses to influenza A virus.
Pang IK, Ichinohe T, Iwasaki A
Nature immunology 2013 Mar;14(3):246-53
Nature immunology 2013 Mar;14(3):246-53
Primate B-1 cells generate antigen-specific B cell responses to T cell-independent type 2 antigens.
Yammani RD, Haas KM
Journal of immunology (Baltimore, Md. : 1950) 2013 Apr 1;190(7):3100-8
Journal of immunology (Baltimore, Md. : 1950) 2013 Apr 1;190(7):3100-8
No comments: Submit comment
Supportive validation
- Submitted by
- Invitrogen Antibodies (provider)
- Main image

- Experimental details
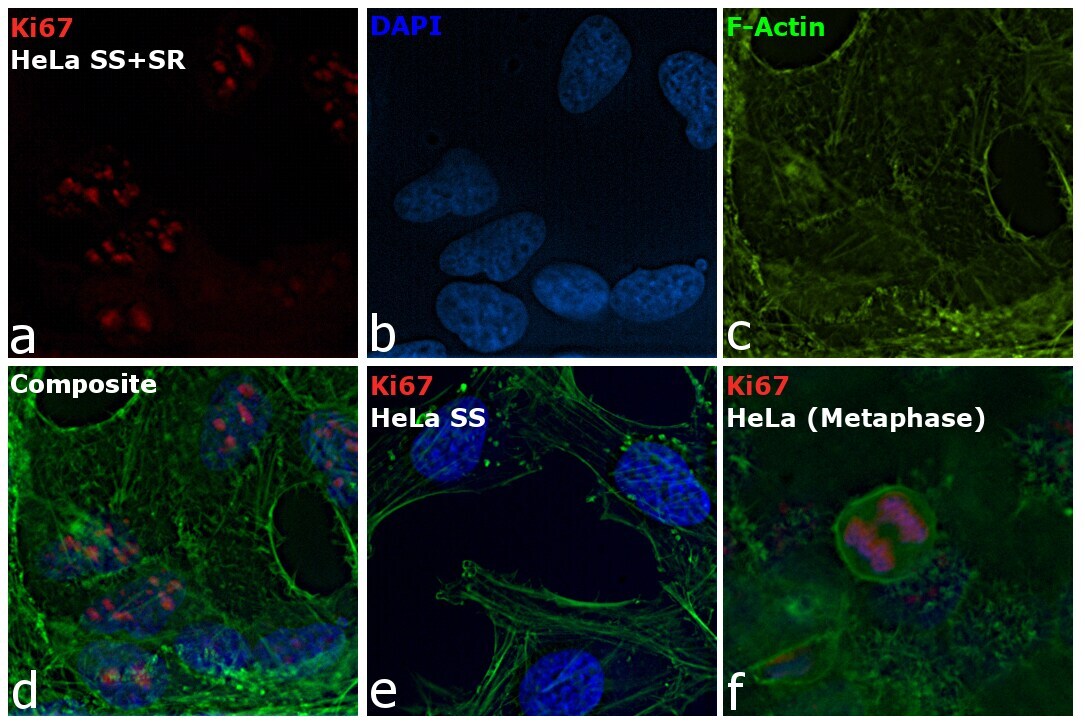
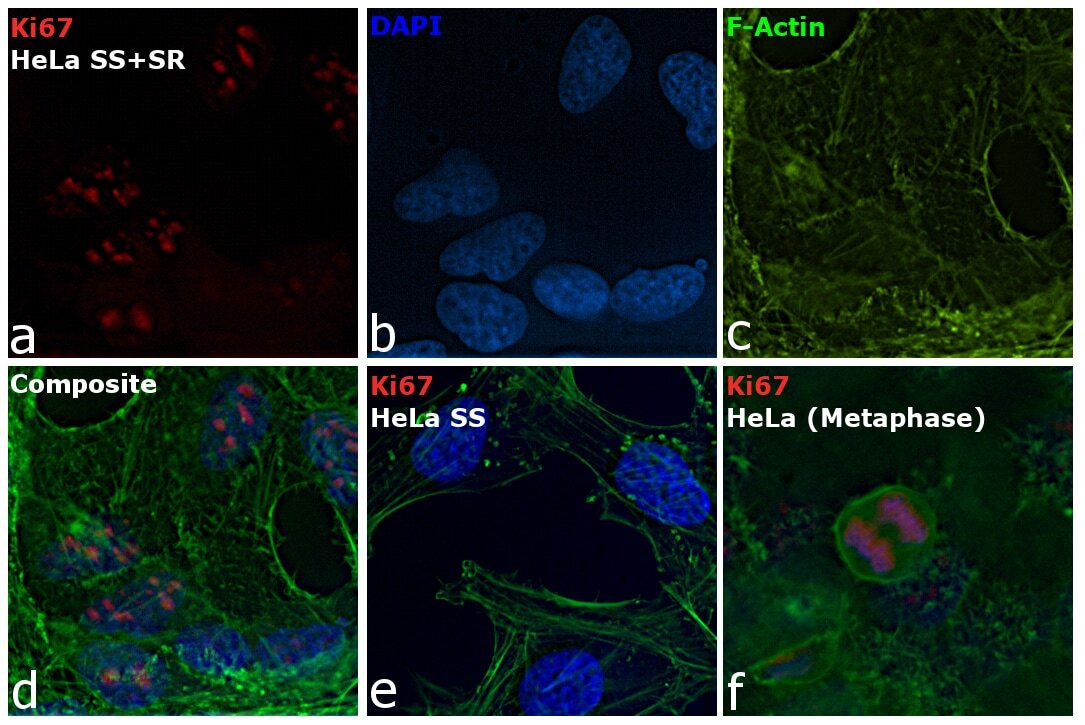
- Immunofluorescence analysis of Ki-67 Monoclonal Antibody (SolA15), eFluor™ 660, eBioscience™ was performed using 70% confluent log phase HeLa cells serum starved (SS) for 36 hours followed by serum release (SR) for 6 hours. The cells were fixed with 4% paraformaldehyde for 10 minutes, permeabilized with 0.1% Triton™ X-100 for 15 minutes, and blocked with 2% BSA for 45 minutes at room temperature. The cells were labeled with Ki-67 Monoclonal Antibody (SolA15), eFluor™ 660, eBioscience™ (Product # 50-5698-82) at 5 µg/mL concentration in 0.1% BSA, incubated at 4 degree celsius overnight (Panel a: Red). Nuclei (Panel b:Blue) were stained with ProLong™ Diamond Antifade Mountant with DAPI (Product # P36962). F-actin (Panel c: Green) was stained with Alexa Fluor™ Plus 488 Phalloidin (Product # A12379, 1:500 dilution). Panel d represents the merged image showing speckle-like localization in the nucleus. Panel e represents serum starved cells (36 hours) having no Ki-67 expression. Panel f represents a mitotic cell among the HeLa control cells showing Ki-67 signal on the chromatin. The images were captured at 60X magnification.
- Submitted by
- Invitrogen Antibodies (provider)
- Main image
- Experimental details
- Immunofluorescence analysis of Ki-67 Monoclonal Antibody (SolA15), eFluor™ 660, eBioscience™ was performed using 70% confluent log phase HeLa cells serum starved (SS) for 36 hours followed by serum release (SR) for 6 hours. The cells were fixed with 4% paraformaldehyde for 10 minutes, permeabilized with 0.1% Triton™ X-100 for 15 minutes, and blocked with 2% BSA for 45 minutes at room temperature. The cells were labeled with Ki-67 Monoclonal Antibody (SolA15), eFluor™ 660, eBioscience™ (Product # 50-5698-82) at 5 µg/mL concentration in 0.1% BSA, incubated at 4 degree celsius overnight (Panel a: Red). Nuclei (Panel b:Blue) were stained with ProLong™ Diamond Antifade Mountant with DAPI (Product # P36962). F-actin (Panel c: Green) was stained with Alexa Fluor™ Plus 488 Phalloidin (Product # A12379, 1:500 dilution). Panel d represents the merged image showing speckle-like localization in the nucleus. Panel e represents serum starved cells (36 hours) having no Ki-67 expression. Panel f represents a mitotic cell among the HeLa control cells showing Ki-67 signal on the chromatin. The images were captured at 60X magnification.
Supportive validation
- Submitted by
- Invitrogen Antibodies (provider)
- Main image
- Experimental details
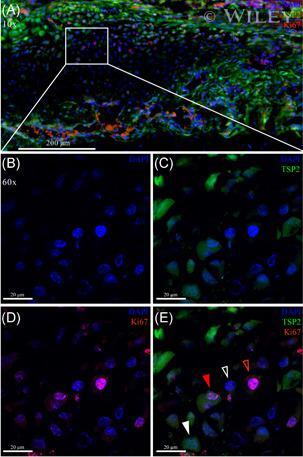
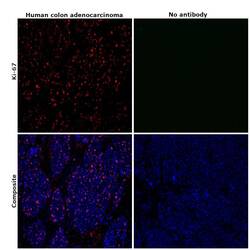
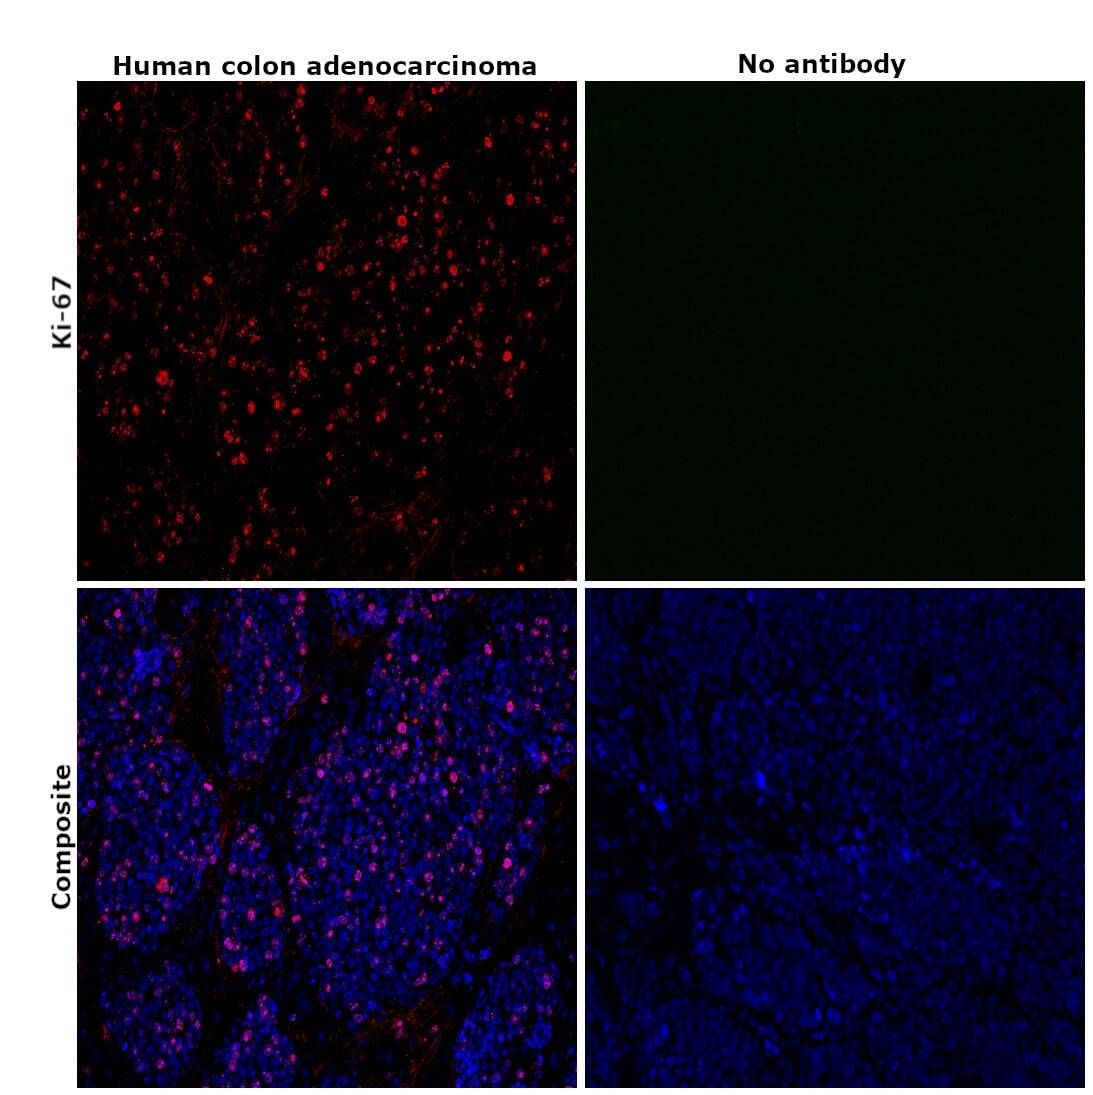
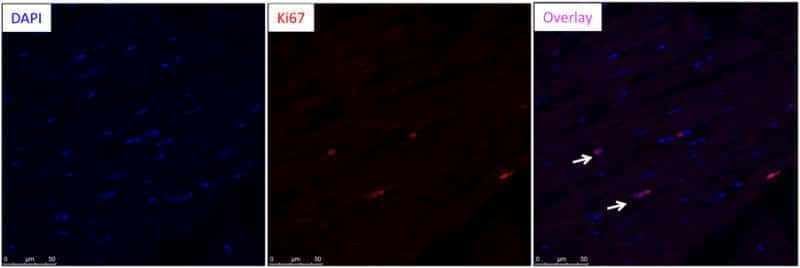
- Immunohistochemical analysis of Ki-67 was performed using formalin-fixed paraffin-embedded human colon adenocarcinoma tissue sections. To expose the target protein, heat-induced epitope retrieval was performed on de-paraffinized sections using eBioscience™ IHC Antigen Retrieval Solution - High pH (10X) (Product # 00-4956-58) diluted to 1X solution in water in a decloaking chamber at 110 degree Celsius for 15 minutes. Following antigen retrieval, the sections were blocked with 2% normal goat serum in 1X PBS for 45 minutes at room temperature and then probed with or without Ki-67 Monoclonal Antibody (SolA15), eFluor™ 660, eBioscience™ (Product # 50-5698-82) at 1:100 dilution in 0.1% normal goat serum overnight at 4 degree Celsius in a humidified chamber. ReadyProbes™ Tissue Autofluorescence Quenching Kit (Product # R37630) was used to quench autofluorescence from the tissues. Nuclei were stained with DAPI (Product # D1306) and the sections were mounted using ProLong™ Glass Antifade Mountant (Product # P36984). The images were captured on EVOS™ M7000 Imaging System (Product # AMF7000) at 20X magnification and externally deconvoluted.
- Submitted by
- Invitrogen Antibodies (provider)
- Main image
- Experimental details
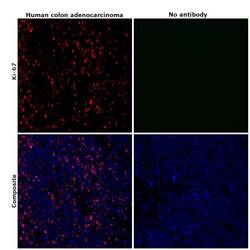
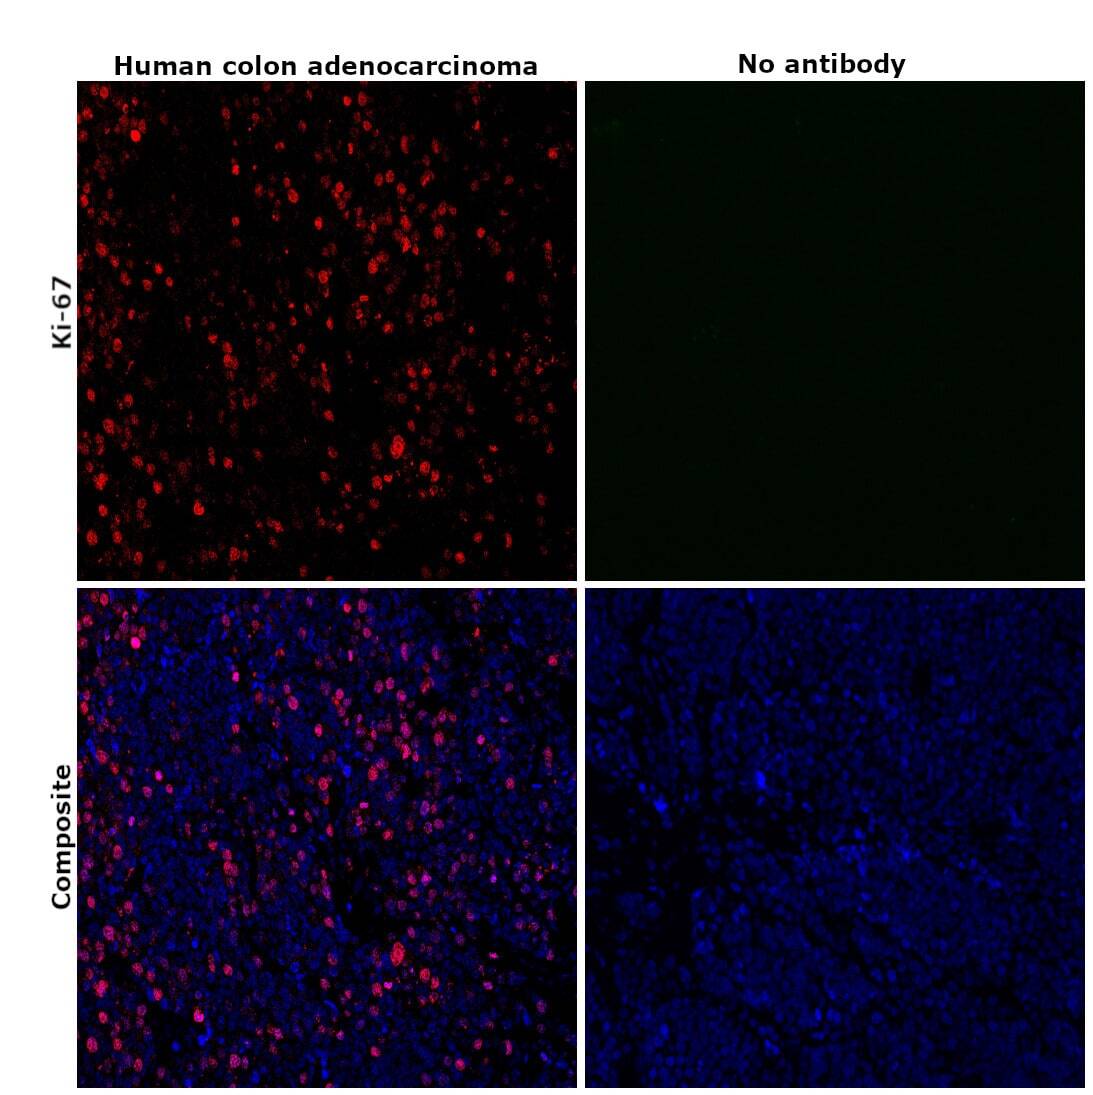
- Immunohistochemical analysis of Ki-67 was performed using formalin-fixed paraffin-embedded human colon adenocarcinoma tissue sections. To expose the target protein, heat-induced epitope retrieval was performed on de-paraffinized sections using eBioscience™ IHC Antigen Retrieval Solution - Low pH (10X) (Product # 00-4955-58) diluted to 1X solution in water in a decloaking chamber at 110 degree Celsius for 15 minutes. Following antigen retrieval, the sections were blocked with 2% normal goat serum in 1X PBS for 45 minutes at room temperature and then probed with or without Ki-67 Monoclonal Antibody (SolA15), eFluor™ 660, eBioscience™ (Product # 50-5698-82) at 1:100 dilution in 0.1% normal goat serum overnight at 4 degree Celsius in a humidified chamber. ReadyProbes™ Tissue Autofluorescence Quenching Kit (Product # R37630) was used to quench autofluorescence from the tissues. Nuclei were stained with DAPI (Product # D1306) and the sections were mounted using ProLong™ Glass Antifade Mountant (Product # P36984). The images were captured on EVOS™ M7000 Imaging System (Product # AMF7000) at 20X magnification and externally deconvoluted.
Supportive validation
- Submitted by
- Invitrogen Antibodies (provider)
- Main image
- Experimental details
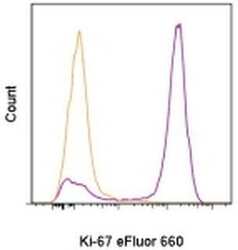
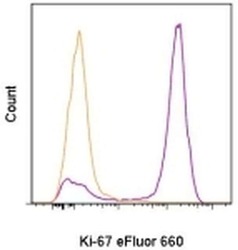
- C57Bl/6 splenocytes were unstimulated (orange histogram) or stimulated for 2 days with plate-bound Anti-Mouse CD3e Functional Grade Purified (Product # 16-0031-82) (purple histogram). Cells were then fixed and permeabilized using the Foxp3/Transcription Factor Buffer Set (Product # 00-5523-00) and stained intracellularly with 0.06 µg of Anti-Mouse/Rat Ki-67 eFluor® 660.

- Submitted by
- Invitrogen Antibodies (provider)
- Main image
- Experimental details
- C57Bl/6 splenocytes were unstimulated (orange histogram) or stimulated for 2 days with plate-bound Anti-Mouse CD3e Functional Grade Purified (Product # 16-0031-82) (purple histogram). Cells were then fixed and permeabilized using the Foxp3/Transcription Factor Buffer Set (Product # 00-5523-00) and stained intracellularly with 0.06 µg of Anti-Mouse/Rat Ki-67 eFluor® 660.

Supportive validation
- Submitted by
- Invitrogen Antibodies (provider)
- Main image
- Experimental details
- NULL

- Submitted by
- Invitrogen Antibodies (provider)
- Main image

- Experimental details
- NULL
- Submitted by
- Invitrogen Antibodies (provider)
- Main image

- Experimental details
- NULL
- Submitted by
- Invitrogen Antibodies (provider)
- Main image
- Experimental details
- NULL
- Submitted by
- Invitrogen Antibodies (provider)
- Main image

- Experimental details
- NULL
- Submitted by
- Invitrogen Antibodies (provider)
- Main image
- Experimental details
- NULL
- Submitted by
- Invitrogen Antibodies (provider)
- Main image
- Experimental details
- NULL
- Submitted by
- Invitrogen Antibodies (provider)
- Main image
- Experimental details
- NULL

- Submitted by
- Invitrogen Antibodies (provider)
- Main image
- Experimental details
- NULL
- Submitted by
- Invitrogen Antibodies (provider)
- Main image
- Experimental details
- NULL
- Submitted by
- Invitrogen Antibodies (provider)
- Main image
- Experimental details
- NULL
- Submitted by
- Invitrogen Antibodies (provider)
- Main image
- Experimental details
- NULL
- Submitted by
- Invitrogen Antibodies (provider)
- Main image
- Experimental details
- NULL
- Submitted by
- Invitrogen Antibodies (provider)
- Main image
- Experimental details
- NULL
- Submitted by
- Invitrogen Antibodies (provider)
- Main image
- Experimental details
- NULL
- Submitted by
- Invitrogen Antibodies (provider)
- Main image
- Experimental details
- NULL

- Submitted by
- Invitrogen Antibodies (provider)
- Main image
- Experimental details
- NULL
- Submitted by
- Invitrogen Antibodies (provider)
- Main image
- Experimental details
- NULL
- Submitted by
- Invitrogen Antibodies (provider)
- Main image
- Experimental details
- NULL
- Submitted by
- Invitrogen Antibodies (provider)
- Main image
- Experimental details
- NULL
- Submitted by
- Invitrogen Antibodies (provider)
- Main image
- Experimental details
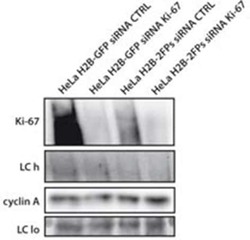
- Figure 9--figure supplement 1. Knockdown of Ki-67 in H2B FRET cell line. Western blot analysis of the indicated proteins in asynchronously growing HeLa H2B FRET cells transiently transfected with control siRNA (Ctrl) or Ki-67 RNAi for 72 hr. LC, loading controls of the high (h) and low (lo) MW parts of the SDS-PAGE gel. DOI: http://dx.doi.org/

- Submitted by
- Invitrogen Antibodies (provider)
- Main image
- Experimental details
- NULL
- Submitted by
- Invitrogen Antibodies (provider)
- Main image
- Experimental details
- NULL

- Submitted by
- Invitrogen Antibodies (provider)
- Main image
- Experimental details
- NULL
- Submitted by
- Invitrogen Antibodies (provider)
- Main image
- Experimental details
- NULL

- Submitted by
- Invitrogen Antibodies (provider)
- Main image

- Experimental details
- NULL
- Submitted by
- Invitrogen Antibodies (provider)
- Main image
- Experimental details
- NULL
- Submitted by
- Invitrogen Antibodies (provider)
- Main image
- Experimental details
- NULL
- Submitted by
- Invitrogen Antibodies (provider)
- Main image
- Experimental details
- NULL
- Submitted by
- Invitrogen Antibodies (provider)
- Main image
- Experimental details
- NULL

- Submitted by
- Invitrogen Antibodies (provider)
- Main image
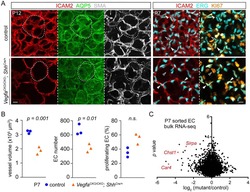
- Experimental details
- NULL
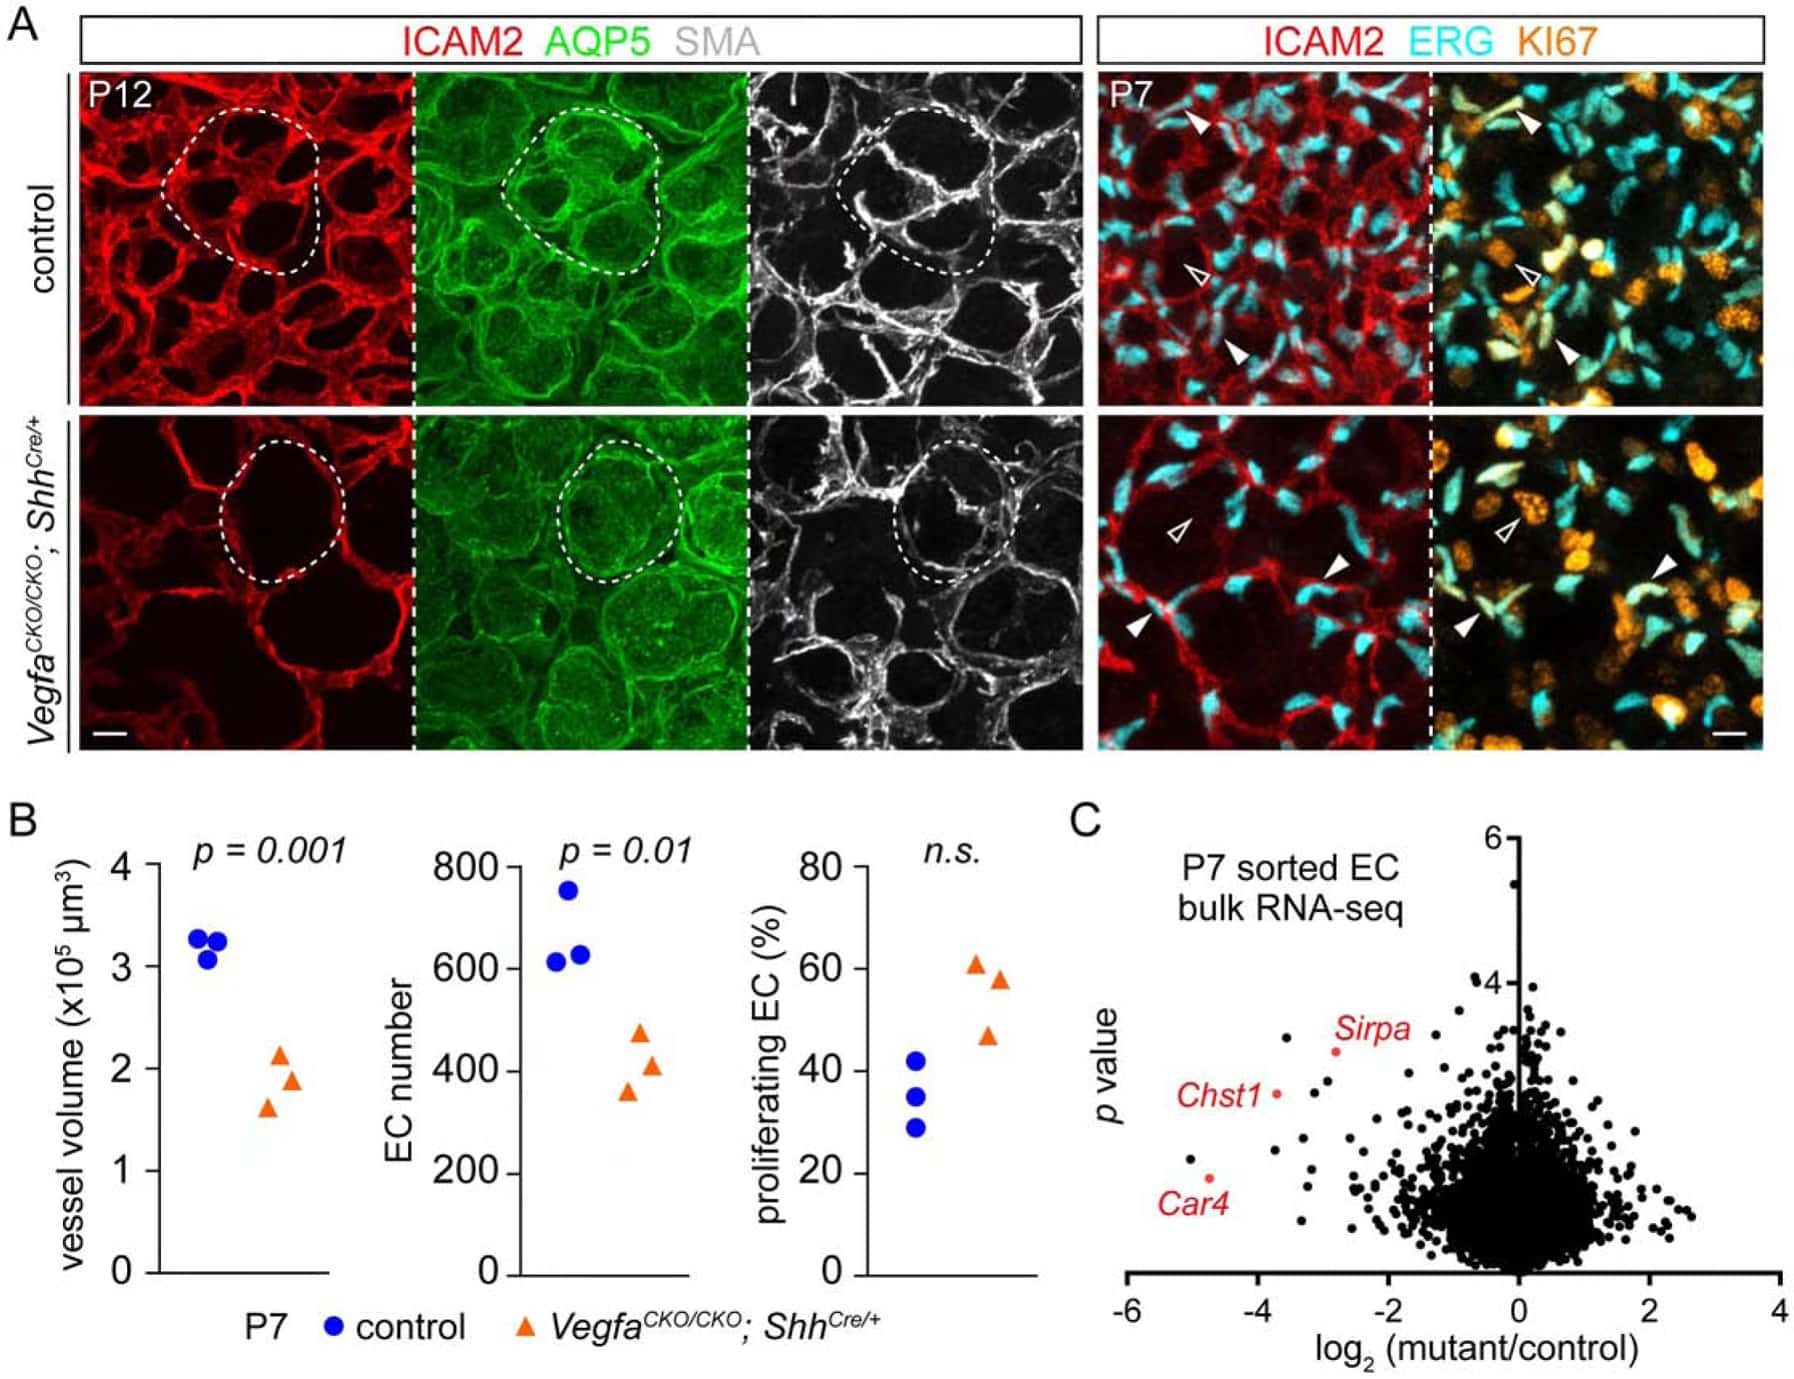
- Submitted by
- Invitrogen Antibodies (provider)
- Main image
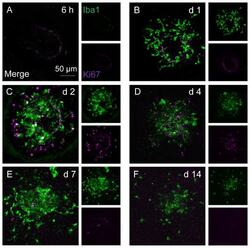
- Experimental details
- Figure 4 Microglia/monocyte accumulation precedes appearance of non-myeloid cell proliferation. Iba1 and Ki67 dual-staining on RPE/choroid whole-mounts during the time course of CNV development. ( A ) Six hours post laser induction, neither macrophages nor cell proliferation are detected at lesions. ( B ) On day 1, accumulating Iba1 + cells are Ki67-negative and no proliferating cells are observed. By day 2 (C) and 4 (D), majority of macrophages are not co-localised with Ki67 immuno-reactivity, while abundant Iba1 - Ki67 + cells are seen at lesions. Between day 7 (E) and 14 (F), both Iba1 + and Ki67 + cell numbers subside. Images are representative of at least 12 lesions for each time point. Smaller images display separate stains for Iba1 and Ki67, respectively; bigger images are two channels merged.
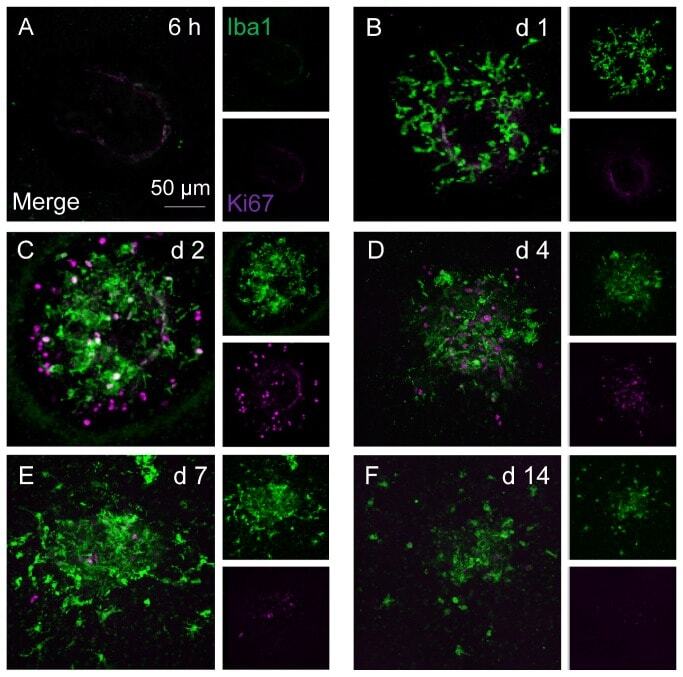
- Submitted by
- Invitrogen Antibodies (provider)
- Main image
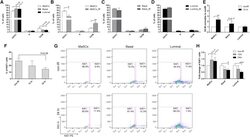
- Experimental details
- Figure 2 Wild-Type MaSCs Exhibit Increased G2 Arrest and Evade Damage-Induced Quiescence after IR (A) Cell-cycle distributions of different subpopulations from MECs before IR were examined using PI staining (data are represented as mean +- SEM; n = 5). (B) A significant increase of cells in G2/M was observed in MaSCs 12 hr after IR (data are shown as mean +- SEM; n = 3; ** p < 0.01; * p < 0.05). (C and D) The cell-cycle profiles of basal and luminal compartments before and 12 hr after IR (data are shown as mean +- SEM; n = 3). (E) The fold change of cells in G2/M phase 12 hr after IR as compared to non-IR samples (data are shown as mean +- SEM; n = 3; ** p < 0.01). (F) Percentage of Ki67-positive MECs before and after IR (data are shown as mean +- SEM; n = 3). (G) Representative FACS plots of Ki67 in different subpopulations before and after IR. (H) Quantification of Ki67 positivity shows that basal and luminal cells became significantly more quiescent after IR (data are shown as mean +- SEM; n = 3; *** p < 0.001; * p < 0.05).
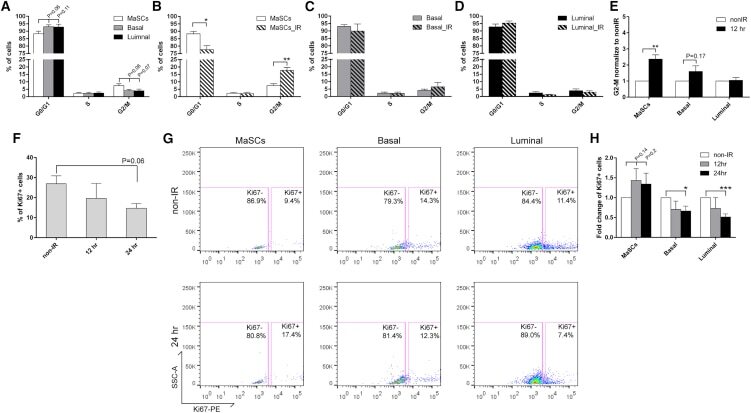
- Submitted by
- Invitrogen Antibodies (provider)
- Main image
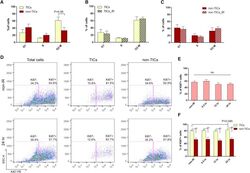
- Experimental details
- Figure 6 p53- Tumor Cells Are Highly Proliferative and Fail to Exhibit Proper Cell-cycle Regulation after IR (A) Cell-cycle distribution of TICs and non-TICs before IR (data are shown as mean +- SEM; n = 4). (B and C) Twelve hours after IR, both subpopulations exhibit similar cell-cycle profiles as compared to their non-IR counterparts (data are shown as mean +- SEM; n = 4). (D) Representative FACS plots of Ki67 staining in total tumor cells, TICs, and non-TICs before and after IR. (E) Percentage of Ki67-positive cells in total tumor cells before and after IR (data are shown as mean +- SEM; n = 3). (F) Percentage of Ki67-positive cells in TICs and non-TICs before and after IR (data are shown as mean +- SEM; n = 3; * p < 0.05; ** p < 0.01).
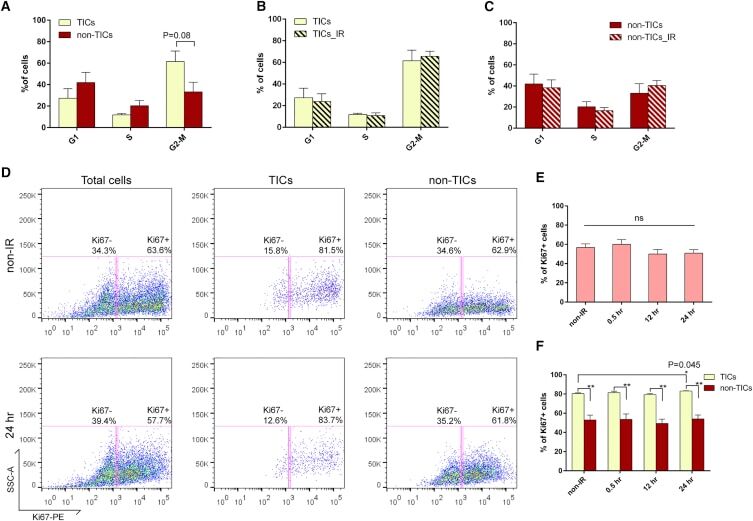
- Submitted by
- Invitrogen Antibodies (provider)
- Main image

- Experimental details
- Fig. 3. Similar levels of endogenous DSB formation in differentiated neuronal tissues and adult stem cell compartments. (A) Quantification of 53BP1 foci per cell in different tissues of untreated adult mice of the genotypes indicated and WT mice exposed to 50 or 100 mGy X-rays. (B) Representative images of untreated Atm - / - / Lig4 Y288C cerebellum stained for 53BP1 (green) and DAPI (blue). The lower image represents the boxed area shown in the upper image. Scale bars: 100 um (top), 20 um (bottom). (C,D) 53BP1 foci per cell in the adult SVZ and SGZ regions comparing proliferating (Ki67 + ) and non-proliferating (Ki67 - ) cells. Note that 53BP1 foci were not scored in the Atm - / - / Lig4 Y288C SGZ due to the low number of Ki67 + cells. (E) Representative images of the adult SVZ of untreated WT, Atm -/- and Lig4 Y288C mice, and WT SVZ 1.5 h after 100 mGy X-rays stained for Ki67 (red), 53BP1 (green) and DAPI (blue). Scale bars: 150 um (left), 20 um (right). The position of the lateral ventricle (LV) is shown for orientation. Yellow arrowheads show 53BP1 foci. Data represent mean+-s.e.m. (WT, n =4; Atm - / - , n =3; Lig4 Y288C , n =5; Atm - / - / Lig4 Y288C , n =3; WT 50 mGy 1.5 h, n =2; WT 100 mGy 1.5 h, n =3). ns, not significant; * P
- Submitted by
- Invitrogen Antibodies (provider)
- Main image
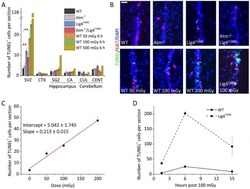
- Experimental details
- Fig. 5. Endogenous and ionising radiation-induced apoptosis is sensitively activated in the adult SVZ. (A) TUNEL + cells per section in untreated WT, Atm - / - , Lig4 Y288C , Atm - / - / Lig4 Y288C adult mice, and following irradiation with 50, 100 or 500 mGy X-rays. The region scored in each section encompassed the entire area of the tissue under analysis. CTX, Isocortex ; CA, Ammon's Horn; CUL, culmen; CENT, central lobule. (B) Representative images of a portion of the ventral SVZ stained for Ki67 (red), TUNEL (green) and DAPI (blue). Scale bar: 25 um. The upper panel shows untreated mice and the lower panel figures were from mice killed at 6 h following irradiation with the indicated doses. (C) Dose-response and linear fitting of radiation-induced apoptosis in WT adult SVZ. (D) Timecourse of radiation-induced apoptosis in WT and Lig4 Y288C adult SVZ exposed to 100 mGy X-rays. Data represent mean+-s.e.m. (WT 50 mGy 6 h, n =3; WT 100 mGy 6 h, n =5; WT 500 mGy 6 h, n =1; WT 100 mGy 15 h, n =2; Lig4 Y288C 100 mGy 1.5 h, n =2; Lig4 Y288C 100 mGy 6 h, n =2; Lig4 Y288C 100 mGy 15 h, n =2). ** P

- Submitted by
- Invitrogen Antibodies (provider)
- Main image

- Experimental details
- Fig. 6. Developmentally regulated ATM-independent apoptosis coupled with ATM-dependent DSB-induced apoptosis. (A) TUNEL + cells per mm 2 in the embryonal neocortex at E14.5 and E17.5. (B) TUNEL + cells per section in the postnatal (P5 and P15) and adult (2-3 months) SVZ and isocortex. Atm - / - / Lig4 Y288C marked P15 represents P20. To allow direct comparison, both the number of TUNEL + cells per section and per mm 2 area were scored in the SVZ region demonstrating a similar profile ( supplementary material Fig. S2B ). (C) Representative images of the embryonal neocortex and postnatal SVZ of untreated Lig4 Y288C mice stained for Ki67 (red), TUNEL (green) and DAPI (blue). Scale bars: 100 um (left), 25 um (right). (D) Quantification of Ki67 + cells per unit area (0.07 mm 2 ) in the SVZ of P5, P15 and 2-3-month-old WT mice relative to the number of Ki67 + cells in the same area in 2-3-month-old WT mice. (E) Representative images of the lateral ventricle (LV) (top) of P5, P15 and 2-3-month-old WT mice stained for DAPI (blue) and a portion of the SVZ region (bottom) stained for Ki67 (red) and DAPI (blue). CP, cortical plate; IZ, intermediate zone; VZ, ventricular zone. Data represent mean+-s.e.m. ( n as described in Fig. 4 ). * P
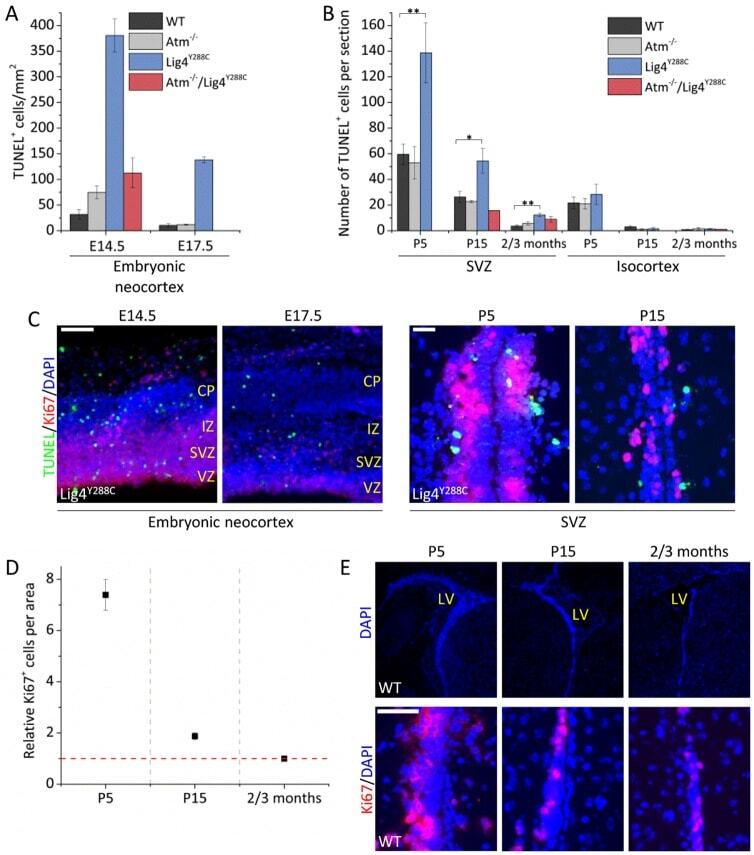
- Submitted by
- Invitrogen Antibodies (provider)
- Main image

- Experimental details
- Figure 11--figure supplement 1. Overexpression of Ki-67 induces ectopic heterochromatin. Overexpression of full length Ki-67 N-terminal fusion with eGFP (GFP, left panels) in U2OS cells induces ectopic heterochromatin, as visualised by DAPI staining (DNA, right panels) or immunofluorescence of HP1alpha (centre, middle), whereas cells with lower Ki-67 expression levels have normal chromatin. Immunofluorescence of Ki-67 (top, middle) shows colocalisation of fusion protein with overall Ki-67 pattern. Immunofluorescence of phospho-histone H3S10 shows expected staining of mitotic metaphase (bottom, middle panel) but no staining in a cell with ectopic heterochromatin (top right cell, same panel) due to Ki-67 overexpression (GFP, bottom left panel). Bar, 10 um DOI: http://dx.doi.org/
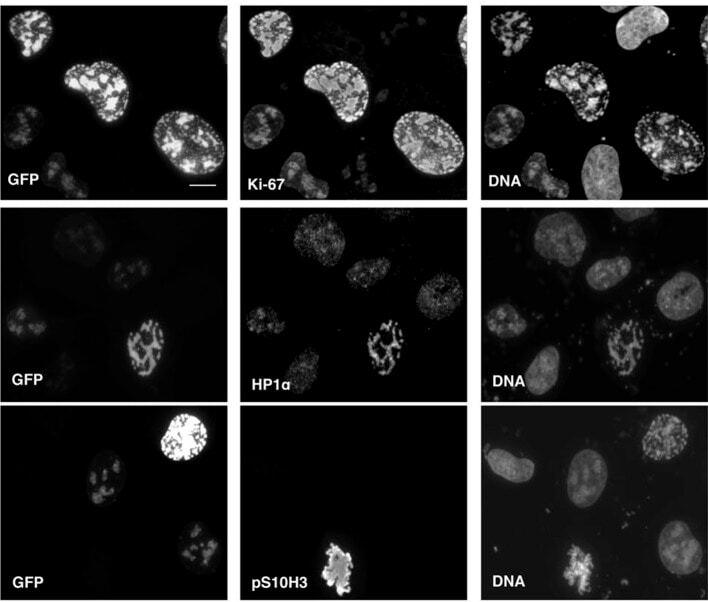
- Submitted by
- Invitrogen Antibodies (provider)
- Main image
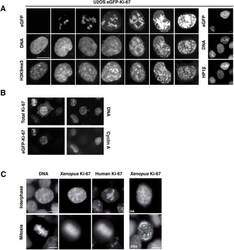
- Experimental details
- Figure 11. Overexpression of Ki-67 induces ectopic heterochromatin. ( A ) Overexpression of full length Ki-67 N-terminal fusion with eGFP in U2OS cells induces ectopic heterochromatin, as visualised by DAPI staining (middle) and immunofluorescence of H3K9Me3 (left) or HP1beta (right). Eight representative cells that have different levels of Ki-67 expression, as determined by eGFP fluorescence intensity, are shown. Bar, 10 um. ( B ) U2OS cells expressing high levels of exogenous eGFP-Ki-67 and showing ectopic chromatin condensation are negative for cyclin A staining by immunofluorescence. ( C ) Left: Immunofluorescence analysis of the localisation of endogenous human and ectopically expressed Xenopus Ki-67 in U2OS cells, showing colocalisation in metaphase at the perichromosomal region. Right: DNA condensation caused by high overexpression of Xenopus Ki-67 in U2OS cells. Bars, 10 um. DOI: http://dx.doi.org/ Figure 11--figure supplement 1. Overexpression of Ki-67 induces ectopic heterochromatin. Overexpression of full length Ki-67 N-terminal fusion with eGFP (GFP, left panels) in U2OS cells induces ectopic heterochromatin, as visualised by DAPI staining (DNA, right panels) or immunofluorescence of HP1alpha (centre, middle), whereas cells with lower Ki-67 expression levels have normal chromatin. Immunofluorescence of Ki-67 (top, middle) shows colocalisation of fusion protein with overall Ki-67 pattern. Immunofluorescence of phospho-histone H3S10 shows expected staining of mitoti
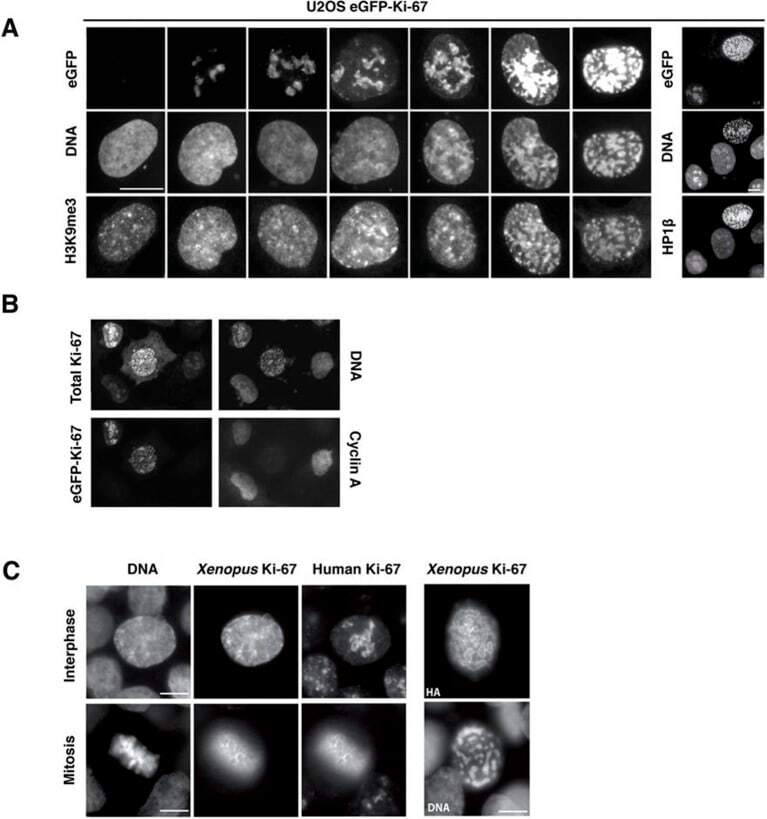
- Submitted by
- Invitrogen Antibodies (provider)
- Main image
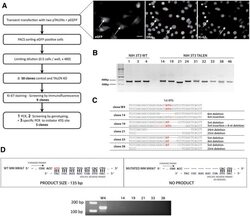
- Experimental details
- Figure 3--figure supplement 8. Generation of Ki-67-mutant NIH-3T3 cells. ( A ) Top and left, schematic representation of TALEN-mediated generation of NIH-3T3 biallelic Ki-67 mutant cells. Top right, immunofluorescence of Ki-67 and eGFP staining in NIH 3T3 cells transfected with two plasmids encoding TALEN pair and plasmid pEGFP. White arrows show Ki-67-negative pEGFP cotransfected cells. Scale bar 25 um. ( B ) PCR analysis of Mki67 initiator ATG surrounding sequence in genomic DNA prepared from three WT clones and nine Ki-67 immunofluorescence-negative clones selected for further analysis. ( C ) sequencing of Mki67 initiator ATG area from selected clones (14, 19, 21, 33, 38). ( D ), PCR analysis targeted to the initiator ATG in Mki67 gene of genomic DNA purified from NIH 3T3 WT clone W4 and Ki-67 KO clones 14, 19, 21, 33, 38. DOI: http://dx.doi.org/
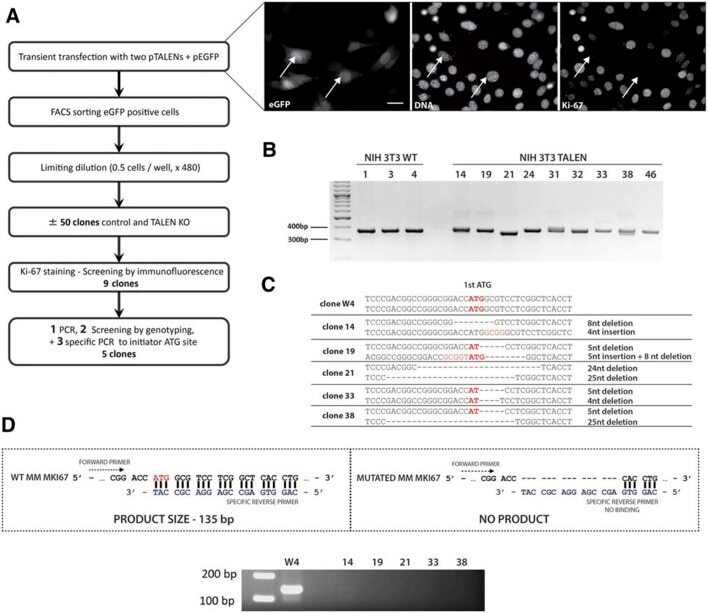
- Submitted by
- Invitrogen Antibodies (provider)
- Main image
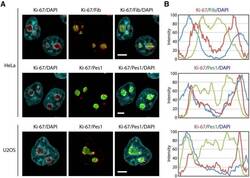
- Experimental details
- Figure 7--figure supplement 1. Ki-67 is a nucleolar protein localizing in the cortical side of the GC. ( A ) Localisation of Ki-67 protein by immunofluorescence in HeLa and U2OS cells. Fibrillarin (DFC) or Pes1 (GC) were used as nucleolar markers. Images were captured in confocal mode with a spinning-disk microscope. Objective 100 x. Scale bar: 5 mum. ( B ) Line scans showing the distribution of fluorescence signals within specific nucleoli (see dotted lines in panel A). DOI: http://dx.doi.org/
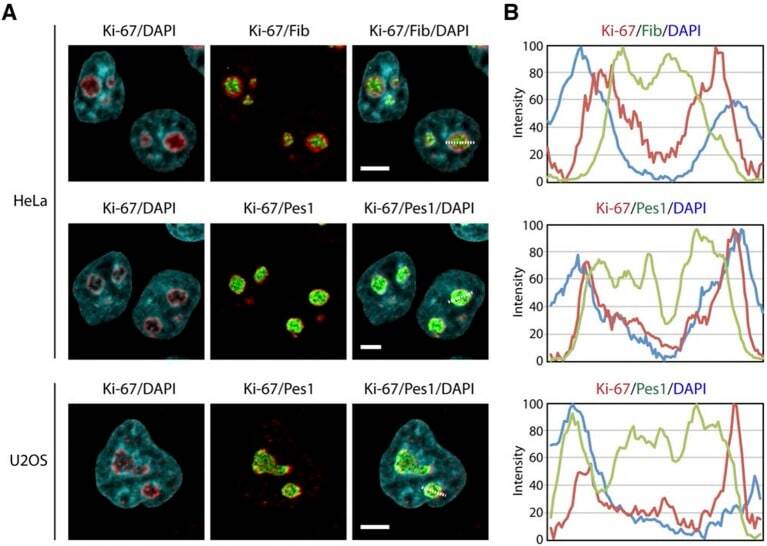
- Submitted by
- Invitrogen Antibodies (provider)
- Main image
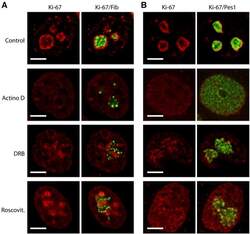
- Experimental details
- Figure 7--figure supplement 2. Ki-67 follows GC components upon drug-induced nucleolar disruption. Actinomycin D or the kinase inhibitors DRB and Roscovitine were added to cells during 90 min and Ki-67 was located within these cells by immunofluorescence. Fibrillarin ( A ) and PES1 ( B ) proteins were also localised by immunofluorescence. Objective 100 x. Scale bar: 5 mum. DOI: http://dx.doi.org/

- Submitted by
- Invitrogen Antibodies (provider)
- Main image
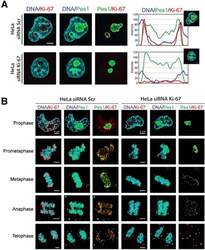
- Experimental details
- Figure 7. Ki-67 localises PES1 to mitotic chromosomes. ( A ) Analysis of the interphase localisation of PES1 and Ki-67 proteins by immunofluorescence in HeLa cells 72 hr after transfection with control siRNA (scramble; Scr) or Ki-67 RNAi. Right, line scans showing the distribution of fluorescence signals within indicated nucleoli (dashed line). Images were captured in confocal mode with a spinning-disk microscope. Bar, 5 mum. ( B ) Analysis of the mitotic localisation of PES1 and Ki-67 proteins by immunofluorescence in HeLa cells 72 hr after transfection with control siRNA (scramble; Scr) or Ki-67 RNAi. Bar, 5 mum. DOI: http://dx.doi.org/ Figure 7--figure supplement 1. Ki-67 is a nucleolar protein localizing in the cortical side of the GC. ( A ) Localisation of Ki-67 protein by immunofluorescence in HeLa and U2OS cells. Fibrillarin (DFC) or Pes1 (GC) were used as nucleolar markers. Images were captured in confocal mode with a spinning-disk microscope. Objective 100 x. Scale bar: 5 mum. ( B ) Line scans showing the distribution of fluorescence signals within specific nucleoli (see dotted lines in panel A). DOI: http://dx.doi.org/ Figure 7--figure supplement 2. Ki-67 follows GC components upon drug-induced nucleolar disruption. Actinomycin D or the kinase inhibitors DRB and Roscovitine were added to cells during 90 min and Ki-67 was located within these cells by immunofluorescence. Fibrillarin ( A ) and PES1 ( B ) proteins were also localised by immunofluorescence. Objective 10
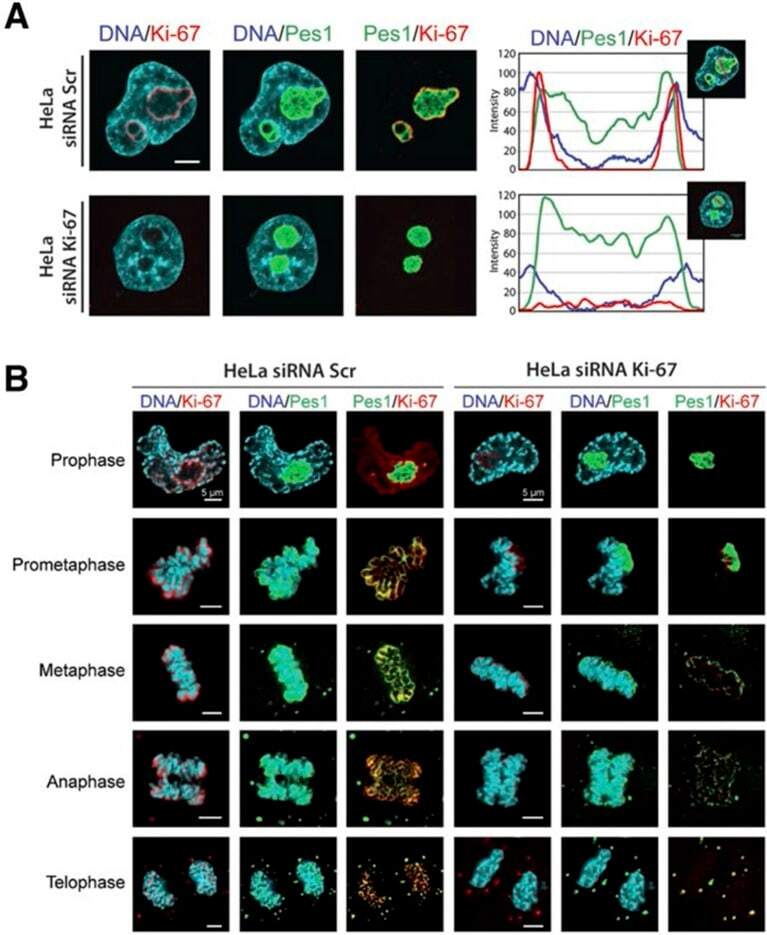
- Submitted by
- Invitrogen Antibodies (provider)
- Main image
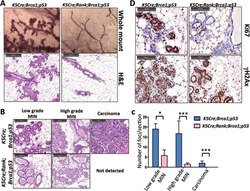
- Experimental details
- Figure 1 Ablation of Rank in mammary epithelial cells markedly decreases tumor formation in Brca1/p53 mutant female mice. (A) Representative whole mount images (haematoxylin staining, magnification 52x) and paraffin sections (H&E staining, scale bar, 200 mum) of mammary glands from 4-month-old K5Cre;Brca1;p53 double- and K5Cre;Rank;Brca1;p53 triple-knockout littermate mice. (B) Representative images (H&E staining, scale bar, 100 mum) and (C) quantification of low-grade MINs, high-grade MINs and adenocarcinomas in mammary glands from 4-month-old K5Cre;Brca1;p53 and K5Cre;Rank;Brca1;p53 mutant littermates. Data are shown as average number of foci/section of 1 inguinal and 2 thoracic mammary glands per mouse +/- SEM. n >= 4 mice/group. * P < 0.05, *** P < 0.001 (2-way ANOVA). (D) Representative images of Ki67 and gammaH2AX immunostaining of mammary glands from 4-month-old K5Cre;Brca1;p53 double- and K5Cre;Rank;Brca1;p53 triple-knockout littermates. Scale bar, 100 mum.

- Submitted by
- Invitrogen Antibodies (provider)
- Main image
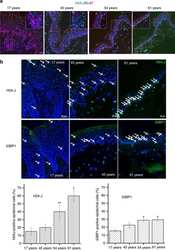
- Experimental details
- Figure 10 H2A.J accumulates in the aging human epidermis. ( a ) H2A.J and Ki-67 co-localization in sections of human skin of the indicated ages by immunofluorescent staining. H2A.J showed mutually exclusive staining with the Ki-67 proliferation marker. ( b ) H2A.J and 53BP1 foci increase in aging human epidermis. Arrows indicate positively-stained nuclei. A quantification of positive cells for three biological replicates is shown below the immunofluorescence images, and the one-sided Mann-Whitney U -test was used to determine the statistical significance (* P
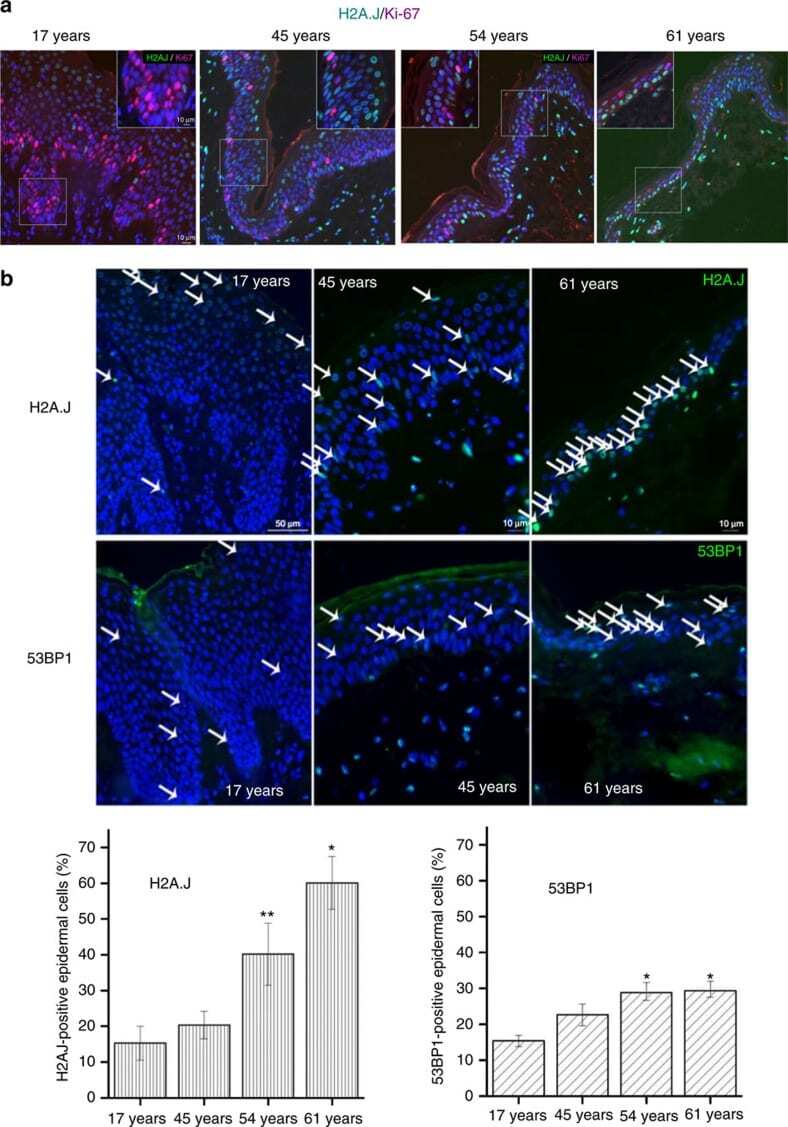
- Submitted by
- Invitrogen Antibodies (provider)
- Main image
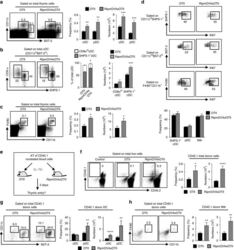
- Experimental details
- Fig. 1 Ag-specific interactions between mTECs and CD4 + T cells increase the thymic entry of circulating DCs and macrophages. a - c Flow cytometry profiles, frequencies and numbers of cDCs (CD11c hi BST-2 lo ), pDCs (CD11c int BST-2 hi ) ( a ), resident cDCs (CD8alpha hi SHPS-1 - ), migratory cDCs (CD8alpha lo SHPS-1 + ) ( b ) and macrophages (F4/80 + CD11b + ) ( c ) in the thymus from OTII- Rag2 -/- and RipmOVAxOTII- Rag2 -/- mice. Data are representative of three independent experiments ( n = 3 mice per group and per experiment). d Flow cytometry profiles and frequencies of proliferating Ki-67 + thymic DC subsets and macrophages. Data are representative of two independent experiments ( n = 3 mice per group and per experiment). e Experimental setup: nucleated blood cells from CD45.1 WT congenic mice were adoptively transferred into sublethally irradiated CD45.2 OTII- Rag2 -/- and RipmOVAxOTII- Rag2 -/- recipients. Three days after i.v . adoptive transfer (AT), the thymic entry of DCs and macrophages of CD45.1 donor origin was analysed. SL-TBI: sublethal total body irradiation. f - h Flow cytometry profiles, frequencies and numbers of CD45.1 total donor cells ( f ) as well as cDCs, pDCs ( g ) and macrophages ( h ) of CD45.1 donor origin in the thymus from OTII- Rag2 -/- and RipmOVAxOTII- Rag2 -/- recipients. Control: non-injected irradiated OTII- Rag2 -/- mice. Data are representative of three independent experiments ( n = 3-4 mice per group and per experiment). d , h MPhi: m
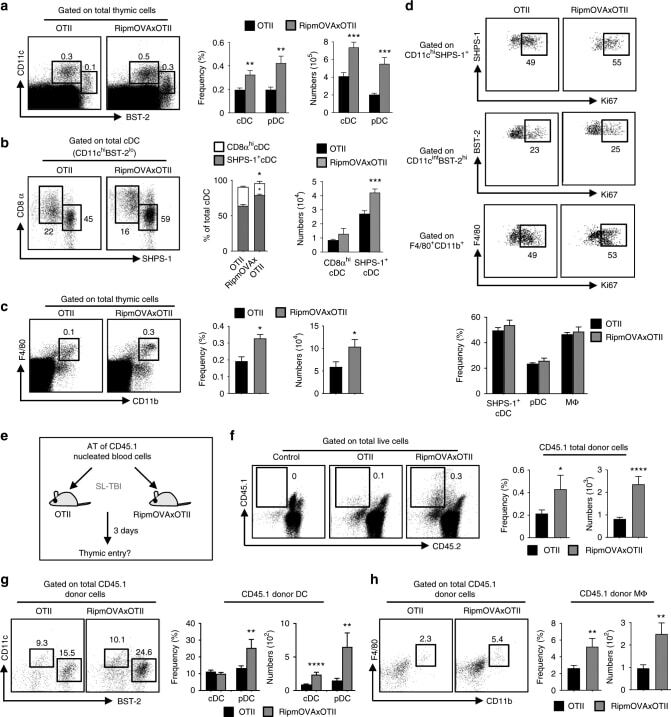
- Submitted by
- Invitrogen Antibodies (provider)
- Main image
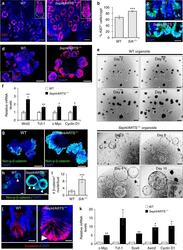
- Experimental details
- Fig. 4 Deletion of Sept4 /ARTS leads to enhanced activity of the Wnt/beta-catenin pathway. a Intestinal tissue wholemount stained for Ki67, viewed from the base of the crypt, shows enhanced crypt base proliferation in Sept4 /ARTS -/- ( S /A -/- ) mice. Inset shows isolated and stained crypts, which display greater proliferation in the S /A -/- crypt base (dotted white line). b Quantification of percentage of Ki67 + proliferating cells per crypt. c WT and S /A -/- intestinal sections stained for PCNA. d WT and Sept4 /ARTS -/- intestinal organoids stained against Ki67. e S /A -/- organoids often display cystic-like morphology that continue to expand up to 10 days in culture. Inset shows S /A -/- cystic organoid with characteristic organoid ""buds"". f Real-time (RT)-PCR analysis shows increased relative mRNA transcripts of Wnt3, Tcf-1, c-Myc and Cyclin D1 in control and S /A -/- organoids. g WT and S /A -/- intestinal organoids stained against non-phosphorylated beta-catenin. h Zoom-in of intestinal organoids shows nuclear beta-catenin + cells (white arrowheads) within the S /A -/- organoid crypt. i Quantifications for number of nuclear beta-catenin + cells per organoid crypt. j Small intestinal crypts in vivo stained for beta-catenin show high nuclear localization (white arrowhead) in the Sept4 /ARTS -/- crypt base. k RT-PCR analysis indicates increased relative mRNA levels of Wnt target genes c-Myc , Tcf-1 , Sox9 , Axin2 and

- Submitted by
- Invitrogen Antibodies (provider)
- Main image
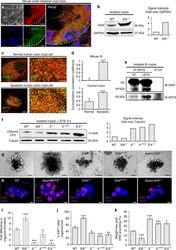
- Experimental details
- Fig. 8 ARTS mediates its functions via interaction with XIAP in the intestinal crypt. a Confocal microscopy image of mouse small intestinal crypt base shows co-localization of ARTS and XIAP within the same cell [ n = 4 mice]. b Western blot of XIAP in isolated wild-type (WT) and Sept4 /ARTS -/- ( S /A -/- ) crypts. Signal intensity is normalized to GADPH. c Super-resolution stimulated emission depletion (STED) microscopy shows co-localization of ARTS and XIAP in normal and apoptotic human colonic crypt base cells. d Pearson's coefficient values demonstrate higher co-localization of ARTS and XIAP in both mouse and human apoptotic crypt cells [ n = 3 human colons and n = 4 mice. Error bars represent s.e.m.]. e Co-immunoprecipitation (co-IP) of ARTS and XIAP in isolated XIAP DeltaRING small intestinal crypts. XIAP DeltaRING only interacts mildly with ARTS in the absence of apoptotic stimulation. After staurosporine (STS) treatment, efficient binding between ARTS and XIAP DeltaRING is detected. f Western blot and signal intensity of active caspase-3 (CP3) in STS-treated crypts show that deletion of XIAP or RING domain increases cleaved CP3 levels. g Organoids derived from XIAP -/- , XIAP DeltaRING and S;X -/- crypts display hindered growth and development after 11 days post seeding. h XIAP -/- , XIAP DeltaRING and S;X -/- organoids stained for Ki67. i , j Fold difference in i organoid formation capacity and j number of Ki67 + cells
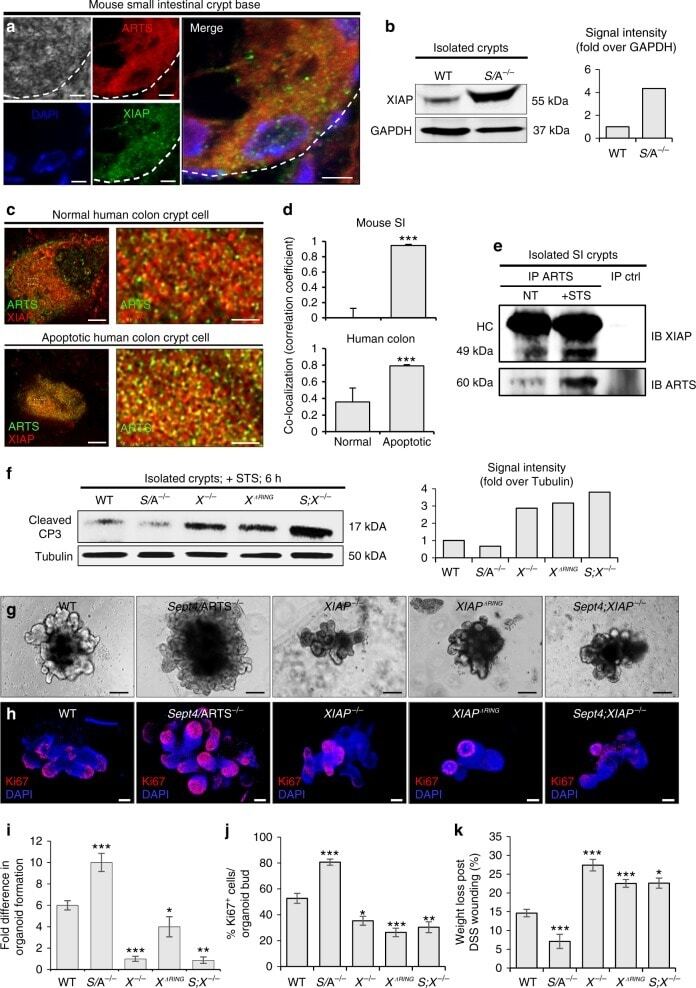
- Submitted by
- Invitrogen Antibodies (provider)
- Main image
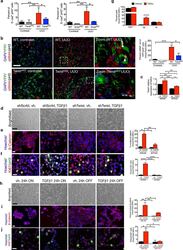
- Experimental details
- Figure 5 EMT program G2 cell cycle arrest. ( a ) Percent E-cadherin + pH3 + cells in kidneys from the indicated experimental groups. WT contralat., n = 4; Twist cKO contralat., n = 5; WT UUO, n = 4; Twist cKO UUO, n = 5. WT contralat., n = 3; Snail cKO contralat., n = 3; WT UUO, n = 4; Snail cKO UUO, n = 3. ( b ) Representative images (5 visual fields for each tissue analyzed) of immunolabeling for YFP, AQP1 and pH3 and percentage of alphaSMA + cells out of the YFP + pH3 + TECs (contralat., n = 6; UUO n = 3). Scale bar, 100 ~m. ( c ) Relative Twist1 expression in indicated cells. ( d ) Representative images of brightfield imaging in indicated cells. ( e ) Representative images (3 visual fields for each tissue analyzed) of immunolabeling for beta-catenin and percent nuclear accumulation. Scale bar, 50 ~m. ( f,g ) Representative images (3 visual fields for each tissue analyzed) of immunolabeling for Ki67 and pH3 ( f ) and percent cells in G2 ( g ). Scale bar, 50 ~m. ( h ) Representative images of brightfield imaging in indicated cells. ( i ) Representative images (3 visual fields for each tissue analyzed) of immunolabeling for beta-catenin and percent nuclear accumulation. Scale bar, 50 ~m. ( j ) Representative images (3 visual fields for each tissue analyzed) of immunolabeling for Ki67 and pH3 ( f) and percent cells in G2 ( g ). Scale bar, 50 ~m. Vehicle (vh) and TGF-beta1 treatment were conducted for 24 hours, followed by vehicle or TGF-beta1 withdrawal for 24 hours, n = 3. D
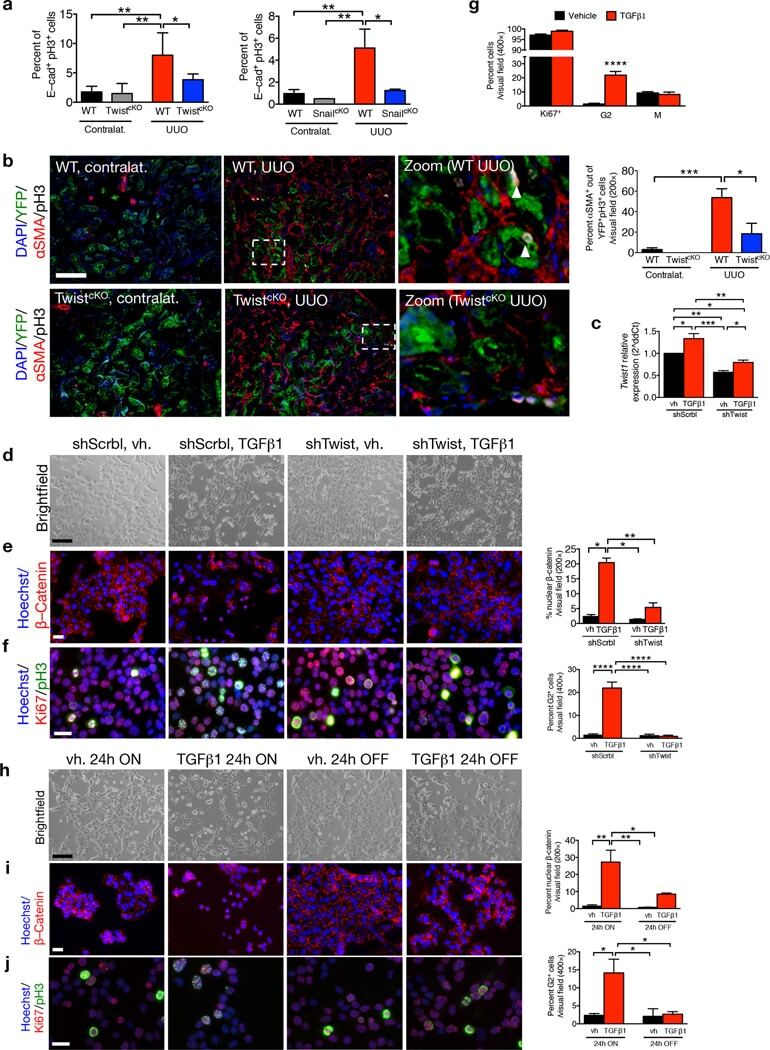
- Submitted by
- Invitrogen Antibodies (provider)
- Main image
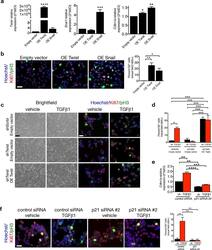
- Experimental details
- Figure 6 p21 controls EMT program G2 cell cycle arrest. ( a ) Relative expression of Twist1 Snai1 and Cdkn1a (p21) in MCT cells transfected with empty vector, Twist or Snail overexpression vectors, 24 hours post transfection, n = 3. ( b ) Representative images (3 visual fields for each tissue analyzed) of vehicle or MCT cells transfected with empty vector, Twist or Snail overexpression vectors, 24 hours post transfection, immunolabeled for Ki67 and pH3 and respective quantification of the percentage of cells in G2 phase, n = 3. Scale bar: 50 ~m. ( c ) Phase contrast light microscopy and immunolabeling for Ki67 and pH3 of MCT shScrbl and MCT shTwist cells transfected with empty or Twist overexpression (OE Twist) plasmids and treated with vehicle or TGF-beta1. ( d ) Quantification of the percentage of empty or Twist OE transfected MCT shScrbl and MCT shTwist cells in G2 phase of the cell cycle comparing cells treated with vehicle or TGF-beta1, n = 3. ( e ) Relative expression of Cdkn1a (p21). ( f ) Representative images (3 visual fields for each tissue analyzed) of immunolabeling for Ki67 and pH3 of control or p21 siRNA-transfected MCT cells and percent of cells in G2 phase. Scale bar, 50 ~m. Data is represented as mean +- SEM. Hoechst: nucleus. One-way ANOVA with Tukey post-hoc analysis. b and e , unpaired one-tailed t-test. * P < 0.05, ** P < 0.01, *** P < 0.001, **** P < 0.0001.
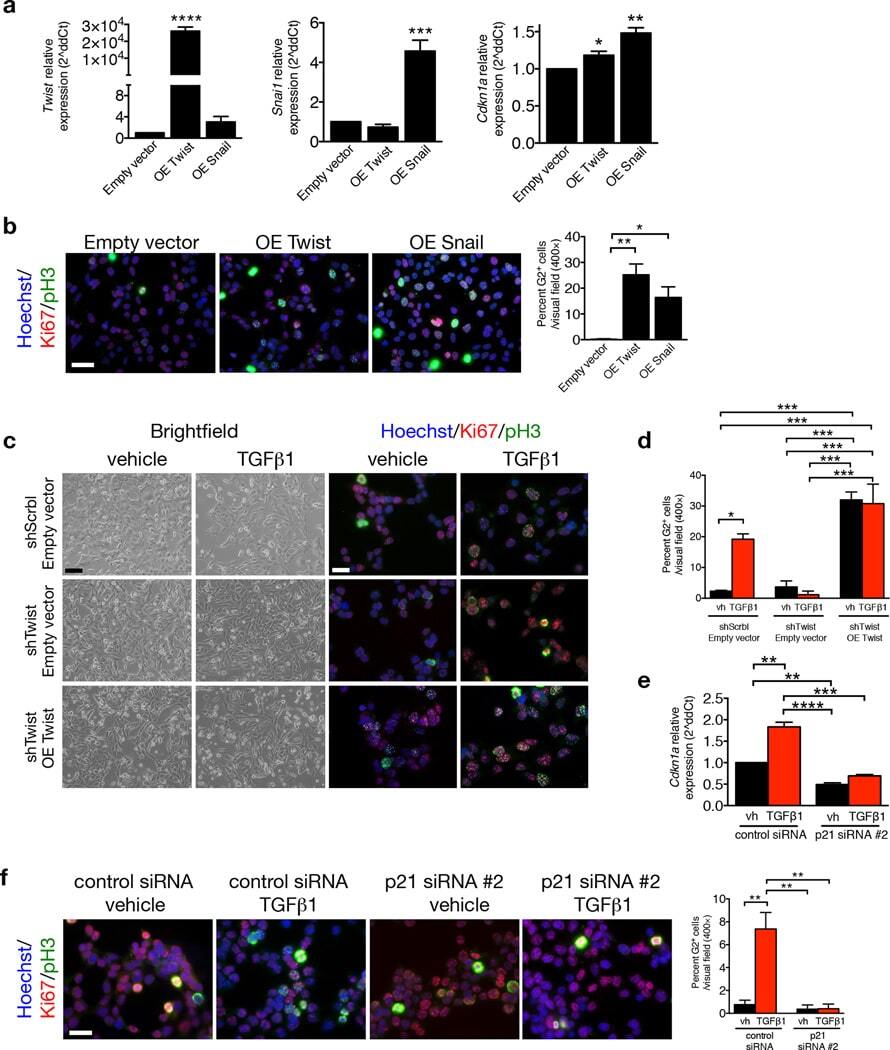
- Submitted by
- Invitrogen Antibodies (provider)
- Main image
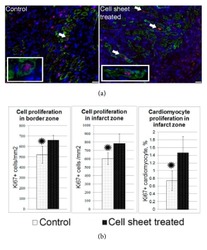
- Experimental details
- Figure 7 Total and cardiomyocyte proliferation in the left ventricle wall 14 days after myocardial infarction and delivery of CPC-based cell sheets. (a) Representative images of cardiomyocyte proliferation in control group and after cell sheet treatment. Two weeks after epicardial delivery of the CPC sheet, the heart sections were costained with the antibodies against the cell-proliferation-associated antigen-Ki67 (red fluorescence) and cardiomyocyte marker, Troponin I (green fluorescence). Combined red and green fluorescence and DAPI-stained nuclei (blue) are shown in merged images. Arrows indicate costained proliferated cardiomyocytes. (b) Bar graphs show quantitative data of the number of total proliferating cells in border or infarct zones and cardiomyocyte proliferation. Data is presented as mean+-SD. * p

- Submitted by
- Invitrogen Antibodies (provider)
- Main image
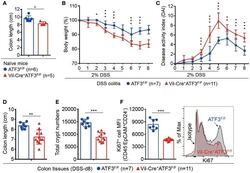
- Experimental details
- Figure 4 Epithelial ATF3 is required for protection against DSS colitis. (A) Comparison of colon length between 3-month-old naive mice as indicated. (B-F) Analysis of colitis severity during DSS treatment. (B) Percentage of body weight loss during DSS colitis. (C) Disease activity index (weight loss percentage, stool consistency, and blood in stools) was indicated in each group of mice during DSS colitis. (D) Colon length, (E) total colon crypt numbers, and (F) Ki67 + proliferating crypt cells by flow cytometry analysis, were measured at day-8 post DSS treatment. Results were from two independent experiments. ""n"" refers to the number of mice analyzed. Statistical analysis was done using Multiple T -test on Prism software. * P < 0.05, ** P < 0.005, *** P < 0.0005.
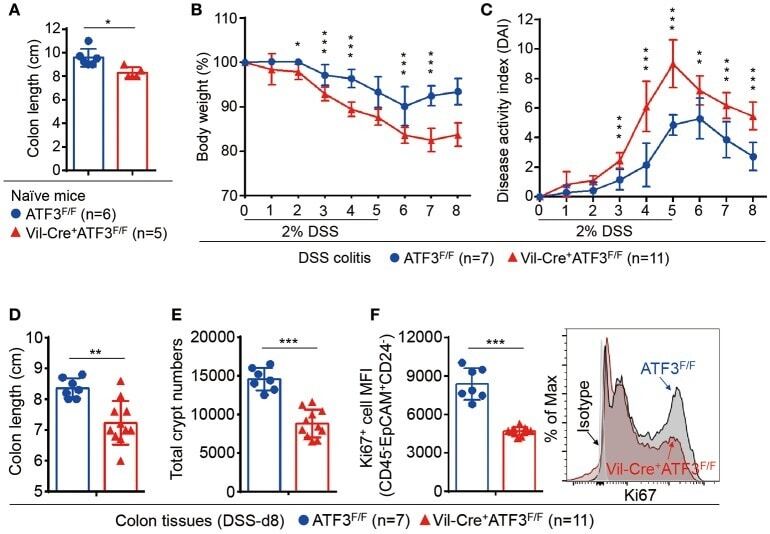
- Submitted by
- Invitrogen Antibodies (provider)
- Main image
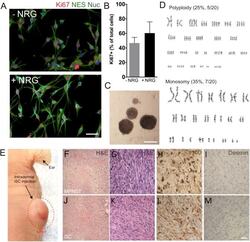
- Experimental details
- FIGURE 1 The development of a malignant peripheral nerve sheath tumors (MPNST) model. (A) Representative immunocytochemical images of induced tumor Schwann cells (iSCs) either deprived of growth factors (-NRG) or treated with neuregulin and forskolin (+NRG, 50 ng/ml neuregulin, 5 mM Forskolin). Note the similar numbers of Nestin+ (green, NES), Hoechst+ (blue) iSCs that express Ki67 (red) across both conditions. (B) Quantification of percentage of Ki67 + cells revealed no difference between groups (Student's t -test, n = 4, P = 0.3). (C) Note the presence of sphere formation when iSCs are grown in growth factor deprived conditions. (D) Karyotyping analysis indicates multiple chromosomal abnormalities, including polyploidy and monosomy cells. (E) Intradermal iSC injections into back skin resulted in the development of tumors within 16 weeks. (F-M) Representative histological images of H&E (F,G,J,K) , s100 (H,L) and Desmin (I,M) from a biopsied sample of human MPNSTs (F-I) and from a sample from iSCs (J-M) . Note the presence of necrosis, mitosis and spindle-shaped cells in both samples (F,G and J,K) . Also note the presence of S100 (H,L) immunoreactivity, as well as the lack of Desmin immunoreactivity (I,M) in both samples. Scale bars = A (50 mum), C (200 mum), G-I (20 mum).
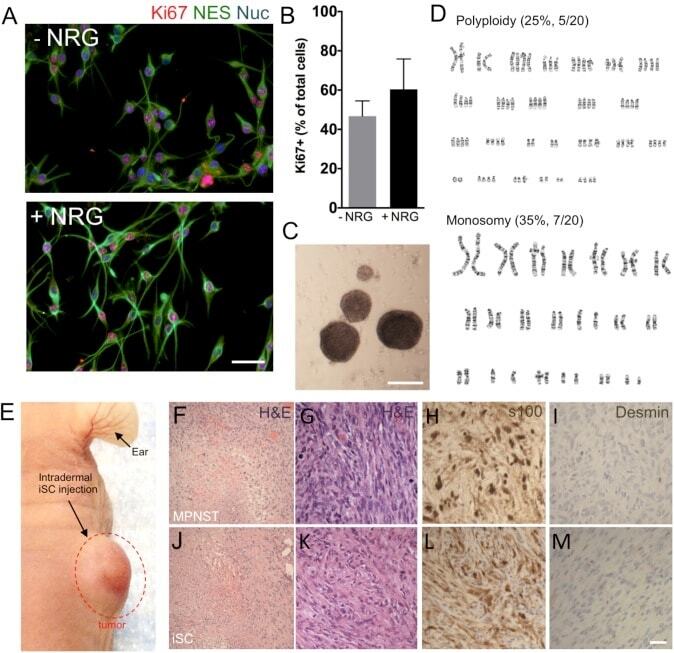
- Submitted by
- Invitrogen Antibodies (provider)
- Main image
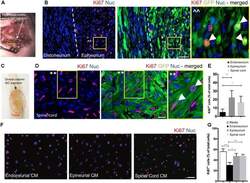
- Experimental details
- FIGURE 2 The endoneurial microenvironment suppresses tumorigenesis of MPNST. (A) Intraneural iSC injections into the sciatic nerve resulted in the development of tumors within 2 months. (B) Representative immunohistochemical images of the endoneurial and epineurial compartments. Note the presence of widespread Ki67+ (red), Hoechst+ (blue) proliferative iSC (green) in the epineurial compartment compared to the endoneurial compartment. See inset (^^) for high-resolution example of localization (arrowheads). (C) iSCs injected into the dorsal column of the spinal cord formed tumors within 2 months. (D) Representative immunohistochemical images of the spinal cord. Note the presence of widespread Ki67+ (red), Hoechst+ (blue) proliferative iSC (green) in the spinal cord. See inset ( ** ) for high-resolution example of localization (arrowheads). (E) Quantification of the percentage of Ki67+ iSCs in the endoneurial compartment, epineurial compartment and spinal cord demonstrated a significant decrease in endoneurial compartment compared to other regions (One-way ANOVA, Tukey's posthoc test, n = 6-8, * p < 0.01, ** p < 0.001). (F) Representative immunocytochemical images of iSCs treated with conditioned media (CM). Note there are less Ki67+ (red) Hoechst+ (blue) iSCs in the cultures treated with endoneurial CM compared to epineurial, spinal cord or base media. (G) Quantification of the percentage of Ki67+ iSCs demonstrated a significant decrease in the percenta
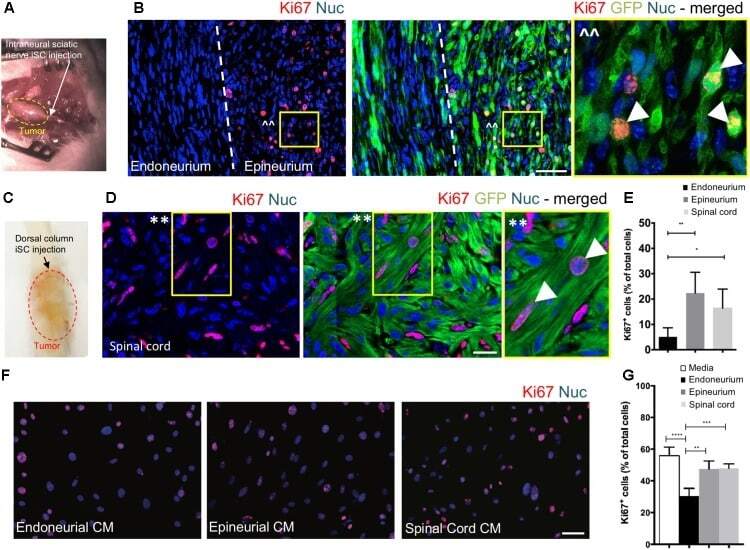
- Submitted by
- Invitrogen Antibodies (provider)
- Main image
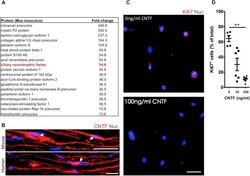
- Experimental details
- FIGURE 4 The identification of suppressive factors in the endoneurial compartment. (A) Fold change in candidate proteins (10-60 kDa) enriched in the endoneurium compared to spinal cord tissue. Ciliary neurotrophic factor (CNTF, red box), a growth factor known for its role in promoting differentiation of Schwann cells, was found at levels 5.5-fold higher in endoneurium tissue compared to spinal cord tissue. (B) Representative immunohistochemical images of uninjured mouse and human sciatic nerves demonstrating the presence of CNTF (red) in the cytoplasm of Schwann cells (blue). Note the presence of CNTF around the peri-nuclear area adjacent to nuclei (blue)--a cytoplasmic rich region of the myelinating Schwann cell. (C) Representative immunocytochemical images of iSCs (blue) treated with 0 ng/ml and 100 ng/ml CNTF. Note the reduction in Ki67+ (red) cells in CNTF treated conditions. (D) Quantification of the percentage of Ki67+ cells treated with 0, 10, or 100 ng/ml CNTF revealed a reduction in ki67+ cells at 100 ng/ml compared to 0 ng/ml (One-way ANOVA, Tukey's posthoc test, n = 3, ** p < 0.05). Scale bars = B (25 mum), C (50 mum).
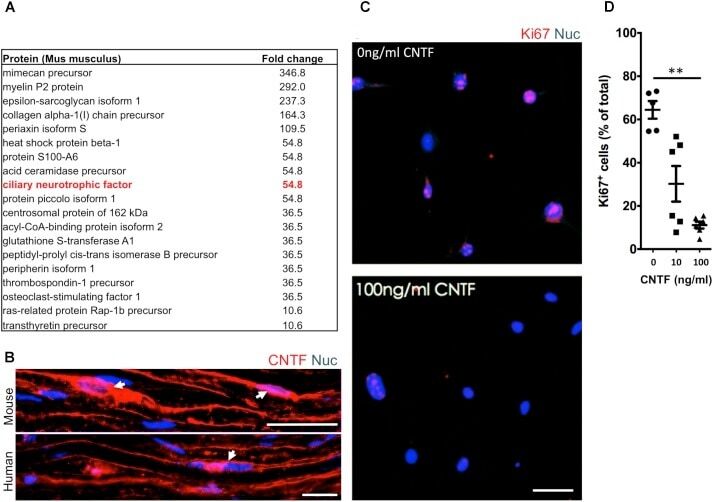
- Submitted by
- Invitrogen Antibodies (provider)
- Main image
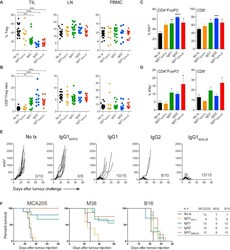
- Experimental details
- Figure 4 Intra-tumoral Treg Cell Depletion Is Required for the Anti-tumor Activity of Anti-CTLA-4 Mice were treated with 200 mug of anti-CTLA-4 on days 6 and 9 after s.c. inoculation of MCA205 tumor cells (n = 9-21). TILs, LNs, and PBMCs were processed on day 11 and stained for flow cytometry analysis. (A) Percentage of FoxP3 + CD4 + Treg cells from total CD4 + T cells. (B) CD8 + /Treg cell ratio in the indicated sites. Horizontal bars represent the mean. (C) Percentage of Ki67-expressing CD4 + FoxP3 - and CD8 + T cells. (D) Percentage of CD4 + FoxP3 - and CD8 + T cells expressing IFNgamma following re-stimulation with phorbol 12-myristate 13-acetate (PMA) and ionomycin; cumulative data of three separate experiments. Error bars show +-SEM. (E and F) hFcgammaR mice were treated with anti-CTLA-4 on days 6, 9, and 12 after s.c. inoculation of MCA205 (50 mug/dose), MC38 (100 mug/dose) or B16 (200 mug/dose) tumor cells. (E) MCA205 tumor growth in individual hFcgammaR mice in each treatment group. Inset numbers show the fraction of mice with complete long-term response. (F) Kaplan-Meier curves demonstrating survival of hFcgammaR mice for each tumor model. The total number of mice in each treatment group is shown at the right. * p < 0.05; ** p < 0.01; *** p < 0.001; **** p < 0.0001. See also Figure S4 .
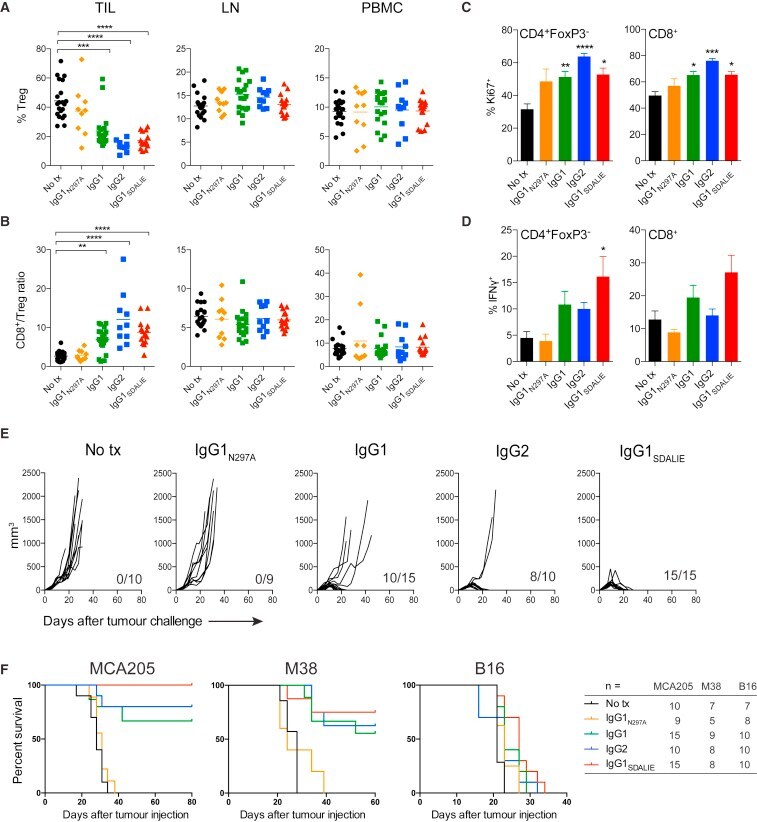
- Submitted by
- Invitrogen Antibodies (provider)
- Main image
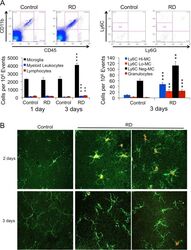
- Experimental details
- Figure 3 Effect of RD on mouse retinal microglia and leukocyte populations. (A) Flow cytometry of microglia and leukocyte populations in the mouse retina at 1 day (n = 2/group) and 3 days (n = 4/ group) following experimental RD. Populations were defined by gating on the leukocyte common antigen CD45 and the myeloid lineage marker CD11b. Gating for inflammatory monocyte marker Ly6C and granulocyte/neutrophil marker Ly6G further defined populations of microglia and subpopulations of myeloid leukocytes. (B) Immunofluorescence of flat-mounted mouse retinas at 2 and 3 days after detachment showing the proliferation of microglia. Iba-1 + (green) cells with ramified morphology are microglia; Ki67 (red) is a proliferative cell marker.
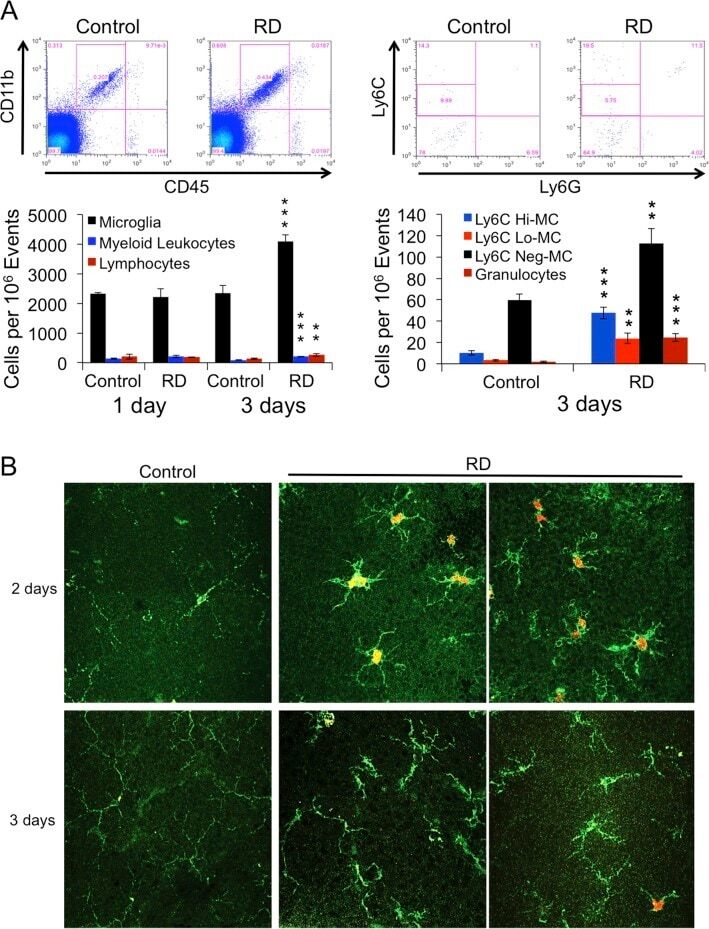
- Submitted by
- Invitrogen Antibodies (provider)
- Main image

- Experimental details
- Figure 1 Secretory cells proliferate after basal cell ablation a, Schematic representation of the ablation of CK5 -expressing basal cells of the trachea. Secretory, ciliated and basal stem cells are shown in pink, blue and grey colors respectively. b, Schematic of the timeline of i-dox or i-PBS administration and tissue harvest. c, Immunostaining for basal (p63 (green) and CK5 (cyan)) and secretory cells (SCGB1A1 (green)) in combination with Ki67 (red) on either i-PBS (upper panels) or i-Dox (lower panels) treated mice (n=6). White arrows, Ki67+ cells. d, Quantification of the percentage of p63+ and SCGB1A1+ cells per total DAPI+ cells in i-PBS or i-Dox n=3. e, Percentage of p63+Ki67+ and SCGB1A1+Ki67+ cells relative to total Ki67+ cells in i-PBS and i-Dox (n=3) treated CK5-DTA mice. i-Dox, inhaled doxycycline; i-PBS, inhaled PBS. Nuclei, DAPI (blue). *- p
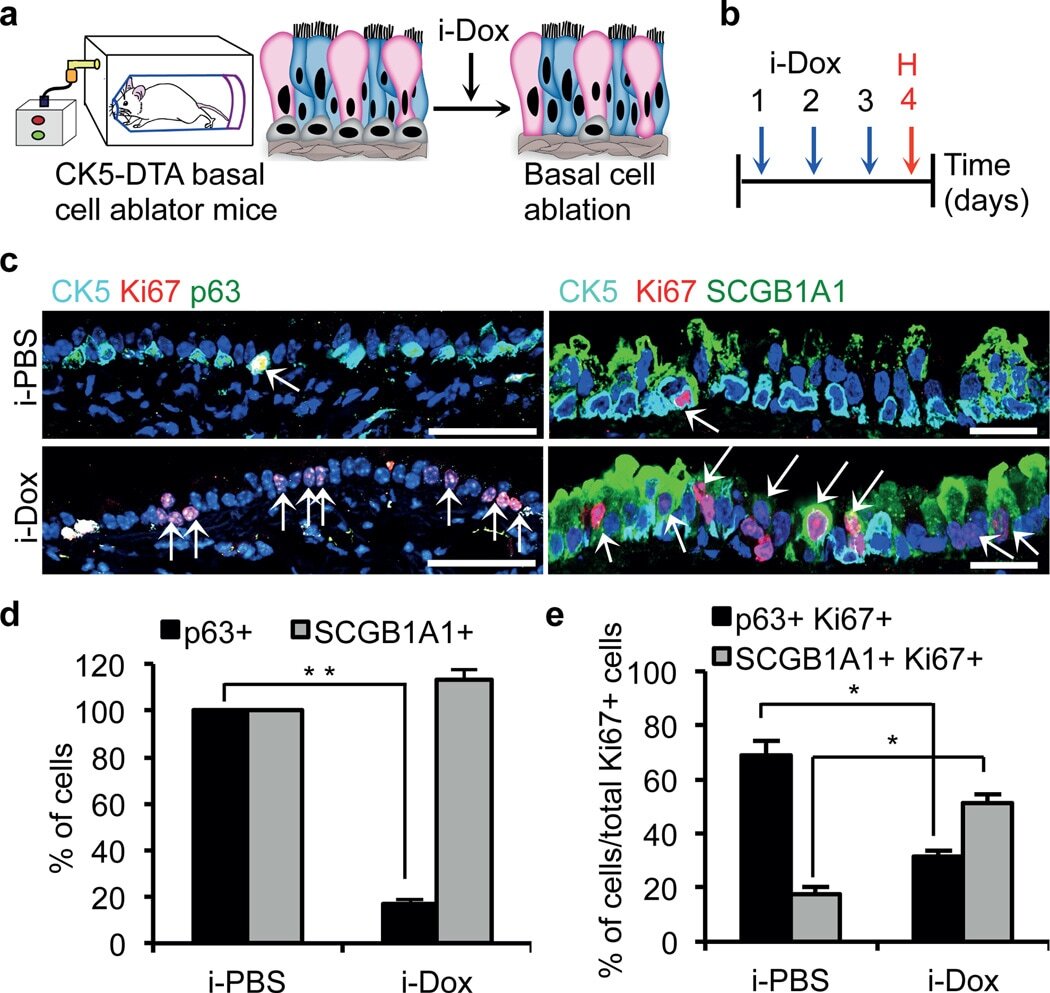
- Submitted by
- Invitrogen Antibodies (provider)
- Main image
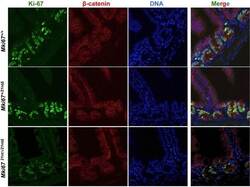
- Experimental details
- Figure 3--figure supplement 3. Background Ki-67 levels in Ki-67 mutant mice. Immunofluorescence of Ki-67 and beta-catenin on sagittal sections of the mouse intestinal epithelium from Mki67 +/+ , heterozygous Mki67 +/21nt and homozygous Mki67 21nt/21nt mice. DOI: http://dx.doi.org/
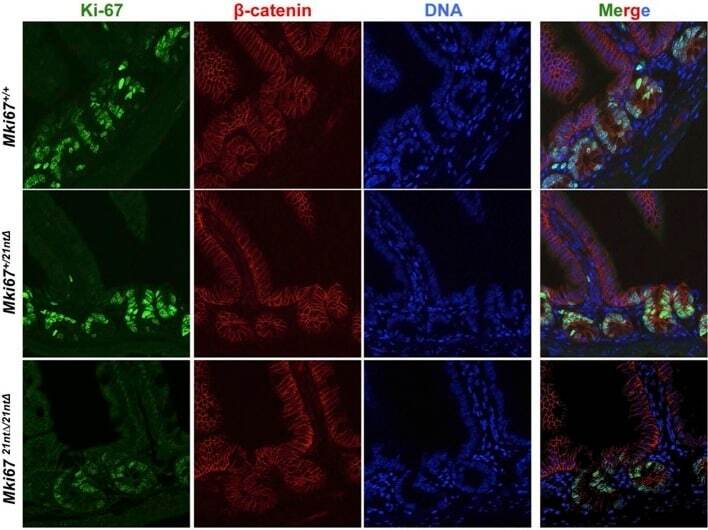
- Submitted by
- Invitrogen Antibodies (provider)
- Main image
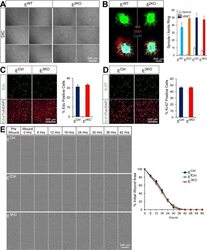
- Experimental details
- Figure 1--figure supplement 4. Endothelial JNK is not required for proliferation, migration, and angiogenic responses in vitro. ( A ) JNK-deficient and control primary MLEC form similar tubular networks in matrigel. Images are representative of two experiments performed in triplicate with independent primary MLEC preparations. ( B ) Representative maximum projection confocal images of collagen embedded aortic ring explants. Similar numbers of VEGF-induced iB4 (green) positive microvessels sprouting from aortic rings from control and endothelial JNK-deficient mice were detected. Smooth muscle actin (SMA) immunofluorescence (red) labels supporting cells. DAPI (blue) labels nuclei. Quantitation of microvessel number demonstrated no significant differences between aortic rings from control and JNK-deficient mice (mean +- SEM; n = 8~21 rings per group). The data presented were obtained in one experiment and are representative of three experiments with similar results. Aortas from 2~3 mice per group were used in each experiment. ( C , D ) Representative confocal images and quantitation of the percentage of endothelial cells staining positive for the incorporation of Edu (green, C ) or the proliferation marker Ki-67 (green, D ) (mean +- SEM; n = 10 images per group). The data presented were obtained in one experiment and are representative of three experiments with similar results. alphaTubulin (red) labels cell bodies. DAPI (blue) labels nuclei. ( E ) Endothelial monolayers were ex

- Submitted by
- Invitrogen Antibodies (provider)
- Main image
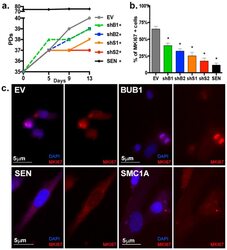
- Experimental details
- Figure 2 Proliferation of HPF is impaired upon BUB1 or SMC1A knockdown. ( a ) Growth curve of EV, BUB1 or SMC1-depleted and SEN cultures as assessed by number of PDs. ( b ) Quantification of percentage of MKI67 positively stained cells per cell line. ( c ) Representative IF images for the proliferation marker MKI67 (red) in EV, SEN, BUB1 and SMC1A-depleted cells. (*) Indicates significant differences ( p < 0.05) from EV cells tested by One-way ANOVA. Data are expressed as mean +- SD (n = 3).
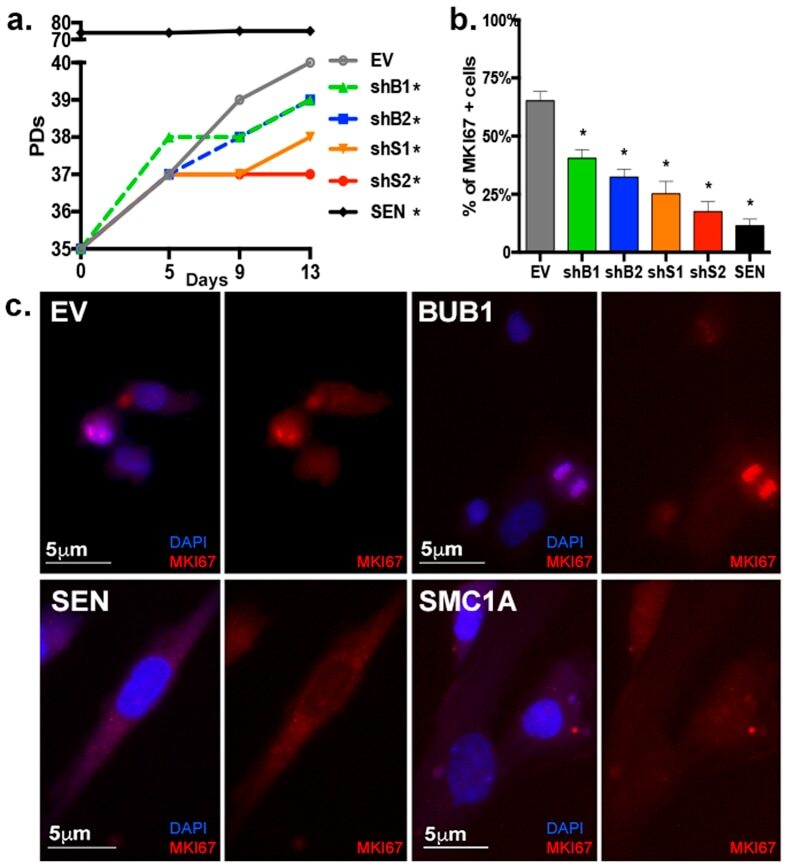
- Submitted by
- Invitrogen Antibodies (provider)
- Main image
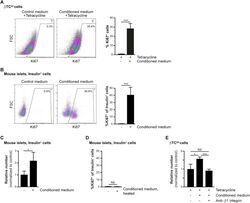
- Experimental details
- Figure 2 Increased beta-cell proliferation upon exposure to pericyte-conditioned medium . A ) Tetracycline-treated betaTC-tet cells were cultured in either control (complete DMEM; 'Control medium') or neonatal pericyte-conditioned ('Conditioned medium'; described in Figure 1 B) medium, both supplemented with tetracycline. After incubation for 96 h, cells were fixed and stained for the proliferative marker Ki67. Left , representative dotplots showing flow-cytometry analysis of Ki67 expression by betaTC-tet cells. Gated are Ki67 + cells; the numbers represent the percentage of gated cells out of the analyzed cell population. Right , Bar diagrams (mean +- SD) represent the percentage of Ki67 + cells. N = 3. ***P < 0.005 (Student's t -test), as compared to the control medium. A representative of three independent experiments is shown. B ) Isolated islets from 3-month-old wild-type mice were cultured in either control (complete DMEM; 'Control medium') or neonatal pericyte-conditioned ('Conditioned medium'; described in Figure 1 B) medium for 24 h. Islets were dispersed to single cells, fixed, and stained for insulin and the proliferative marker Ki67. Left , representative dotplots showing flow-cytometry analysis of Ki67 expression by insulin + cells. Gated are Ki67 + cells; the numbers represent the percentage of gated cells out of the total insulin + cell population. Right , Bar diagrams (mean +- SD) represent the percentage of Ki67 +
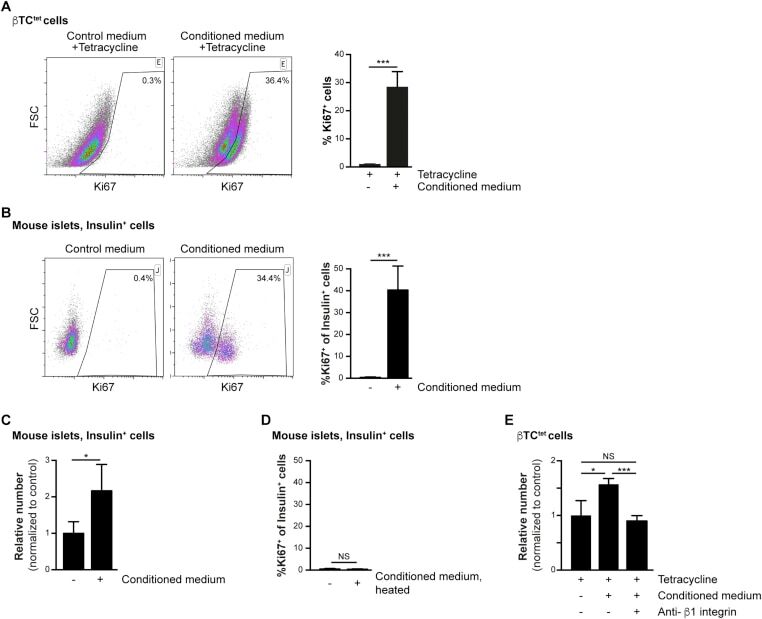
- Submitted by
- Invitrogen Antibodies (provider)
- Main image
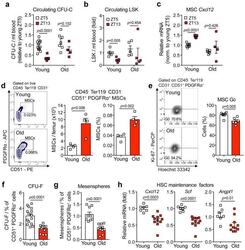
- Experimental details
- Figure 3 Aging expands MSCs and reduces their HSC maintenance activity (a, b) Circadian oscillations of circulating CFU-C (normalized to young at ZT5; n=13 young ZT5, 7 old ZT5, 7 young ZT13 and 4 old ZT13 mice) (a) and lineage - Sca-1 + c-Kit + (LSK) progenitors (normalized to young at ZT5; n=5 mice per group) (b) in peripheral blood of young and old C57BL/6 mice. (c) Quantification of Cxcl12 mRNA levels relative to Actb in sorted MSCs from young and old C57BL/6 mice at ZT5 and ZT13 (normalized to young at ZT5; n=8 young ZT5, 5 old ZT5, 5 young ZT13 and 4 old ZT13 mice). (d) Left, representative FACS plots showing the gating strategy for CD45 - Ter119 - CD31 - CD51 + PDGFRalpha + MSCs in young (top) and old (bottom) C57BL/6 mice. Right, absolute numbers and frequency of MSCs in young and old C57BL/6 mice (n=4 mice per group). (e) Left, representative FACS plots showing the gating strategy for MSCs Ki-67 and Hoechst 33342 staining in young (top) and old (bottom) C57BL/6 mice. Right, quantification of Ki-67 - G0 MSCs in young and old C57BL/6 mice (n=6 mice per group). (f, g) Frequency of CFU-F (n=15 cultures per group) (f) and mesenspheres (n=9 young, 11 old cultures) (g) from sorted MSCs plated at equal numbers and clonal densities under CFU-F or mesensphere culture conditions (n=5 mice per group). (h) Quantification of mRNA levels of Cxcl12, Scf and Angpt1 relative to Gapdh in sorted MSCs (normalized to young; n=7 young, 11 old mice)
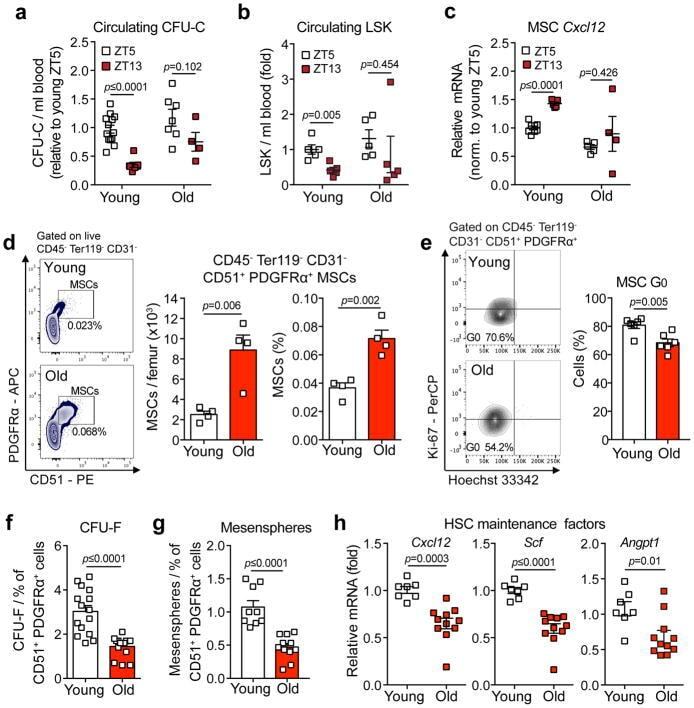
- Submitted by
- Invitrogen Antibodies (provider)
- Main image
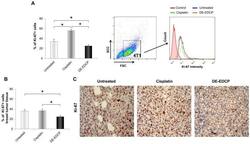
- Experimental details
- Figure 6 DE-EDCP treatment attenuates expression of Ki-67 in murine breast cancer (A) Analysis of Ki-67 expression in 4T1 cells exposed to DE-EDCP or cisplatin (31.25 muM) for 24h using flow cytometry by first gaiting out cell debris and cell clumps in forward/side scatter plot. Data are presented as the mean +- SD, ( * DE-EDCP vs. untreated p=0.020; DE-EDCP vs. cisplatin p=0.002; cisplatin vs. untreated p=0.009). Representative histograms of three independent experiments are shown. (B, C) At 36 th day of the experiment, tumors were harvested from tumor-bearing mice treated with DE-EDCP, cisplatin and vehicle and Ki-67 expression was detected using immunohistochemical method. Representative images and quantitative analysis of the percentage of Ki-67- positive cells are shown. Ki-67-positive cells were counted in five random fields (magnification at x 400), and data were summarized as the mean percentage of positive cells (four tumors per group). Data are presented as mean +- SE. ( * DE-EDCP vs. untreated p=0.006; DE-EDCP vs. cisplatin p=0.004)
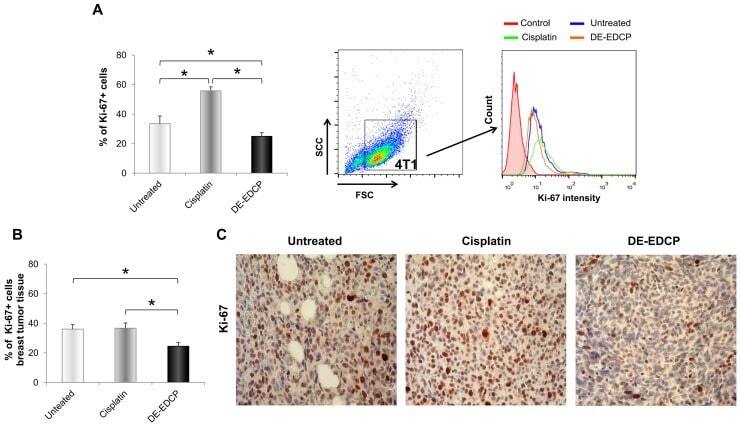
- Submitted by
- Invitrogen Antibodies (provider)
- Main image
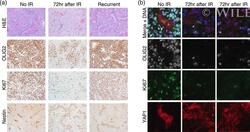
- Experimental details
- 5 FIGURE Immunohistochemistry and immunofluorescence microscopy show loss of the bulk of tumor cells, which express OLIG2, but survival of the Cluster 22-like, YAP1-expressing, proliferative cells of the perivascular niche at 72 hr after IR. (a) Hematoxylin and eosin (H&E) staining and immunohistochemistry with antibodies to OLIG2, Ki67, and Nestin were performed on tumors without IR (no IR) and at 72 hr and at recurrence after IR. Tumor density and the percentage of OLIG2-expressing cells, which make up the bulk of tumor cells, are reduced significantly at 72 hr after IR, but return to baseline at recurrence, that is, levels similar to unirradiated tumor. The percentage of Ki67-expressing cells is also reduced at 72 hr after IR, and those that remain are located in the perivascular niche. Ki67-expressing cells also return to baseline at recurrence. Nestin-expressing cells, which are located within the perivascular niche, remain at similar levels between treatment conditions. (b) Immunofluorescence microscopy using antibodies to OLIG2 (white), Ki67 (green), and YAP1 (red) was performed on tumor without and at 72 hr after IR (two examples shown). The top row (Merge + DNA) shows an overlay of the staining by all three antibodies along with DAPI to indicate DNA (blue). At 72 hr after IR, the rare cells expressing Ki67 also express YAP1, which are both specific to Cluster 22, while the OLIG2 expressing cells, which make up the tumor bulk, are distinct from those expressing either

- Submitted by
- Invitrogen Antibodies (provider)
- Main image
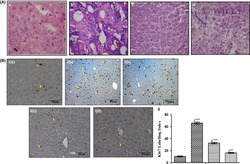
- Experimental details
- Histopathology and immunohistochemical analysis of liver tissue collected from different groups of animals. A, Histopathological observation of liver tissue of (a) Group I, Control; (b) Group II, Induced control; (c) Group III, NDEA+2-AAF+BNUA-3 (15 mg/kg b.w. ); (d) Group IV, NDEA+2AAF+BNUA-3 (30 mg/kg b.w. ); the fibroadenoma of the rat hepatocytes were identified with hematoxylin and eosin stain (400X); B(i). immunohistochemical evaluation of markers of proliferation exhibited expression of Ki67 (brown coloured) in hepatic tissues of rats (scale 50 mum); B(ii). graphical representation of Ki67 labelling index in hepatic tissues of all experimental rats where each value is represented as mean +- SEM; n = 6; Group I, Control; Group II, NDEA+2-AAF; Group III, NDEA+2-AAF + BNUA-3 (15 mg/kg b.w. ); Group IV, NDEA+2AAF+BNUA-3 (30 mg/kg b.w.). Comparisons: a = group II, III, IV with group I; Significant ** P < .01; *** P < .001. Ki67 labelling index is the percentage number of ki67 stained positive cells in animals of each experimental group. NDEA, N-Nitrosodiethylamine; 2-AAF, 2-acetylaminofluorene. , Group I; , Group II; , Group III; , Group IV

- Submitted by
- Invitrogen Antibodies (provider)
- Main image
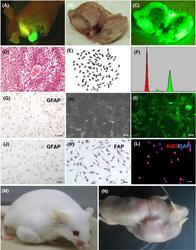
- Experimental details
- 5 Figure SU3/RFP-induced murine fibrosarcoma in tumor microenvironment. A, The subcutaneous xenograft tumor of a tumor-bearing mouse was green under the irradiation of fluorescent flashlight. B, C, Subcutaneous transplanted tumor was dissected and observed under white light and fluorescence, respectively. (D) Transplanted tumor tissue section was stained with H&E. E, Chromosome of green fluorescent cells, which were isolated from subcutaneous transplanted tumor, showed mouse characteristic of telocentric chromosome. F, Red peak represents normal mouse lymphocyte DNA content, DNA content of green peak represents green fluorescent cells, and the DNA content of green fluorescent tumor cells measured by flow cytometry is polyploid. G, Immunohistochemistry revealed that SU3/RFP expressed GFAP; (H, I) Green fluorescent cells were isolated from subcutaneous transplanted tumor, and cultured in vitro, which all expressed green fluorescence. J-L, Immunohistochemical staining revealed that the above green fluorescent cells were positive for FAP but negative for GFAP; immunofluorescence staining showed that the green fluorescent cells were strongly positive for Ki67. M, N, The green fluorescent cells in C57BL/6 mice and BALB/c mice were all tumorigenic, M and N respectively. Scale bar = 50 um

- Submitted by
- Invitrogen Antibodies (provider)
- Main image

- Experimental details
- Characterization of molecularly defined layers during dorsal midbrain development. (a-e) Indirect immunohistochemical analyses on coronal sections of E13.5 wild-type rostro-dorsal midbrain. Midline is to the right. (f) Schematic representation of the molecularly defined layers. (a) Ki67-expressing cells are located at the VZ (arrows), whereas DCX, an early pan-neuronal marker, is observed at the IZ and MZ. (b) Sox9 is expressed at the VZ similar to Ki67 (arrowheads). (c) Nestin-positive fibers are observed in all layers, and subtle somal staining, merged with Ki67, is observed in the VZ (arrowheads). (d) pH3-positive cells are aligned at the ventricular surface (arrowheads), hereafter called the mitotic zone. (e) Brn3a-positive cells are mainly located in the IZ. (f) Layers defined by Ki67, DCX, pH3 and Brn3a are depicted as the VZ, which can be further divided into the mitotic zone and interphase zone, IZ and MZ. Scale bars: 100 um
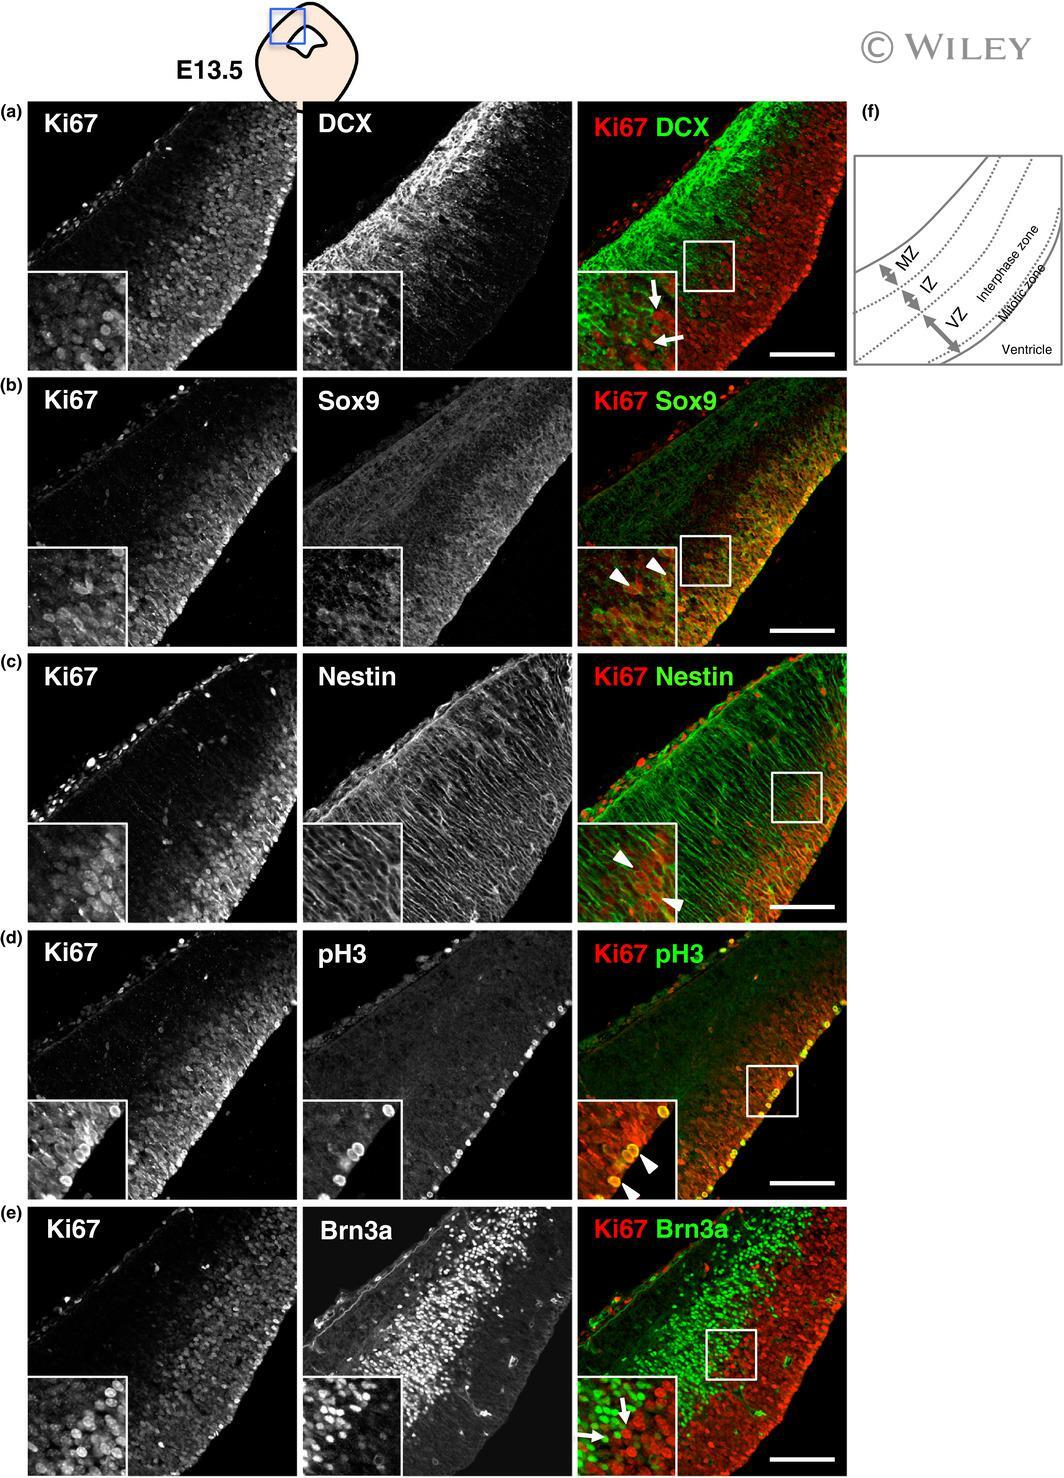
- Submitted by
- Invitrogen Antibodies (provider)
- Main image

- Experimental details
- The distribution of glutamatergic lineage cells defined by Pax6, Tbr2 and Neurog2. (a-d) Indirect immunohistochemical analyses on coronal sections of E13.5 wild-type rostro-dorsal midbrain. Midline is to the right. (a) Pax6 was weakly expressed only in Ki67-strong cells (arrowheads) in the mitotic zone. (b) Tbr2 was detected in the interphase zone and not co-expressed with Ki67 (arrows). (c) Neurog2-positive cells were also detected in the interphase zone, but did not co-express Ki67 (arrows). (d) The expression of Tbr2 was partially overlapped with Neurog2 expression (arrowheads). Scale bars: 100 um
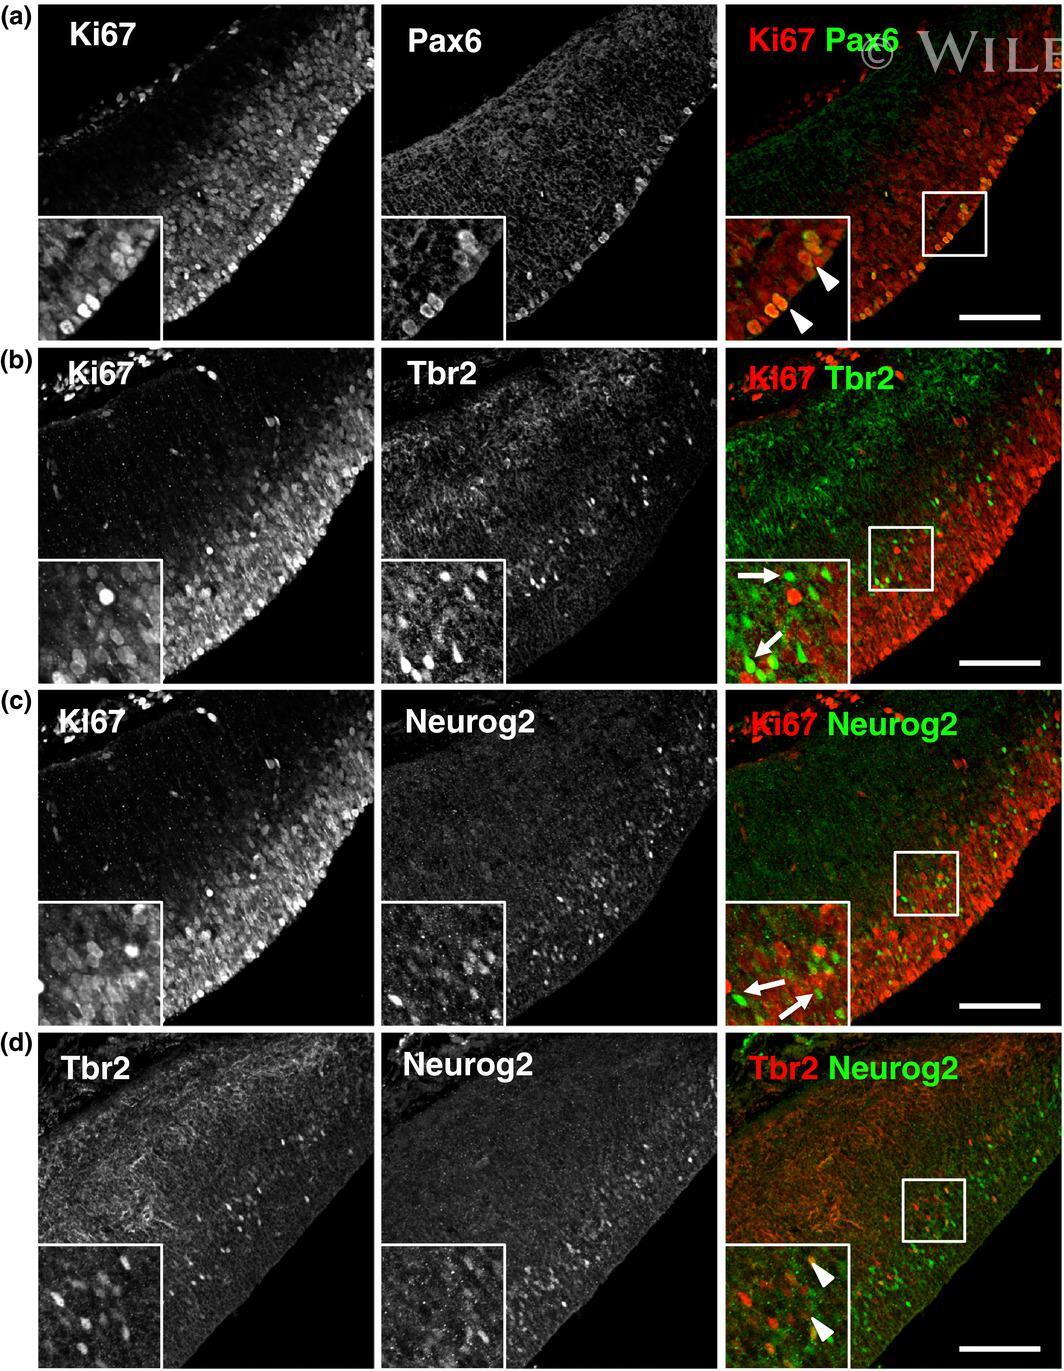
- Submitted by
- Invitrogen Antibodies (provider)
- Main image
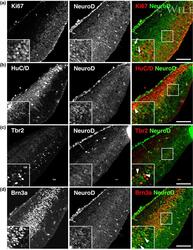
- Experimental details
- The distribution of glutamatergic lineage cells defined by NeuroD and Brn3a. (a-d) Indirect immunohistochemical analyses on coronal sections of E13.5 wild-type rostro-dorsal midbrain. Midline is to the right. (a) NeuroD is expressed weakly in the IZ, and not co-expressed with Ki67 (arrows). (b) HuC/D was detected in the IZ and the MZ, and partially overlapped with NeuroD (arrowhead). (c) Some NeuroD-positive cells express Tbr2 (arrows). (d) Almost all NeuroD-positive cells express Brn3a in the IZ (arrowheads). Scale bars: 100 um
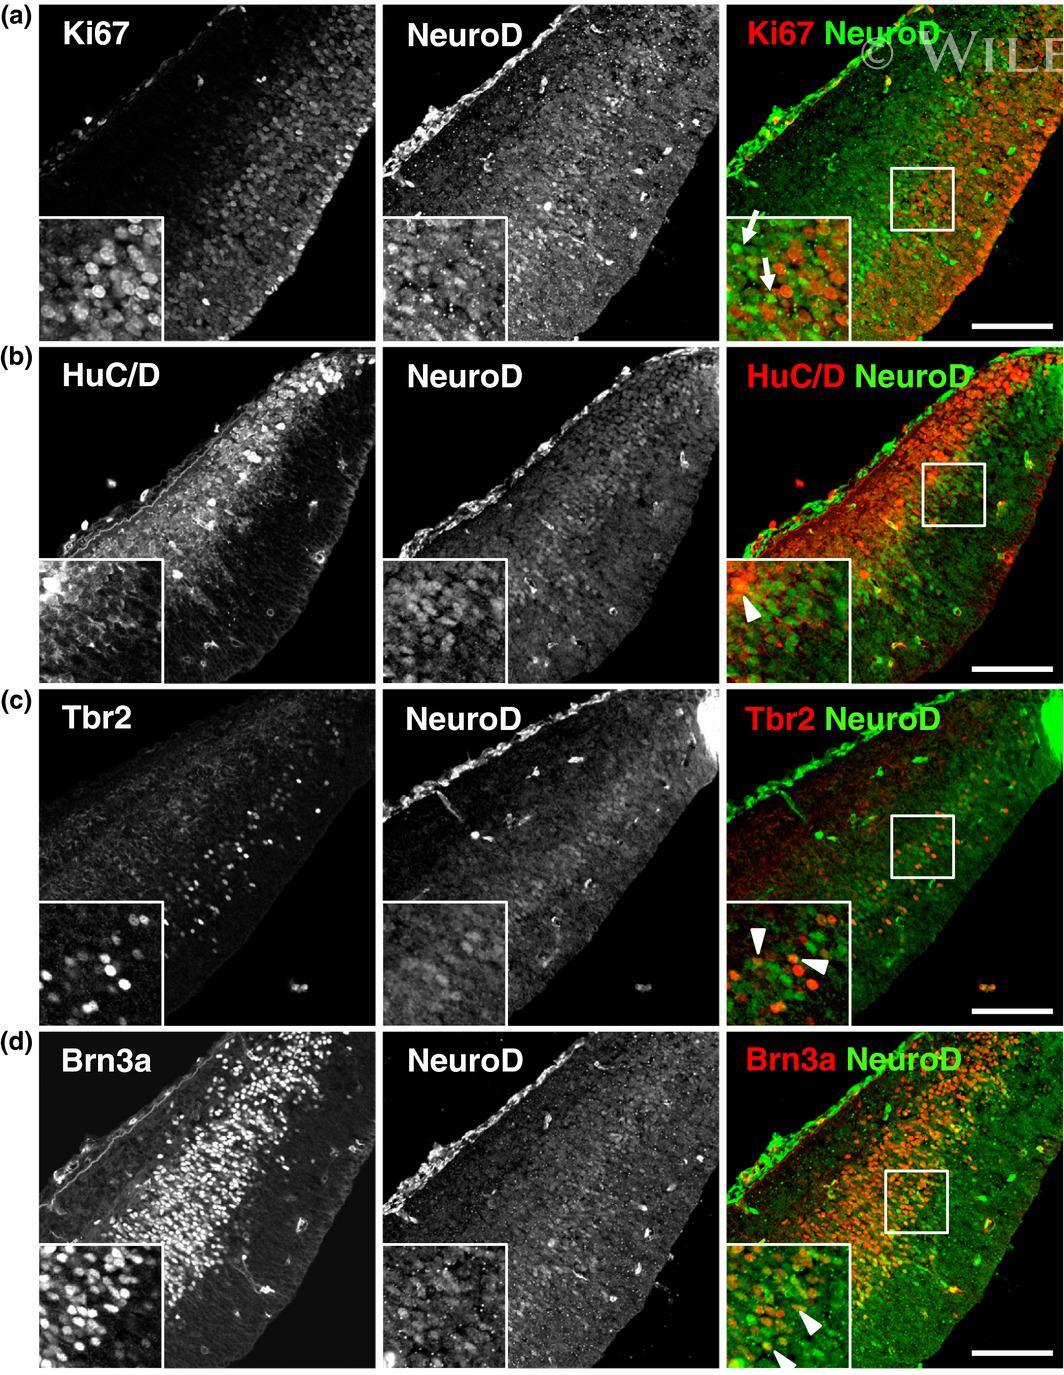
- Submitted by
- Invitrogen Antibodies (provider)
- Main image
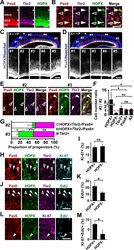
- Experimental details
- Figure 1. HOPX-positive oRG cells are preferentially distributed in prospective gyral regions in the developing ferret cerebral cortex. ( A, B ) Sections of the ferret cerebral cortex at P1 were subjected to immunohistochemistry for Pax6, Tbr2 and HOPX. ( B ) Higher magnification images of the OSVZ are shown. HOPX was expressed in a subset of oRG cells (Pax6-positive and Tbr2-negative). Arrowheads and open arrowheads indicate HOPX-positive and HOPX-negative oRG cells, respectively. Scale bars = 200 um ( A ), 50 mum ( B ). ( C, D ) Sagittal sections of the ferret brain at P1 were subjected to Hoechst 33342 staining plus immunohistochemistry for HOPX ( C ) and Pax6 ( D ). Asterisks indicate prospective sulcal regions. Five regions (red boxes, #1-#5) based on the positions of prospective gyri and sulci in the upper panels are magnified in the lower panels. Black broken lines indicate the border between the VZ and the ISVZ. A, anterior; P, posterior.Scale bars = 1 mm (upper), 200 um (lower). ( E ) Sections of the ferret cerebral cortex at P1 were subjected to immunohistochemistry for Pax6, HOPX and Tbr2. Magnified images of the OSVZ corresponding to regions #2 and #3 are shown. Arrowheads and open arrowheads indicate HOPX-positive and HOPX-negative oRG cells, respectively. Scale bar = 20 mum. ( F ) Ratios of cell numbers between prospective gyral and sulcal regions. Numbers of HOPX-positive oRG cells (HOPX+), HOPX-negative oRG cells (HOPX-), IP cells (Tbr2+), Pax6-positive cells
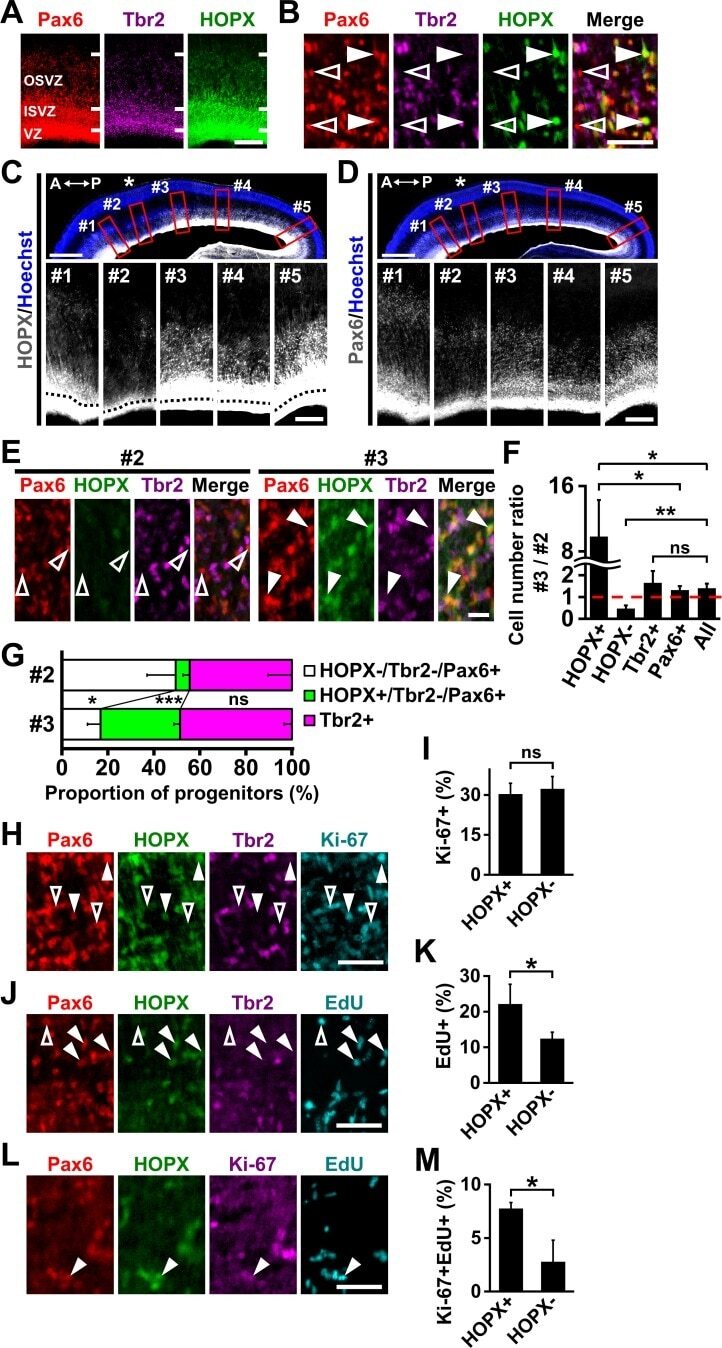
- Submitted by
- Invitrogen Antibodies (provider)
- Main image
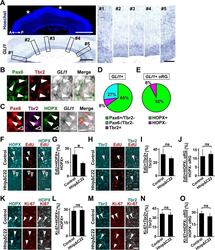
- Experimental details
- Figure 2. Shh signaling is highly activated in HOPX-positive oRG cells and prevents HOPX-positive oRG cells from differentiating. ( A ) Sagittal sections of the ferret brain at P6 were subjected to in situ hybridization for GLI1 and Hoechst 33342 staining. Asterisks indicate areas of prospective sulci. A higher-magnification image of the germinal zone is shown in the lower panel. Five regions (boxes, #1-#5) based on the positions of prospective gyri and sulci in the left panels were magnified and are shown in the right panels. GLI1 was more abundantly expressed in the OSVZ of prospective gyri (#1, 3, 5) than in that of prospective sulci (#2, 4). A, anterior; P, posterior.Scale bars = 2 mm (left, upper), 1 mm (left, lower), 200 mum (right). ( B ) Sections of the ferret cerebral cortex at P1 were subjected to in situ hybridization for GLI1 and immunohistochemistry for Pax6 and Tbr2. High-magnification images of the OSVZ are shown. GLI1 was mainly expressed in oRG cells (Pax6-positive and Tbr2-negative, arrowheads). Scale bar = 20 mum. ( C ) Sections of the ferret cerebral cortex at P1 were subjected to in situ hybridization for GLI1 and immunohistochemistry for Pax6, Tbr2 and HOPX. High-magnification images of the OSVZ are shown. GLI1 -positive oRG cells were mainly HOPX-positive (arrowheads), rather than HOPX-negative (open arrowhead). Scale bar = 20 mum. ( D ) Percentage of GLI1 -positive cells co-expressing Pax6 and/or Tbr2. n = 3 animals. ( E ) Percentage of GLI1 -positive
- Submitted by
- Invitrogen Antibodies (provider)
- Main image
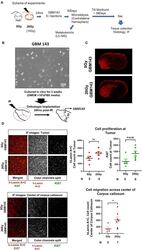
- Experimental details
- Figure 1 (A) Scheme of experiments. (B) Representative image (at 10X, transmitted light microscopy) of GBM143 xenograft line cultured for 3 weeks in vitro in media indicated; cells were collected and orthotopically implanted into cranially irradiated mice 24 hrs post-irradiation (IR). (C) Representative Immunofluorescence (IF) images (at 4X, tiling) for hLamin A+C staining from 0 Gy and 20 Gy-IR mice coronal sections to assess tumor growth and invasion. (D) Top: Representative images (at 20X) show IF staining at tumor; and the dot-plot of single cell count for hLamin A+C and Ki67 staining. Bottom: Representative images (at 20X) show IF staining at center of corpus callosum, and dot-plot of single cell count for hLamin A+C. IH, ipsilateral hemisphere; CH, contralateral hemisphere; IR, irradiation. Statistical significance is represented as * p < 0.05.

- Submitted by
- Invitrogen Antibodies (provider)
- Main image
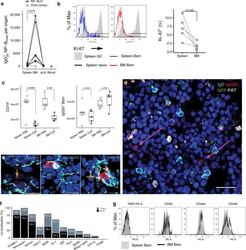
- Experimental details
- Fig. 1 The bone marrow contains a major population of isotype-switched non-proliferating memory B cells. a Quantification of NP-specific IgG2a/b + spleen, peripheral lymph nodes, blood and bone marrow (BM) memory B cells. Female C57BL/6 mice immunized with NP-KLH/LPS SC. Numbers of NP-binding IgG2b + cells in Spleen, BM, blood, and peripheral lymph nodes (pLN) determined by flow-cytometry on d421 or d426 post immunization; pooled from two independent experiments. OVA ctrl: staining controls from mice immunized with the irrelevant antigen ovalbumin (OVA). Gated for IgG2b + CD19 + CD38 + CD138 - GL7 - CD11c - IgM - IgD - PI - small lymphocytes (cf. Supplementary Fig. 5 ). Lines connect samples from one individual, paired one-sided t -test for spleen and BM samples. b Flow-cytometric quantification of Ki-67 expression in IgG2b + Bsm (IgG2b + CD19 + CD38 + CD138 - GL7 - CD11c - IgM - IgD - PI - small lymphocytes) splenic naive (IgM + IgD + IgG2b - CD19 + CD38 + CD138 - GL7 - CD11c - PI - small lymphocytes) and germinal center (GC) (CD19 + CD38 lo GL7 + CD11c - PI - lymphocytes) B cells. Frequencies of Ki-67 + cells within the subset, data in right graph from two independent experiments using pooled cells from 4 to 20 C57BL/6 mice, paired one-sided t -test. c Flow-cytometric quantification of CD19 + B cells and IgG2b + memory B cells in female C57BL/6J mice treated with Cyclophosphamide (CyP) or untreated controls (PBS) after immunization with 3x NP-CGG/IFA. Analysis performed aft

- Submitted by
- Invitrogen Antibodies (provider)
- Main image
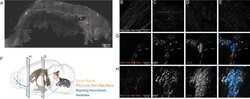
- Experimental details
- Figure 5. P2ry1-cre; Pet1-Flpe neurons project throughout the ventricles and their fibers are in close apposition to proliferating cells in the SVZ and RMS. ( A ) Flat mount of the lateral wall of the lateral ventricle of a P2ry1-cre; Pet1-Flpe; RC-Ai65 animal, where P2ry1-cre; Pet1-Flpe fibers are in grey. Scale bar = 100 um. ( B-E ) High magnification confocal images from regions of the lateral wall represented in red boxes in A. Scale bar ( B ) = 100 um. ( F ) 3D brain schematic showing the P2ry1-cre; Pet1-Flpe cell bodies (dark orange) in the caudal part of the DR (light orange) and fibers (dark orange) projecting through the ventricles (grey) and along the migrating neuroblasts of the rostral migratory stream (RMS, blue). ( G-H ) Coronal confocal images depicting P2ry1-cre; Pet1-Flpe fibers (orange) from P2ry1-cre; Pet1-Flpe; RC-Ai65 animals in the SVZ ( G ) and RMS ( H ). Proliferating cells labeled with Ki67 (grey) and migrating neuroblasts labeled with doublecortin (DCX, blue). Scale bar ( G, H ) = 50 um. Figure 5--figure supplement 1. The caudal dorsal raphe is the major Pet1 neuron source of supra-ependymal fibers. ( A ) Schematic depicting unilateral injection of AAVrg-hSyn-Cre into the lateral ventricle of either Pet1-Flpe; RC-FrePe (EGFP marked cells expressing both Cre and Flpe and mCherry expressing Pet1-Flpe subtractive population) or Pet1-Flpe; RC-Ai65 (TdTomato marked cells expressing both Cre and Flpe), leading to labeling of Pet1 cells in the caudal dorsal
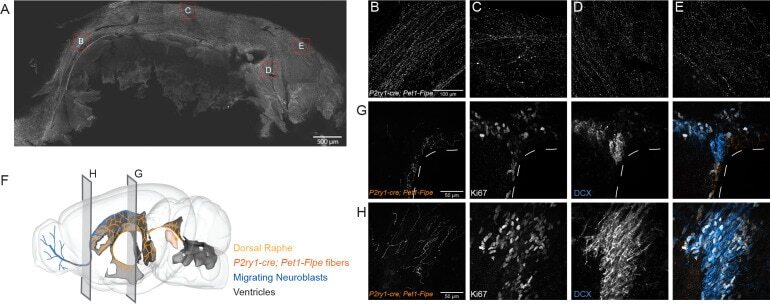
- Submitted by
- Invitrogen Antibodies (provider)
- Main image
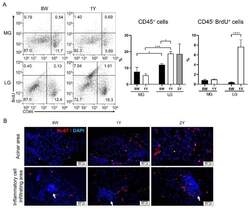
- Experimental details
- Figure A1 ( A ) CD45/BrdU gating by flow cytometry. The percentage of CD45 + cells in the LGs was significantly higher in 1Y-old mice than in 8W-old mice ( p = 0.044; one-way ANOVA followed by Tukey's post hoc test; n = 9, 5, and 3 for 8W-, 1Y-, and 2Y-old mice, respectively). The percentage of CD45 + cells in the LGs was also significantly higher than that in the MGs, irrespective of age ( p = 0.019 in 8W-old mice and 0.0005 in 1Y-old mice, respectively; paired t -test; n = 5 per group). The percentage of CD45 - BrdU + cells in the MGs was not different between 8W- and 1Y-old mice ( p = 0.483); however, the percentage of CD45 - BrdU + cells in the LGs was significantly higher in 1Y-old mice than in 8W-old mice ( p < 0.0001; independent t -test; n = 5 per group). ( B ) Representative images of the LG sections by Ki-67 immunofluorescence staining (400x). Arrows indicate inflammatory foci. The expression of Ki67 + cells in both the acinar and inflammatory cell infiltrating areas tends to increase with aging. * p < 0.05, *** p < 0.001, and **** p < 0.0001. Data are presented as means +- standard error.
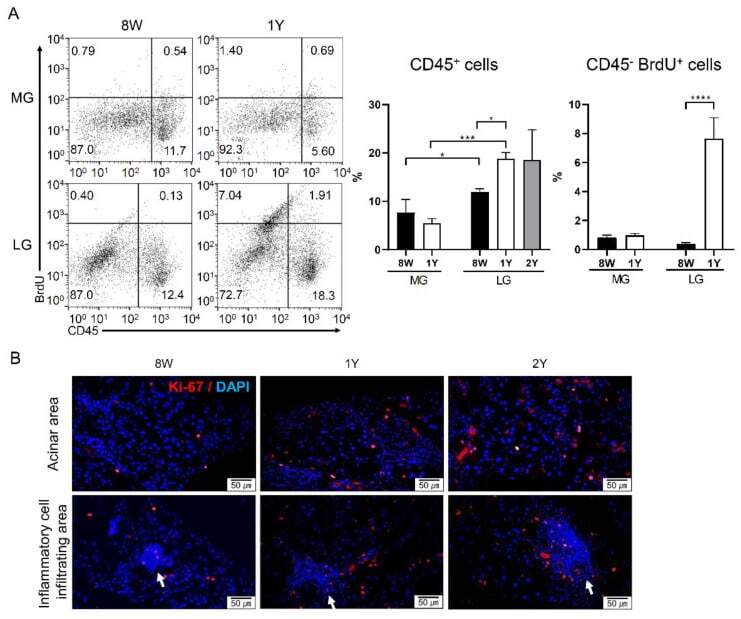
- Submitted by
- Invitrogen Antibodies (provider)
- Main image
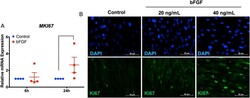
- Experimental details
- Figure 4 bFGF promoted Ki67 expression. SHEDs were treated with bFGF (20 ng/mL) and the mRNA expression of MKI67 was examined using real-time polymerase chain reaction at 6 and 24 h after treatment (A). Ki67 protein expression was evaluated using immunofluorescence staining at 24 h after treatment (B). Bars indicate a significant difference. Figure 4
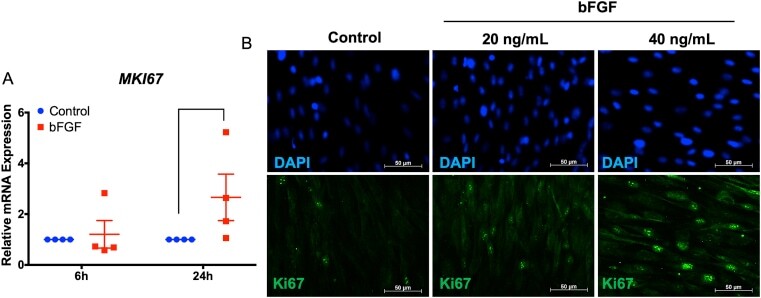
- Submitted by
- Invitrogen Antibodies (provider)
- Main image
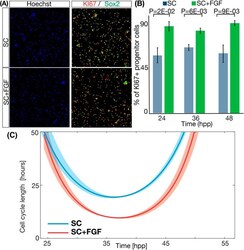
- Experimental details
- Fig. 4. The growth fraction and the length of the cell cycle change in response to FGF2. (A) Example of cells stained for nuclei (blue), Ki67 (red) and Sox2 (green) at 36 hpp. (B) Quantification of the percentage of progenitor cells that are actively cycling in both conditions and at three different time points. Columns represent the mean between independent repeats. Error bars represent s.e.m. (C) Cell cycle prediction by the branching process formalism for the two different FGF2 concentrations tested: SC (red) and SC+FGF (blue). Areas around the curves represent the 50% confidence interval.
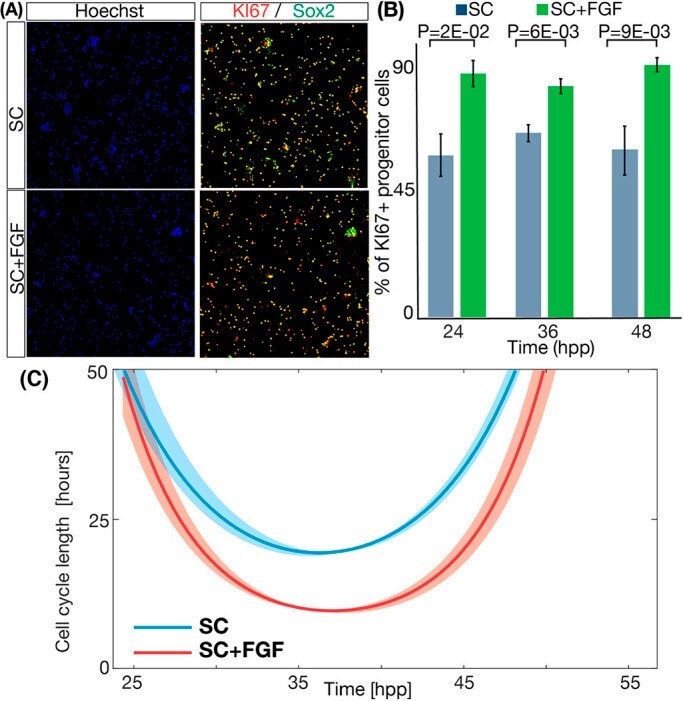
- Submitted by
- Invitrogen Antibodies (provider)
- Main image
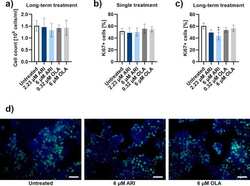
- Experimental details
- Fig 3 Proliferation. a) Cell count of long-term treated Fao cells by microcapillary flow cytometry with adjusted seeding to result in equal cell numbers ( n = 5). Proliferating Ki67+ cells (% of Ki67-positive cells of all cells in the sample) in b) single treated ( n = 6) and c) long-term treated ( n = 3) Fao cells, detected by microcapillary flow cytometry. Flow cytometric dot plots are in the S3 Fig . d) Fluorescent micrographs of Fao cells after long-term treatments were stained with Ki67 antibody (green signal) and Hoescht (blue signal): untreated control (left), 6 muM ARI (middle) and 6 muM OLA (right). Scale bars: 50 mum. Data are presented as mean +- SD and analysed with one-way ANOVA followed by Dunnett's test. **P
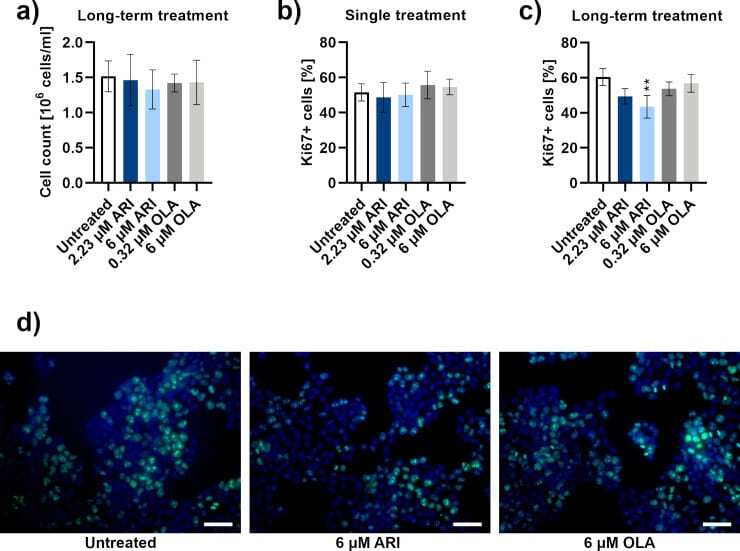
- Submitted by
- Invitrogen Antibodies (provider)
- Main image
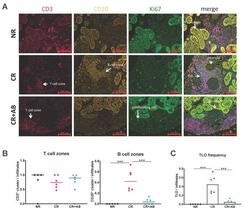
- Experimental details
- Figure 2 Effect of anti-BAFF treatment on intra-renal T and B cell zones and TLO formation. ( A ) shows representative allograft sections stained for CD3 (T cells, pink), CD20 (B cells, yellow), and Ki67 (proliferating cells, green) with distinct T and B cell zones. ( B ) shows the frequency of T cell (CD3 + ) and B cell (CD20 + ) zones, which were defined as dense clusters of predominantly one cell type. ( C ) shows the frequency of TLOs, which were defined as dense intra-renal infiltrates containing a T and a B cell zone. NR, no rejection (black); CR, chronic rejection (pink); CR + AB, chronic rejection and anti-BAFF antibody (green). Data is shown as group means and individual data points per rat. Statistical significance is shown as *** p < 0.001.
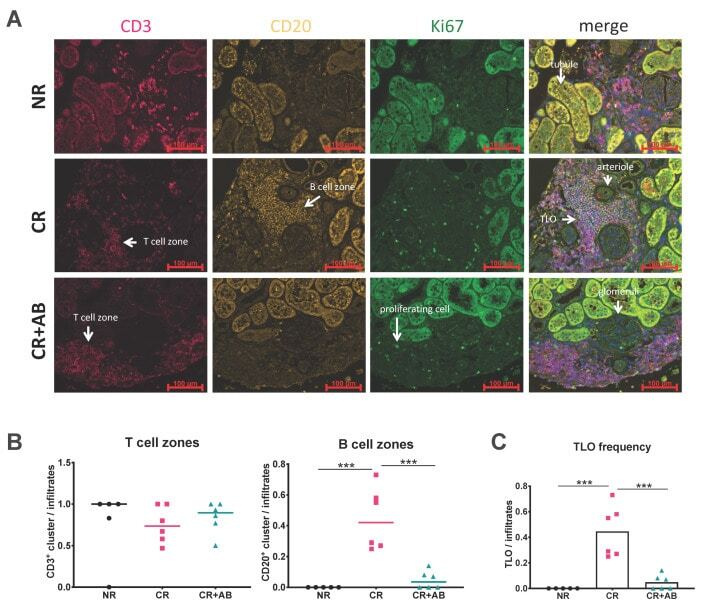
- Submitted by
- Invitrogen Antibodies (provider)
- Main image
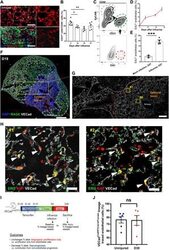
- Experimental details
- Fig. 1 Injury and proliferation of ECs after influenza infection in vivo. ( A ) Representative immunofluorescence images of capillaries (red) and leukocytes (green) in lung tissue with or without influenza injury. Scale bars, 50 mum. D10, day 10. ( B ) Quantification of ECs (CD31 + ) in the nonleukocyte fraction (exclusion of CD45 + cells) via flow cytometric analysis. ( C ) Representative gating scheme for identification of proliferating EC analysis via EdU incorporation at day 19 after influenza. ( D ) Intracellular flow cytometry quantification of proliferative ECs (CD45 - /EpCAM - /CD31 + /EdU + ) as a percentage of total lung ECs on days 0, 7, 19, and 27 after influenza infection. n = 3 to 4 per group. ( E ) Cumulative endothelial proliferation on day 27 after infection and mock-infected controls. ( F ) Typical image of lungs at day 19 after influenza. Red dashes represent the lung epithelial lesion area (RAGE - ), and the white dashes area represents the VECad low-expression area. Scale bar, 1 mm. ( G ) The enlarged area from (F) shows the vascular endothelium across normal and injured epithelial areas (white, VECad). Scale bar, 200 mum. ( H ) Representative immunostaining of proliferative ECs from peripheral (#1) and central (#2) parts of epithelial lesion on day 19. Arrows indicate proliferative ECs (colocalization of ERG and Ki67). Scale bars, 25 mum. ( I ) Methodology to determine whether regenerated ECs are derived from preexisting endothelium or transdifferentiati

- Submitted by
- Invitrogen Antibodies (provider)
- Main image
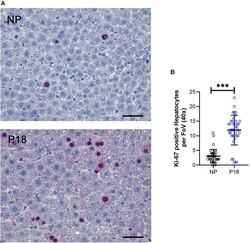
- Experimental details
- FIGURE 4 (A) Representative Ki-67-immunostained liver sections from non-pregnant (NP) and pregnant (P18) rats. Scale bars correspond to 50 mum. Ki-67-positive hepatocytes were counted at 40x optical field, five high-power images per animal were analyzed. (B) Scatter plots of numbers of Ki-67-positive hepatocytes per field of view (FoV) in pregnant (P18) and non-pregnant (NP) groups with mean and standard deviation. *** p < 0.001.
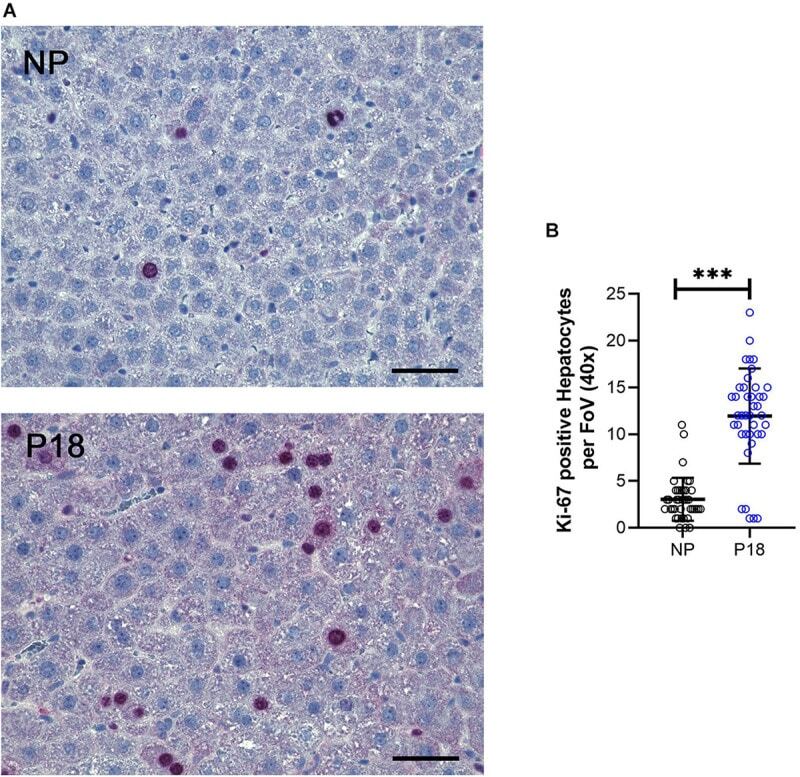
- Submitted by
- Invitrogen Antibodies (provider)
- Main image
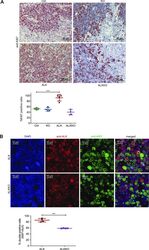
- Experimental details
- Figure 4. Deletion of Dnmt1 results in reduced proliferation of ALK+ cells. (A) Cell proliferation analysis by immunohistochemistry staining of Ctrl, KO, ALKKO thymi and ALK tumor tissues using Ki67 antibody. The graph shows quantification of Ki67 positive cells using Definiens Tissue Studio 4.2 software. Non-proliferative areas in the thymus were excluded from analysis. Data are shown as mean +- SD, *** P < 0.001, pair-wise comparison to control using unpaired t test, n = 4. (B) Double immunofluorescence staining of ALK tumors and ALKKO thymi. Tissues were stained with antibodies against ALK (red) and Ki67 (green) and counterstained with DAPI (blue). Pictures were acquired with identical pixel density, image resolution, and exposure time. The graph shows quantification of immunofluorescence staining by counting Ki67/ALK double-positive relative to total number of cells (DAPI positive) of two equally sized areas per tumor/thymus from four biological replicates, respectively. Cell counting was performed by two individuals and slides were blinded for counting. Data are shown as mean +- SD, *** P < 0.001, using unpaired t test.
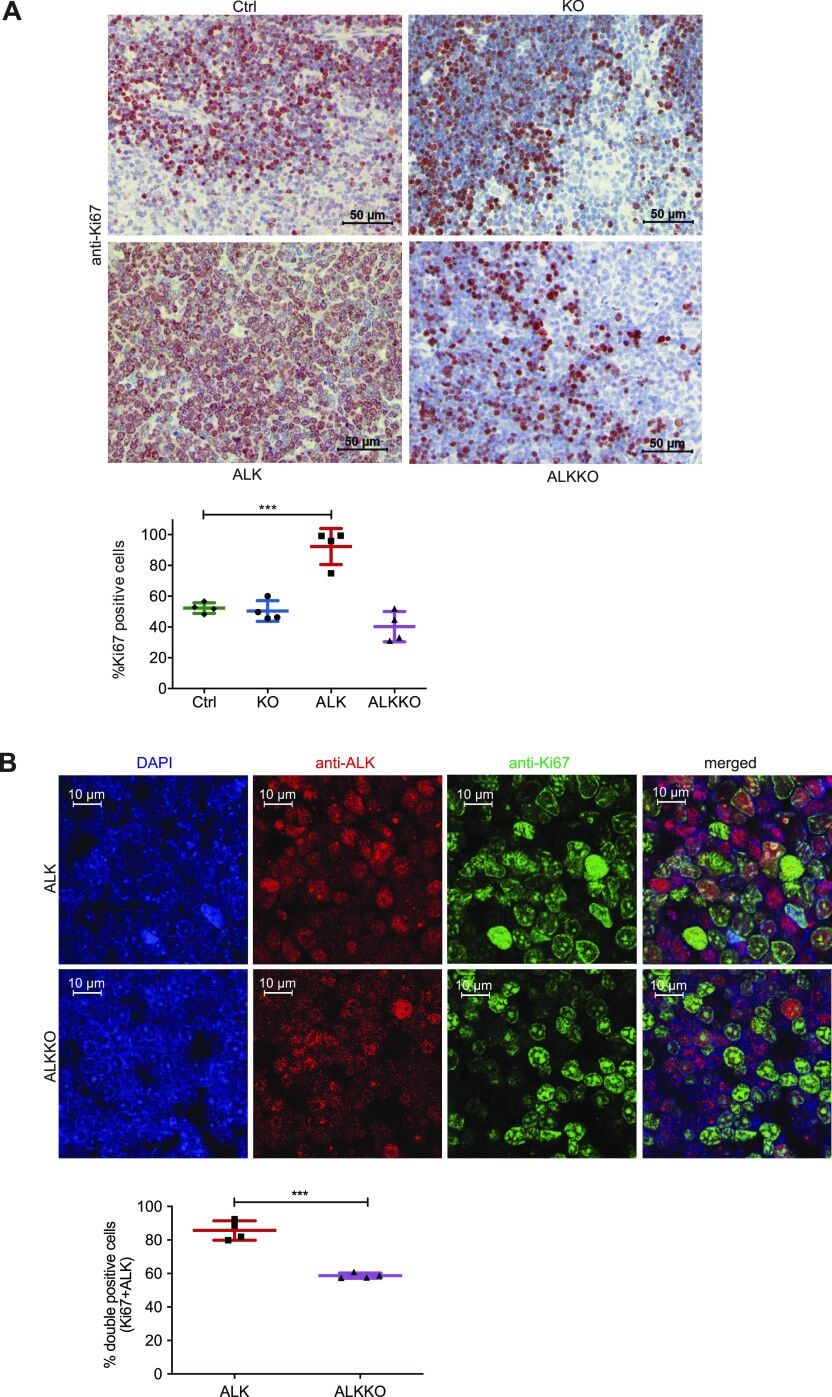
- Submitted by
- Invitrogen Antibodies (provider)
- Main image
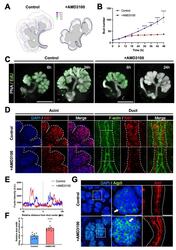
- Experimental details
- Figure 3 AMD3100-induced precocious differentiation of epithelial cells. ( A , B ) Representative contour tracing ( A ) and bud number changes ( B ) of control and AMD3100-treated eSMGs during 48 h at 6-h intervals ( n = 3). ( C ) EdU staining results at 6 and 24 h after AMD3100 treatment. EdU in green and PNA in gray ( n = 4, scale bar: 500 um). ( D ) Immunostaining results of Ki67 (red) and F-actin (green) in acini and duct of eSMGs 24 h after AMD3100 treatment. Morphologies of acinar buds and duct cells are outlined with white dotted lines. Scale bar: 50 um. ( E ) Duct widths of control and AMD3100-treated eSMGs were visualized via F-actin-based intensity profiles of horizontal sectioning of ducts 24 h after the treatment. ( F ) Duct widths of control and AMD3100-treated eSMGs were quantified 24 h after the treatment ( n = 9). ( G ) Immunostaining results of AQP5 (green) and KRT7 (red). Magnified regions of acinar buds are marked with white dotted squares. The white arrows (middle panels) indicate areas with the highest AQP5 expression ( n = 4, scale bar: left, 100 um; middle and right, 50 um). Data are presented as the mean +- SEM; * p < 0.05, **** p < 0.0001; t -test.
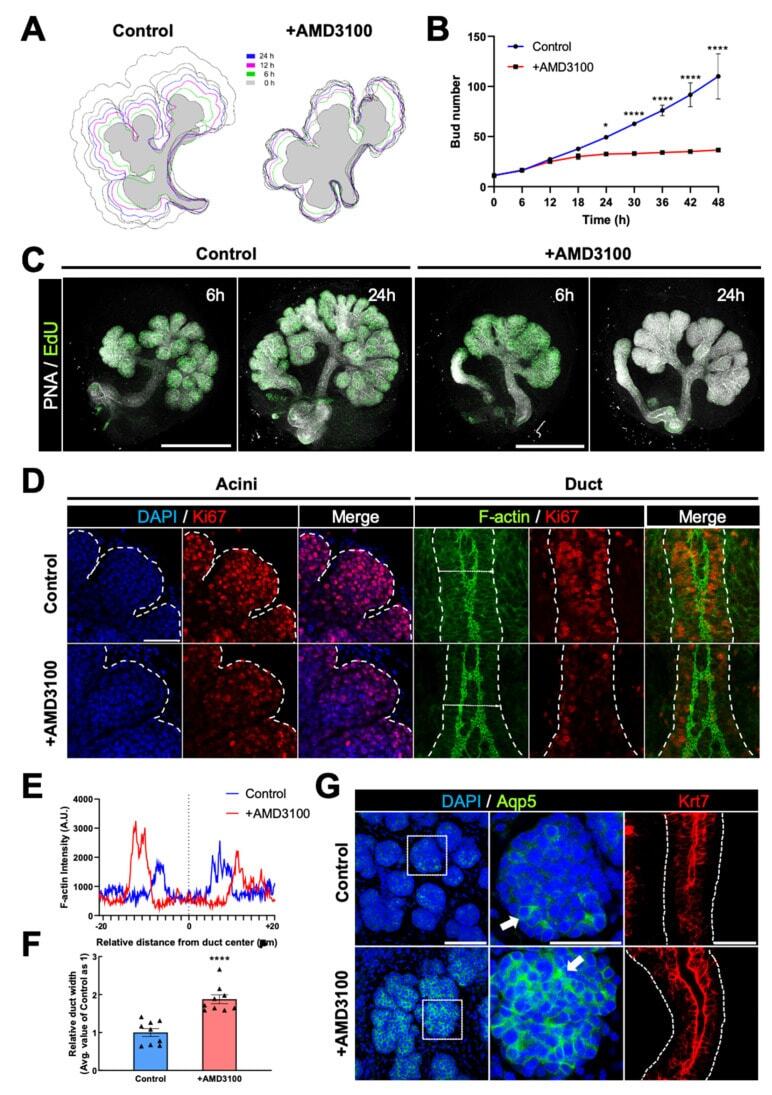
- Submitted by
- Invitrogen Antibodies (provider)
- Main image

- Experimental details
- Figure 7. Met-STAT3 signaling is attenuated in Cdcp1 -knockout mice. (A, B) Cdcp1 wild-type (+/+) and homozygous knockout (-/-) mice at 8 wk of age were subjected to UNX or sham operation. Compensatory growth of remaining kidney was analyzed at the indicated time points after operation and increases in remaining kidney/body weight ratios were assessed. (C, D, E, F) The remaining kidney after UNX was subjected to microscopic immunofluorescence analysis with specific antibodies against Met pY1234/1235 (C), STAT3 pY705 (D), CDCP1 pY734 (E), and Ki67 (F) and Alexa Fluor 594-conjugated secondary antibody (magenta). Proximal tubules were visualized by staining with FITC-LTL (green). Representative images were shown. Scale bars: 50 mum. (G) Ki67-positive proximal tubules (%) were estimated by calculating the ratio of Ki67-stained tubules to the total number of tubules (n > 100). (H) Schematic model of hepatocyte growth factor-induced adaptive renal regeneration. CDCP1-Src regulates the Met-STAT3 signaling leading to compensatory renal growth through induction of ECM rearrangement and cell growth/proliferation. Data information: In (A, G), the mean ratios +- SD were obtained from at least six (A) or three mice (G) per group. * P < 0.05; ** P < 0.01; **** P < 0.0001; NS, not significantly different; two-way ANOVA was calculated compared with sham-operated control or between wild-type and knockout mice.
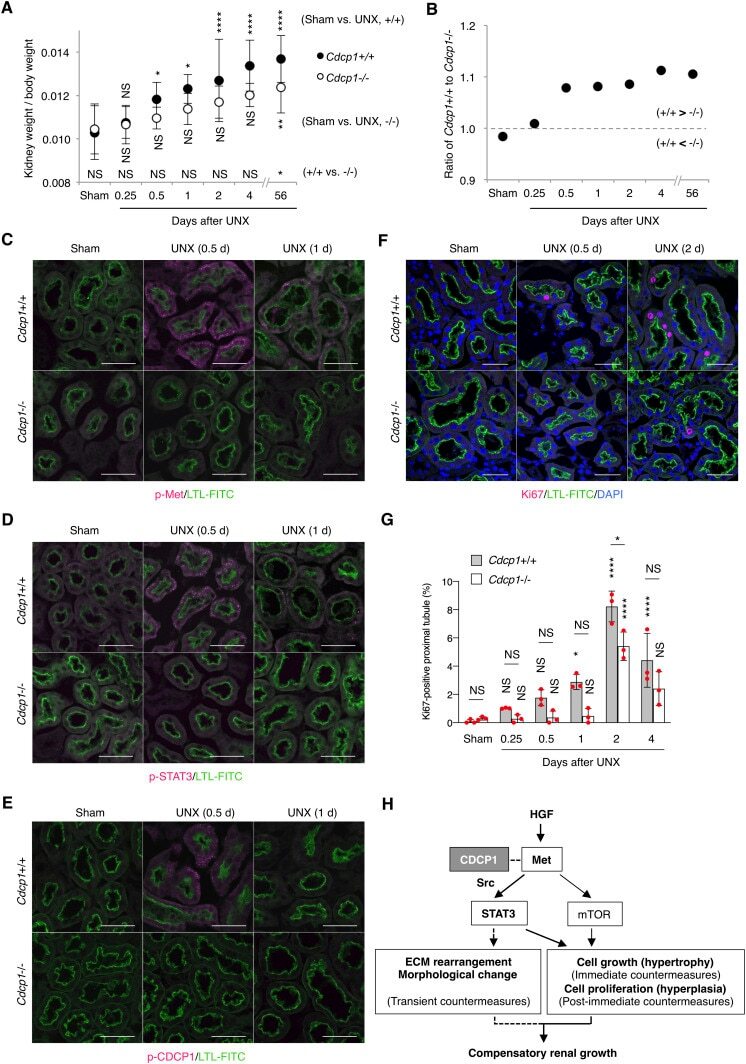
- Submitted by
- Invitrogen Antibodies (provider)
- Main image
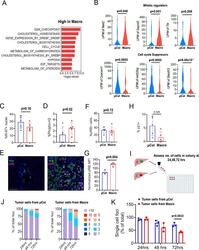
- Experimental details
- Figure 3. Microcolonies exhibit a hypo-proliferative phenotype. ( A ) Functional annotation of genes downregulated in microcolonies/higher in macrometastases. GSEA msGDMIB for Hallmark and canonical pathways (p

- Submitted by
- Invitrogen Antibodies (provider)
- Main image
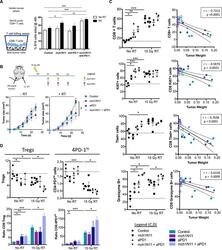
- Experimental details
- Figure 6. Targeting PS in Combination with Radiation Therapy and Anti-PD-1 Promotes CD8+ T Cell Activation in the Tumor (A) C57BL/6 mice were injected with B16F10 cells and treated according to the experiment schema outlined in Figure 5 . 10 days after RT, 10 6 CD8+ T cells purified from spleens of treated animals were co-cultured with 10 4 B16 tumor cells as targets for 48 h in 24-well plates for a T cell killing assay as previously described (). Shown are the average percentage +- SEM of B16 cells killed from 5 mice/group. (B) C57BL/6 mice were injected with B16F10 cells on the right hindlimb on day 0 and left flank on day 5 and treated with RT on day 10, as outlined in the schema and described in STAR Methods . Shown are average tumor size (in square millimeters) +- SEM of abscopal tumors only (10 mice/group). Statistics were calculated at day 25 post-tumor implantation. (C and D) C57BL/6 mice were injected with B16F10 cells and treated according to the experiment schema outlined in Figure 5 . 10 days after the initial treatment, tumors were isolated from each treatment group, weighed, and analyzed by flow cytometry. (C) CD8+ T cell infiltration and activation. Left: frequencies of CD8+ T cells in tumors and their activation markers. Right: correlation between frequencies and tumor weight (in grams); closed circles represent no RT, and open circles represent RT groups. (D) Frequencies of CD4+ Foxp3+ Tregs and CD4+ Foxp3- PD-1 hi T cells (CD4+ PD-1 hi or 4PD-1 hi ) infiltra
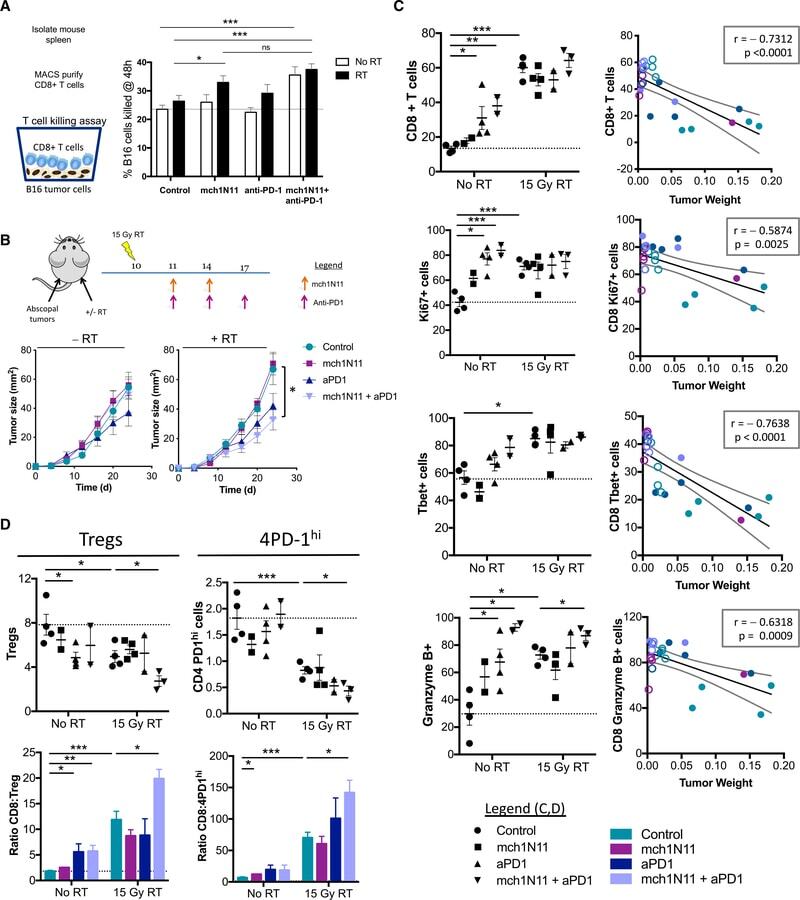
- Submitted by
- Invitrogen Antibodies (provider)
- Main image
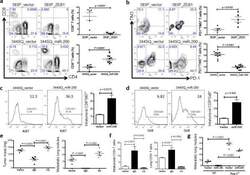
- Experimental details
- Figure 4 The miR-200/ZEB1 axis controls tumor metastasis through regulating CD8 + TILs ( a , b ) FACS analysis of ( a ) CD8 + TIL frequency; ( b ) PD1 and TIM3 marker expression on CD8 + T cells from 393P_vector and 393P_ZEB1 (n = 5), as well as 344SQ_vector and 344SQ_miR-200 (n = 10) primary tumors. Analysis was done 2 weeks post-cancer cell injection. ( c , d ) ( c ) Intratumoral Ki67 + CD8 + T cells; ( d ) granzyme B (GzB) + CD8 + T cells in 344SQ_vector or 344SQ_miR-200 primary tumors 6 weeks post-subcutaneous injection of cancer cells into 129/Sv mice. Representative Ki67 or GzB staining in an individual tumor sample is shown on the left, and mean Ki67 + or GzB + populations of gated CD8 + T cells in total T cells are shown on the right (n = 5). ( e ) CD8 + T cell depletion results in tumor growth and metastasis in mice (n = 5) that received subcutaneous tumor cell injections. No treatment (344SQ_vector (Vector)), IgG (344SQ_miR-200 + IgG control), or Ab (344SQ_miR-200 + anti-CD8 Ab). The analysis was done 6 weeks post-injection. ( f ) Relative abundance of CD8 + T cells in the tumor (left) or lung (right) from 129/Sv mice (n =5) with syngeneic control 344SQ tumors (Vector), 344SQ_miR-200 tumors with control IgG treatment (IgG) or anti-CD8 antibody treatment (Ab). ( g ) Lung metastases of 344SQ_vector (Vector) and 344SQ_miR-200 (miR-200) tumors in wild-type (WT) or 129/Sv Rag2 -/- ( Rag2 -/- ) mice (n = 5). The analysis was done 6 weeks post-tumor cell subcutaneous injec
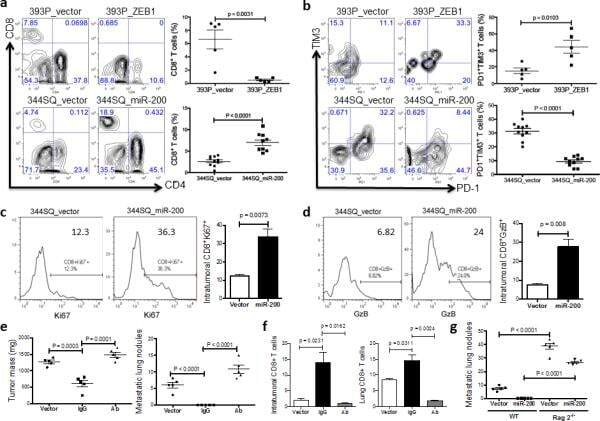
- Submitted by
- Invitrogen Antibodies (provider)
- Main image

- Experimental details
- Figure 3 Cxcl12 from distinct peri-vascular niche cells contributes differentially to HSC functions (a-c) Analyses of LepR-cre/ Cxcl12 fl/- mice. (a) Absolute numbers of HSCs in BM. n=6 mice for each group. (b) FACS analyses of cell cycle of HSCs with Ki-67 and Hoechst 33342 staining. n=5 mice per group. (c) HSC localization relative to arterioles. Error bars: n=3 mice. The p value has been calculated using n=129 HSCs for cre (-), 160 HSCs for cre (+), pooled from 3 mice per group. P =0.9981. (d-k) Analyses of NG2-cre / Cxcl12 flox/-. mice (d) Cxcl12 mRNA expression relative to beta-actin in CD45 - TER119 - CD31 - Nes-GFP + cells from NG2-cre(-) Cxcl12 f/- and NG2-cre(+) Cxcl12 f/- mice. n=4 mice for cre (-), n=3 mice for cre (+), from two independent experiments. (e,f) Bone marrow cellularity (e) and absolute numbers of phenotypic CD150 + CD48 - Lineage - Sca-1 + c-kit + (LSK) HSCs (f) per one femur. n=10 mice. (g) Percentages of donor-derived cells after competitive reconstitution. n=5 mice per group. (h) Quantification of cell cycle of HSCs with Ki-67 and Hoechst 33342 staining. n=5 mice for cre (-), n=7 mice for cre (+). (i) Representative images of whole-mount immunofluorescent staining of the sternal bone marrow from 3 mice. Arrows indicate CD150 + CD48 - CD41 - Lineage - HSCs. Dashed lines depict the border between bone and bone marrow. Scale bars, 100 muH. (j) HSC localization relative to arterioles. Error bars: n=3 mice for cre (-), n=4 mice for cre (+). The p value
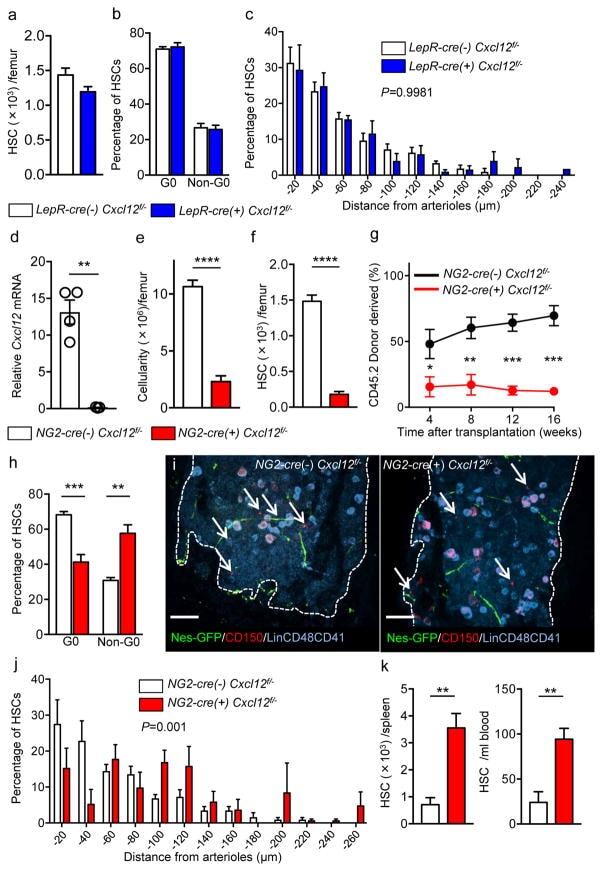
- Submitted by
- Invitrogen Antibodies (provider)
- Main image
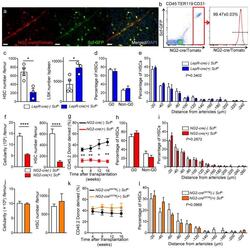
- Experimental details
- Figure 5 NG2-cre, but not NG2-cre ERTM , targeted cells are the source of Scf in the bone marrow (a) Whole-mount sternum from NG2-cre/ iTdTomato/ Scf-GFP mice, anti-VE-cadherin. Representative images from 3 mice. Scale bars, 20 mum. (b) Representative FACS plot showing percentage of NG2-cre/ iTdTomato + cells within CD45 - TER119 - CD31 - Scf-GFP + cells. n=3 mice. (c-e) Analyses of LepR-cre/ Scf fl/- mice. (c) Numbers of HSCs (left) in BM and LSK cells in spleen (right). n=4 mice for cre (-), n=3 mice for cre (+). (d) FACS analyses of HSC (CD150 + CD48 - LSK) cell cycle with Ki-67 and Hoechst 33342 staining. n=5 mice for cre (-), n=6 mice for cre (+). (e) HSC localization relative to arterioles. Error bars: n=3 mice. P value has been calculated using n=272 HSCs for cre (-), 293 HSCs for cre (+) pooled from 3 mice per group. P =0.3402. (f-i) Analyses of NG2-cre/ Scf fl/- mice. (f) Numbers of total BM cells (left) and CD150 + CD48 - LSK HSCs (right) in BM. n=5 mice for cre (-), n=7 mice for cre (+). (g) Percentages of donor-derived cells after competitive reconstitution. n=5 mice for cre (-), n=7 mice for cre (+). (h) FACS analyses of HSC cell cycle with Ki-67 and Hoechst 33342 staining. n=6 mice for cre (-), n=7 mice for cre (+). (i) HSC localization relative to arterioles. Error bars: n=3 mice. P value has been calculated using n=224 HSCs for cre (-), 274 HSCs for cre (+) pooled from 3 mice per group. P =0.2872. (j-l) Analyses of NG2-cre ERTM / Scf fl/- mice. (j) Absolute nu
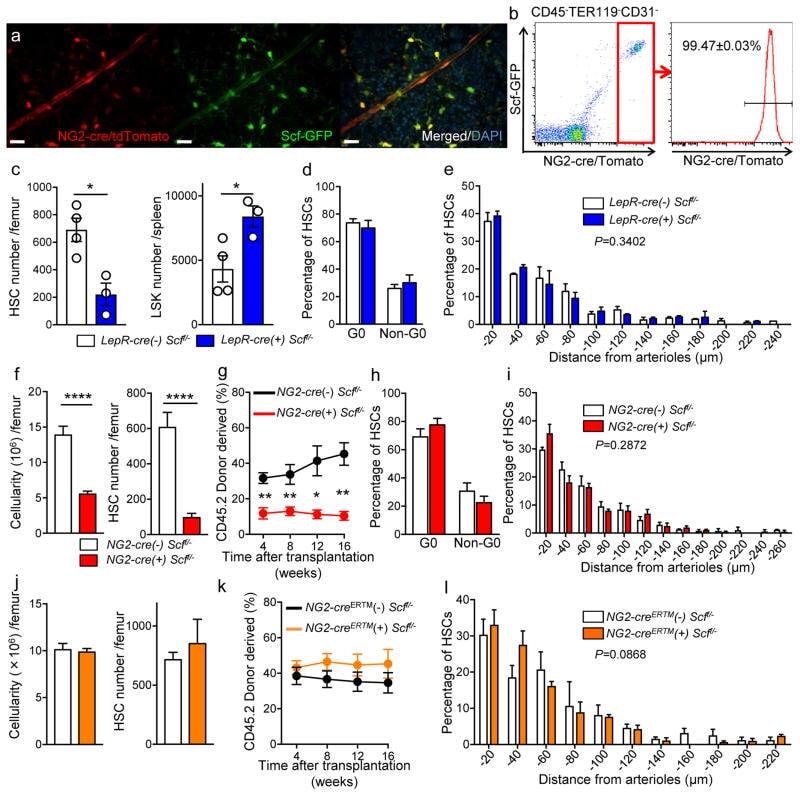
- Submitted by
- Invitrogen Antibodies (provider)
- Main image
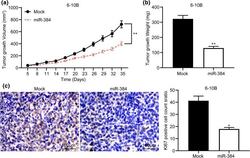
- Experimental details
- Fig. 6 Overexpression of miR-384 inhibits growth of xenograft tumor in vivo. 6-10B cells with stable miR-384 mimic or mimic control transfection were implanted in nude mice. a change of tumor volume after cell implantation in mice; b tumor weight in mice on the 35th day after animal euthanasia; c Ki-67 expression in mouse tumors detected by IHC staining; Repetition = 3. Data are exhibited as mean +- SD; n = 5 in each group; in panel a , data were analyzed using two-way ANOVA and Tukey''s multiple comparison test, while data in panels b and c were analyzed by the unpaired t test; * p < 0.05; ** p < 0.01 vs. Mock group
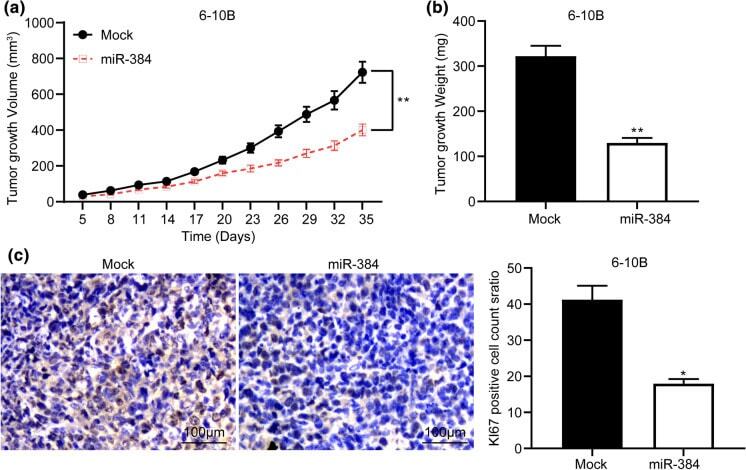
- Submitted by
- Invitrogen Antibodies (provider)
- Main image
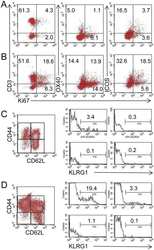
- Experimental details
- Figure 5 MLN cells from Roquin san/san mice are proliferative and have more SLECs. Based on Ki67 staining, (panel B ) a greater proportion of OX40 + cells and ICOS + MLN cells were proliferating T cells compared to MLN cells from (panel A ) normal mice. Representative staining from 1 normal and 2 Roquin san/san mice. Similarly, there was a greater proportion of CD44 hi CD62L lo KLRG1 + SLECs present in MLN cells of (panel D ) Roquin san/san mice compared to (panel C ) normal mice. Representative data from 3 normal and 3 Roquin san/san mice.
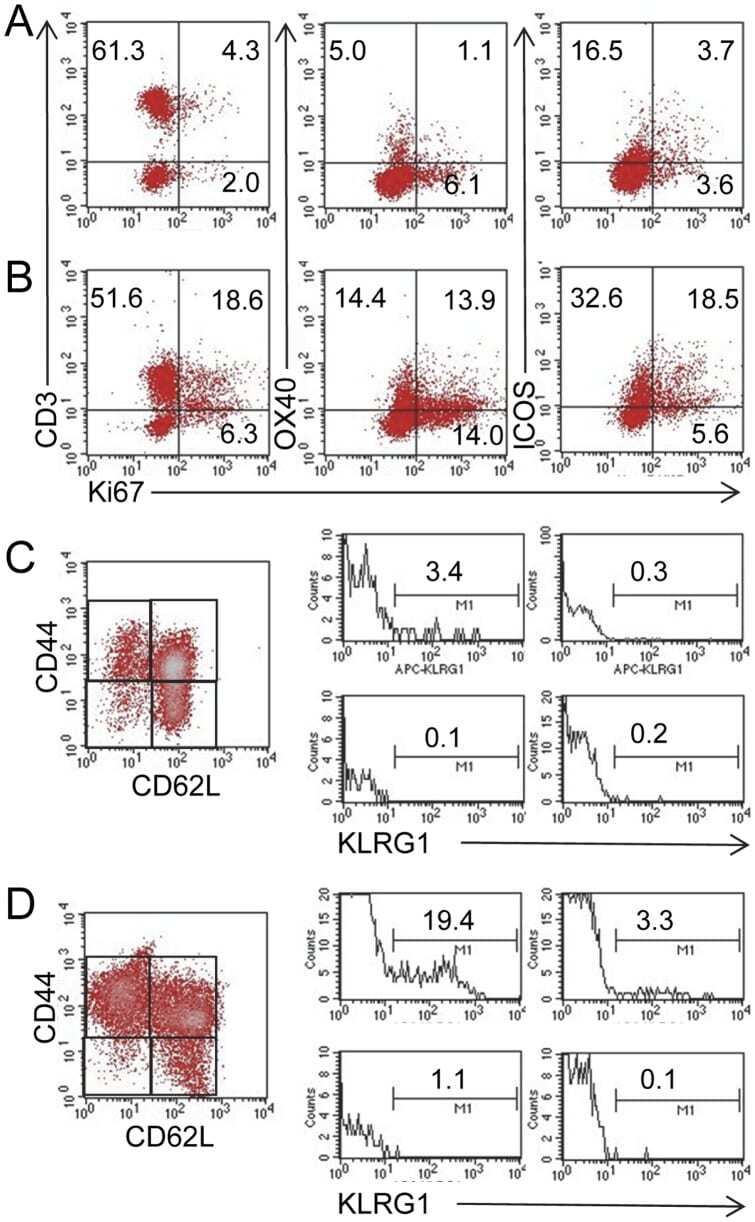
- Submitted by
- Invitrogen Antibodies (provider)
- Main image
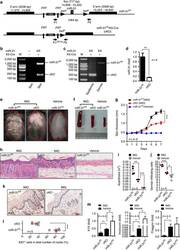
- Experimental details
- Figure 3 Decreased epidermal hyperplasia and dermal cellular infiltrates in miR-31 fl/fl /K5-Cre mice treated with IMQ. ( a ) Schematic representation of primers for genotyping and targeting strategy. ( b ) miR-31 genotyping using P1/P2, 1,064 bp band for miR-31 fl/fl and 235 bp band for miR-31 fl/fl /K5-Cre (cKO). DNA samples were prepared from total skin. ( c ) Cre-mediated tissue-specific deletion of miR-31 in epidermis. DNA samples were prepared from either epidermis or dermis. ( d ) miR-31 expression in epidermis derived from miR-31 fl/fl and cKO mice. ( e ) Phenotypic presentation of mouse back skin for miR-31 fl/fl or cKO mice treated with IMQ or vehicle for 7 days. ( f ) Splenomegaly and lymphadenopathy in miR-31 fl/fl or cKO mice treated with IMQ or vehicle for 7 days. Data are representative of more than five mice. ( g ) Skin thickness was measured on the days indicated. Symbols represent mean skin thickness+-s.e.m. for five to six mice per group. ( h ) H&E staining of the back skin of miR-31 fl/fl or cKO mice treated with IMQ or vehicle. Dotted line indicates the border between the epidermis and the dermis. Scale bar, 100 mum. ( i ) Acanthosis of miR-31 fl/fl or cKO mice treated with IMQ or vehicle. ( j ) Dermal cellular infiltrates of miR-31 fl/fl or cKO mice treated with IMQ. ( k ) Immunostaining of Ki67 in lesional skin derived from miR-31 fl/fl (left panel) or cKO (right panel) mice treated with IMQ. Scale bar, 100 mum. ( l ) Quantitation of Ki67 + cells in epi
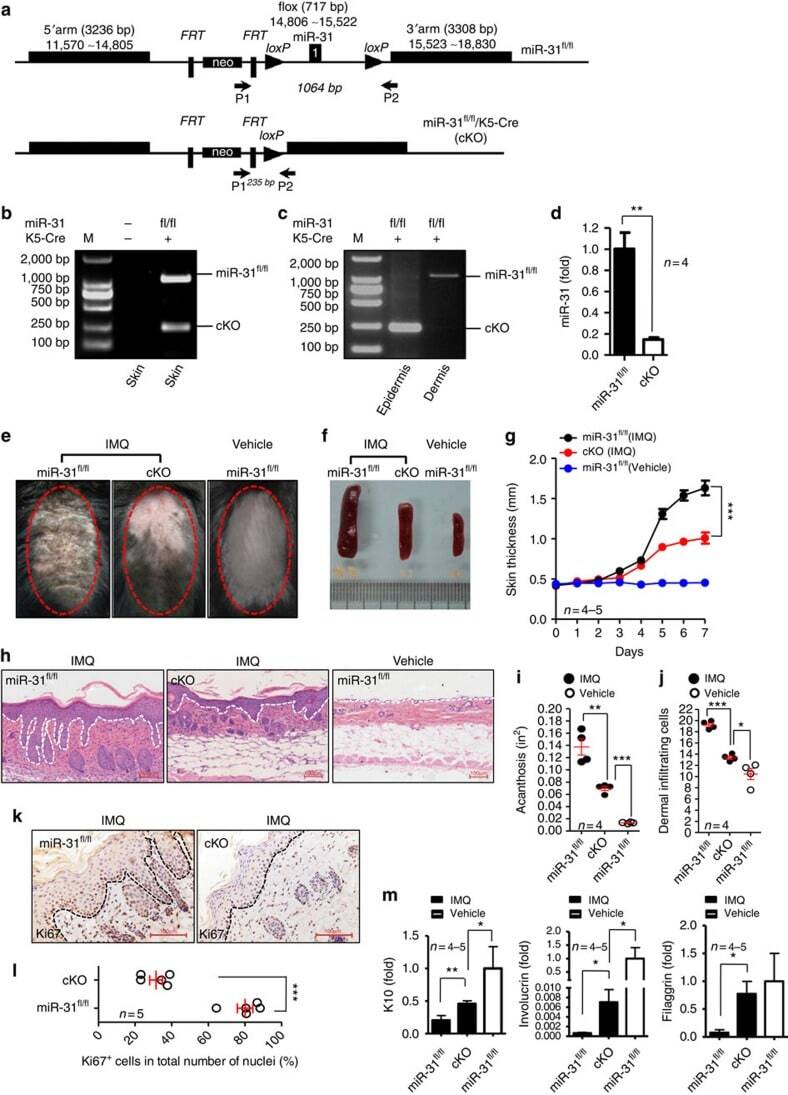
- Submitted by
- Invitrogen Antibodies (provider)
- Main image

- Experimental details
- Figure 5 Inhibition of ppp6c is functionally important for the biological effects of miR-31 in epidermal hyperplasia. ( a , b ) Western blotting of ppp6c expression in the epidermis of normal skin derived from four healthy individuals (Ctr-1 to 4) or in psoriatic lesions derived from four patients with psoriasis (Pso-1 to 4). ( c ) Immunohistochemical staining of ppp6c in skin sections derived from healthy or psoriatic skin. Scale bar, 100 mum. ( d ) Primary mouse keratinocytes were transfected with scramble siRNA (Ctr) or with ppp6c siRNA (siRNA). Cell lysates were immunoblotted with anti-ppp6c or anti-actin. ( e ) Cell cycle analysis of mouse primary keratinocytes transfected with scrambled siRNA or ppp6c siRNA. ( f ) Western blotting of ppp6c expression in epidermis derived from lentiviral shRNA-control (LV-Ctr) or lentiviral shRNA-ppp6c (LV-shRNA) treated mice. ( g ) H&E staining of the back skin injected with LV-Ctr or LV-shRNA in mice applied with IMQ. Dotted line indicates the border between the epidermis and dermis. Scale bar, 100 mum. ( h ) Acanthosis of the back skin injected with LV-Ctr or LV-shRNA in mice applied with IMQ. ( i ) Immunohistochemical staining of Ki67 in skin sections derived from mice injected with LV-Ctr or LV-shRNA prior to IMQ painting. Dotted line indicates the border between the epidermis and dermis. Scale bar, 50 mum. Values ( a , d , f ) were expressed as fold changes relative to Ctr-1 ( a ), to scramble siRNA ( d ), or to lentiviral shRNA-co
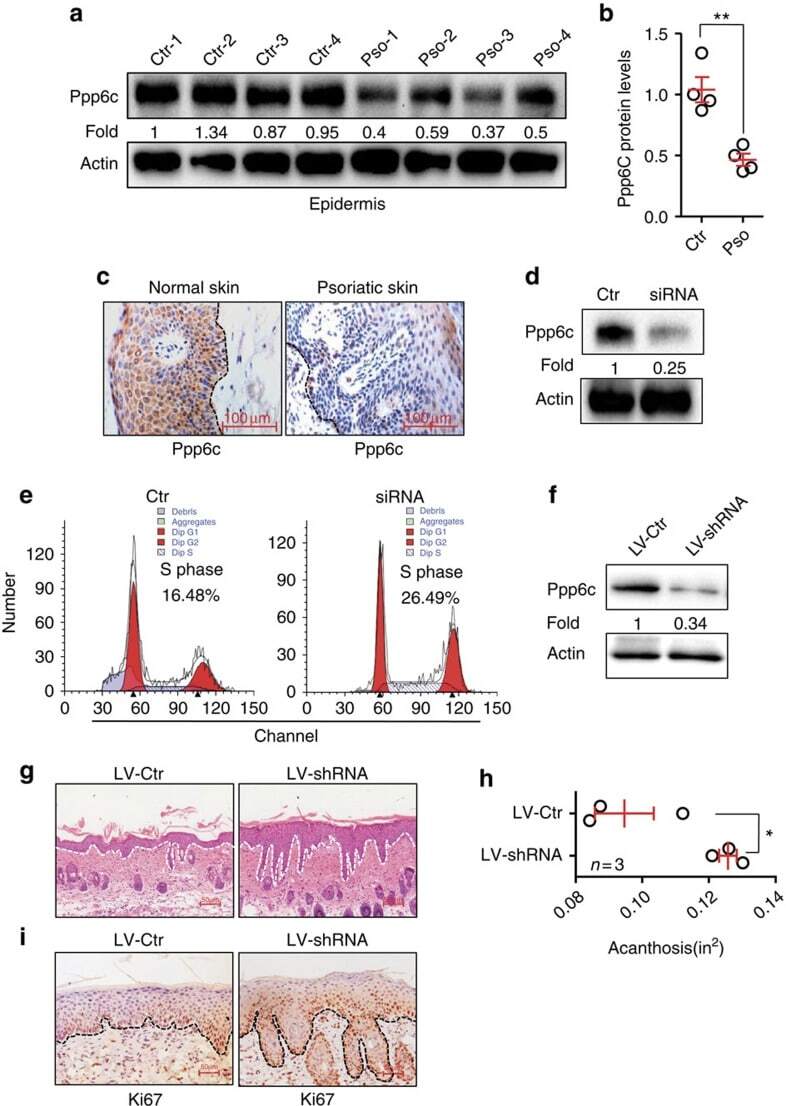
- Submitted by
- Invitrogen Antibodies (provider)
- Main image
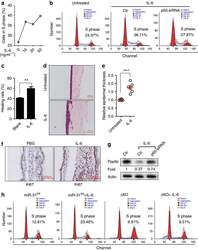
- Experimental details
- Figure 6 NF-kappaB signaling inhibits ppp6c expression by inducing miR-31. ( a ) Undifferentiated NHEK proliferation induced by various concentrations of IL-6 for 24 h, and analysed by BrdU incorporation assay. ( b ) NHEK were transfected with scramble siRNA (Ctr) or with p65 siRNA (p65 siRNA). Cell cycle analysis of NHEK or transfected NHEK treated without or with IL-6 for 24 h. ( c ) In vitro wound healing rate of NHEK treated without or with IL-6 for 16 h. ( d , e ) Three-dimensional organotypic culture of HaCaT keratinocytes treated without or with IL-6. Scale bar, 100 mum. ( f ) 1 mug recombinant mouse IL-6 (in 25 mul PBS) or PBS was injected i.d. in ears of C57BL/6J mice. Ear sections were prepared for Ki67 staining 3 days after IL-6 administration. Scale bar, 100 mum. ( g ) NHEK were transfected with scramble siRNA (Ctr) or with p65 siRNA (p65 siRNA). Western blotting of ppp6c expression in NHEK with or without IL-6 treatment for 24 h. ( h ) Cell cycle analysis of primary mouse keratinocytes derived from miR-31 fl/fl or cKO mice in absence or presence of IL-6. Values were expressed as fold changes relative to non-stimulated HaCaT keratinocytes ( e ) or to non-stimulated NHEK ( g ) and normalized to beta-actin. IL-6 was used at the concentration of 50 ng ml -1 ( b - e , g , h ). ** P
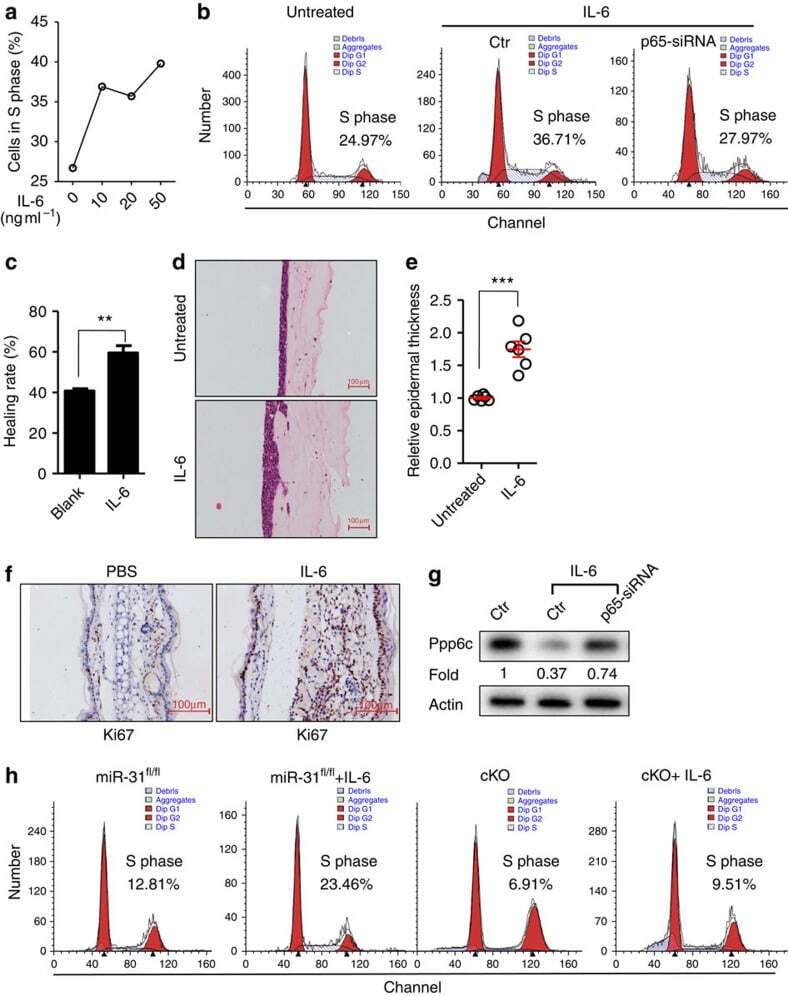
- Submitted by
- Invitrogen Antibodies (provider)
- Main image
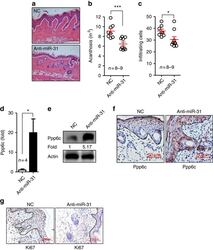
- Experimental details
- Figure 7 Administration of antagomir-31 decreases epidermal hyperplasia and dermal cellular infiltration induced by IMQ. Mice were injected subcutaneously with an irrelevant antagomir (NC) or an antagomir to miR-31 (anti-miR-31). The first injection was administered 3 days before the application of IMQ and thereafter was performed every other day until the end of the experiment. ( a ) H&E staining of the back skin derived from mice injected with NC (upper panel) or anti-miR-31 (lower panel). Scale bar, 100 mum. ( b , c ) Acanthosis and dermal cellular infiltrates were quantitated for mice treated with NC or anti-miR-31. ( d , e ) Ppp6c mRNA and protein levels in NC- or anti-miR-31-treated mice. ( f , g ) Immunohistochemical staining of ppp6c or Ki67 in skin sections derived from NC- or anti-miR-31-treated mice after induction of skin phenotype by IMQ ( n =8-9). Scale bar, 50 mum ( f ) or 100 mum ( g ). For all measurements ( c ), the median number of specifically stained dermal nucleated cells was counted in three high-power fields per section. Results ( d ) are presented as the ratio of mRNA to the beta-actin, relative to that in NC-treated mice. * P
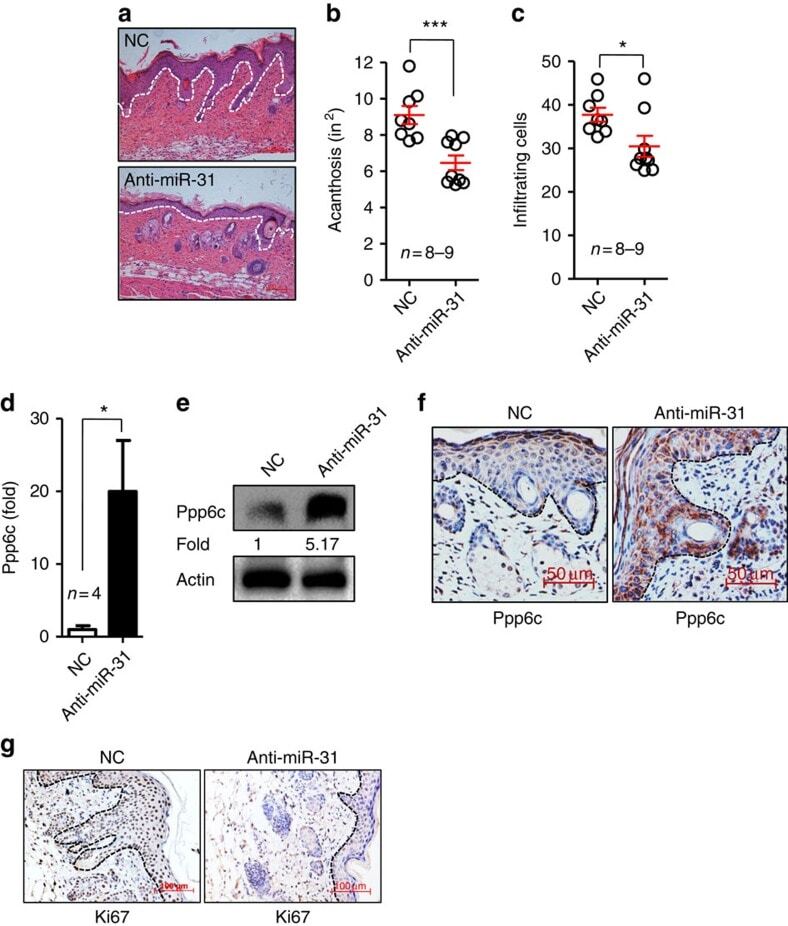
- Submitted by
- Invitrogen Antibodies (provider)
- Main image
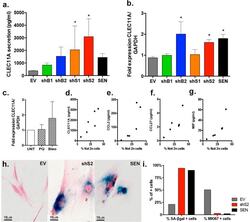
- Experimental details
- Figure 7 W-CIN induced senescent cells secrete CLEC11A. ( a ) Levels of CLEC11A secreted in the CM of each SMC1 and BUB1-depleted cell line. ( b ) Fold expression of CLEC11A mRNA levels normalized to GAPDH in W-CIN-induced senescent and SEN cells and ( c ) Paraquat (PQ, black and white stripe bar) or Bleomycin (Bleo, gray bar)-induced senescence relative to untreated cells (UNT, white bar). ( d-g ) Secretion levels of SASP factors that significantly correlate with W-CIN levels: ( d ) CLEC11A, ( e ) CCL2, ( f ) CCL27 and ( g ) MIF. ( h ) Bright field representative images of SA-betagal staining in EV, shS2 and SEN fibroblasts 45 days after lentiviral transduction. ( i ) Quantification of SA-betagal and MKI67 positively stained fibroblasts 45 days after lentiviral transduction. (*) Indicates significant differences ( p < 0.05) from EV cells tested by One-way ANOVA. Data are expressed as mean +- SD (n = 3).
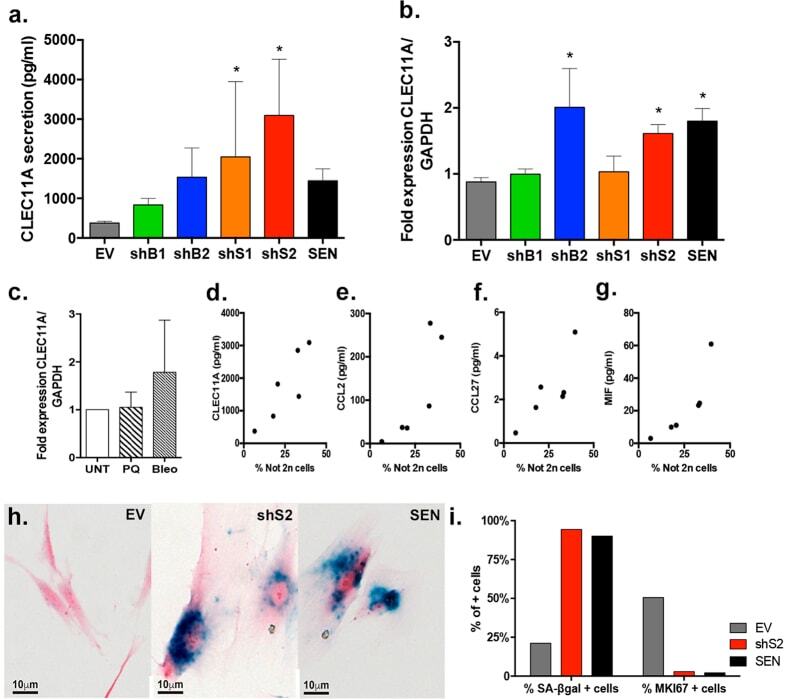
- Submitted by
- Invitrogen Antibodies (provider)
- Main image
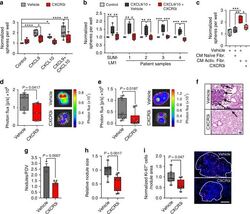
- Experimental details
- Fig. 9 CXCR3 mediates CXCL9/10-induced oncosphere formation and can be targeted to inhibit lung metastasis. Quantification of oncospheres by MDA-LM2 cells ( a ) or SUM-LM1 cells and primary breast cancer cells from pleural fluids or ascites ( b ) after stimulation with 100 ng/ml recombinant CXCL9/10, individually or together. In addition, the cells were treated with 10 muM CXCR3 antagonist (CXCR3i) or vehicle. Biological replicates ( a ) vehicle n = 6, CXCR3i n = 5; b SUM-LM1 n = 5, patient samples, control and CXCL9/10 + vehicle n = 5 for each group, CXCL9/10 + CXCR3i n = 4. Sphere numbers were normalized to the average number in the control group. P values were calculated on biological replicates by ordinary one-way ANOVA with Sidak''s multiple comparisons test. c Quantification of MDA-LM2 oncospheres in control medium (vehicle), in conditioned medium (CM) from control MRC-5 fibroblasts (naive), or from MRC-5 cells treated with MDA-LM2 cell CM (activated), together with CXCR3i or vehicle; n = 4 biological replicates with 5-10 technical replicates each. P values were determined by ordinary one-way ANOVA with Tukey''s multiple comparisons test. a - c * P < 0.05, ** P < 0.01, *** P < 0.001, **** P < 0.0001. Lung colonization in NSG mice injected with MDA-LM2 cells ( d ) or BALB/c mice with 4T1 mouse mammary tumor cells ( e ). In both settings, the mice received systemic CXCR3i treatment. Metastatic colonization was quantified by bioluminescence after 13 days. Representative ex
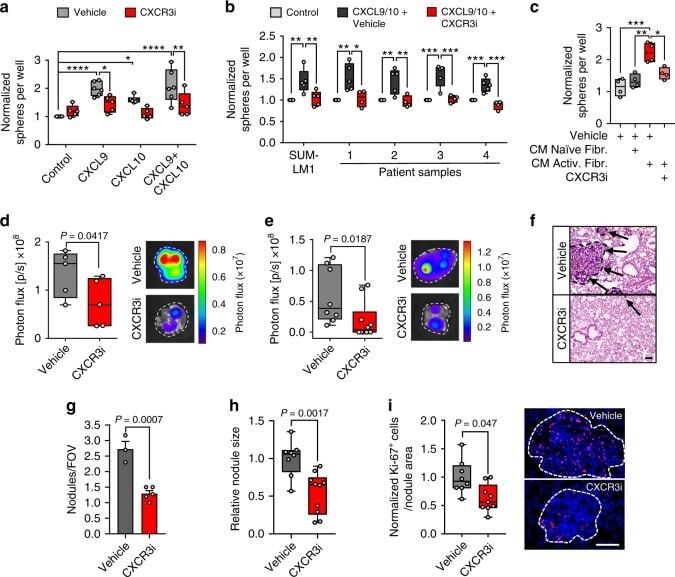
- Submitted by
- Invitrogen Antibodies (provider)
- Main image
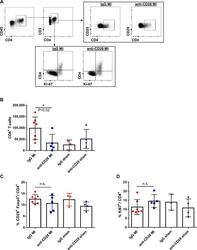
- Experimental details
- Fig 4 Flow cytometric gating strategy (A) and quantitative analysis of CD4 + T-cell subsets in mediastinal lymph nodes (B-D) after MI or sham operation and anti-CD28 or IgG mAb administration 5 days after surgery. (* P
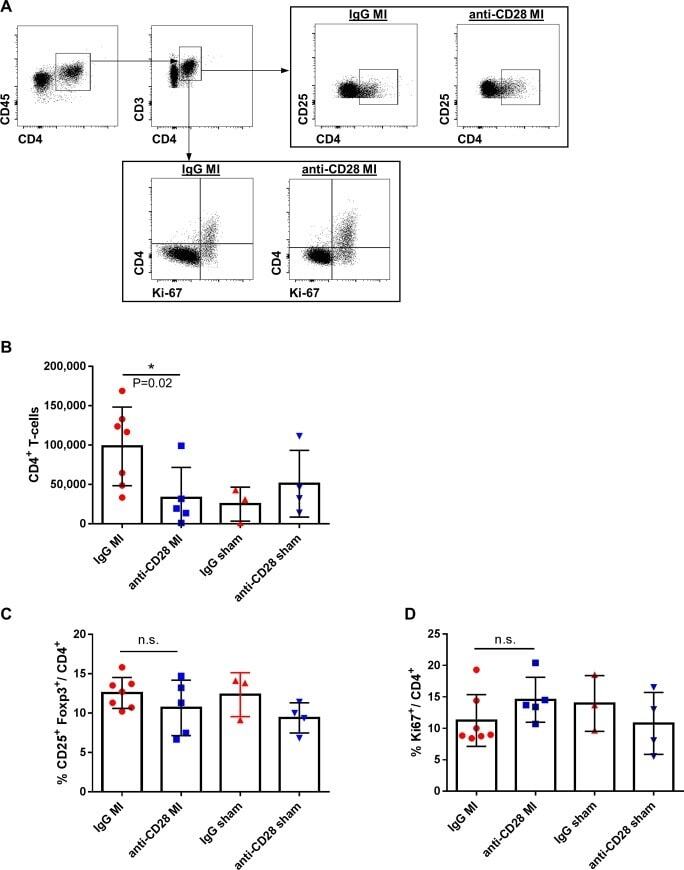
- Submitted by
- Invitrogen Antibodies (provider)
- Main image
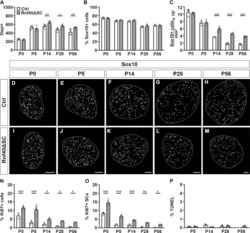
- Experimental details
- Figure 2. SC numbers and characteristics in sciatic nerves of Rnf40 DeltaSC mice. ( A - C ) Comparison of the number of total cells (A) as well as the relative contribution of SCs to the overall cell population (B) and SC density (C, as determined by the number of SCs per mm 2 ) in sciatic nerve sections of control (Ctrl, white bars) and Rnf40 DeltaSC (gray bars) mice at P0, P5, P14, P28 and P56 by quantification of nerve sections stained with DAPI and antibodies against Sox10 ( n = 3-5; mean values +- SEM). ( D - M ) Immunohistochemical stainings of sciatic nerve sections of control (D-H) and Rnf40 DeltaSC (I-M) mice at P0 (D, I), P5 (E, J), P14 (F, K), P28 (G, L) and P56 (H, M) with antibodies directed against Sox10. Sections were placed on a black background and are surrounded by a dotted line. Scale bars: 50mum. ( N - P ) Comparison of the number of Ki67-positive proliferating cells (N), the percentage of Ki67-positive proliferating SCs (O) and total TUNEL-labled cells (P) in sciatic nerve sections of control (Ctrl, white bars) and Rnf40 DeltaSC (gray bars) mice at P0, P5, P14, P28 and P56 ( n = 3; mean values +- SEM). Statistical significance was determined by unpaired two-tailed Student''s t -tests (* P
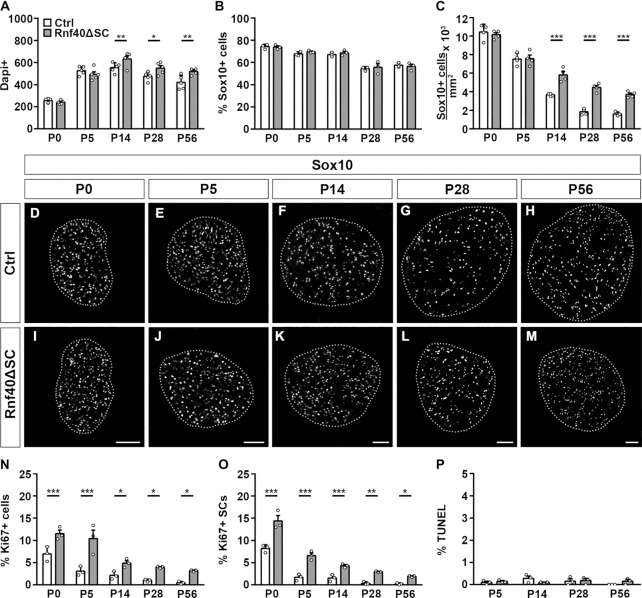
- Submitted by
- Invitrogen Antibodies (provider)
- Main image
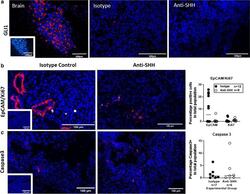
- Experimental details
- Fig. 2 Expression of SHH pathway and cell identity markers did not change with anti-SHH treatment. a Gli1 expression (red) was detected in the mouse brain but was barely detected in lesions from either group. Inset rabbit IgG1 isotype control. b Dual immunofluorescence for EpCAM (red) and Ki67 (white), insert isotype control. c Immunofluorescence for Caspase 3 (red), insert isotype control. B + C quantification; EpCAM, Ki67 and Caspase 3 expressed as a percentage of total cell population, isotype control (black circles) and anti-Shh (white circles). Data analysed by an unpaired, two-tailed Mann-Whitney test
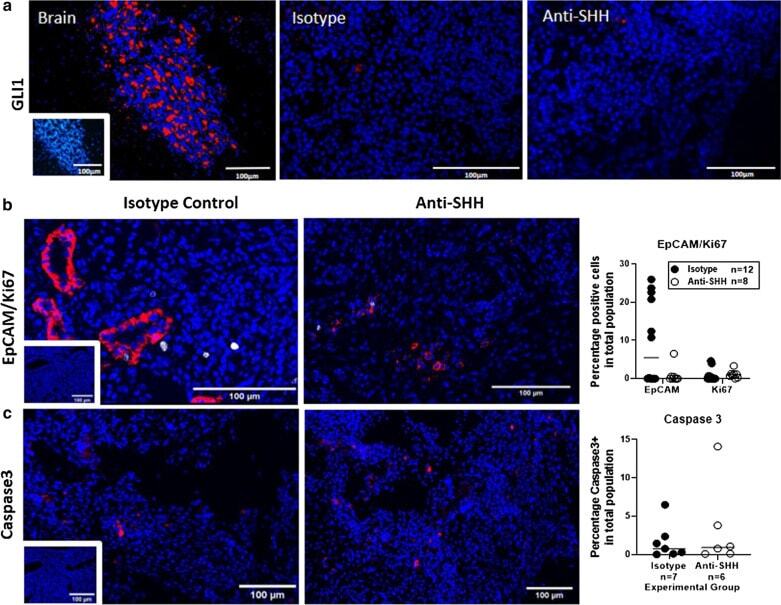
- Submitted by
- Invitrogen Antibodies (provider)
- Main image
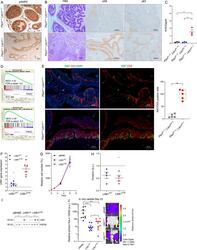
- Experimental details
- Figure S2. Pathological and molecular characterization of Lkb1 perturbations in murine and human prostate cells. (A) Immunohistochemical images of prostate tissue in Pten pc +/- Lkb1 pc +/+ and Pten pc +/- Lkb1 pc -/- mice. Staining as indicated: p-AMPK (Thr172). (B) Representative immunohistochemical images of prostate tissue in Pten pc +/- Lkb1 pc +/+ and Pten pc +/- Lkb1 pc -/- mice. Staining as indicated: H&E, pS6 (Ser235/236), and p63. (C) Analysis of Krt5 gene expression by qRT-PCR in Pten pc +/- Lkb1 pc +/+ ( n = 3), Pten pc +/- Lkb1 pc +/- ( n = 3), and Pten pc +/- Lkb1 pc -/- ( n = 3) mice. Data are normalized to Gapdh expression. (D) Gene set enrichment analysis of the squamous cell carcinoma signature in Pten pc +/- Lkb1 pc -/- (SCC-squamous cell carcinoma) and Pten pc-/- Lkb1 pc +/+ (PADC-prostate adenocarcinoma) mice. (E) Representative immunofluorescence images (left) of Ki67 (green) and CK5 (red), with quantification of double positive cells (right) in prostate tissue of Pten pc-/- Lkb1 pc +/+ and Pten pc +/- Lkb1 pc -/- mice. (F) Analysis of LKB1 gene expression by qRT-PCR in DU145 cells with ectopic expression of WT LKB1 (LKB1 WT ), the kinase-defective LKB1-K78I mutant (LKB1 K78I ), or transduced with mock vector (pBABE; n = 6; independent experiments). Data are normalized to control (pBABE; dashed line). (G) Effect of LKB1 WT and LKB1 K78I expression on cellular growth ( n = 3; independent experiments). (H) Quantification of invasion (C; n = 4, independent
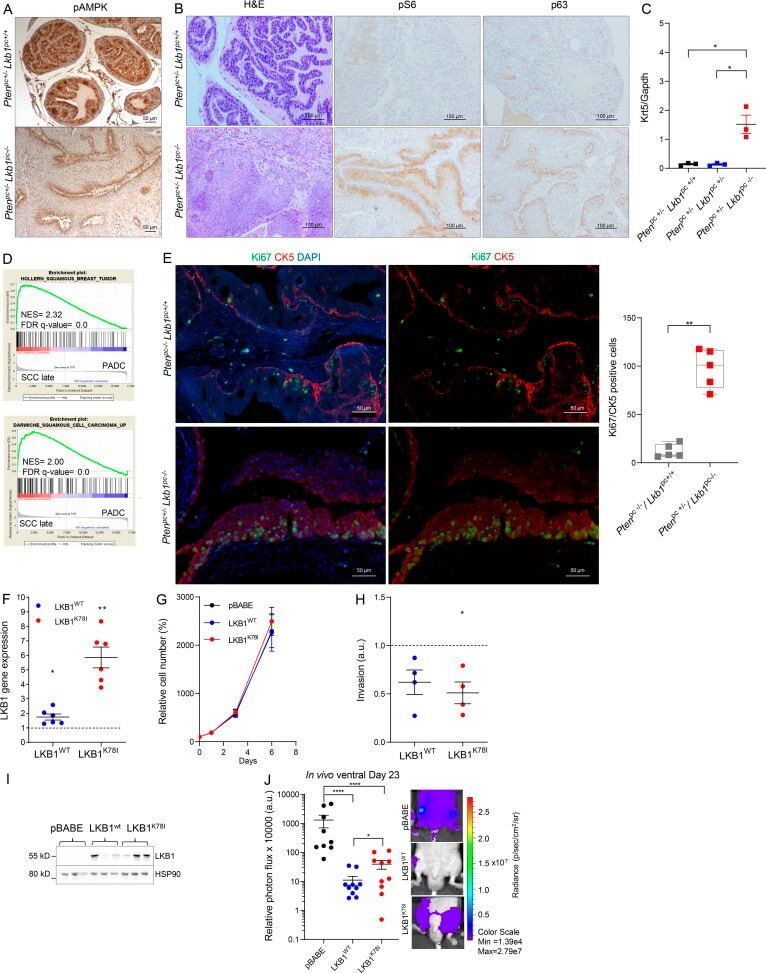
- Submitted by
- Invitrogen Antibodies (provider)
- Main image

- Experimental details
- Figure 2. Cell-cycle-activated and quiescent SSCs are present throughout the cycle of the seminiferous epithelium in vivo (A) Whole-mount immunofluorescence (WM-IIF) of SOX3 (white) and Ki67 (red), together with ID4-EGFP epifluorescence (green) in seminiferous tubules from adult Id4 - Egfp mice. Scale bar, 20 mum. Arrowhead, quiescent SSCs (ID4-EGFP Bright /SOX3-/Ki67-); asterisk, late progenitors (ID4-EGFP Dim /SOX3+/Ki67-). (B) Flow cytometry analysis of adult Id4 - Egfp mouse seminiferous tubule cells sequentially gated for SSC-enriched CD9 Bright /ID4-EGFP Bright spermatogonia (left) and SOX3 and RARgamma staining (right). Figure S3H shows negative controls. (C) Quadrant statistics from the right panel of (B). Data are mean +- SEM (n = 3 adult Id4-Egfp mice). (D) Quantification of Ki67 staining intensity in cells from (B) grouped by ID4-EGFP Bright /SOX3 low /RARgamma low (SSCs) or ID4-EGFP Bright /SOX3 high /RARgamma low (early progenitors). Data are mean +- SEM. Two-tailed Student''s t test (**p < 0.01). (E-G) WM-IIF of PLZF (green), SOX3 (red), Ki67 (white), and peanut agglutinin (PNA) in adult C57BL/6 mice (n = 4). Scale bar, 20 mum. Arrowhead, quiescent SSCs (PLZF+/SOX3-/Ki67-); arrow, activated SSCs (PLZF+/SOX3-/Ki67+). (H) Proportion of quiescent SSCs and activated SSCs in each stage from (E) and (F). Data are mean +- SEM. The proportion of Ki67+ SSCs was not significantly different according to ANOVA (p = 0.093).
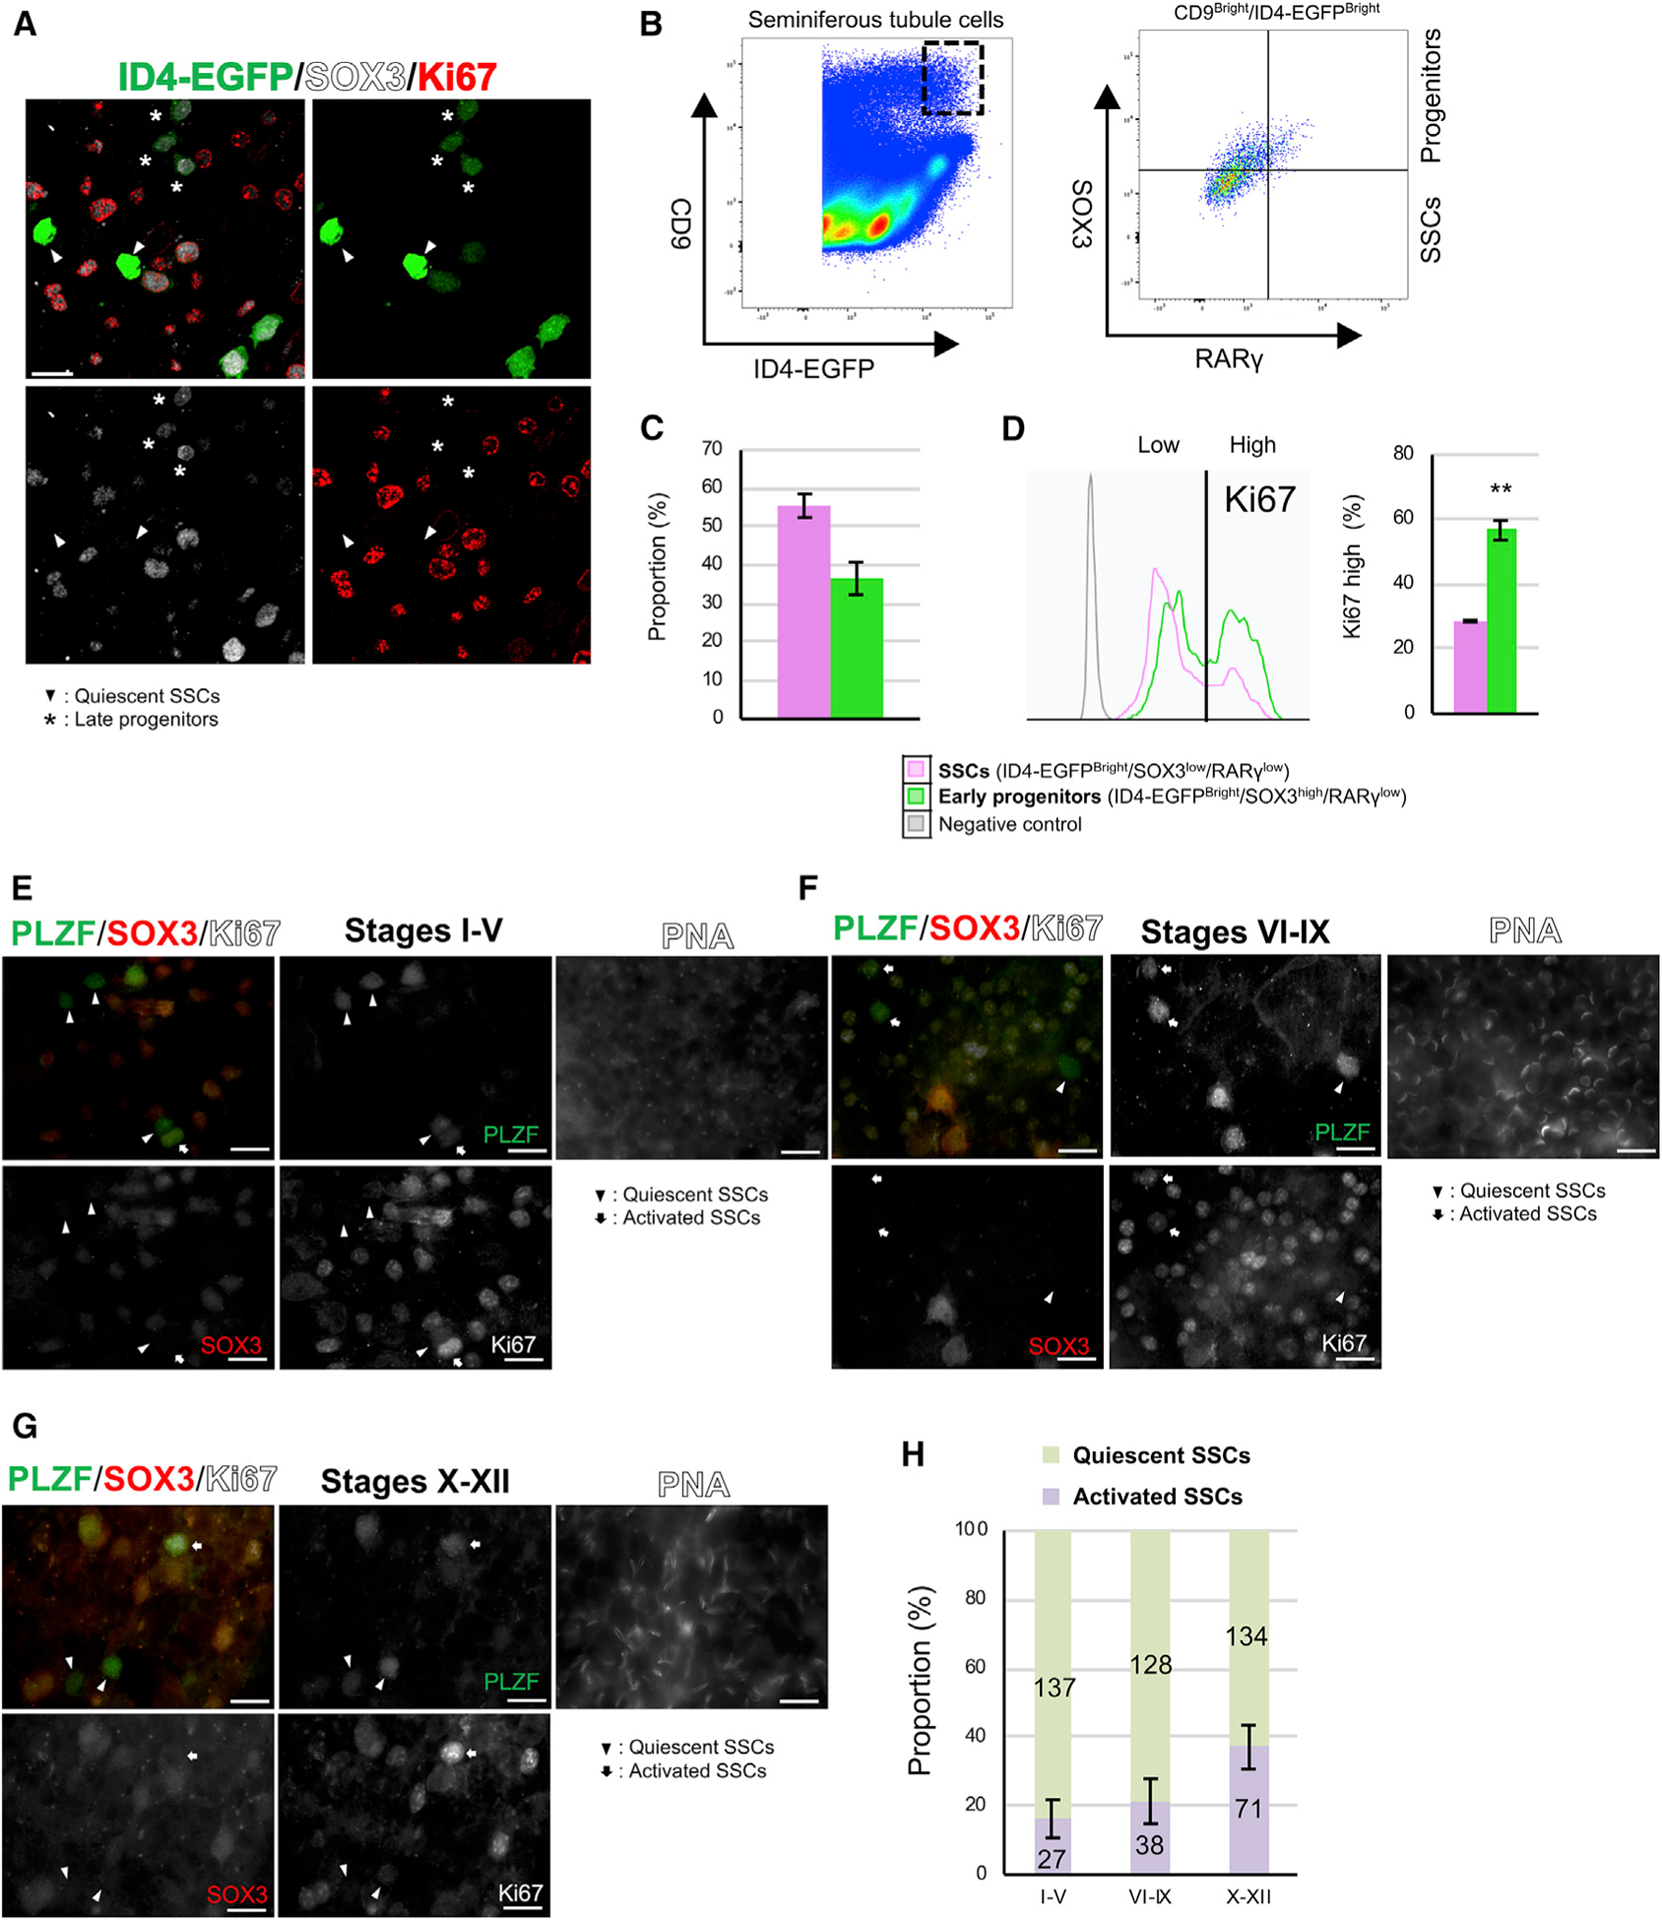
- Submitted by
- Invitrogen Antibodies (provider)
- Main image
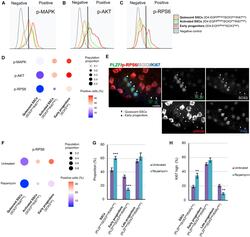
- Experimental details
- Figure 3. Signaling pathways that regulate transitions in cell state among mouse SSCs and progenitors (A-C) Phosphorylated MAPK (phospho-MAPK) (A), phosphorylated AKT (phospho-AKT) (B), and p-RPS6 (C) levels in isolated seminiferous tubule cells from adult Id4-Egfp mice gated for quiescent SSCs (ID4-EGFP Bright /SOX3 low /Ki67 low , orange), activated SSCs (ID4-EGFP Bright /SOX3 low /Ki67 high , green), and early progenitors (ID4-EGFP Bright /SOX3 high , red) compared with unstained negative control cells (gray). Gating controls are in Figure S3H . (D) Quantification of flow cytometry from (A)-(C) (n = 3 adult Id4-Egfp mice). Dot size, proportion of undifferentiated spermatogonia; color, percentage that are marker positive. (E) WM-IIF of PLZF (green, spermatogonia), p-RPS6 (red, mTORC1 activity), SOX3 (white, early/late progenitors), and Ki67 (blue, proliferation) in adult C57BL/6 mice. Arrowhead, quiescent SSCs (PLZF+/SOX3-/Ki67-); circle, early progenitors (PLZF+/SOX3+/Ki67+). Scale bar, 20 mum. (F) Quantification of p-RPS6 levels in quiescent SSCs (ID4-EGFP Bright /SOX3 low /Ki67 low ), activated SSCs (ID4-EGFP Bright /SOX3 low /Ki67 high ), and early progenitors (ID4-EGFP Bright /SOX3 high ) in untreated and rapamycin-treated adult Id4-Egfp mice (n = 3 adult Id4-Egfp mice). Dot size, proportion of undifferentiated spermatogonia; color, percentage marker positive. (G) Proportion of SSCs (KIT-/PLZF low /SOX3 low /RARgamma low ), early progenitors (KIT-/PLZF low /SOX3 high /
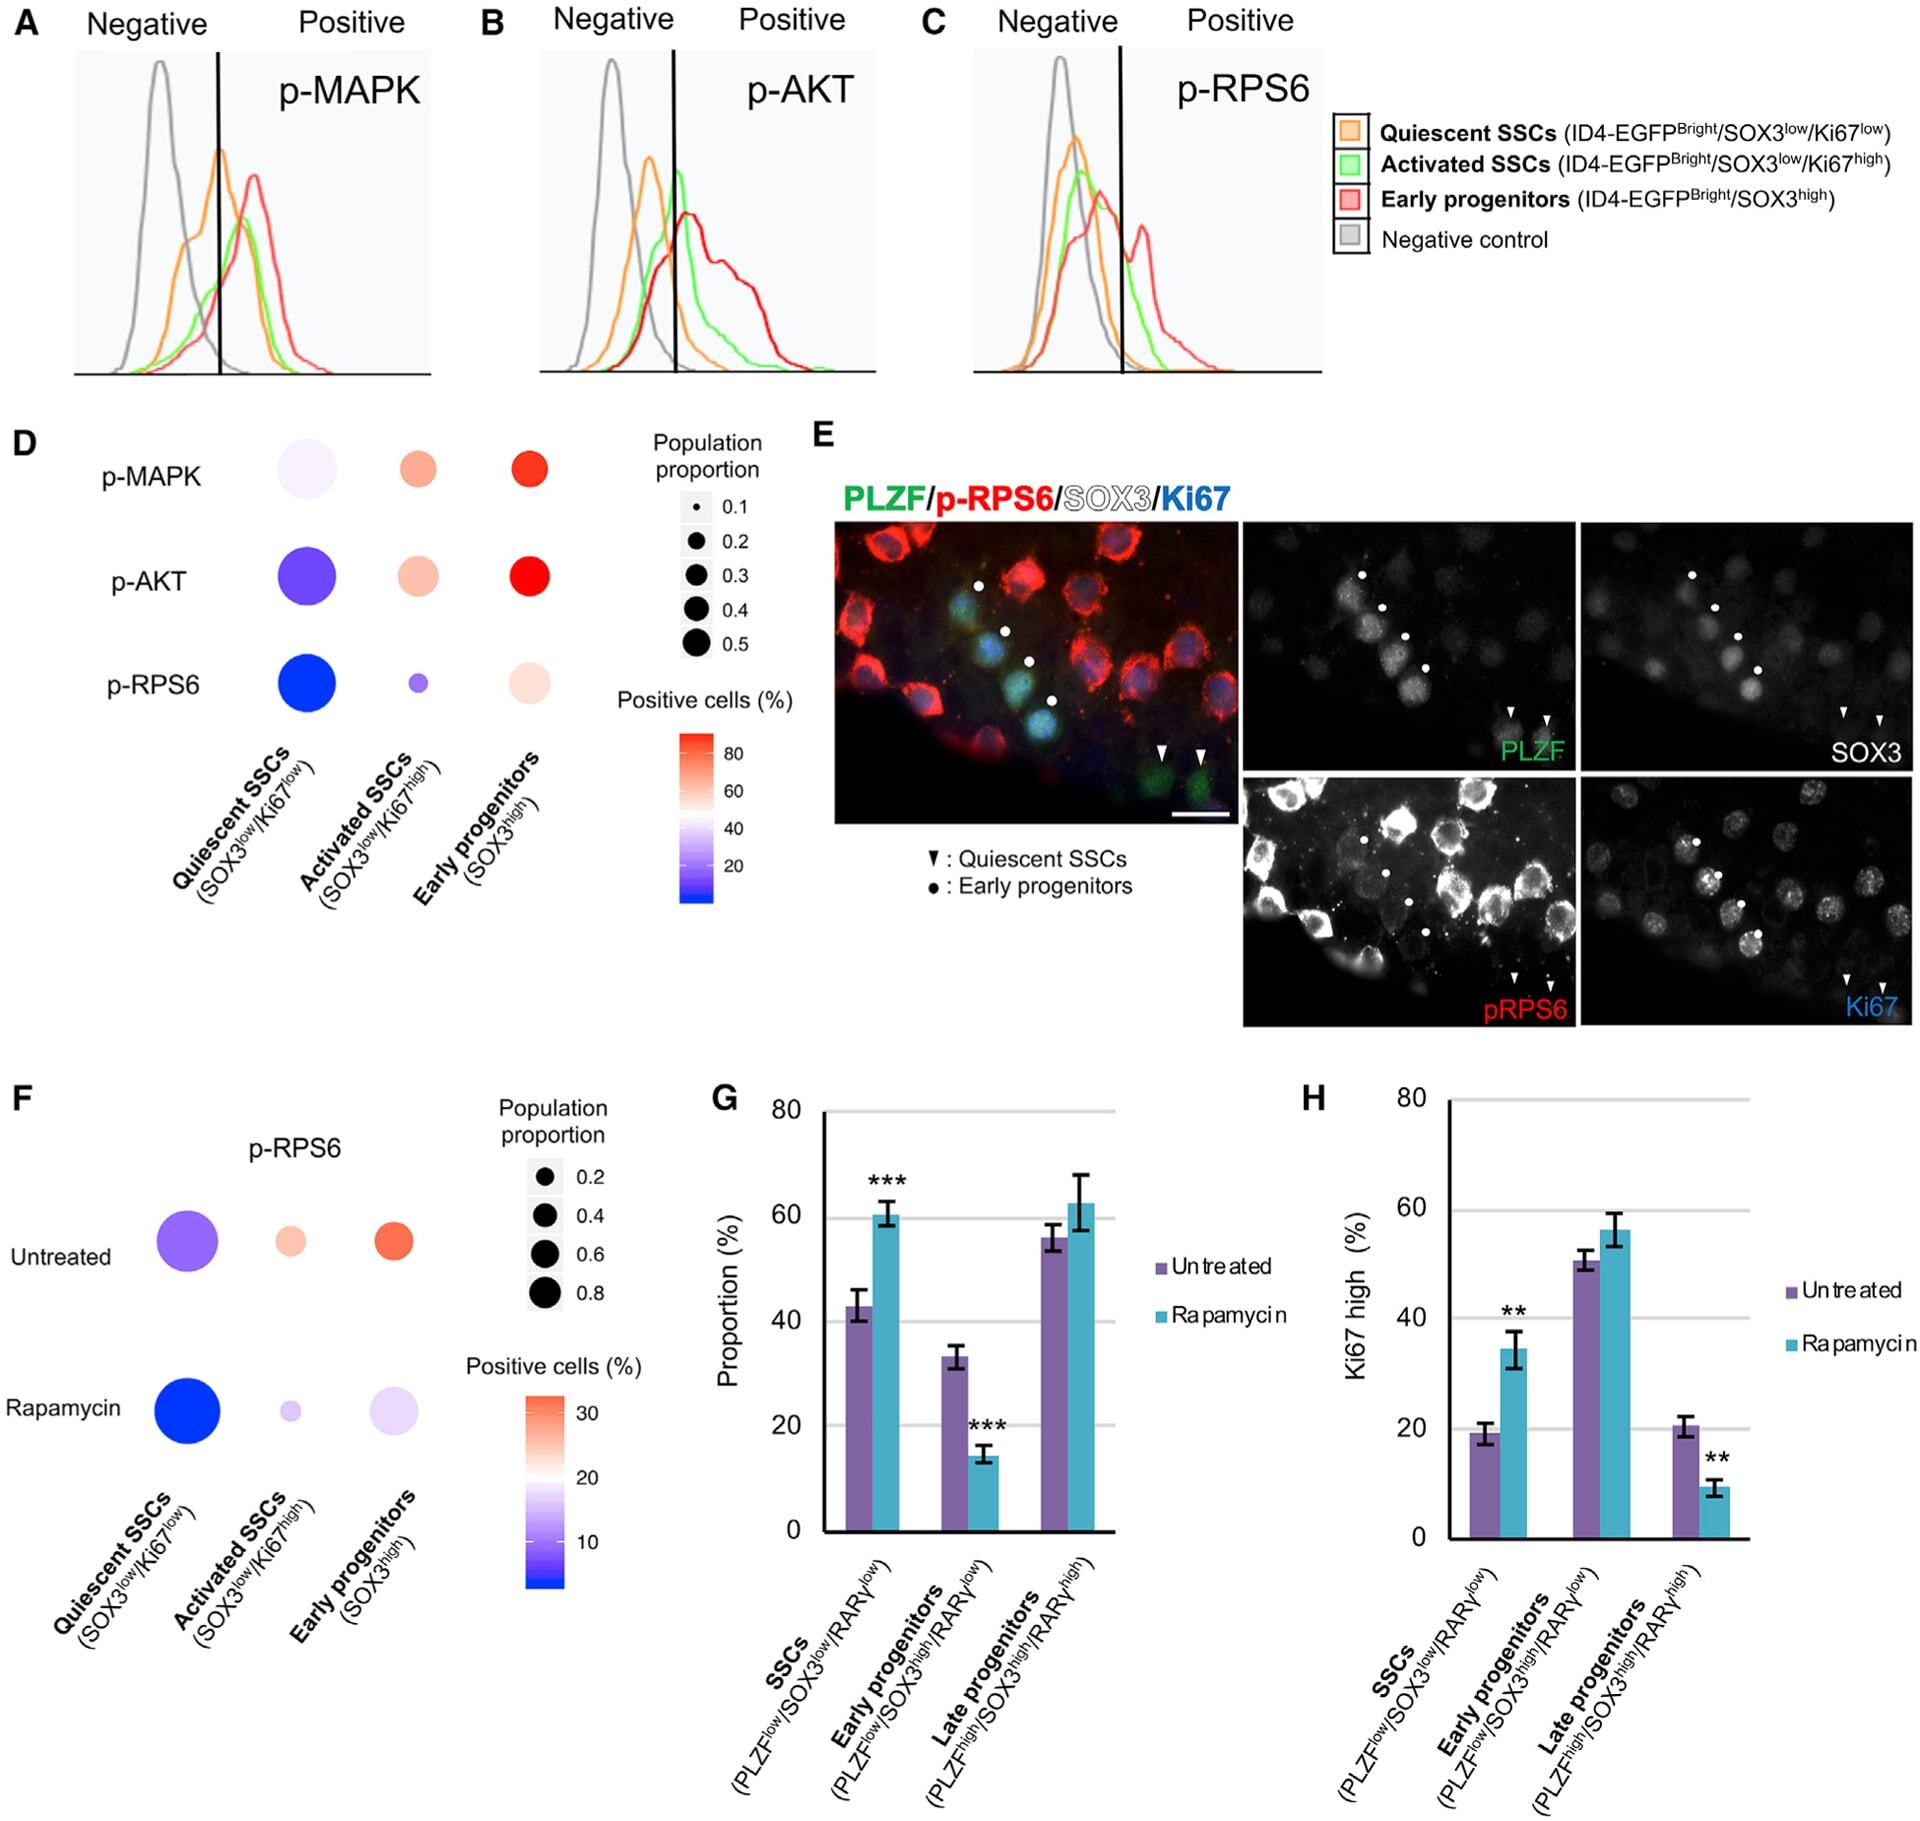
- Submitted by
- Invitrogen Antibodies (provider)
- Main image

- Experimental details
- Figure 5. mTORC1 inhibition fails to drive activated SSC accumulation and early progenitor depletion in the absence of intercellular bridges (A and B) WM-IIF of PLZF (green, spermatogonia), RARgamma (red, late progenitors), SOX3 (white, early/late progenitors) or KIT (white, differentiating spermatogonia), and Ki67 (blue, proliferation) in seminiferous tubules from P36 Tex14 -/- mice. Arrowhead, quiescent SSCs (PLZF+/SOX3-/RARgamma/Ki67-) or early progenitors (PLZF+/KIT-/RARgamma-/Ki67-); arrow, activated SSCs (PLZF+/SOX3-/RARgamma-/Ki67+) or early progenitors (PLZF+/KIT-/RARgamma-/Ki67+); circle, early progenitors (PLZF+/SOX3+/RARgamma-/Ki67+); asterisk, late progenitors (PLZF+/SOX3+ or KIT-/RARgamma+/Ki67-). Scale bar, 20 mum. (C) Proportion of SSCs (KIT-/PLZF low /SOX3 low /RARgamma low ), early progenitors (KIT-/PLZF low /SOX3 high /RARgamma low ), and late progenitors (KIT-/PLZF high /SOX3 high /RARgamma high ) in seminiferous tubule cells from control (n = 3) and rapamycin-treated (n = 3) Tex14 -/- mice at P36 (see controls in Figure S3J ). Data are mean +- SEM. (D) Ki67 staining intensity in SSCs (KIT-/PLZF low /SOX3 low /RARgamma low ), early progenitors (KIT-/PLZF low /SOX3 high /RARgamma low ), and late progenitors (KIT-/PLZF high /SOX3 high /RARgamma high ) in seminiferous tubule cells from Tex14 +/- , Tex14 -/- , and rapamycin-treated Tex14 -/- mice (n = 3 each) at P36 (see controls in Figure S3J ). Data are mean +- SEM. Two-tailed Student''s t test (***p < 0.001)
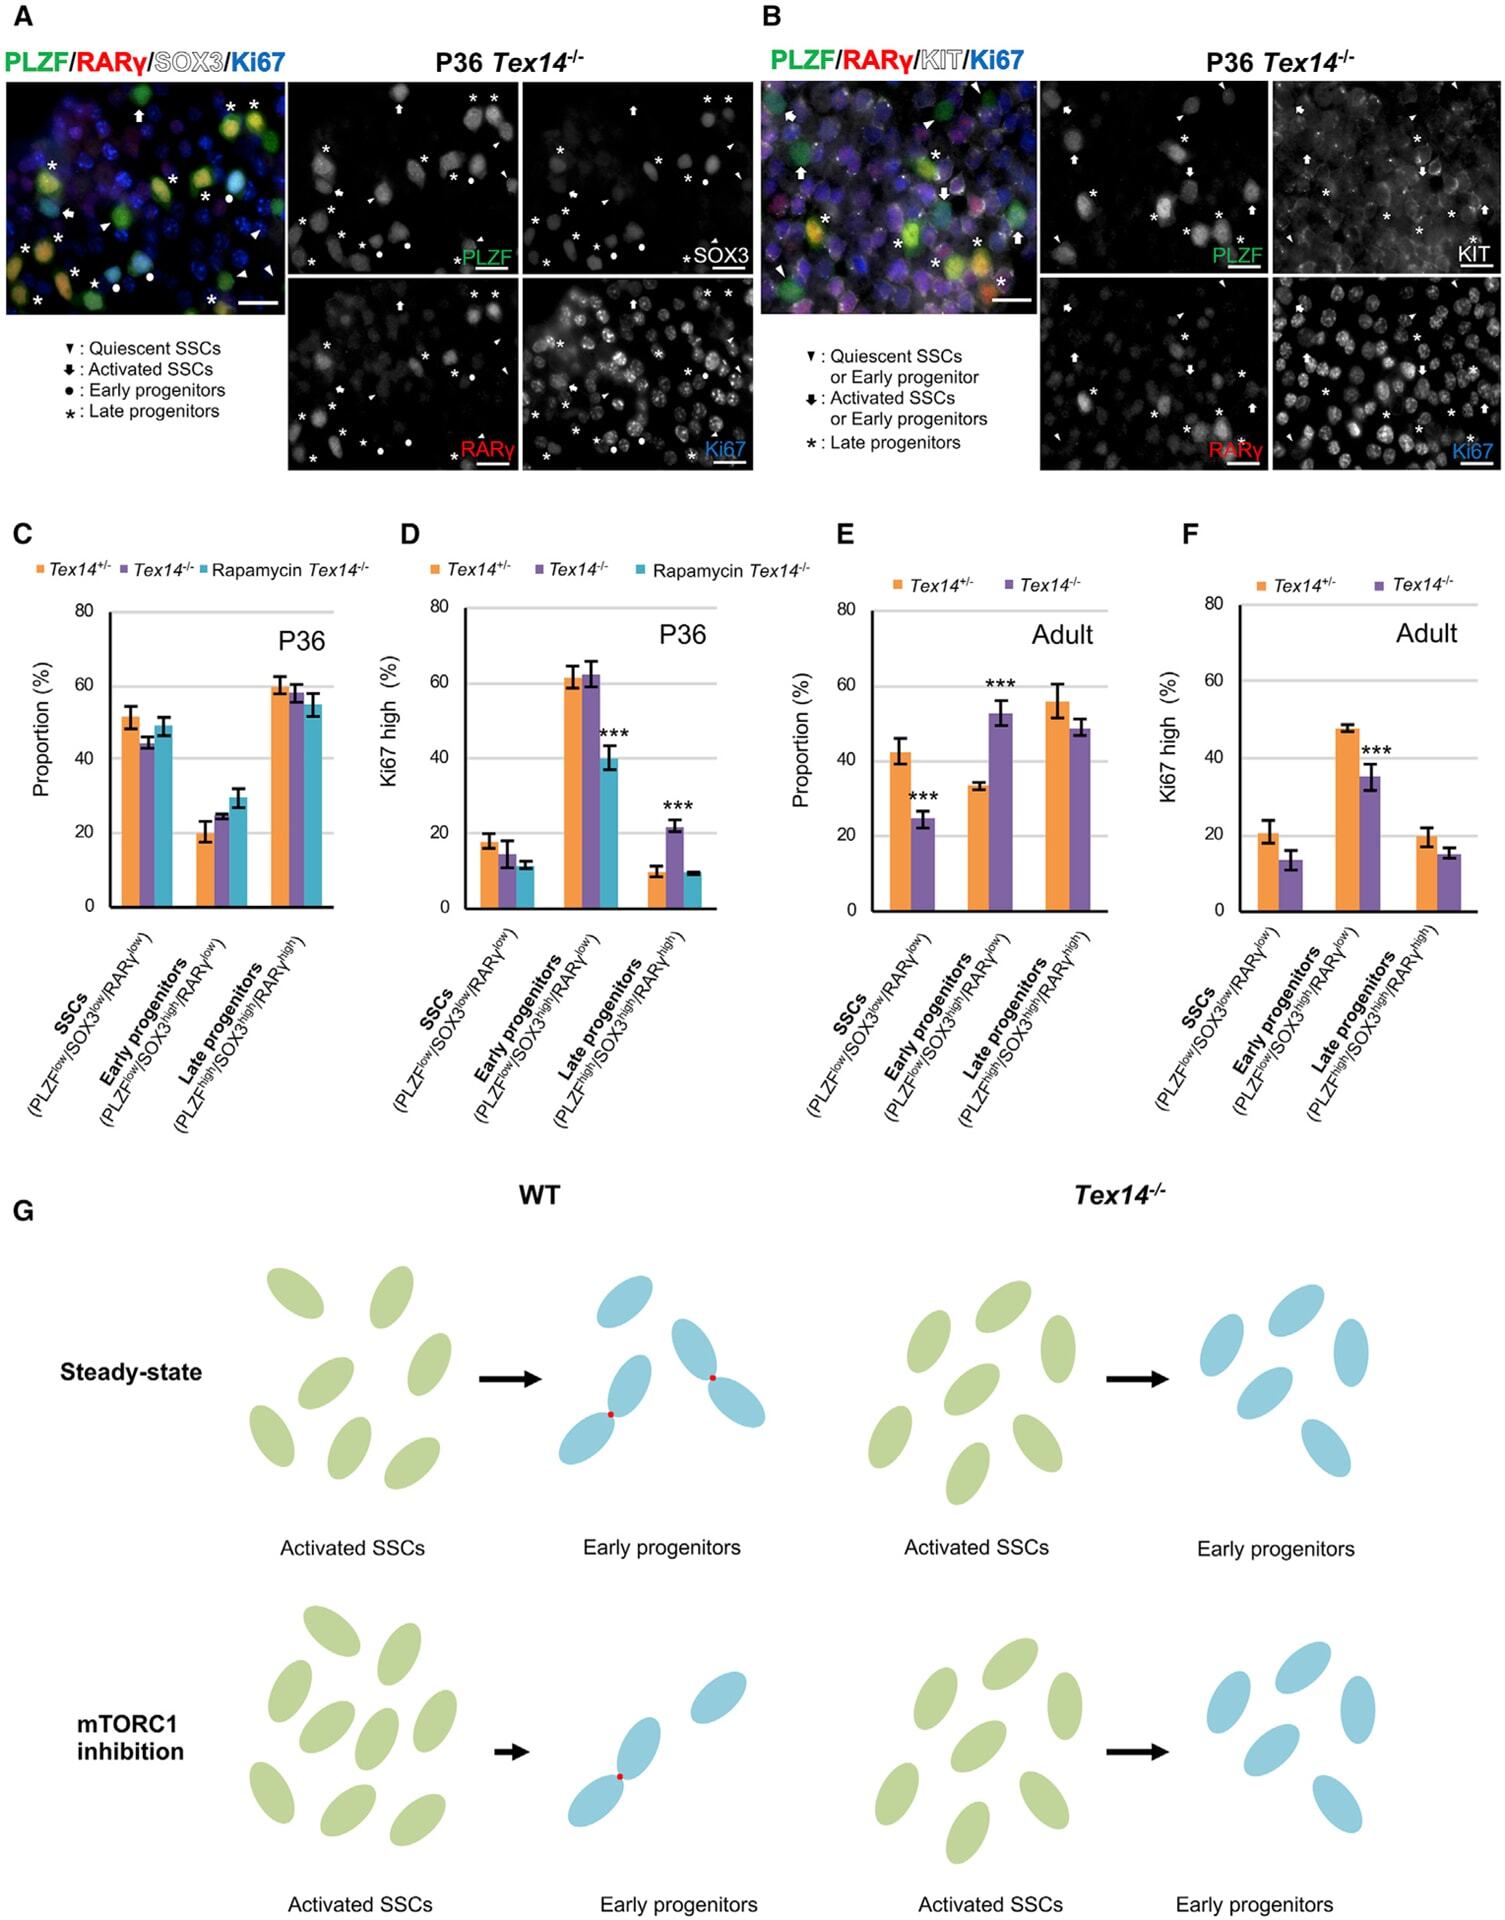
- Submitted by
- Invitrogen Antibodies (provider)
- Main image
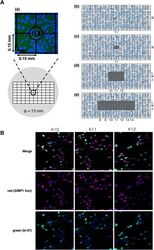
- Experimental details
- Figure 1 Schematic representation of X-ray microbeams for different field sizes and representative immunofluorescence images of 53BP1 foci and Ki-67-positive cell. ( A ) The illustration of a cover glass with grid lines and X-irradiation field sizes. The cells were cultured on a cover glass with grid lines to create the cell populations. This cover glass is a 0.15-mm grid that is engraved on the surface of the cover glass that makes it possible to confirm the irradiation field in more detail (a). X-ray microbeams were applied at 0.02 mm 2 (b), 0.09 mm 2 (c), 0.81 mm 2 (d), and 1.89 mm 2 (e) irradiation field sizes to cell populations by an X-ray microbeam generator, centering on K11 on the cover glass. Irradiation field is shown in gray. ( B ) The representative immunofluorescence image of the X-irradiated area (K11) and the non-irradiated area (K10, K12) in 0.09 mm 2 . Blue: Nuclei. Red: 53BP1 foci. Green: Ki-67-positive cells. These figures were created with PowerPoint for Mac ver.16.46.
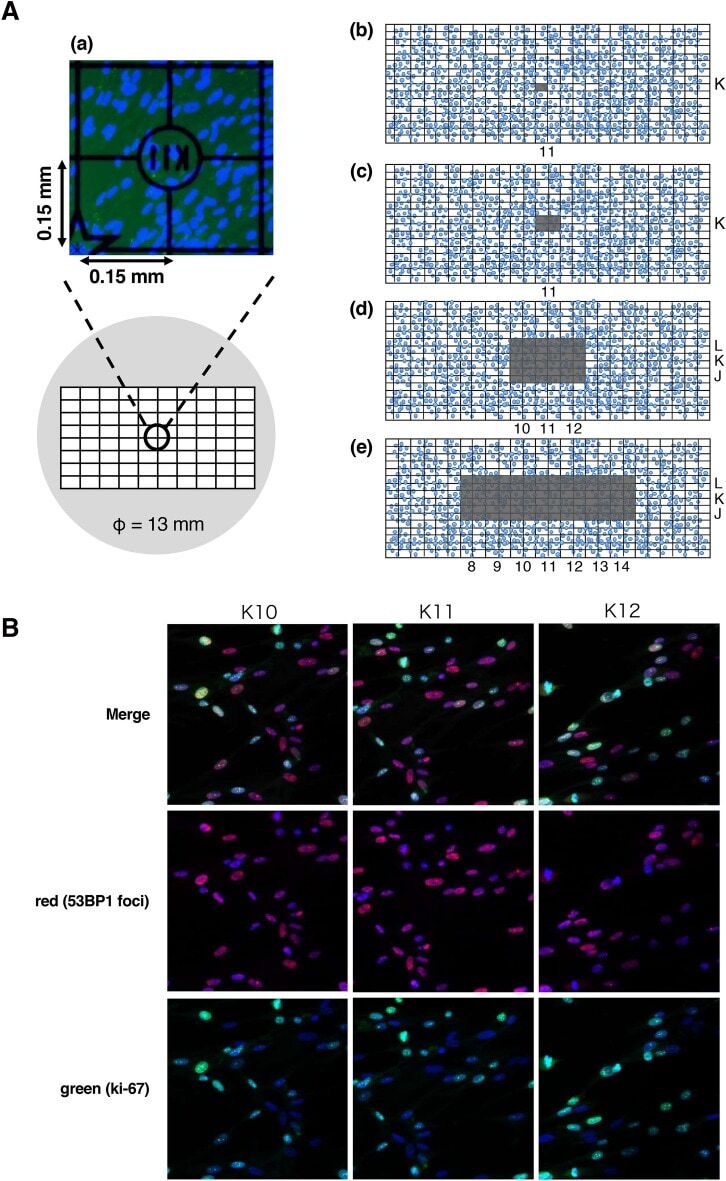
- Submitted by
- Invitrogen Antibodies (provider)
- Main image
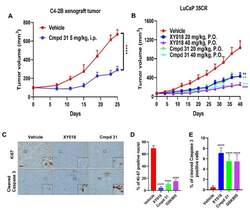
- Experimental details
- Figure 2 Orally administered RORgamma antagonists exhibit strong anti-tumor activities. ( A ) C4-2B cells were subcutaneously xenografted on the flanks of NOD-SCID mice. When tumors reached 100 mm 3 , mice were divided into two groups ( n = 8 tumors per group) and treated with vehicle or 5 mg/kg cmpd 31 (i.p.) five times per week for 25 days. Tumor volumes were monitored. ( B ) Mice with LuCaP-35CR PDX tumors were treated orally with RORgamma antagonists Cmpd 31 and XY018 (20 mg/kg or 40 mg/kg) or vehicle ( n = 8 tumors per group), five times per week. Tumor volumes were monitored. ( C ) Representative images from Ki-67 and cleaved-Caspase-3 immunohistochemistry of tumors from mice treated with 40 mg/kg of Cmpd 31, XY018, or vehicle. Scale bar: 50 um. ( D , E ) Quantitative analysis of anti-Ki-67 positive nuclei or anti-cleaved caspase 3 stained cells in LuCaP-35CR tumors. The percentage of positive nuclei or cells were calculated by dividing the number of positive nuclei or cells by the number of total nuclei or cells per visual field. Results are presented as mean +- SD. ** p < 0.01, *** p < 0.001, **** p < 0.0001.
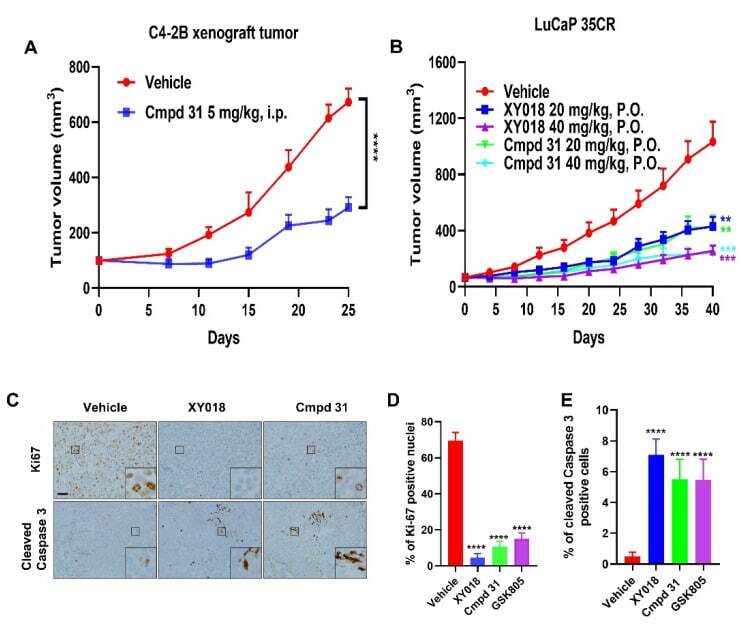
- Submitted by
- Invitrogen Antibodies (provider)
- Main image
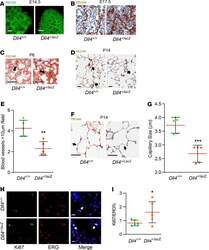
- Experimental details
- Figure 5 Dysmorphic vascular development in Dll4 mutant mice. ( A ) PECAM (green) whole-mount staining on E14.5 Dll4 +/+ and Dll4 +/lacZ mouse lungs, n = 4 per group. ( B ) PECAM (brown) and Harris Hematoxylin (H) (blue) staining on E17.5 Dll4 +/+ and Dll4 +/lacZ mouse lungs. PECAM staining indicates much denser vascular structure in Dll4 +/lacZ mouse lung at canalicular stage. Note: Lack of bronchioles in Dll4 +/lacZ lung, n = 5 per group. ( C ) PECAM (brown) and fast red (red) staining on P6 Dll4 +/+ and Dll4 +/lacZ mouse lungs. A double capillary network was visualized in Dll4 +/+ mice, but ""whorls"" of misaligned network were found in Dll4 +/lacZ mouse lung at early alveolar stage, n = 4 per group. The arrow points to the double capillary in the left panel, and the arrow points to the misaligned network in the right panel. ( D and F ) PECAM (brown) and H staining on P14 Dll4 +/+ and Dll4 +/lacZ mouse lungs. The arrows in ( D ) point to intermediate blood vessels, and the arrows in ( F ) point to the capillaries, with quantifications shown for intermediate blood vessel number ( E ) and capillary thickness ( G ), which were less at P14 in Dll4 +/lacZ mouse lung. n = 5 mice per group, ** P < 0.01, *** P < 0.001. ( H ) Ki67 (green), ERG (red), and DAPI (blue) staining on P14 mouse lung slides, with quantifications shown for Ki67 + cells percentage in total ERG + cells ( I ). n = 6 mice per group, P < 0.05. The arrows in ( H ) point to Ki67 + ERG + cells. Scale bars: 100 mum
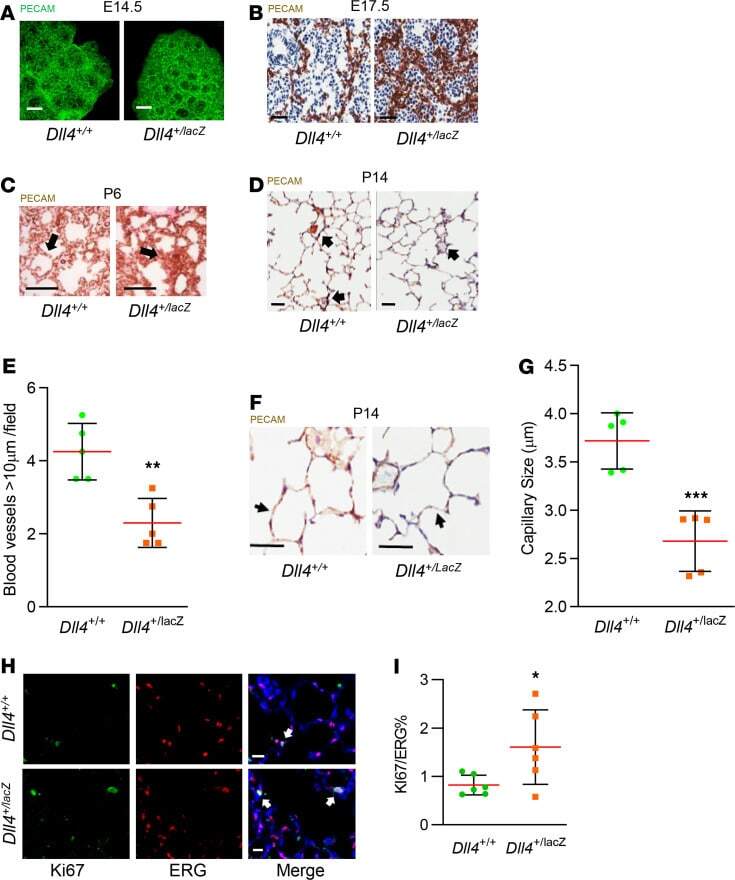
- Submitted by
- Invitrogen Antibodies (provider)
- Main image
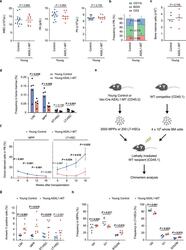
- Experimental details
- Fig. 1 ASXL1-MT causes dysfunction of HSPCs associated with increased apoptosis and altered cell cycle status. a Enumeration of white blood cells (WBC), hemoglobin (Hb), and platelets (Plt) in peripheral blood of young Vav-Cre ASXL1-MT KI mice ( n = 13 (Control), 11 (ASXL1-MT)). b Frequency of myeloid cells (CD11b + ), B cells (B220 + ), and T cells (CD3 + ) in peripheral white blood cells of young Vav-Cre ASXL1-MT KI mice ( n = 13 (Control), 11 (ASXL1-MT)). c Absolute numbers of bone marrow cells per leg in young Vav-Cre ASXL1-MT KI mice ( n = 5). d Frequency of LSK cells, multipotent progenitors (MPPs), short-term HSCs (ST-HSCs) and long-term HSCs (LT-HSCs) in bone marrow cells of young Vav-Cre ASXL1-MT KI mice ( n = 5). e The experimental design for competitive transplantation assays. 3000 MPPs or 200 LT-HSCs isolated from young control or young Vav-Cre ASXL1-MT KI mice were transplanted into lethally irradiated recipient mice with 4 x 10 5 whole bone marrow cells. f Levels of donor chimerism in peripheral blood were analyzed at the indicated weeks after transplantation ( n = 3 (Control), 4 (ASXL1-MT)). Data are mean +- s.e.m. g Apoptosis analysis of HSPCs of young Vav-Cre ASXL1-MT KI mice ( n = 7). h Cell cycle analysis with Ki-67/DAPI staining of MPPs (left panel) and LT-HSCs (right panel) of young Vav-Cre ASXL1-MT KI mice ( n = 5). Data are mean +- s.d. unless otherwise noted. * P
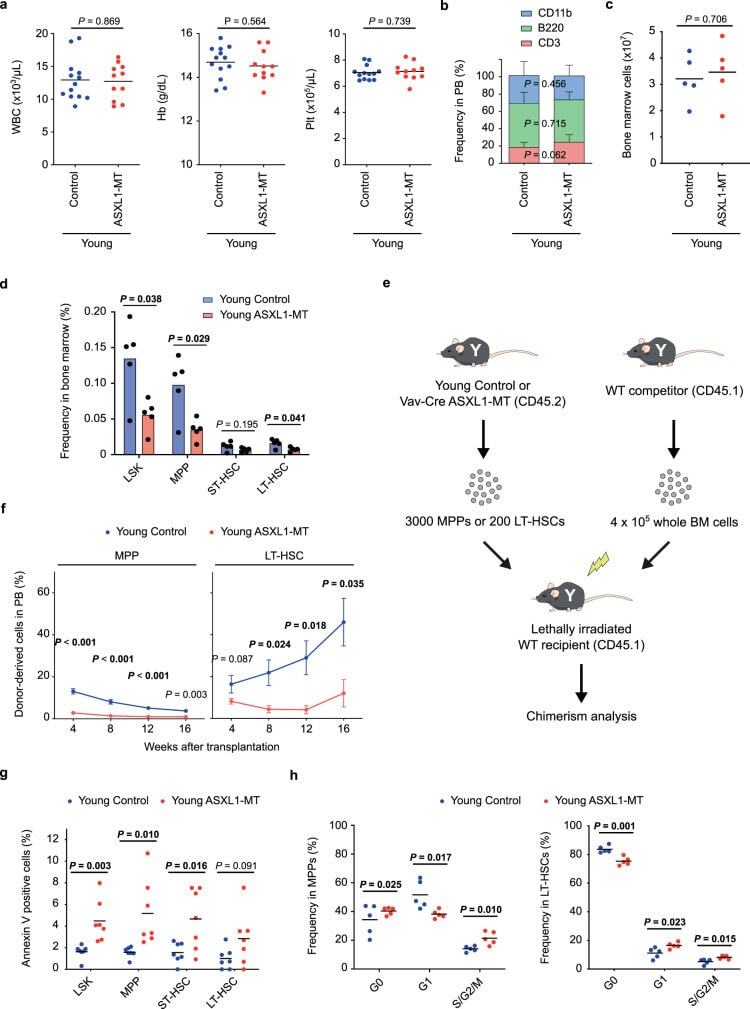
- Submitted by
- Invitrogen Antibodies (provider)
- Main image
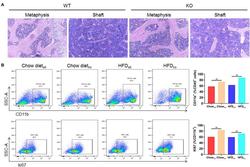
- Experimental details
- FIGURE 6 The proliferation of cells from the bone marrow mononuclear phagocyte system is increased in LAMTOR1 MKO mice. (A) HE staining of the bone marrow. (B) Flow cytometry analysis of bone marrow cells. The results refer to the bone marrow of the left femurs since both left and right femoral bone marrow displayed the same results. n = 4. ** P < 0.01 vs. WT. HFD, high-fat diet; KO, myeloid-specific knockout mice; WT, wild-type.
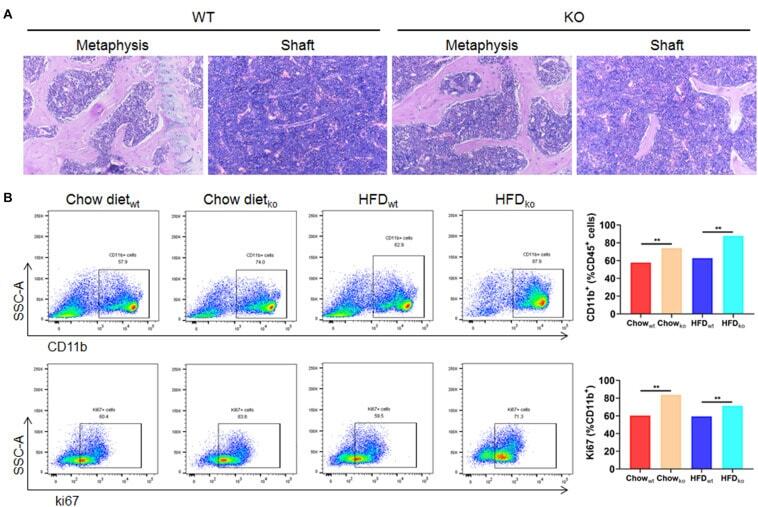
- Submitted by
- Invitrogen Antibodies (provider)
- Main image

- Experimental details
- Figure 4. Expression of Hoxa11 affects survival of MLL/AF10 leukemia mice. (A and C) Reverse transcription-quantitative PCR analyses were performed to determine Hoxa11 expression in (A) Hoxa11 -knockdown APm-1 (APm-1-shH11-1, APm-1-shH11-2) and control (APm-1-shV) cell lines, or in (C) Hoxa11 -overexpression 12G (12G-H11-1, 12G-H11-2) and control (12G-V1 and 12G-V3) cell lines. Assays were performed in triplicate and data shown are representative of three independent experiments. Error bars indicate SD. (B and D) Survival curves of mice i.p. injected with (B) APm-1-shV or APm-1-shH11-2, and (D) 12G-V1 or 12G-H11-1 cells. Survival analysis was conducted according to the Kaplan-Meier method. **P
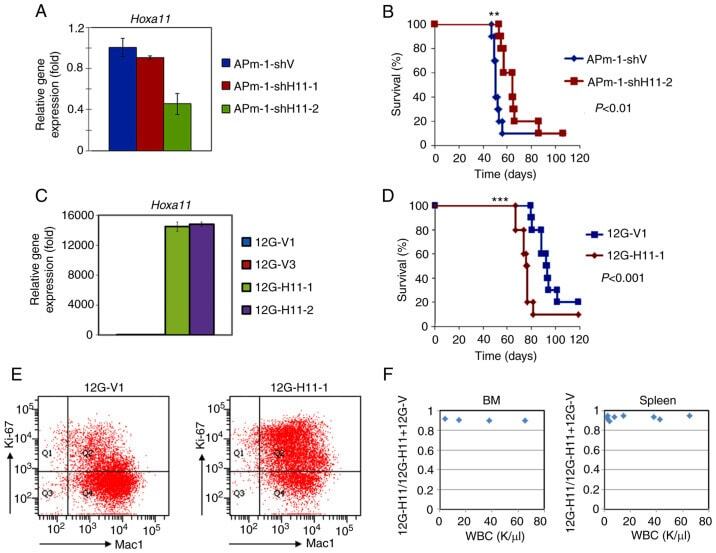
- Submitted by
- Invitrogen Antibodies (provider)
- Main image
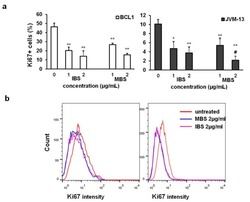
- Experimental details
- Figure 3 IBS and MBS attenuate the expression of Ki67 in BCL1 and JVM-13 cells. ( a ) Percentage of Ki-67 positive BCL1 and JVM-13 cells exposed to IBS and MBS (concentrations = 1 and 2 ug/mL) for 24 h determined by flow cytometry presented as the mean + SD from three independent experiments. Data were analyzed with Student's t -test: * p < 0.05; ** p < 0.01, # p < 0.05 (indicates differences between two doses of MBS). ( b ) Representative histograms of Ki67 expression (mean fluorescence intensity) in BCL1 and JVM-13 cells.

- Submitted by
- Invitrogen Antibodies (provider)
- Main image
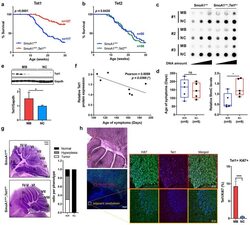
- Experimental details
- Fig. 4 Elevated Tet1 is essential for MB progression. a , b Kaplan-Meier curves show the significant increase in survival from SmoA1 +/+ mice crossed with hemizygous deletion of Tet1 ( a p < 0.0001; log-rank test), but not crossed with hemizygous deletion of Tet2 ( b p = 0.5830; log-rank test). c , d 5hmC dot blot analysis shows significant increase in 5hmC levels in tumors from SmoA1 +/+ ; Tet1 +/- mice ( n = 5; 3 representative samples shown) compared to tumors from SmoA1 +/+ ( n = 5; 3 representative samples shown) despite similar ages of tumor-associated symptoms shown in box plot below dot blot ( n = 5 per group). e Tet1 protein expression is significantly higher in SmoA1-MBs ( n = 7) compared to corresponding NCs ( n = 4) ( p < 0.05). f Pearson correlation between Tet1 expression and age-of-onset (Pearson R 2 = 0.5059, * p = 0.0366). g H&E staining (left) and ratio per phenotype (right) of 12-week-old SmoA1 +/+ mice in the presence of either wild-type or hemizygous deletion of Tet1 ( p < 0.0001; Welch's t -test). h Fluorescence microscopy of normal cerebellum and MB with Ki67 (red) and Tet1 (green) in 12-week-old SmoA1 +/+ mice showing Tet1 expression is significantly higher in Ki67-positive cells (blue: DAPI, **** p < 0.001)
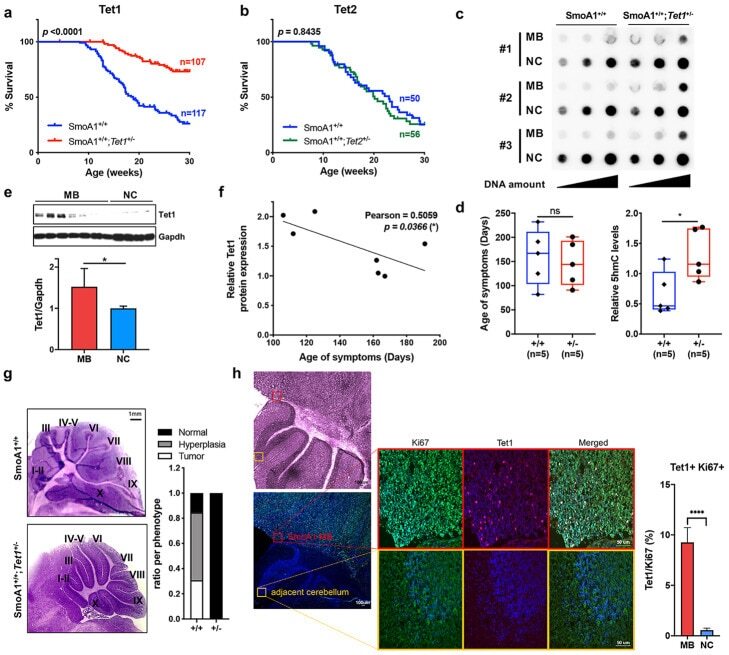
- Submitted by
- Invitrogen Antibodies (provider)
- Main image
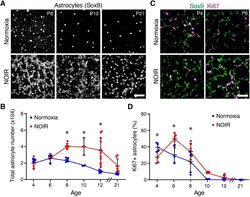
- Experimental details
- Fig. 3. Astrocyte proliferation is suppressed by high oxygen and stimulated by return to room air. (A) Representative en-face confocal images of Sox9, an astrocyte nuclear marker. (B) Summary of total astrocyte numbers quantified from images similar to those in A. Astrocyte numbers were significantly higher in NOIR-exposed animals from P8-P12. At P21 there was no group difference but some NOIR animals had nearly triple the number of astrocytes as controls. (C,D) Sox9 and Ki67 double labeling was used to identify mitotically active astrocytes. C shows representative images and D shows quantification of astrocyte proliferation. At P4, proliferation was reduced in NOIR retinas. After return to normoxia, proliferation was increased compared with controls. (B) Two-way ANOVA with Holm-Sidak post-hoc test: main effect of age F (5,46)=11.67, P
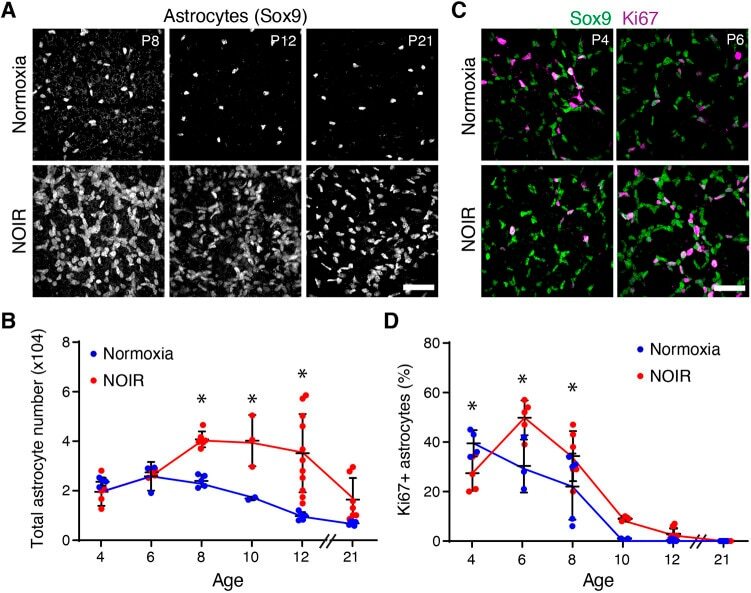
- Submitted by
- Invitrogen Antibodies (provider)
- Main image
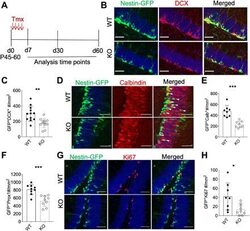
- Experimental details
- Fig. 3 Genetic lineage tracing shows fewer adult born neurons from Tcf4 -deleted nestin -expressing progenitors. ( A ) Schematic for genetic lineage tracing experimental regime. ( B and C ) Representative images (B) quantitation (C) of genetic reporter-based tracing of progenitors 30 days after deletion for DCX expression. ( D ) Genetic reporter-based tracing of progenitors 60 days after deletion for Calbindin expression. ( E and F ) Quantitation of genetically traced Calbindin+ve and Prox1+ve mature neurons. ( G and H ) Representative images (G) quantitation (H) of genetic lineage tracing for Ki67+ve progeny at day 7 after deletion. n = 3 animals per genotype, each dot represents a section from a brain, and error bar represents SD. (unpaired t test, * P < 0.01, ** P < 0.001, and *** P < 0.0003). Scale bars, 50 mum.
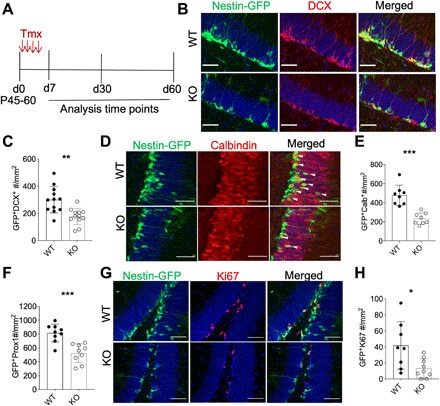
- Submitted by
- Invitrogen Antibodies (provider)
- Main image
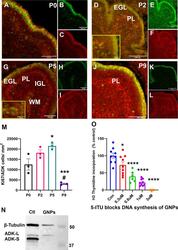
- Experimental details
- Figure 5. Effect of ADK on DNA synthesis in the developing CB. A , ADK (red) and Ki67 (green) IR in the mouse CB at different developmental stages (P0, P2, P5, and P9) as revealed by double immunofluorescence. A-C , At P0, ADK/Ki67 double-labeled cells are widespread in the entire developing cerebellar cortex with robust expression at the outermost EGL. D-F , At P2, the layers of cerebellar cortex become visible where ADK/Ki67-positive cells are observed in the external granular layer (EGL), the developing Purkinje layer (PL), and the internal granular layer (IGL). G-L , At P5 and P9, ADK/Ki67-labeled cells initially increase then decrease in the EGL, which period coincides with the radial migration of cerebellar granular neurons. G , In the internal white matter (WM) region at P5, a population of ADK/Ki67-positive cells was observed, which declined in P9 ( H ). Scale bars: 100 mum ( A-C , G-L ), 200 mum ( D - F ), 25 mum ( D , G , insets). M , The number of Ki67/ADK double labeled cells in the EGL at P0, P2, P5, and P9 per mm 2 ( n = 3/group). One-way ANOVA with Tukey's multiple comparisons post hoc test (* p < 0.05 for P5 vs P0, # p < 0.05 for P9 vs P0, and *** p < 0.001 for significance). N , Western blot analysis of immature granular neuronal precursors (GNPs). Representative blot of protein extracts from control (Ctl) glioblastoma U373 cells and immature GNPs shows that the precursors express ADK-L exclusively whereas control cells express both isoforms. O , Inhibition o
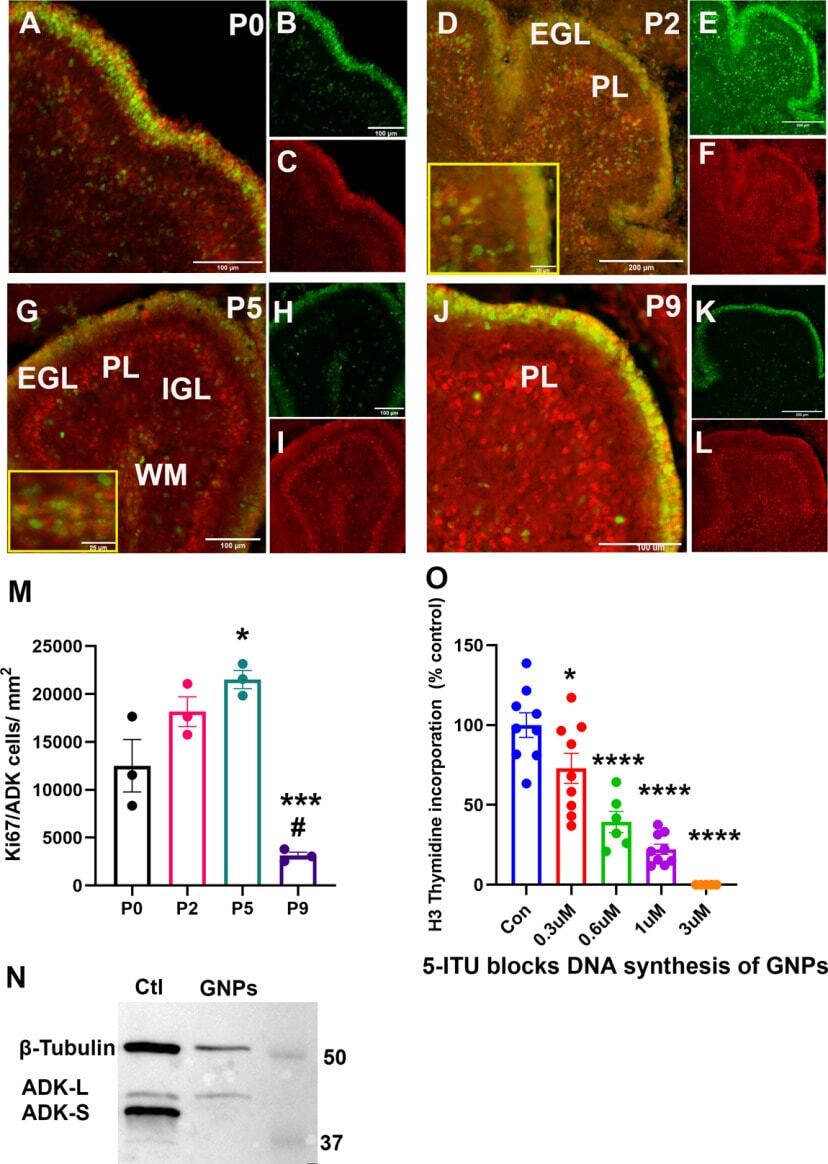
- Submitted by
- Invitrogen Antibodies (provider)
- Main image
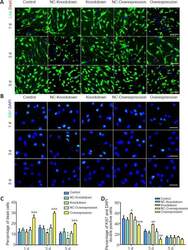
- Experimental details
- Figure 2 Changes in lncRNA Vof-16 expression affect neuronal survival and proliferation in vitro . To observe the role played by lncRNA Vof-16 on cell survival and proliferation, the neuron-like PC12 cells were transfected with lncRNA Vof-16 overexpression or knockdown lentivirus or negative control (NC) vectors. (A and C) The overexpression of lncRNA Vof-16 using a lentivirus significantly decreased PC12 cell viability. Representative picture (A) and quantification (C) of live/dead staining performed on PC12 cells 1, 3, and 5 days after transfection with lncRNA Vof-16 lentivirus. The blue arrows indicate dead cells. (B and D) Representative image (B) and quantification (D) of Ki67 staining performed in PC12 cells 1, 3, and 5 days after transfection with lncRNA Vof-16 lentivirus. The knockdown of lncRNA Vof-16 promoted PC12 cell proliferation. The fluorescent indicator is fluorescein isothiocyanate for Ki67 (green). Scale bars: 50 um in A and 25 um in B. Data are expressed as the mean +- SD ( n = 3). * P < 0.05, ** P < 0.01, *** P < 0.001, vs . control group (one-way analysis of variance, followed by Tukey's post hoc test). Control: Without any treatment; NC-Knockdown: transfected with knockdown negative control vector; Knockdown: transfected with lncRNA Vof-16 knockdown lentivirus; NC-Overexpression: transfected with overexpression negative control vector; Overexpression: transfected with lncRNA Vof-16 overexpression lentivirus. DAPI: 4',6-Diamidino-2-phenylindole; lncRNA: l
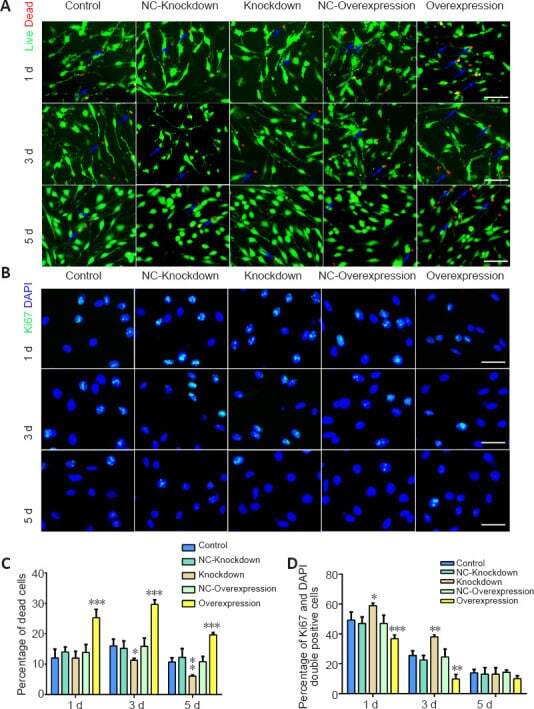
- Submitted by
- Invitrogen Antibodies (provider)
- Main image

- Experimental details
- Figure 4 Increased expression of Ki67 in NEIL3-deficient colonic epithelial cells. ( a ) Representative immunohistochemistry images of large bowel sections from Apoe -/- Neil3 -/- and Apoe -/- mice stained with nuclei marker DAPI (blue) and proliferation marker anti-Ki67 (green). ( b ) Relative abundance of Ki67-positive cells. Data are presented as mean +- SEM, Student's t test, * p < 0.05, n = 5.
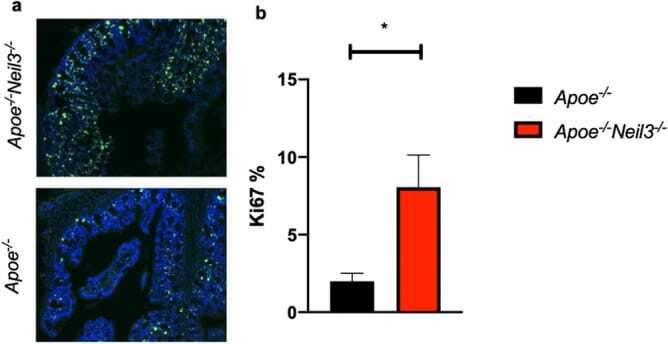
- Submitted by
- Invitrogen Antibodies (provider)
- Main image

- Experimental details
- Figure 3 High TWIK-1 expression in immature neurons of the DG in TWIK-1 BAC-GFP Tg mice. ( A ) Representative co-immunofluorescence images with GFP, DCX, CB, and Ki67 in P56 of DG. Scale bar, 200 mum. ( B ) Enlarged inset from A. Most of strong GFP-expressing cells co-labeled with DCX (yellow arrow), but not with CB and Ki67 (white arrow). Scale bar, 10 mum. ( C , D ) Quantification of the cell type of strong GFP-expressing cells. Raw data are listed in Supplementary Materials Table S1 . Data are presented as the Mean +- SEM.
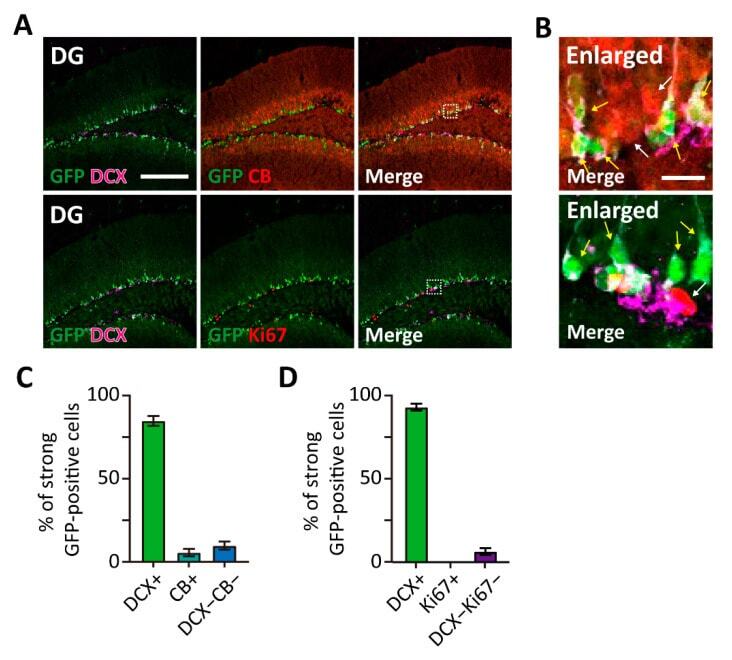
- Submitted by
- Invitrogen Antibodies (provider)
- Main image
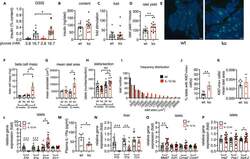
- Experimental details
- Figure 4 Deletion of IL-1beta increases beta cell mass and insulin secretion in isolated islets (A-D) GSIS of isolated islets of 52-weeks-old IL-1beta ko (red) and littermate WT control (black) mice; (A) 1 h insulin secretion expressed as percentage of the insulin content per mouse; (B) insulin content per islet; (C) insulin fold stimulation by glucose, (mean of 4 x 10 islets per mouse); (D) number of islets isolated per mouse; n = 11-12 WT and n = 13-14 IL-1beta ko mice. (E) Example of immunohistochemical staining of pancreata from IL-1beta ko and WT control mice (green = insulin, blue = DAPI, scale bar, 400 mum). (F and G) Beta cell mass and mean islet area from 3-4 sections/mouse of 24- and 52-week-old WT and IL-1beta ko mice. (H) Number of islets per pancreas section. (I) Frequency distribution of islet area from 52-week-old IL-1beta ko mice and WT mice. (J) Percentage of islets with one or more Ki67+/ins+/DAPI + cell(s); 472 islets from 4 IL-1beta ko mice and 509 islets from 6 littermate control mice were analyzed. (K) Ki67+/ins+/DAPI + normalized to the mean ins + islet area. (L, N-P) Relative gene expression of 52-week-old IL-1beta ko versus littermate WT control mice; (L and N) IL-1 family genes in islets and liver; (O) cell-cycle genes in islets; (P) islet genes. (M) Plasma IL-1Ra in 52-week-old IL-1beta ko and control WT mice. All data were expressed per mouse. Statistics: (A, F-H) two-way ANOVA and Sidak's multiple comparison test; (B-D, and J-P) Student's t test;
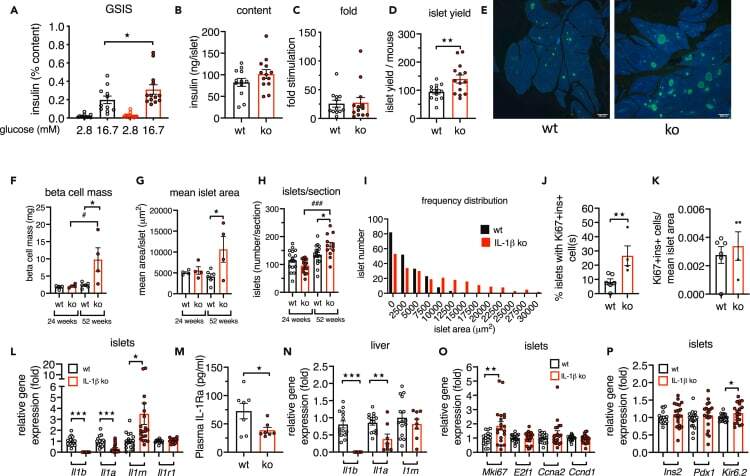
- Submitted by
- Invitrogen Antibodies (provider)
- Main image

- Experimental details
- Figure 4 Upregulated pathways in LSECs during acute liver injury (A) PCA of LSECs from healthy livers and livers after an acute injury by CCl 4 administration. (B) Schematic representation of pathway analysis from LSECs isolated after CCl 4 administration. (C) Immunofluorescence staining of Lyve1/Ki67, immunohistochemistry staining and quantification of Collagen 4 (* P
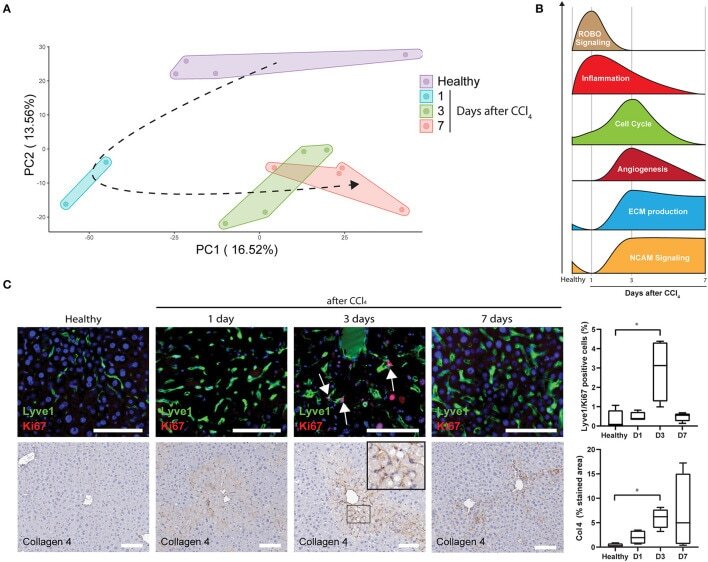
- Submitted by
- Invitrogen Antibodies (provider)
- Main image
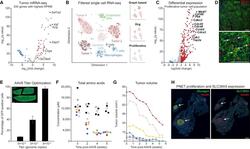
- Experimental details
- Figure 2 PNETs from Gcgr Knockout Mice Are Amino Acid Dependent and Dominantly Composed of Proliferative SLC38A5 + Tumor Cells (A) Analysis of bulk RNA-seq data from tumors and neighboring pancreatic control tissue from aged homozygous Gcgr knockout mice. (B) tSNE visualization of single-cell RNA-seq data from dispersed tumors, with insets showing graph-based clustering, Gcg UMI counts, and proliferation signatures for tumor cells. (C) Differential expression analysis of tumor cells classified as having a proliferative signature based on hallmark expression of MKI67 and cyclin-dependent kinases. (D) SLC38A5 and MKI67 co-immunostaining in mouse PNET tissue. Scale bars, 100 mum. (E) GFP immunostaining of liver tissues for quantification of AAV8 titer efficiency. The liver tissue section represents a 5 x 10 12 unit titer. Three biological replicates per virus concentration. Scale bar, 1 mm. (F) Time-course analysis of blood amino acid concentrations in aged homozygous Gcgr knockout mice transduced with AAV8- Gcgr (colored symbols) and aged Gcgr knockout control mice (black and white symbols). (G) Ultrasound quantification of tumor volume in aged homozygous Gcgr knockout mice transduced with AAV8- Gcgr . Data point colors correspond to unique mice across (F) and (G). (H) Whole-slide glucagon, insulin, and SLC38A5 immunostaining of pancreas tissues from tumor-bearing Gcgr homozygous knockout mice that were transduced with AAV8 engineered for liver-specific expression of Gcgr . Sca
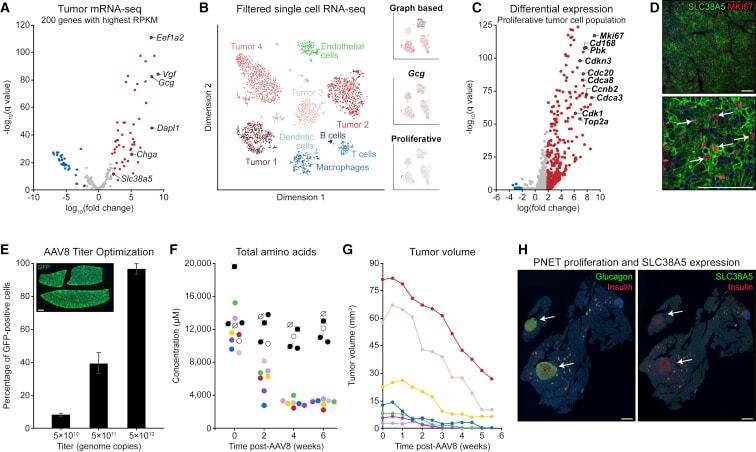
- Submitted by
- Invitrogen Antibodies (provider)
- Main image
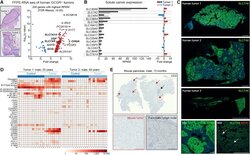
- Experimental details
- Figure 4 Human GCGR -Mutant, Alpha Cell-Derived PNETs Dominantly Express the Amino Acid Transporter SLC7A8 + and Exhibit an Immune Desert-like Phenotype (A) Analysis of bulk RNA-seq data from two human tumor biopsies obtained from patients harboring premature stop codons or missense mutations in both GCGR alleles. Scale bars, 5 mm. (B) Reads per kilobase of transcript, per million mapped reads (RPKM) expression analysis and fold change for human solute carrier genes. Amino acid transporters are highlighted by dashed boxes. (C) Whole-slide SLC7A8 immunostaining of three GCGR mutant human tumor biopsies. Scale bars, 2.5 mm and 250 mum. (D) Multiplexed digital spatial profiling of mTOR signaling-related and immune cell-related markers using two FFPE human tumor sections. (E) Whole-slide CD3 immunostaining of mouse pancreas tissue harboring multiple tumors with an in-tissue pancreatic lymph node as a positive control. Scale bars, 250 mum.
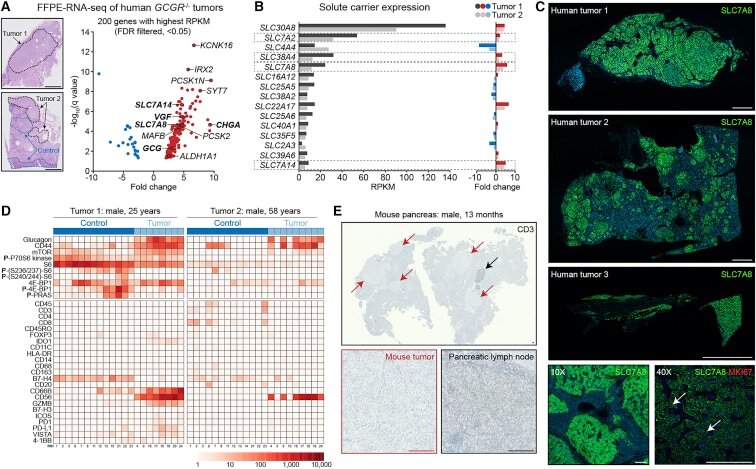
- Submitted by
- Invitrogen Antibodies (provider)
- Main image
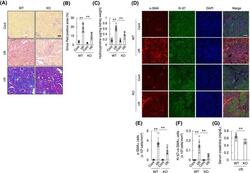
- Experimental details
- FIGURE 7 Genetic deletion of OASIS resulted in decreased kidney fibrosis after ischemia and reperfusion. WT and OASIS KO mice were subjected to unilateral renal I/R. A, Three weeks post I/R, the kidney sections were stained with Sirius Red (upper and middle panel) or Masson's trichrome (lower panel). Representative images are shown. Bar: 50 um. B, Sirius Red positive area was evaluated. C, Hydroxyproline content in the kidney tissues was evaluated. D, Immunofluorescence analysis was performed with anti-Ki-67 antibody, anti-alpha-SMA antibody, and DAPI. Representative images are shown. Bar: 50 um. E and F, The number of alpha-SMA+ cells (E) and the number of Ki-67 + alpha-SMA+ cells (F) was counted. ** P < .01 by one-way ANOVA followed by Dunnett test. G, Serum creatinine level was measured 3 weeks after I/R. ** P < .05 by student's t test . Data are shown as mean +- SD (n = 6 for WT, n = 5 for KO)
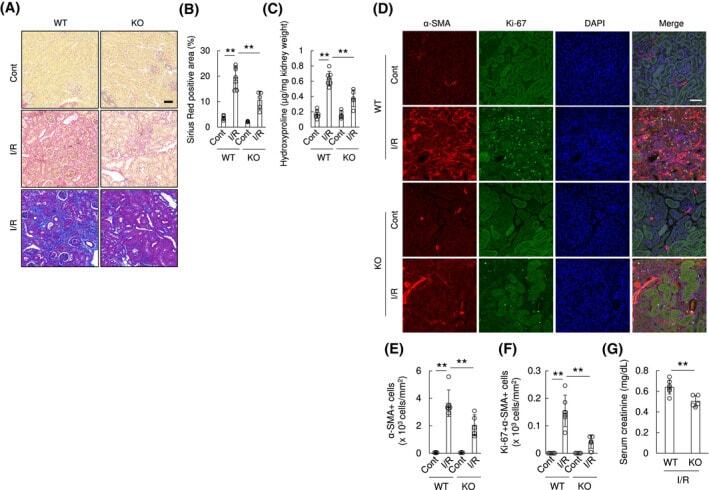
- Submitted by
- Invitrogen Antibodies (provider)
- Main image

- Experimental details
- Figure 3. GCPs are divided into two subgroups Notch signaling ON and OFF cells in vivo . A-E , Hes1 promoter activity was stronger in GCPs than GCs ( A , B ). Heterogeneity was observed in Hes1 promoter activities among (KI67-positive) GCPs in the oEGL ( C-E ). The dashed line represents the threshold of intensity visible by eye ( D , E ). Animal numbers: N = 3 for the analysis of B and N = 7 for D,E . Scale bars: 45 mum ( A ) and 20 mum ( C ). Data are shown as mean +- SEM; ** p < 0.01, Student's t test.
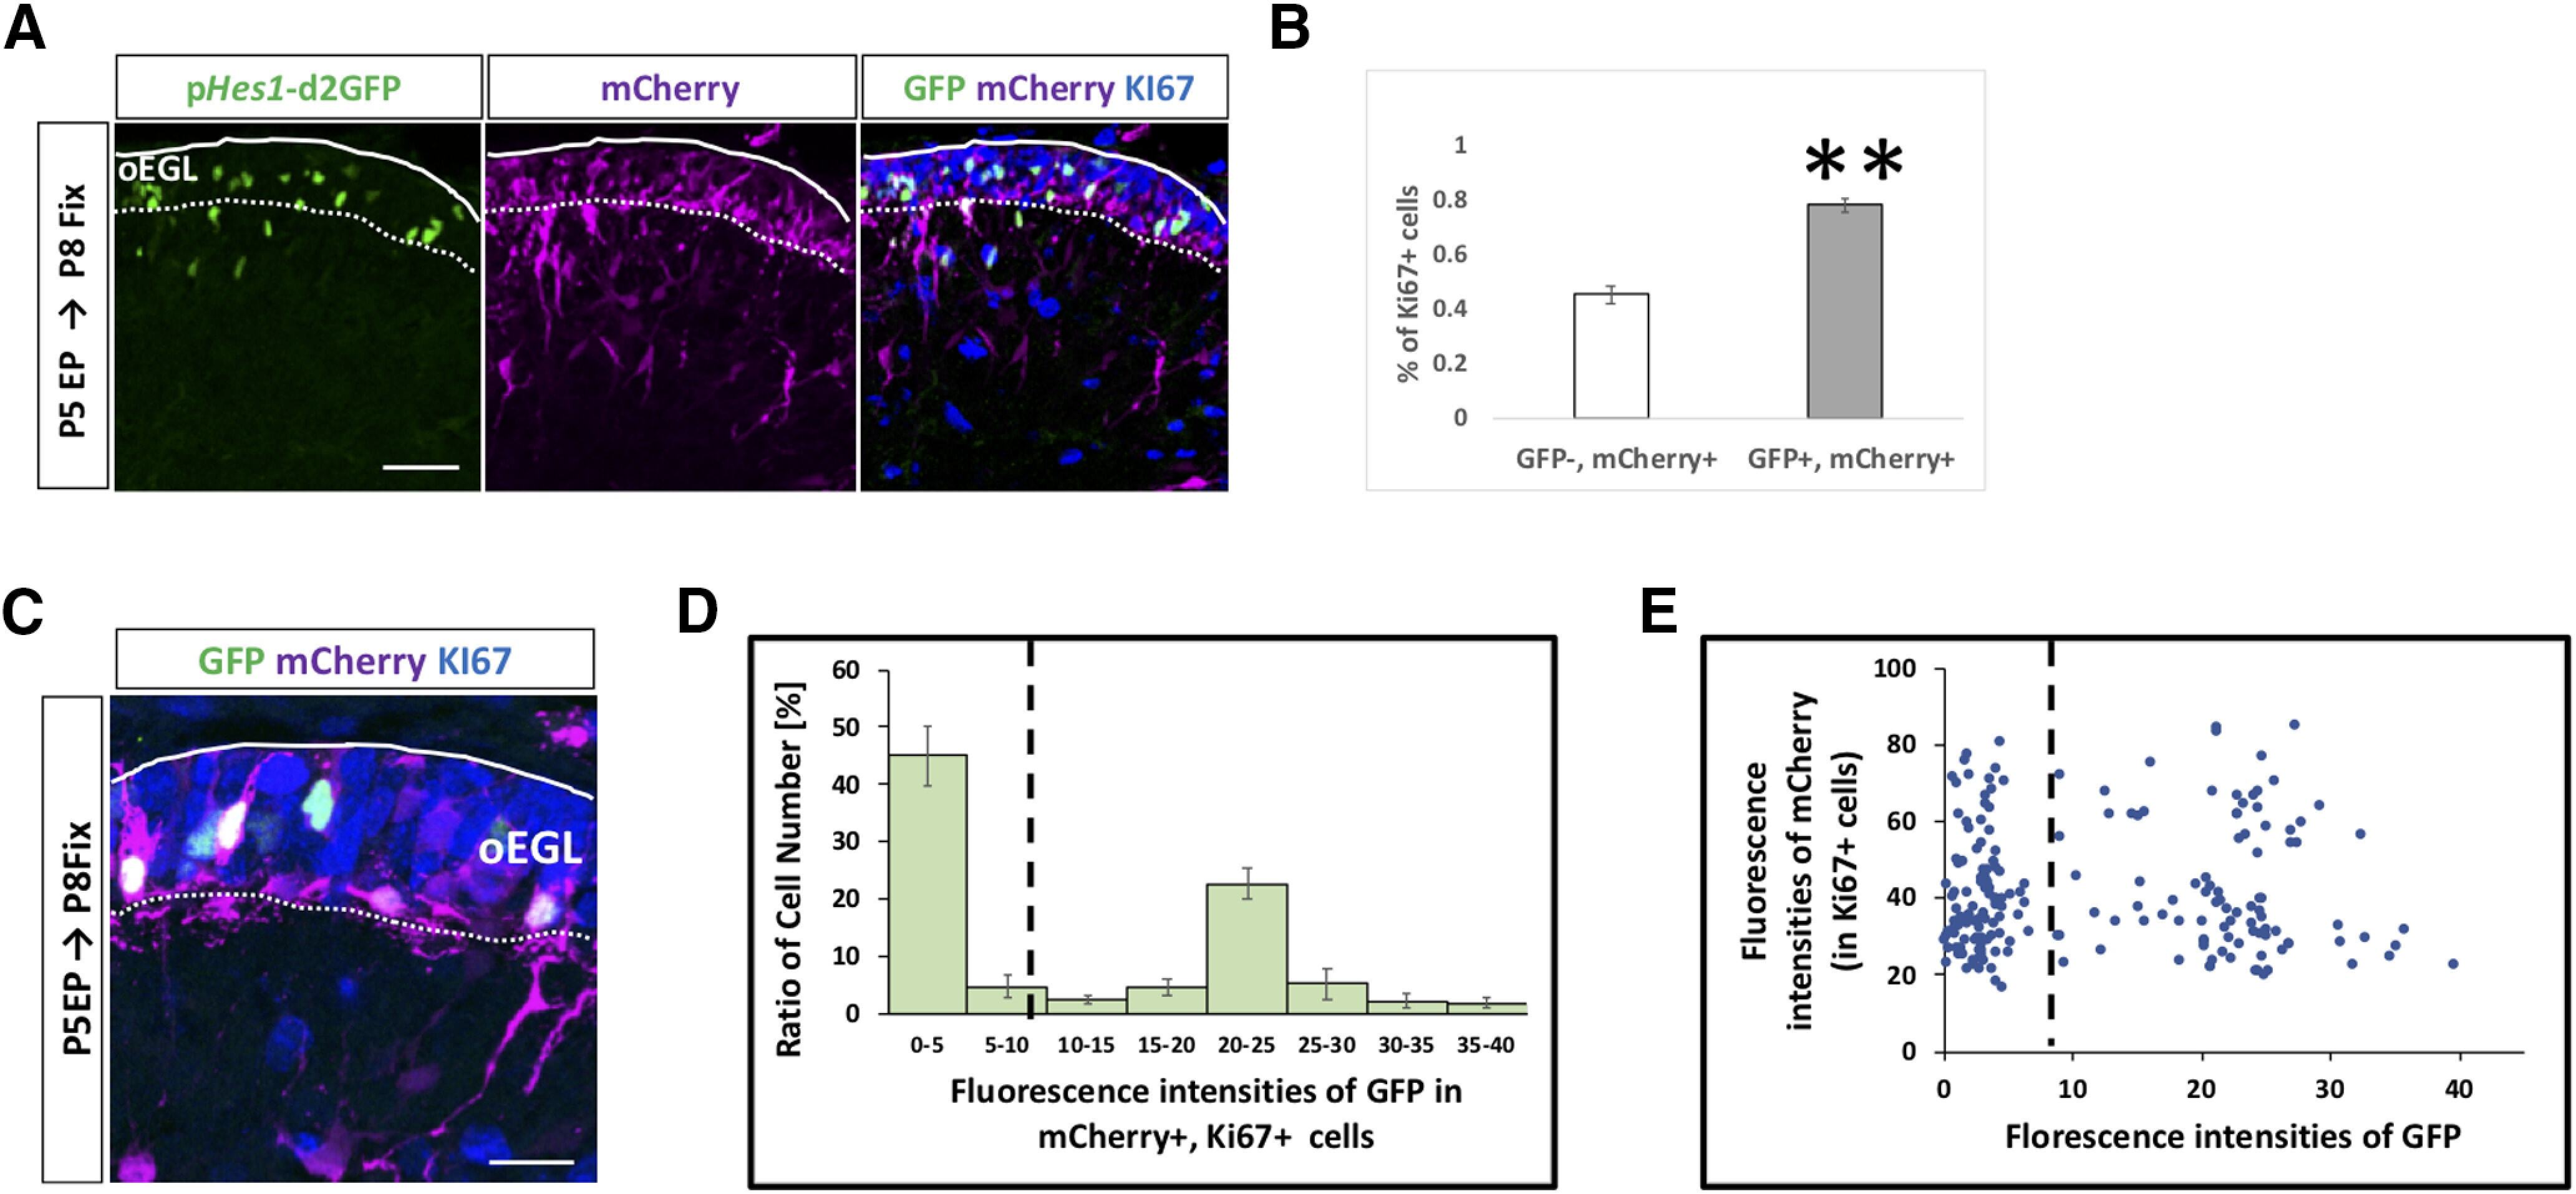
- Submitted by
- Invitrogen Antibodies (provider)
- Main image
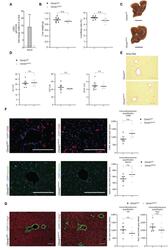
- Experimental details
- Figure 2 Hepatic endothelial Ctnnb1 overactivation does not lead to hepatopathy and fibrosis. (A) qRT-PCR for axis inhibition protein 2 ( Axin2 ) of cDNA from freshly isolated LSECs of 2-months-old Ctnnb1 OE - EC mice compared to corresponding Ctnnb1 WT controls ( n = 3). beta-Actin was used as housekeeping gene. ** p < 0.01. (B) Liver weight, liver-to-body weight ratio of 2- to 3-month-old Ctnnb1 WT and Ctnnb1 OE - EC mice (female, n >= 4). Results are represented as mean +- SEM. ns, not significant. (C) Macroscopic liver images of 3-month-old Ctnnb1 WT and Ctnnb1 OE - EC mice (female, n = 4). Scale bar 1 cm. (D) Liver enzymes [aspartate aminotransferase (AST), alanine aminotransferase (ALT), and glutamate dehydrogenase (GLDH)] in serum of 2- to 3-month-old female Ctnnb1 WT and Ctnnb1 OE - EC mice ( n >= 3). Results are represented as mean +- SEM. n.s., not significant. (E) Sirius red staining of liver sections of 2- to 3-month-old male Ctnnb1 WT and Ctnnb1 OE - EC mice ( n = 4). Scale bar 100 mum. (F) Immunofluorescence (IF) staining of DAPI, CD68 and Desmin, and CD68 and Desmin quantification in the liver of 2- to 3-month-old female Ctnnb1 WT and Ctnnb1 OE - EC mice ( n >= 4). Scale bar 100 mum. Results are represented as mean +- SEM. ns, not significant. (G) IF staining of DAPI, glutamine synthetase (GS) and arginase (Arg1), and GS and Arg1 quantification in the liver of 2- to 3-month-old Ctnnb1 WT and Ctnnb1 OE - EC mice ( n = 4). Scale bar 100 mum. Results are represent
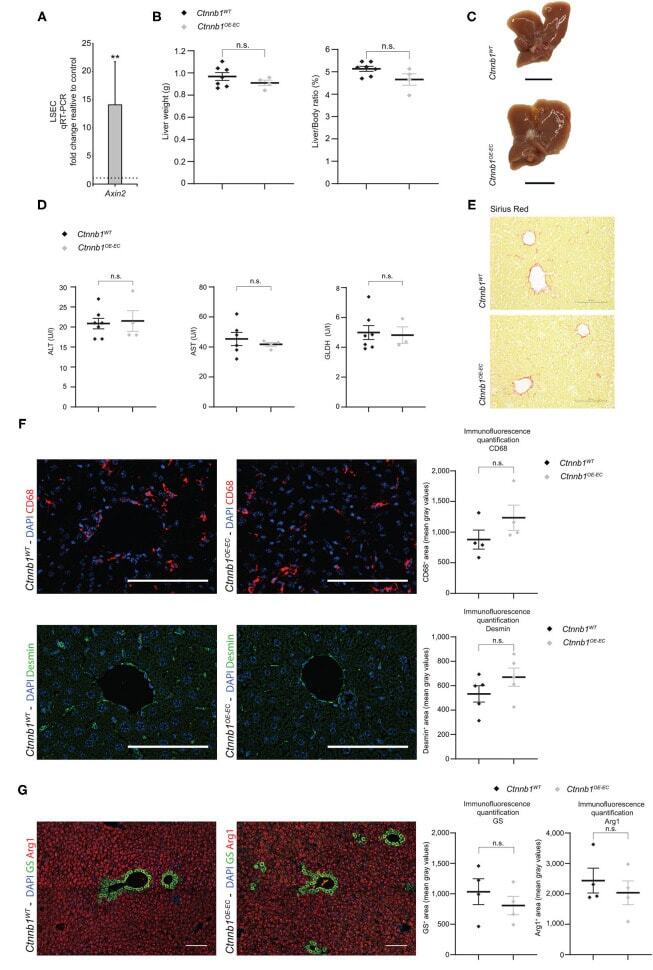
- Submitted by
- Invitrogen Antibodies (provider)
- Main image
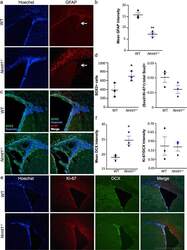
- Experimental details
- Fig. 4 At P14, Nrmt1 -/- mice exhibit an expansion of the IPC and neuroblasts pools in the SVZ. a , b GFAP staining is significantly decreased in the SVZ (arrows) of Nrmt1 -/- mice. However, there is a significant increase in c , d SOX2-positive IPCs and e , f Doublecortin (DCX)-positive neuroblasts in Nrmt1 -/- mice. Neither the d percentage of SOX2, Ki-67 double-positive cells, or the f ratio of Ki-67/DCX intensity in Nrmt1 -/- mice is significantly different from WT, indicating proliferation is not occurring at these stages. * p < 0.05 and ** p < 0.005 as determined by unpaired t -test, n = 3. Error bars represent mean +- SEM. Scale bar = 1000 mum.

- Submitted by
- Invitrogen Antibodies (provider)
- Main image
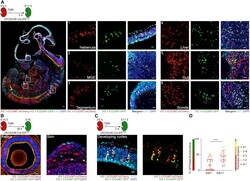
- Experimental details
- Figure 3 iCOUNT visualizes cell division history in embryonic tissues (A) Overview of iCOUNT mouse at E11.5 (recombination using TAM at E9.5). Right panels show mCherry (red), GFP (green), and KI67 (light blue) signals in tissues indicated. (B) Overview of the developing retina and skin in iCOUNT embryos induced with TAM at E14.5 and analyzed at E16. (C) iCOUNT-targeted cells in the developing cortex. (D) Graph shows quantification of green/total fluorescence and predicted division numbers of cells grouped by KI67 expression (mean +- SD). Nuclei were counterstained with DAPI (blue). n >= 28 cells derived from >= 3 embryos (D). **** p < 0.0001. Images were stitched. Scale bars represent 100 mum in (A) and (B) (retina), and 20 mum in (A, right panels), (B) (skin), and (C). See also Figure S3 .
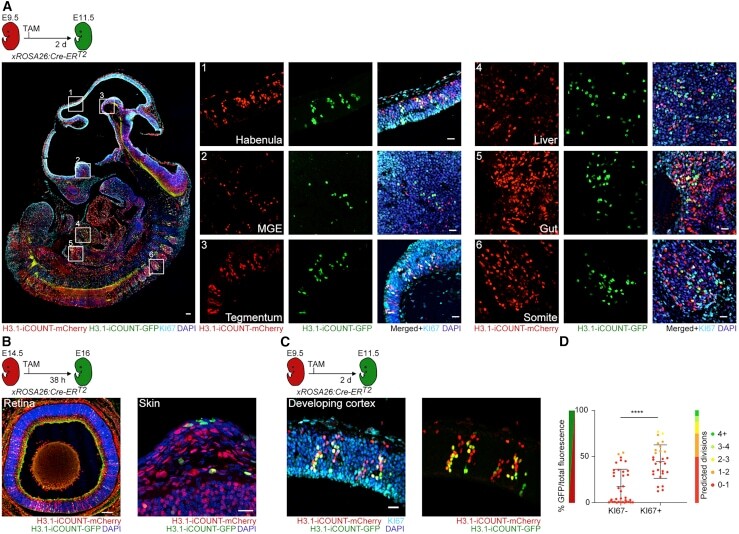
- Submitted by
- Invitrogen Antibodies (provider)
- Main image
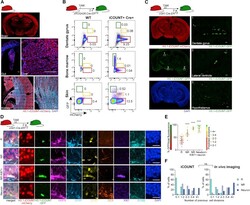
- Experimental details
- Figure 5 iCOUNT signal in adult mouse tissues (A) Overview of an adult iCOUNT mouse with expression of the tagged H3.1 in diverse tissues as indicated. (B) FACS analyses of cells with distinct red/green histone ratios in diverse tissues as indicated. Left panel shows controls, and right panel shows cells expressing newly synthesized (green) histones after inducible Cre-based recombination. (C) Conditional recombination in adult NSPCs identifies iCOUNT-targeted cells in the adult brain. Left panels show overview, and boxed areas are shown in higher magnification (right panels). (D) 4i-based phenotyping of Cre-targeted cells in the adult hippocampus using a panel of protein markers as indicated reveals radial glia-like NSPCs (R), non-radial glia-like NSPCs (NR), actively dividing NR (KI67+), and newborn neurons. (E) Quantification of green/total fluorescence and predicted division numbers of cells in the adult hippocampus 2 weeks after Cre-based recombination (mean +- SD). (F) Number of previous cell divisions based on iCOUNT and chronic intravital imaging. Note the comparable distribution among R, NR, and newborn neurons. Nuclei were counterstained with DAPI (blue). n >= 10 cells derived from >= 3 mice (E). **** p < 0.0001, ns, not significant. Images were stitched. Scale bars represent 100 mum in (A) and (C) and 20 mum in (C, right panels) and (D). See also Figure S5 .
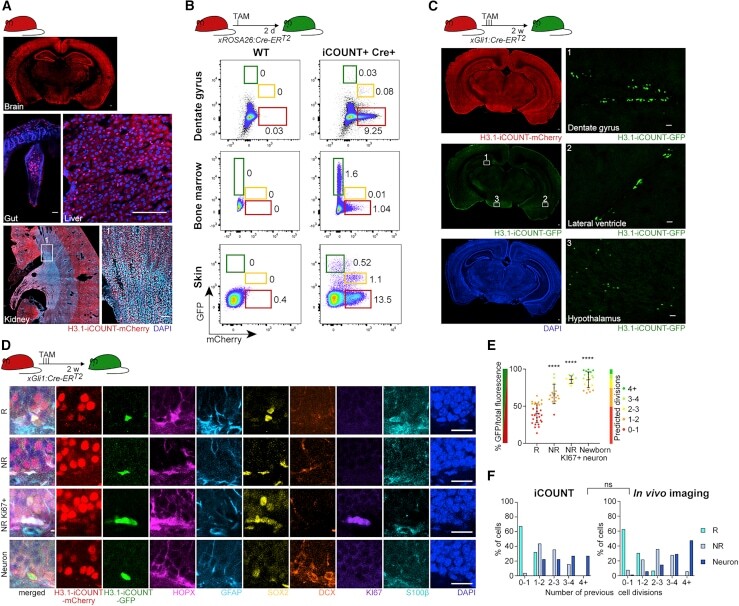
- Submitted by
- Invitrogen Antibodies (provider)
- Main image
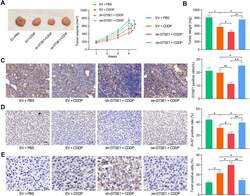
- Experimental details
- Fig. 5 GTSE1 affects tumorigenesis of OS cells in nude mice following CDDP treatment. A Growth rate of xenograft tumors in each group of mice (two-way ANOVA); B weight of the xenograft tumors in each group of mice (one-way ANOVA); C , D GTSE1-positive ( C ) and Ki-67-positive ( D ) cells in xenograft tumors examined by IHC staining (one-way ANOVA); E portion of apoptotic cells in xenograft tumors determined by TUNEL assay (one-way ANOVA). Data were presented as the mean +- SD from three repetitions. * p < 0.05, ** p < 0.01

- Submitted by
- Invitrogen Antibodies (provider)
- Main image

- Experimental details
- Enhanced Mph proliferation by hAM-MSCs via CCL2 and TGF-beta1 pathways Mouse bone marrow-derived Mph were cultured with or without hAM-MSCs in a non-contact co-culture model for 48 h. (A) Phase-contrast images showing the Mph frequency. Mph were dissociated for cell number counts, the results of which are presented in the chart. Scale bars, 400 mum. n = 6. (B) Immunocytolabeling showing Ki67 expression in Mph. Collected Mph were stained for a proliferation marker Ki67 and DAPI, and percentage of Ki67 + nuclei was measured and present in the chart. Scale bars, 50 mum. n = 4 in each group. (C) Effects of inhibition of human CCL2 and TGF-beta1 on hAM-MSC-mediated Mph proliferation. Increased Mph numbers by hAM-MSC co-culture were eliminated by addition of neutralizing antibodies for hCCL2 (Mph + hMSC + anti-CCL2 group) and TGF-beta1 (Mph + hMSC + anti-TGF-beta1 group). Isotype (IgG) antibody used as control. Representative phase-contrast images and a chart summarizing the data are presented. Scale bars, 400 mum. n = 4. Data are presented as mean +- SEM. *p < 0.05 and **p < 0.01. Student's t test (A and B) or one-way ANOVA with Tukey's post hoc test (C).
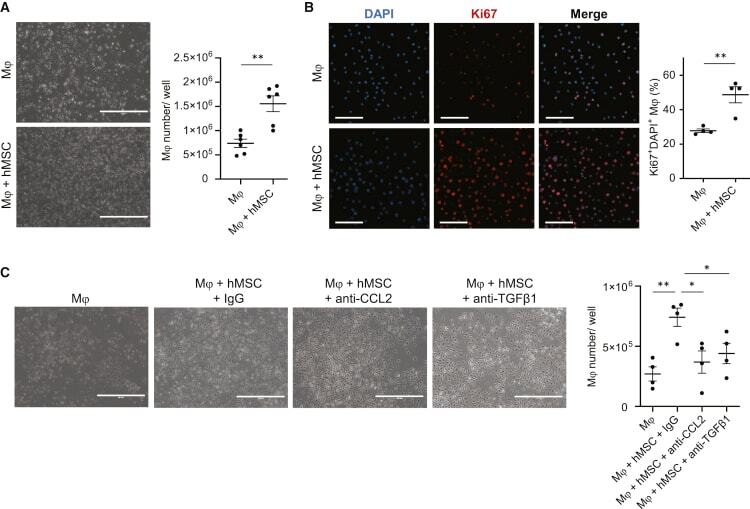
- Submitted by
- Invitrogen Antibodies (provider)
- Main image
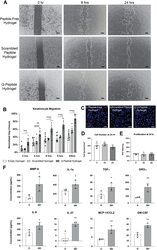
- Experimental details
- Accelerated normal adult human keratinocyte (HEKa) migration and altered cytokine profile are observed on QHREDGS peptide conjugated collagen-chitosan film (Q-Peptide Hydrogel). ( A ) Representative examples of wound simulation assay using HEKa cells adhered to hydrogel film without conjugated peptide, with scrambled Q-Peptide, and with QHREDGS peptide after 24 h (scale bars: 200 mum). ( B ) HEKa migration (relative to initial gap area) in the presence of Q-Peptide Hydrogel (dark grey; n = 12) was accelerated in comparison to the collagen-chitosan film without peptide conjugation (Peptide-free hydrogel; white; n = 11), and the scrambled peptide Hydrogel (light grey; n = 6). ( C ) Representative images of HEKa cells stained with Ki-67 (red) and counterstained with DAPI (blue) after 24 h (scale bars = 100 mum). ( D ) Quantification of cell number as indicated by DAPI staining demonstrates no difference in cell density at 24 h. ( E ) Quantification of % positive Ki-67 staining revealed no significant difference between cells cultured on the Q-Peptide Hydrogel (QH) and the peptide-free hydrogel. ( F ) Human cytokine array on media collected after migration assay conducted on Peptide-free hydrogel and Q-Peptide Hydrogel. Concentration (pg/mL) expressed after subtraction of baseline media. n = 3. H = Peptide-Free Hydrogel, SH = Scrambled Peptide Hydrogel, QH = Q-Peptide Hydrogel. Data are presented as mean +- SD. ** p < 0.01.
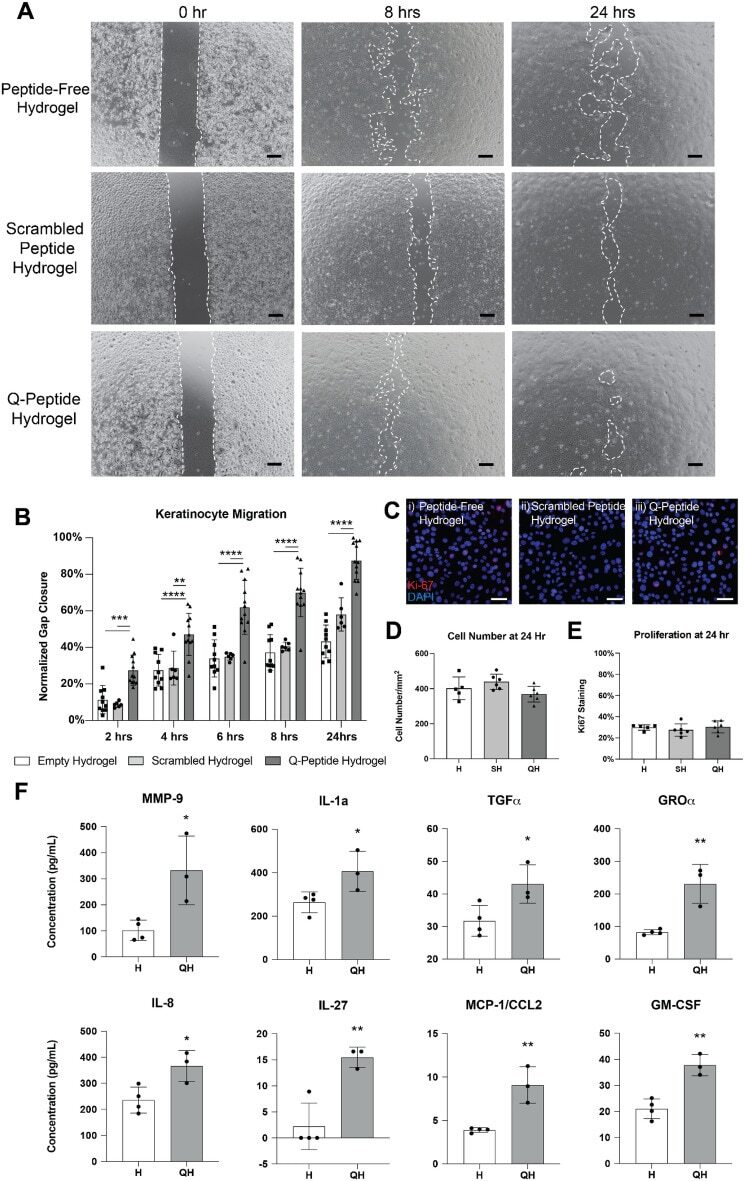
- Submitted by
- Invitrogen Antibodies (provider)
- Main image
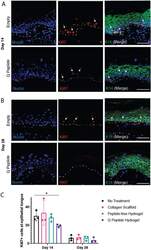
- Experimental details
- Treatment with Q-Peptide Hydrogel leads to faster resolution of proliferating keratinocytes at the margin of the wound. Representative sections of immunohistochemical analysis for Ki67 at ( A ) d14 and ( B ) d28. Dashed line indicates basal epithelial layer. Arrows show Ki67 positive nuclei. (scale bar = 100 um). ( C ) Quantification of total number of Ki67+ cells in one high powered field of view at the epithelial edge (averaged from 4 separate tissue sections spanning the center of the wound) revealed significantly fewer proliferating basal epithelial cells on Day 14 following treatment with Q-Peptide Hydrogel compared with no treatment control. Data are presented as mean +- SD. * p < 0.05, N = 3.
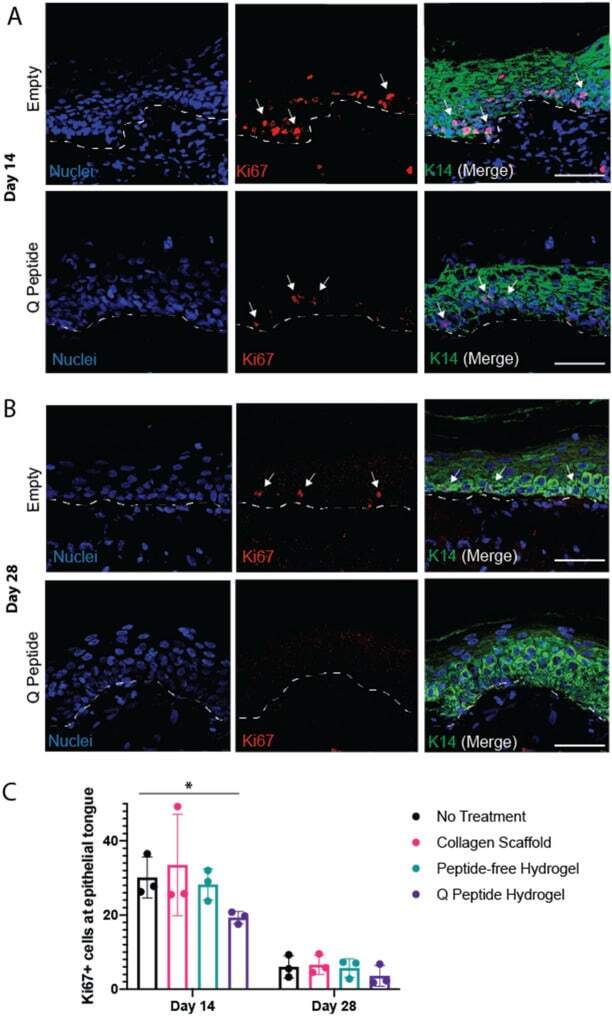
- Submitted by
- Invitrogen Antibodies (provider)
- Main image
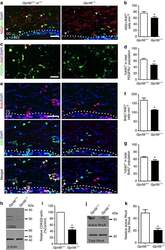
- Experimental details
- Figure 5 Loss of GPR56 leads to fewer proliferating OPCs. ( a ) Representative images of NG2 (red) and Ki67 (green) double IHC in the CC of Gpr56 +/- and Gpr56 -/- P14 mice. Arrowheads indicate double-positive cells. ( b ) Quantification of NG2 and Ki67 dual-positive cells. The asterisks represent significance based on unpaired t -test. P =0.0382; n =6 per genotype. ( c ) Representative images of PDGFRalpha (green) and Ki67 (red) double immunostaining on OPCs after cultured for 4 days in proliferation media. ( d ) Quantification of PDGFRalpha and Ki67 dual-positive OPCs. The asterisks represent significance based on paired t -test. P =0.0156; n =3 per genotype. ( e ) Representative images of BrdU (red) and Ki67 (green) double staining on P14 Gpr56 +/+ and Gpr56 -/- brains that were pulsed with BrdU 24 h before. Arrowheads indicate double-positive cells. ( f ) The number of BrdU and Ki67 double-positive cells was quantified in the CC of Gpr56 -/- mice compared with controls. The asterisks represent significance based on unpaired t -test. P =0.0153; n =3 per genotype. ( g ) The percentage of Ki67 + in the total BrdU + cell population was quantified in the CC of Gpr56 -/- mice compared with the Gpr56 +/+ controls. The asterisks represent significance based on unpaired t -test. P =0.0289; n =4 per genotype. ( h ) Western blot depicting CDK2 protein level in actually isolated OPCs from Gpr56 +/+ and Gpr56 -/- P6 mice. ( i ) The relative CDK2 protein levels were shown. The asterisk
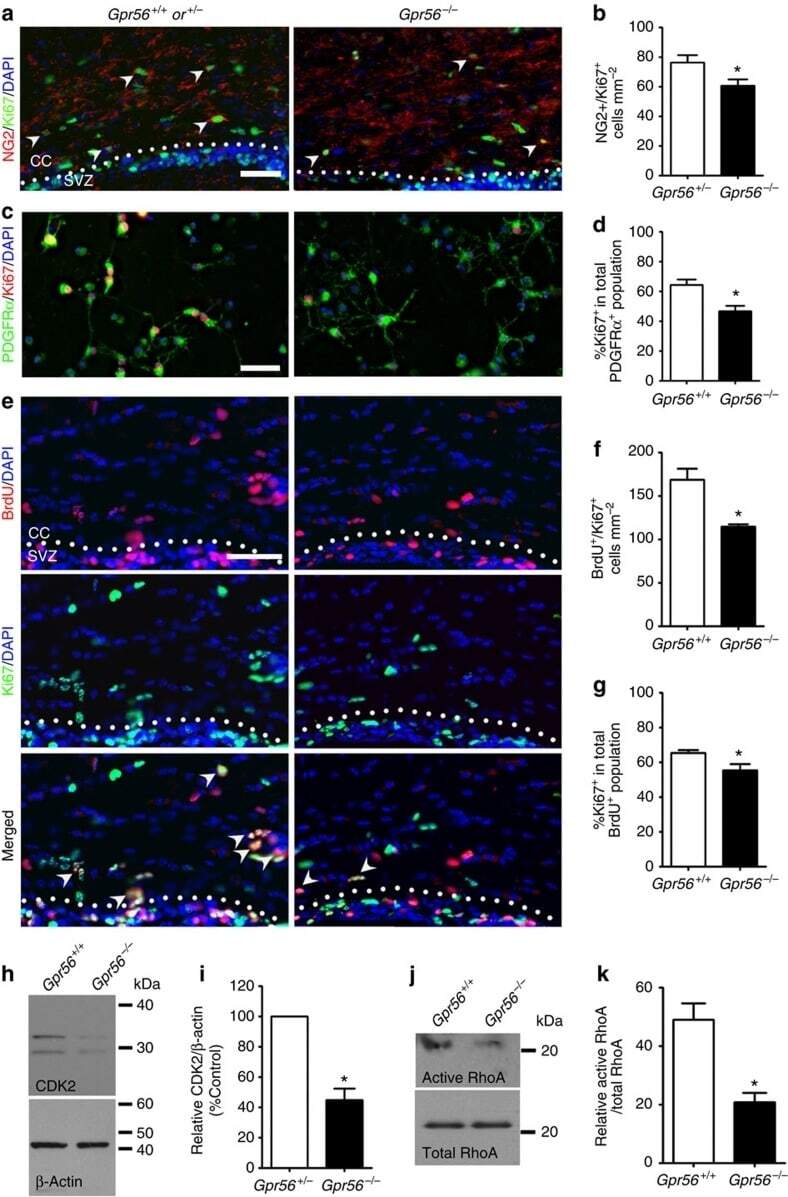
- Submitted by
- Invitrogen Antibodies (provider)
- Main image
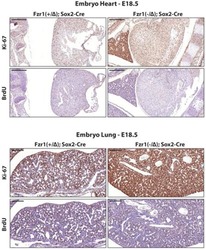
- Experimental details
- Figure 2--figure supplement 1. Ki-67 expression is restricted to proliferating cells by APC/C-Cdh1. Top, IHC staining of Ki-67 and BrdU in sagittal section of embryo heart (E18.5) of Fzr1 (+/Delta) ;Sox2-Cre and Fzr1 (-/Delta) ;Sox2-Cre mice. Scale bar, 500 um. Bottom, IHC staining of Ki-67 and BrdU in sagittal section of embryo lung (E18.5) of Fzr1 (+/Delta) ;Sox2-Cre and Fzr1 (-/Delta) ;Sox2-Cre mice. Scale bar, 200 um. DOI: http://dx.doi.org/
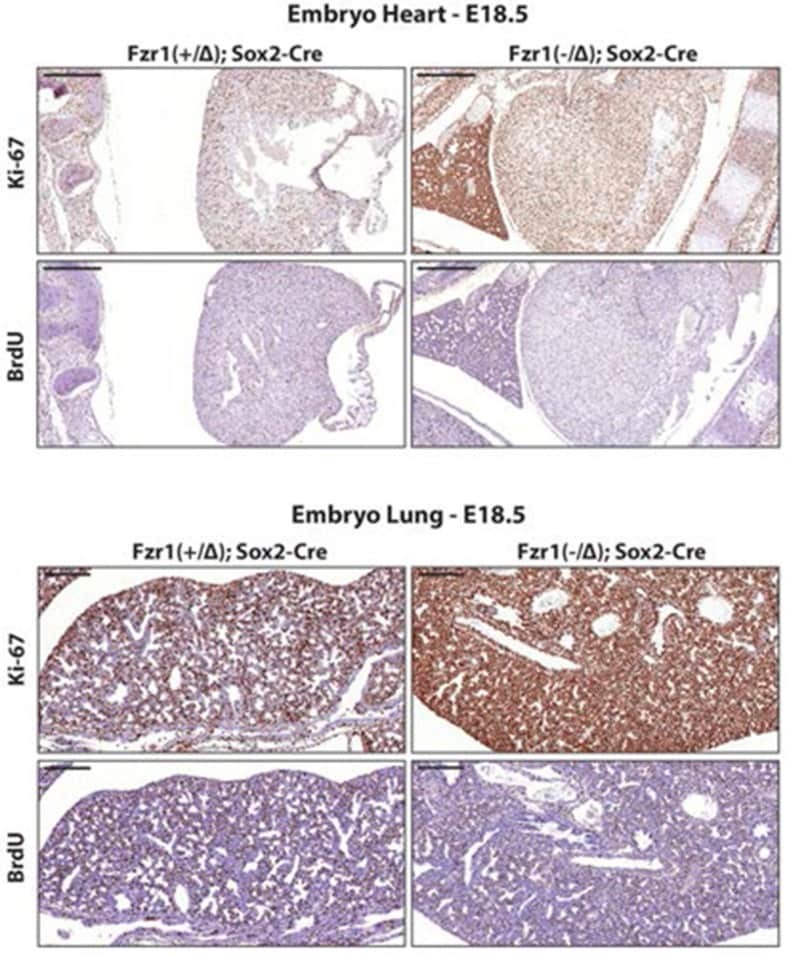
- Submitted by
- Invitrogen Antibodies (provider)
- Main image
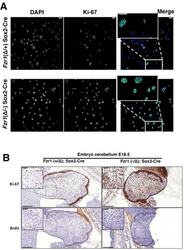
- Experimental details
- Figure 2. Maintenance of Ki-67 expression in quiescent cells in vivo by Cdh1 mutation. ( A ) Immunofluorescence analysis of Ki-67 in MEF cells isolated from embryo (E13.5) of Fzr1 (+/Delta); Sox2 -Cre and Fzr1(-/Delta); Sox2 -Cre mice. Scale bar, 25 um. ( B ) IHC staining of Ki-67 and BrdU in sagittal sections of embryo cerebellum (E18.5) of Fzr1 (+/Delta); Sox2 -Cre and Fzr1 (-/Delta); Sox2 -Cre mice. Bars, 200 um. Bars in zoom, 50 um. DOI: http://dx.doi.org/ Figure 2--figure supplement 1. Ki-67 expression is restricted to proliferating cells by APC/C-Cdh1. Top, IHC staining of Ki-67 and BrdU in sagittal section of embryo heart (E18.5) of Fzr1 (+/Delta) ;Sox2-Cre and Fzr1 (-/Delta) ;Sox2-Cre mice. Scale bar, 500 um. Bottom, IHC staining of Ki-67 and BrdU in sagittal section of embryo lung (E18.5) of Fzr1 (+/Delta) ;Sox2-Cre and Fzr1 (-/Delta) ;Sox2-Cre mice. Scale bar, 200 um. DOI: http://dx.doi.org/
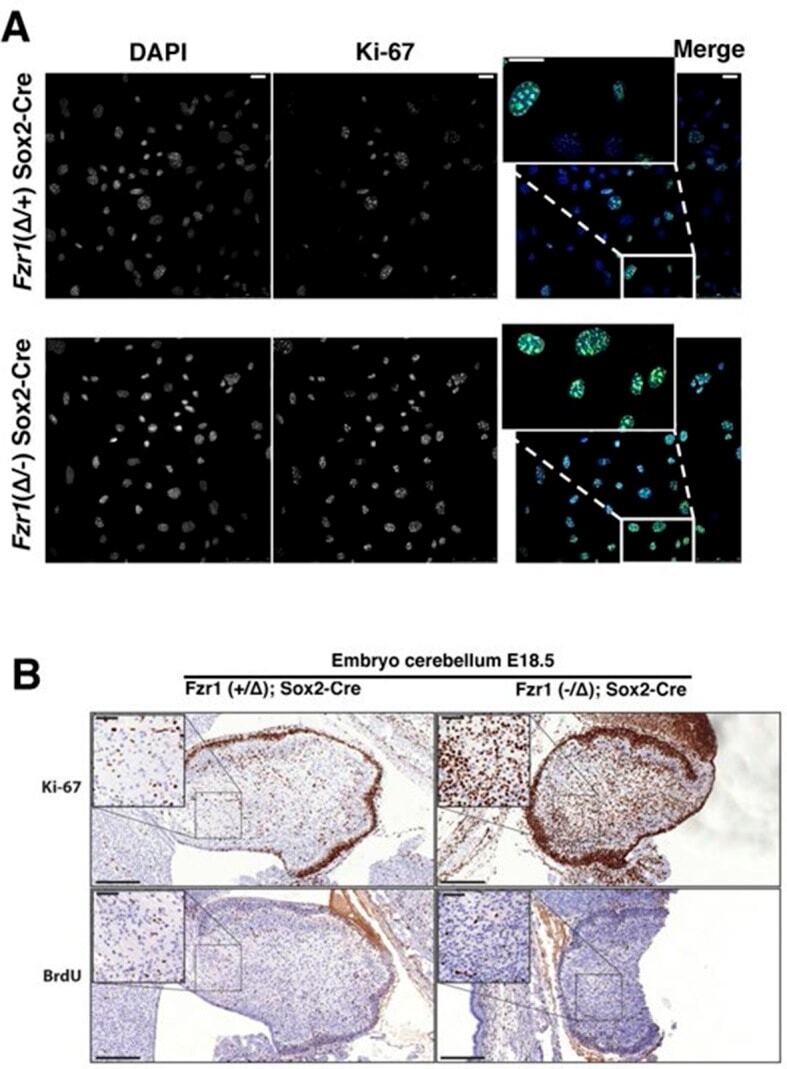
- Submitted by
- Invitrogen Antibodies (provider)
- Main image
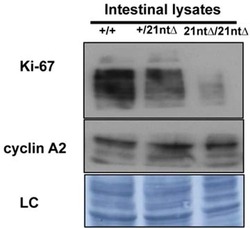
- Experimental details
- Figure 3--figure supplement 4. Background Ki-67 levels in Ki-67 mutant mice. Immunoblotting of Ki-67 and cyclin A on protein preparations of intestinal epithelium from Mki67 +/+ (+/+), heterozygous Mki67 +/21nt (+/21nt) and homozygous Mki67 21nt/21nt (21nt/21nt) mice. DOI: http://dx.doi.org/

- Submitted by
- Invitrogen Antibodies (provider)
- Main image
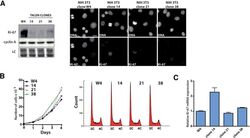
- Experimental details
- Figure 3--figure supplement 9. Ki-67-mutant NIH-3T3 cells proliferate normally. ( A ) Left, analysis of the indicated protein levels by Western blotting in NIH 3T3 WT clone 4 (W4) and Ki-67 mutant clones 14, 21 and 38. LC, loading control. ( B ) Left, growth curves of NIH 3T3 WT clone W4 and Ki-67 mutant clones 14, 21 and 38. NIH 3T3 WT and mutant cells were counted every day for 4 days. Right, cell cycle distribution of the WT clone W4 and 14, 21, 38 Ki67 mutant clones as analysed by FACS. ( C ) qRT-PCR analysis of Ki-67 mRNA in NIH 3T3 WT clone W4 and NIH Ki-67 mutant clones 14, 21 and 38. Normalized by mRNA expression of B2m (beta-2-microglobulin). DOI: http://dx.doi.org/
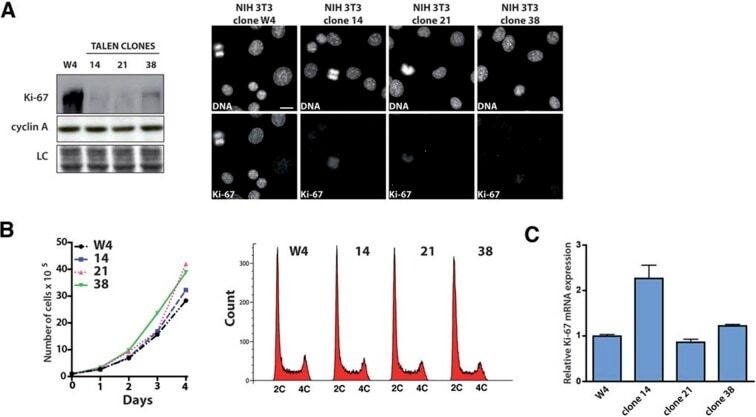
- Submitted by
- Invitrogen Antibodies (provider)
- Main image

- Experimental details
- Figure 3. Mouse development with a mutated Ki-67 gene. ( A ) Table describing Ki-67 mutant mouse lines resulting from germline transmission of mutations generated by cytoplasmic injection of TALEN-encoding mRNA into zygotes. ( B ) Macroscopic appearance of littermate female mice at 10 weeks of age. Genotypes are specified. ( C ) IHC staining of Ki-67 in sagittal section of intestine from Mki67 WT/WT , Mki67 WT/2nt and Mki67 2nt/2nt mice. ( D ) Western blots of Ki-67 and cyclin A expression from intestine isolated from Mki67 WT/WT , Mki67 WT/2nt and Mki67 2nt/2nt mice. LC, loading control. ( E ) Western blot of Ki-67 in MEFs from WT, Mki67 WT/2nt and Mki67 2nt/2nt mice. LC, loading control. ( F ) Flow cytometry profiles in WT, Mki67 WT/2nt and Mki67 2nt/2nt MEFs showing EdU incorporation upon a 1 hr pulse and DNA content. DOI: http://dx.doi.org/ Figure 3--figure supplement 1. Ki-67 mutant mice develop normally. ( A ) Pair of TALE-nucleases designed to target the initiator ATG of mouse Mki67 gene. ( B ) Sequencing traces of initiator ATG (underlined) of Mki67 gene in WT Mki67 +/+ (WT/WT), heterozygous Mki67 +/2nt (WT/2nt) and homozygous Mki67 2nt/2nt (2nt/2nt) mice. ( C ) Sequencing traces of initiator ATG (underlined) of Mki67 gene in WT Mki67 +/+ (WT/WT), heterozygous Mki67 +/21nt (WT/21nt) and homozygous Mki67 21nt/21nt (21nt/21nt) mice. ( D ) WT Mki67 +/+ (+/+), heterozygous Mki67 +/21nt (+/21nt) and homozygous Mki67 21nt/21nt (21nt/21nt) mice. DOI: http://dx.doi.org/ Figur
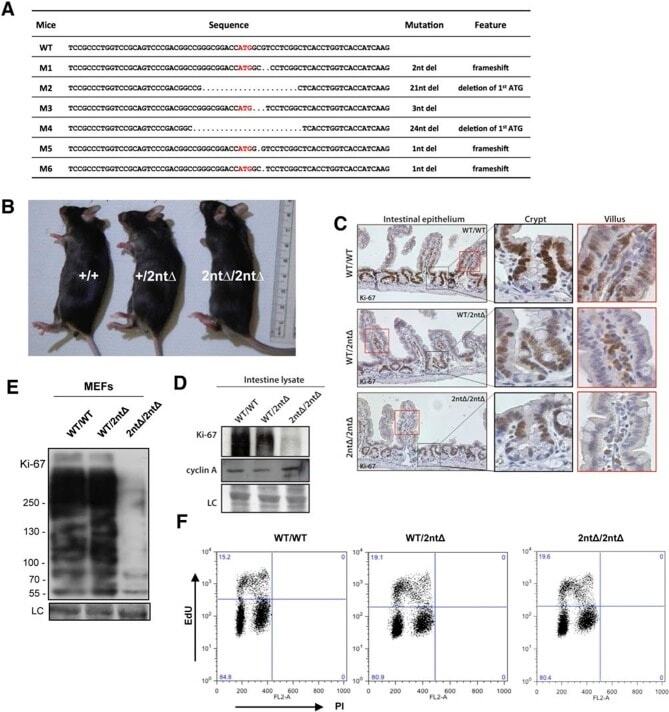
- Submitted by
- Invitrogen Antibodies (provider)
- Main image
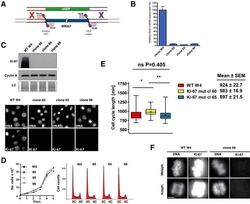
- Experimental details
- Figure 4. Cell proliferation without Ki-67. ( A ) Schematic representation of strategy for TALEN-mediated generation of Mki67 allele. ( B ) qRT-PCR analysis of Ki-67 mRNA levels in NIH-3T3 WT clone W4 and Ki-67-negative 60, 65, 99 clones. ( C ) Top: Western blot of Ki-67 and Cyclin A in NIH-3T3 WT clone W4 and Ki-67-negative mutant clones 60, 65, 99; LC, loading control; below, Ki-67 immunofluorescence; bar, 10 um. ( D ) Left, growth curves of WT and Ki-67 cell lines 60, 65 and 99; right, cell cycle distribution analysed by flow cytometry. ( E ) Cell cycle length of WT clone W4 and Ki-67 clones 60 and 65 as determined by time-lapse videomicroscopy. ( F ) Cells of clone 65 show altered chromosomal periphery in mitosis. The Ki-67 staining is deliberately overexposed to demonstrate absence of detectable Ki-67 in clone 65, even in metaphase. Bar, 5 um. DOI: http://dx.doi.org/ Figure 4--figure supplement 1. Generation of NIH-3T3 cells lacking Ki-67. Top, schematic representation of the wild type (WT), knock-out or eGFP knock-in Mki67 locus and the predicted insertion of tandem repeats of the eGFP insert upstream of Mki67 locus. Bottom, Southern-blot of two NIH-3T3 WT clones (WT, W4) and six NIH-3T3 Ki-67 mutant clones (60,63,65,82,99). Clones were digested with PstI or SphI and probed with 5' or 3' probe, respectively. DOI: http://dx.doi.org/

- Submitted by
- Invitrogen Antibodies (provider)
- Main image

- Experimental details
- Figure 5--figure supplement 1. Cells lacking Ki-67 proliferate efficiently. ( A ) Schematic presentation of generation of Ki-67 shRNA knockdown BJ-hTERT. ( B ) Left, Western blot for indicated proteins upon cell cycle re-entry in serum starved hTERT-transformed BJ fibroblasts (BJ-hTERT) after induction of shRNA against Ki-67 (+) or GAPDH control (-). LC, loading control. Right, DNA synthesis analysed by flow cytometry after EdU pulse. ( C ) Left, asynchronous BJ-hTERT with doxycyclin-induced control or Ki-67 shRNA-expression were additionally transfected with control or Ki-67 siRNA for 48 hr. Protein levels were analysed by Western blotting. LC, loading control. Right, cell cycle distribution by flow cytometry. DOI: http://dx.doi.org/
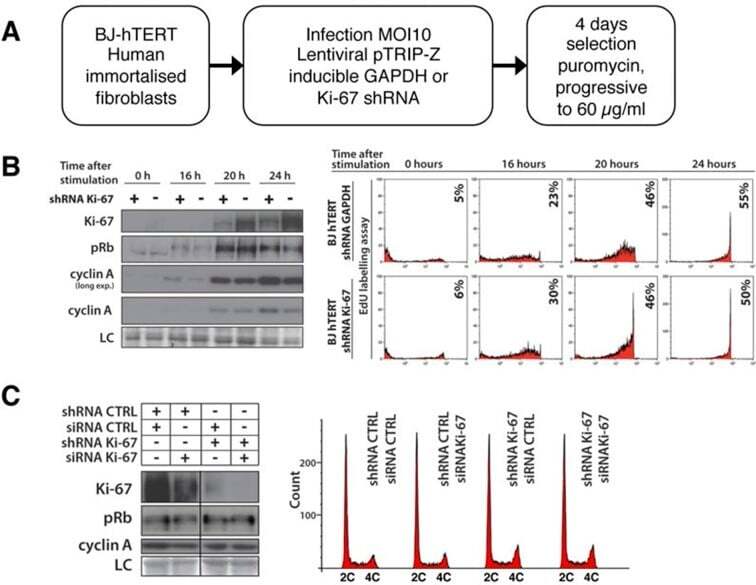
- Submitted by
- Invitrogen Antibodies (provider)
- Main image
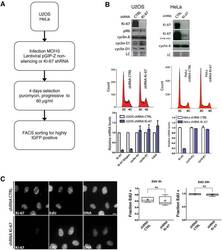
- Experimental details
- Figure 5--figure supplement 2. Cells lacking Ki-67 proliferate efficiently. ( A ) Schematic presentation of generation of Ki-67 shRNA knockdown cell lines. ( B ) Top: Western blot analysis of the indicated proteins in asynchronously growing U2OS and HeLa cells stably expressing non-targeting (CTRL) or Ki-67 shRNA. Lanes separated by lines were from a single exposure of a single SDS-PAGE gel and Western blot. LC, loading control. Middle: Cell cycle distribution of these cells. Bottom: qRT-PCR analysis of the indicated mRNA levels, normalized by mRNA expression of beta-2-microglobulin ( B2m ). ( C ) Immunofluorescence of Ki-67 and EdU in asynchronous U2OS cells stably expressing control or Ki-67 shRNA, incubated with 5-ethynyl-2'-deoxyuridine (EdU) for 3 hr. Bar, 10 um. Right: Ratio of EdU-positive cells to the total cell number for each incubation time; ns: not significant. DOI: http://dx.doi.org/
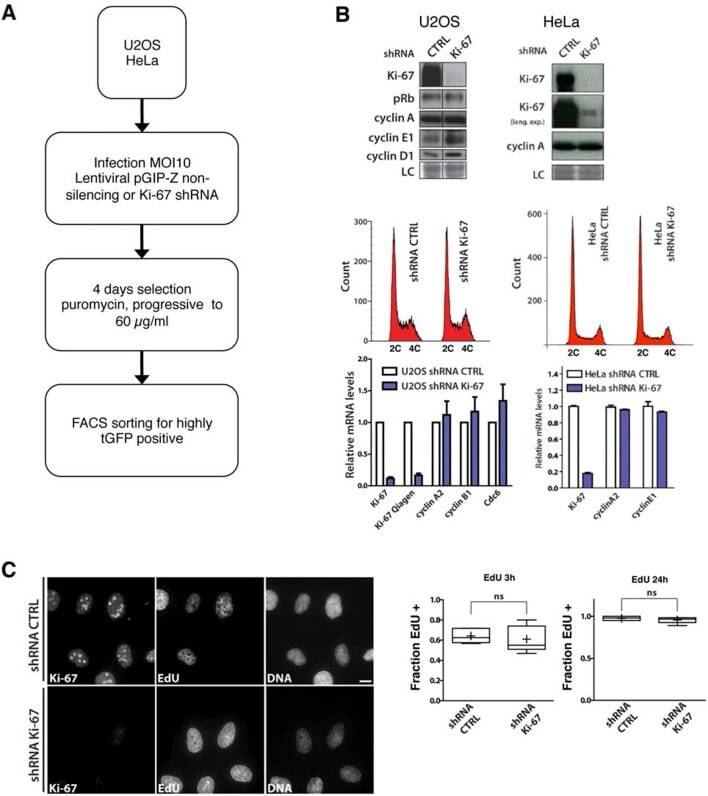
- Submitted by
- Invitrogen Antibodies (provider)
- Main image
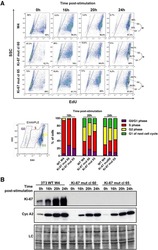
- Experimental details
- Figure 5. Cells lacking Ki-67 enter the cell cycle efficiently. ( A ) Top, re-entry of cell cycle in NIH-3T3 WT clone W4 and Ki-67-negative mutant clones 60 and 65 after serum starvation-induced cell cycle arrest. Progression of cell cycle entry analysed by FACS using EdU staining. Bottom, quantification of cell cycle phases in this experiment. ( B ) Western blot analysis of Ki-67 (upper panel) and cyclin A2 (lower panel) upon cell cycle entry. LC, loading control. DOI: http://dx.doi.org/ Figure 5--figure supplement 1. Cells lacking Ki-67 proliferate efficiently. ( A ) Schematic presentation of generation of Ki-67 shRNA knockdown BJ-hTERT. ( B ) Left, Western blot for indicated proteins upon cell cycle re-entry in serum starved hTERT-transformed BJ fibroblasts (BJ-hTERT) after induction of shRNA against Ki-67 (+) or GAPDH control (-). LC, loading control. Right, DNA synthesis analysed by flow cytometry after EdU pulse. ( C ) Left, asynchronous BJ-hTERT with doxycyclin-induced control or Ki-67 shRNA-expression were additionally transfected with control or Ki-67 siRNA for 48 hr. Protein levels were analysed by Western blotting. LC, loading control. Right, cell cycle distribution by flow cytometry. DOI: http://dx.doi.org/ Figure 5--figure supplement 2. Cells lacking Ki-67 proliferate efficiently. ( A ) Schematic presentation of generation of Ki-67 shRNA knockdown cell lines. ( B ) Top: Western blot analysis of the indicated proteins in asynchronously growing U2OS and HeLa cells
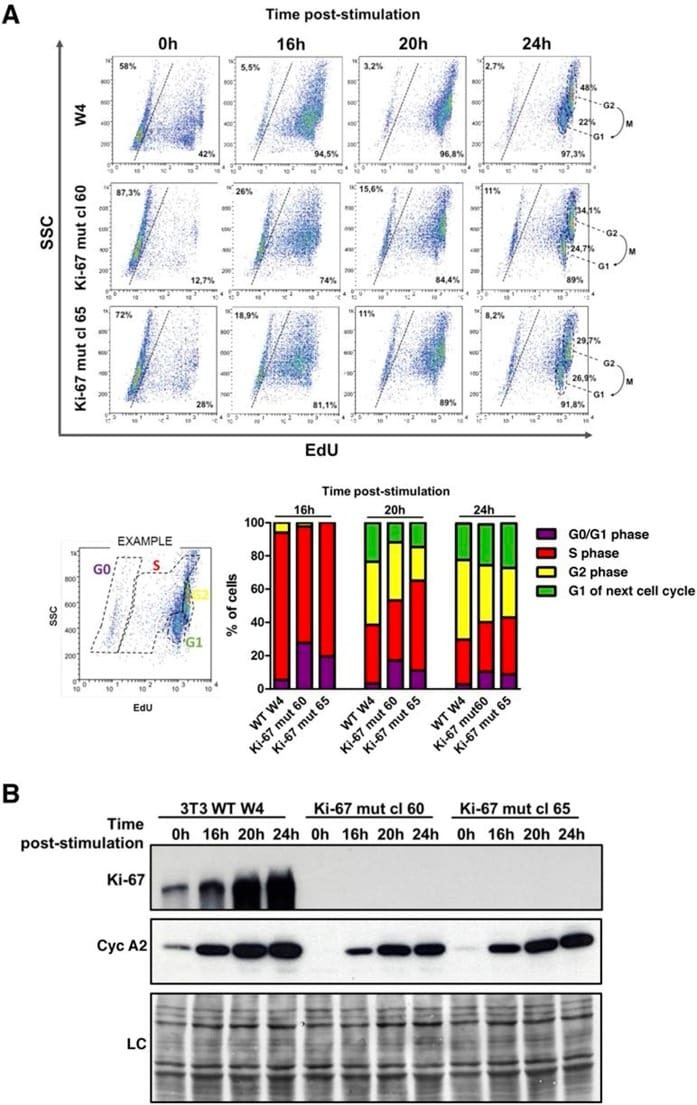
- Submitted by
- Invitrogen Antibodies (provider)
- Main image
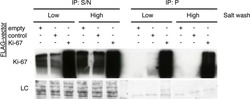
- Experimental details
- Figure 6--figure supplement 1. The Ki-67 interactome. Western blot of Ki-67 in nuclear extracts from cells expressing FLAG-tagged versions of Ki-67 or a control unrelated protein, or FLAG alone. IP: immunoprecipitation; S/N: supernatant; P: pellet. Bottom, loading control. DOI: http://dx.doi.org/
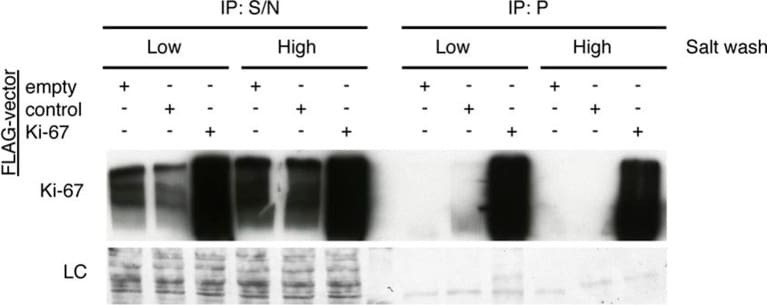
- Submitted by
- Invitrogen Antibodies (provider)
- Main image
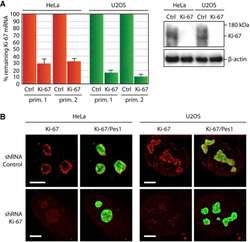
- Experimental details
- Figure 7--figure supplement 3. Depletion of Ki-67 does not affect overall nucleolar structure. ( A ) Histograms showing the level of Ki-67 mRNA remaining in the cell lines expressing constitutively the shRNA against Ki-67. These levels were assessed by RT-qPCR using two different pairs of primers. Right, the Western-blot against Ki-67 shows a disappearance of a bands in the cell lines constitutively expressing the shRNA against Ki-67. ( B ) Immuno-fluorescence against Ki-67 in control HeLa and U20S cell lines in the absence (control) or in the presence (Ki-67) of the shRNA targeting Ki-67 mRNA. The PES1 signal shows that the nucleolar structure is maintained. Objective 100 x. Scale bar: 5 mum. DOI: http://dx.doi.org/
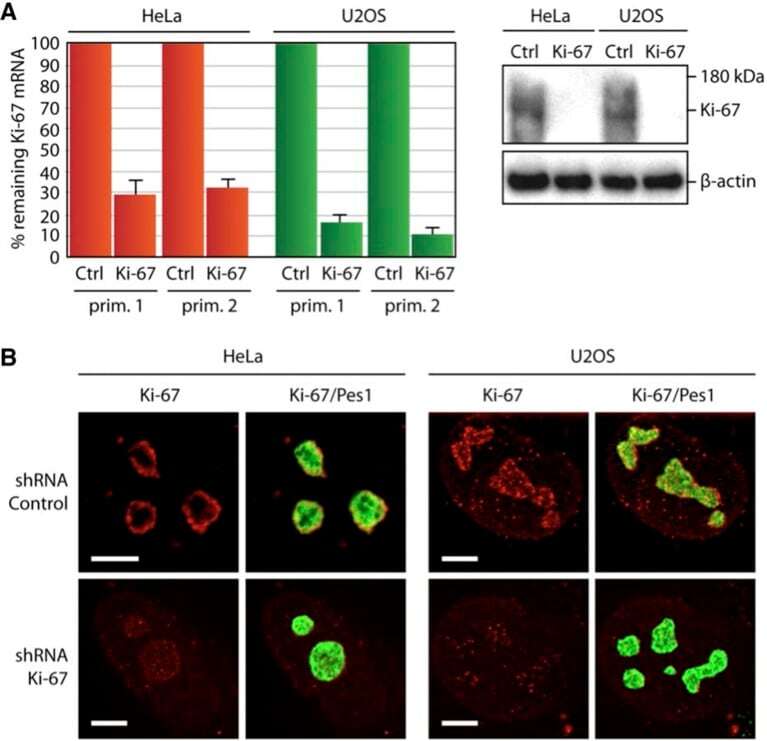
- Submitted by
- Invitrogen Antibodies (provider)
- Main image

- Experimental details
- Figure 5 Rik expression in CD8 + T cells favors tumor survival . (A) Tumor size. C: control mice receiving phosphate-buffered saline. L-S: mice receiving CD8 + T cells transduced with scramble lentiviruses. L-R: mice receiving CD8 + T cells transduced with Rik-expressing lentiviruses. Each circle represents an individual mouse. (B) mRNA levels of TNF-alpha and granzyme B in tumor tissues. N = 4 per group. (C) Tumor cell apoptosis is indicated by terminal deoxynucleotidyl transferase dUTP nick end labeling. This is a representative of three independent experiments. (D) Activation of caspase-3 in tumor tissues. Left panel: representative Immunoblot image. Right panel: statistics of caspase-3. N = 5 per group. (E,F) Tumor cell proliferation is demonstrated by Ki67 staining. Tumor implants were digested as described in Section "" Materials and Methods ."" Then the whole tissue was pressed through a 70-mum nylon mesh to prepare a single cell suspension, followed by staining with APC anti-CD45 and APC anti-CD31 antibodies. Cells were then stained for Ki67 as described in Section "" Materials and Methods ."" CD45 - CD31 - tumor cells were shown here. Representative histograms are shown in panel (E) , and statistical analysis for Ki67 + cells were shown in panel (F) . N = 7 per group (* p < 0.05; ** p < 0.01; *** p < 0.001).
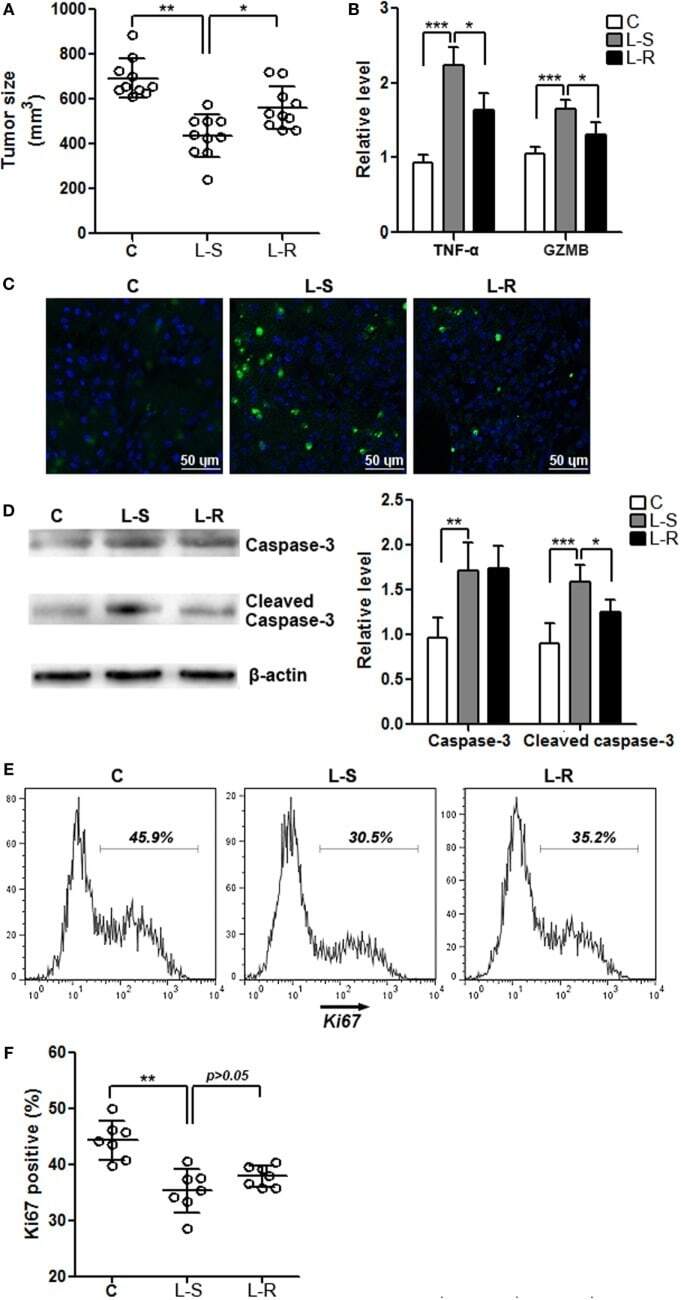
- Submitted by
- Invitrogen Antibodies (provider)
- Main image
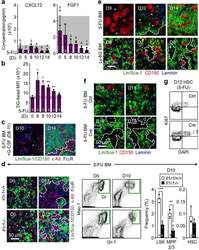
- Experimental details
- Extended Data Fig. 9 Mechanisms controlling GMP cluster formation during regeneration a , ELISA measurement of cytokine levels in BM fluids of 5-FU-treated WT mice at the indicated days post-treatment. b , Quantification of vascular leakage in 5-FU-treated BM at the indicated days post-treatment. Results are expressed as dragon green (DG) microsphere MFI upon masking of laminin + blood vessels. c , Representative IF staining showing GMPs (purple) in 5-FU-treated BM with concomitant daily injections of G-CSF (+G) on d8-11. d , Investigation of 5-FU-treated Il1r1 +/+ and Il1r1 -/- mice at the indicated days post-treatment showing representative IF staining of GMPs (purple), FACS plots of Gr regeneration, and quantification of the indicated BM populations. e , Representative IF staining of CD150 + megakaryocytes (red) in 5-FU- and Ly-6G-treated BM. f , g , Megakaryocyte depletion studies in diphtheria toxin (DT) injected iDtr (Ctrl) and Cxcl4-Cre:iDtr ( Cre ) mice showing (f) representative IF staining of CD150 + megakaryocytes (red) at the indicated days post-5-FU, and (g) representative Ki67/DAPI staining of HSCs at d12 post-5-FU. Stars indicate pGMPs and dotted lines cGMPs. Results are expressed as mean +- S.D. (grey bars, reference range); *p
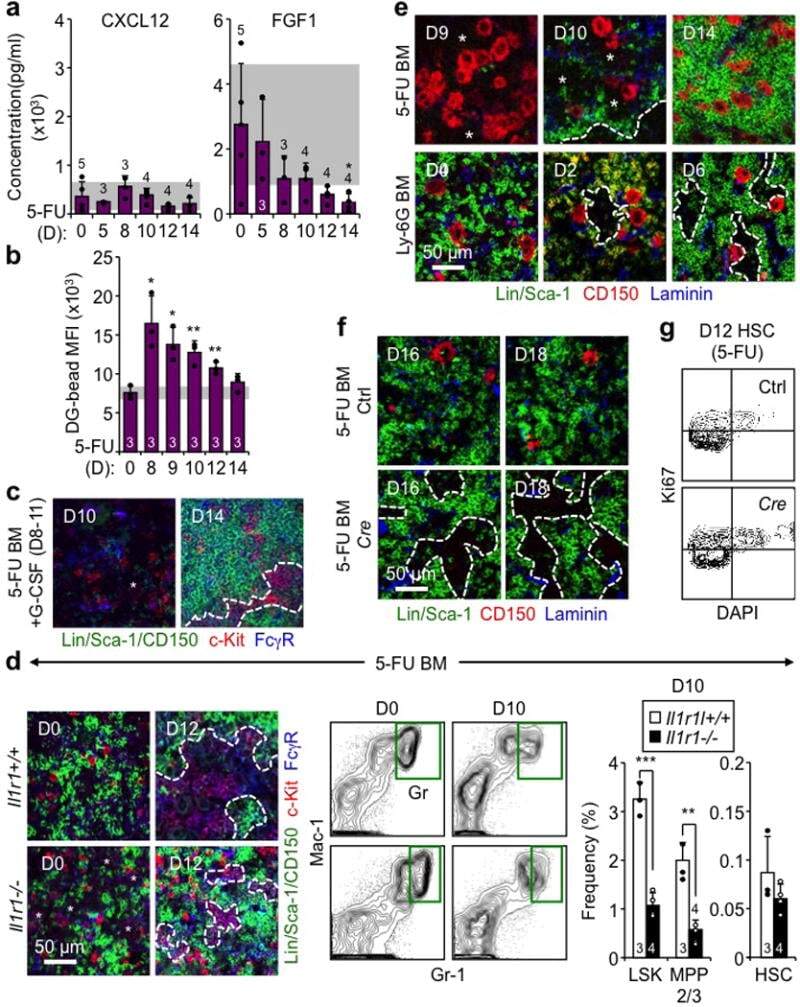
- Submitted by
- Invitrogen Antibodies (provider)
- Main image
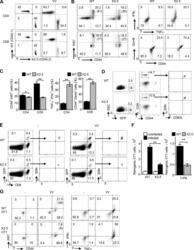
- Experimental details
- Figure 4. Egr2 and 3 function is cell intrinsic. (A-C) Irradiated WT mice were adoptively transferred with an equal number of BM cells from WT and CD2-Egr2/3 -/- (K2-3) mice. 8 wk after transfer, mice were infected with OVA-VV WR and analyzed 7 d after infection. (A) Splenic cells from chimeric mice were stained with CD45.1, CD45.2, CD4, and CD8, and the proportion of WT (CD45.1) and K2-3 (CD45.2) CD4 and CD8 cells was determined by flow cytometry. (B and C) Gated WT (CD45.1) and K2-3 (CD45.2) CD4 and CD8 cells were analyzed for expression of the activation marker CD44 and the proliferation marker Ki67 (left) and TNF and IFNgamma for CD4 cells and granzyme B for CD8 cells (right). The percentages of Ki67 + cells among the CD44 high population are indicated in parentheses in B. (D-G) WT and K2-3 OT1 retrogenic T cells were analyzed in recipient mice before and after infection. (D) GFP + CD8 + CD44 lo cells were isolated from WT and K2-3 OT1 retrogenic mice (left and middle) and confirmed as CD62L + Kb-SIINFEKL-tetramer + cells (right). 3 x 10 5 to 5 x 10 5 WT or Egr2/3 -/- retrogenic-OT1 cells were adoptively transferred to separate naive WT mice. 1 d after transfer, mice were infected with OVA-VV WR and analyzed 7 d after infection. (E and F) Retrogenic-OT1 GFP + CD8 + Kb-SIINFEKL-tetramer + cells among spleen and lymph node cells from recipient mice were identified (E), and the numbers of WT and K2-3 retrogenic-OT1 cells in spleen and lymph nodes (left) and lung (right) were
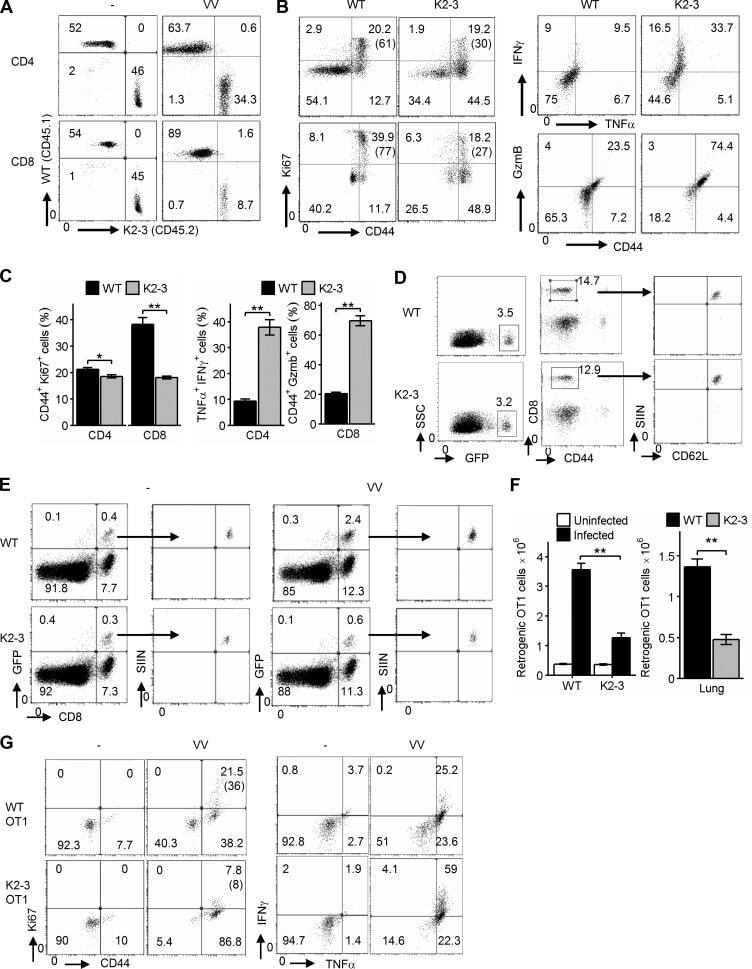
- Submitted by
- Invitrogen Antibodies (provider)
- Main image
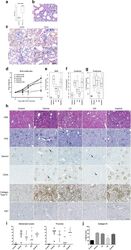
- Experimental details
- Fig. 3 Pharmacological inhibition of DDR1 activation protects animals against NTS-induced crescentic glomerulonephritis. a Quantitative RT-PCR for Ddr1 mRNA on whole kidney lysate of control mice (Control) and mice injected with nephrotoxic serum and treated with vehicle (vehicle). b Representative Ddr1 in situ hybridization (ISH) performed on tissue harvested from mice 14 days after NTS injection. * = crescent c representative DDR1 ISH double labelling with alpha smooth muscle actin (Acta2) or EGF-like module-containing mucin-like hormone receptor-like 1 (Emr-1) in control mice (Control) and mice injected with nephrotoxic serum and treated with vehicle (Vehicle). Arrows = cells labeled with Acta2 or Emr-1. d - g Body weight evolution (day 1, 4, 7 and 14) and renal function parameters ( e - g blood urea nitrogen (BUN), serum creatinine and proteinuria) measured at sacrifice (day 14). h Representative histopathology with Hematoxylin and Eosin (H&E) and Periodic Acid Schiff staining (PAS) and immunohistochemistry for desmin, CD44, Collagen type IV and Ki67. i Glomerular or tubulo-interstitial (TI) summary scores from semiquantitative histopathologic evaluation on H&E and PAS stained kidney sections respectively. j Morphometry analysis of collagen IV IHC. Statistically significant p value: p < 0.05 = *; p < 0.005 = **. Magnification x200, scale bar 100 mum
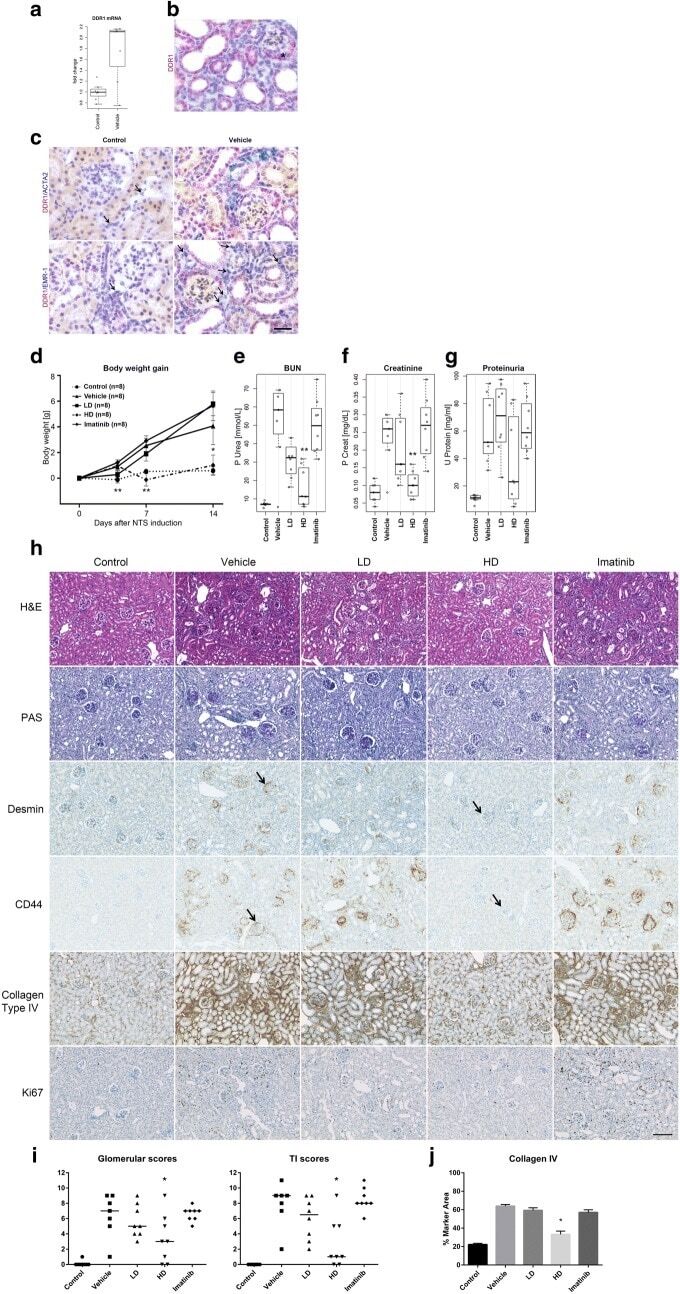
- Submitted by
- Invitrogen Antibodies (provider)
- Main image

- Experimental details
- Fig. 6 AECs self-regenerate, and do not regenerate SECs. a Scheme of experiment design. Bmx -Cre ERT2 ;iTdtomato mice were injected with Tamoxifen to activate Cre expression. Four weeks later, 5-FU was given to these mice and BM ECs were analysed by FACS and immunofluorescence analysis. b Numbers of AECs and SECs 3 days after 5-FU treatment. Data are represented as mean +- SEM. c Representative FACS plot of cell cycle analysis of AECs and SECs from control mice and mice treated with 5-FU (9 days after 5-FU) using Hoechst 3334 and Ki-67. d FACS plot of the labelling of AECs and SECs by Bmx -Cre ERT2 at different time points after 5-FU treatment. e Representative image of whole-mount sternum from mice treated as in ( a ). The bone was harvested on day 17 after 5-FU injection. Mice were injected i.v. with anti-VE-cadherin and anti-CD31. All panels show the same area for different channels. Scale bar, 50 mum. f Scheme of experiment design. Bmx -Cre ERT2 ;iTdtomato mice were injected with Tamoxifen to activate Cre expression. Four weeks later, these mice were lethally irradiated and transplanted with BM cells from wild-type mice. BM ECs were analysed by FACS and immunofluorescence analysis at different time points after lethal irradiation. g Representative images from whole-mount sternum at 1 month (left panel) and 4 months (right panel) after lethal irradiation. Mice were injected i.v. with anti-VE-cadherin and anti-CD31. Scale bar, 200 mum. h Images from whole-mount sternum in w
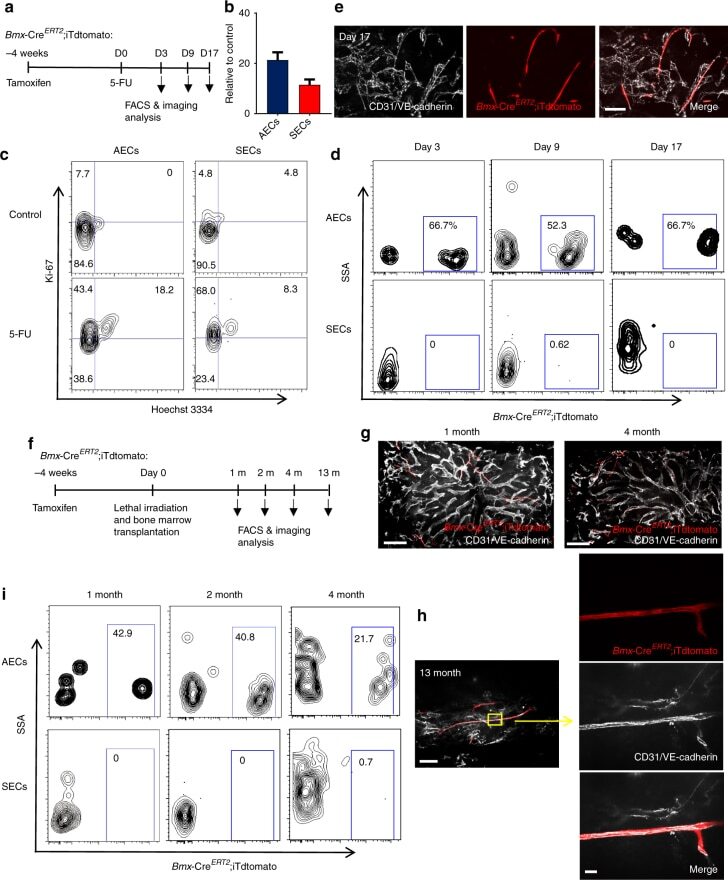
- Submitted by
- Invitrogen Antibodies (provider)
- Main image
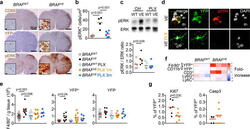
- Experimental details
- Figure 3 ERK activation in BRAF V600E microglia (a) CD68, YFP and pERK staining in spinal cord from 7-month old mice. Scale bars=500um, 10um for insets. n=4 per group. (b) pERK + microglia in brainstem. Circles represent individual mice. One-way ANOVA. (c) ERK phosphorylation in spinal cords and brains from 6-9 month-old mice. Top: representative western blot, bottom: pERK/ERK ratio, n=5 per group. One-way ANOVA. (d) pERK expression in YFP + microglia from BRAF VE mice. n=5 per group. Scale bars=5um. (e) Numbers of microglia from 5-9 month-old mice Circles represent individual mice. One-way ANOVA. (f) Heatmap representation of cell frequency among CD45 + cells in the brain. n=3 per group. (g) Ki67 + and cleaved Caspase 3 + (Casp3) expression in YFP + microglia from 5-9 month-old BRAF VE mice, n=6 per group. Unpaired two-tailed t -test. See also Extended data Fig. 7 .
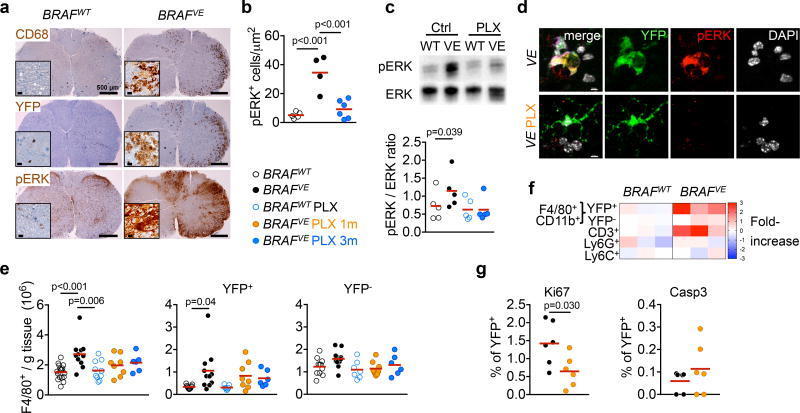
- Submitted by
- Invitrogen Antibodies (provider)
- Main image
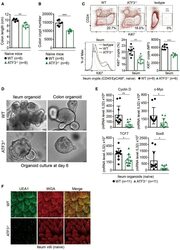
- Experimental details
- Figure 1 ATF3 maintains intestinal homeostasis. (A) Comparison of colon length between naive mice as indicated. (B) Colon crypts from mice were isolated by shaking colon fragments in EDTA and counted under light microscopy. (C) Flow cytometry analysis of Ki67 and CD24 expression in ileum crypts, gated on the CD45 - EpCAM + populations, from the indicated naive mice. (D) Representative micrographs showing intestinal organoids derived from naive mice. (E) Quantitative real-time PCR analysis of cell cycle genes in naive ileum organoids at day 6 of culture (""n"" indicates organoids derived from 4 mice each group). (F) Representative confocal images of whole mount tissues with co-immunofluorescence staining of UEA-1 and WGA in naive ileum villi. Results were from at least two independent experiments and ""n"" refers to the number of mice unless indicated otherwise. All mice were at the age of 2~3 months old when analyzed. Statistical analysis was done using Multiple T -test on Prism software. * P < 0.05, ** P < 0.005, *** P < 0.0005.
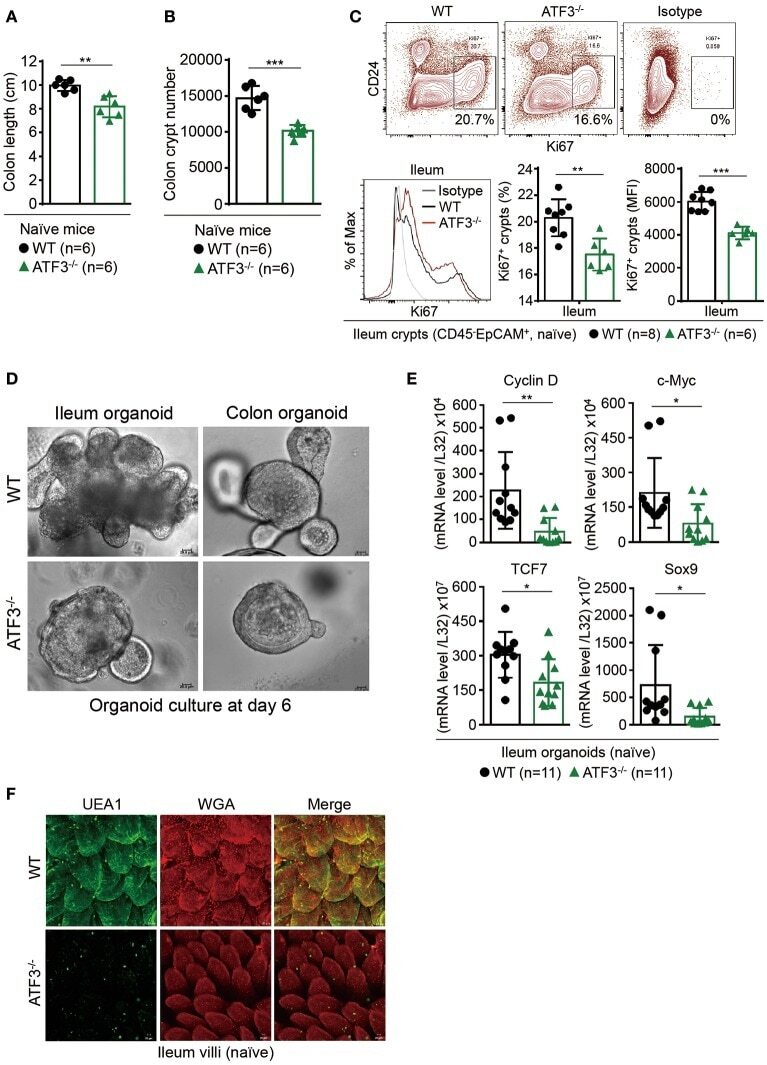
- Submitted by
- Invitrogen Antibodies (provider)
- Main image
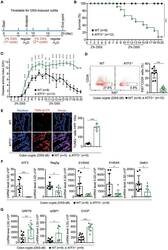
- Experimental details
- Figure 3 ATF3 protects mice from DSS-induced colitis. (A) Experimental protocol of DSS-induced colitis was shown. (B) Survival rate in mice after DSS treatment. (C) Disease activity index (DAI), a composite measurement of weight loss percentage, stool consistency, and blood in stools, was indicated in each group of mice during DSS colitis. (D-G) Analysis of colitis severity at day-8 post DSS treatment. (D) Flow cytometry of Ki67 + proliferating crypt cells in CD24 low/- cell population. (E) TUNEL assay showing apoptotic cells in colon tissues. Magenta positive apoptotic cells were quantified per 100x high-power field (HPF) from 10 different views of colon section from each mouse. (F-G) Quantitative real-time PCR analysis of crypt cells at day-8 post DSS. (F) Expression of ATF3 and anti-microbial peptide-related genes. (G) Expression of ER stress-related genes. Results were from two independent experiments. ""n"" refers to the number of mice analyzed. Survival curve was calculated using the Kaplan-Meier method and statistical significance was calculated using Log rank (Mantel-Cox) test. Statistical analysis was done using Multiple T -test on Prism software. * P < 0.05, ** P < 0.005, *** P < 0.0005.
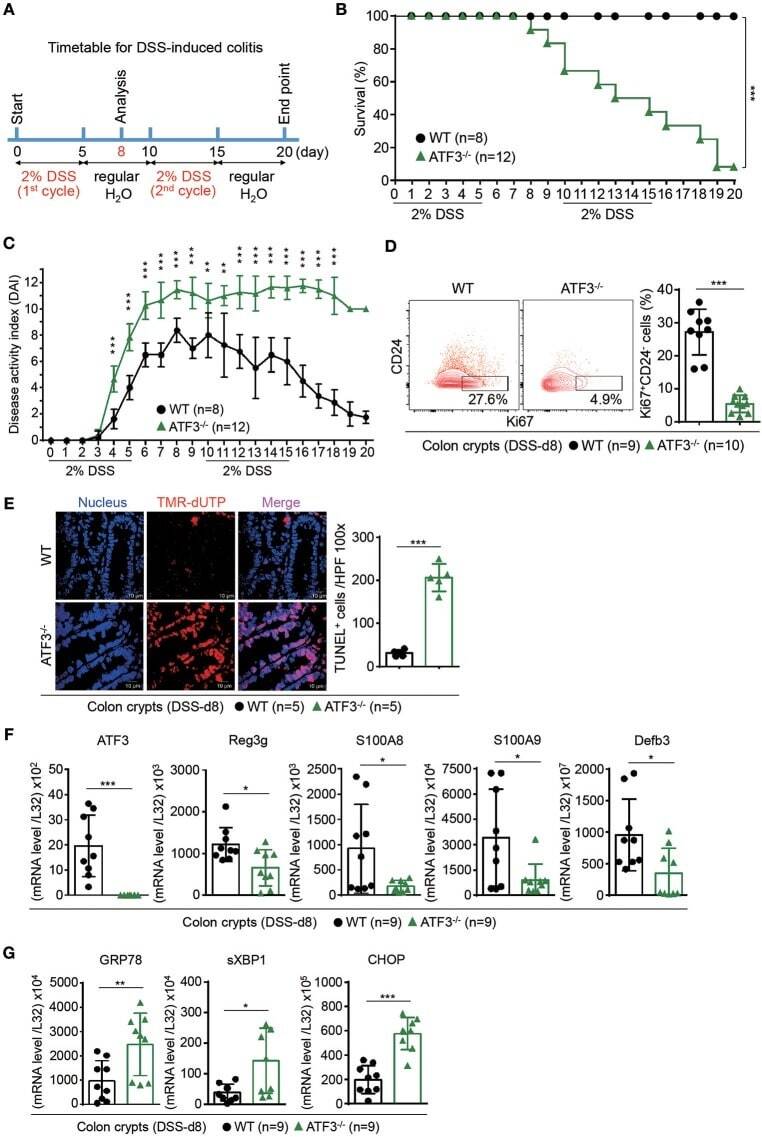
- Submitted by
- Invitrogen Antibodies (provider)
- Main image
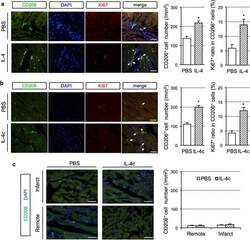
- Experimental details
- Figure 7 Source of increased cardiac M2-like macrophages by IL-4c treatment. ( a ) Viable heart slices were cultured with IL-4 (IL-4 group) or without IL-4 (PBS group) and subjected to immunolabeling for CD206 and Ki67 with DAPI nuclear staining. White arrows indicate CD206 + Ki67 + DAPI + cells. The numbers of CD206 + and Ki67 + ratios in CD206 + cells were shown in the graphs. N = 5 different hearts in each group. * P < 0.05 versus PBS group. ( b ) Two days after intraperitoneally injection of IL-4c or PBS (control) into normal mice, the hearts were subjected to labeling for CD206, Ki67 and DAPI. White arrows indicate CD206 + Ki67 + DAPI + cells. The numbers of CD206 + and Ki67 + ratios in CD206 + cells were counted and shown in the graphs. N = 5 hearts in each group. * P < 0.05 versus PBS group. ( c ) IL-4c or PBS was injected at 20 minutes after coronary artery ligation. At Day 1, the heart was subjected to immunofluorescence for CD206 with DAPI nuclear staining. The numbers of CD206 + cells were shown in the graphs. N = 5 hearts in each group.
- Submitted by
- Invitrogen Antibodies (provider)
- Main image
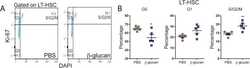
- Experimental details
- Figure S1 Administration of beta-Glucan Promotes Cell Proliferation of LT-HSCs, Related to Figure 1 (A and B) Cell cycle analysis was performed in LT-HSC at 24h after the administration of PBS or beta-glucan by staining for Ki67 and DAPI. (A) Representative flow cytometry plots and (B) frequency of LT-HSC at different phases of the cell cycle (n = 5 mice per group). Data presented as mean +- SEM. * p < 0.05, ** p < 0.01.
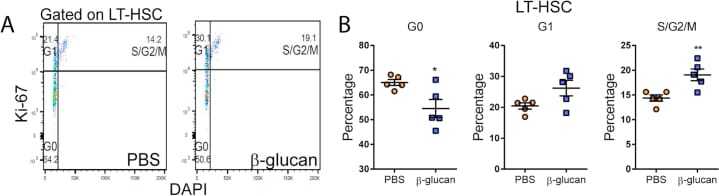
- Submitted by
- Invitrogen Antibodies (provider)
- Main image
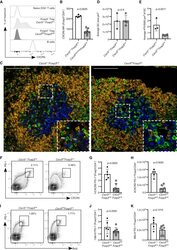
- Experimental details
- Figure 1 Tfr Cells Are Present at Reduced Numbers in Cxcr5 fl/fl Foxp3 cre-yfp Mice Mice were immunized with NP-KLH/alum i.p., and the GC response was analyzed 14 days after immunization. (A) Histogram of CXCR5 expression in Foxp3 + CD4 + Treg cells, naive T cells as a CXCR5-negative control population, and wild-type B cells as a CXCR5-positive population. (B) CXCR5 mean fluorescence intensity (MFI; geometric mean) in Foxp3 + CD4 + Treg cells from mice of the indicated genotypes. (C) Analysis of Tfr and Tfh cells 14 days after influenza A virus (HKx31) infection in Cxcr5 fl/fl Foxp3 cre mice and Cxcr5 +/+ Foxp3 cre controls. Representative confocal images of splenic cryosections stained for Foxp3 (magenta), Ki67 (blue), CD3 (green), and IgD (orange); Foxp3 + cells are indicated by arrows. Scale bar, 40 mum. (D) Average GC size in square micrometers measured as the IgD - Ki67 + area. Each dot represents the average size of 2-6 GCs per mouse. (E) Quantification of the average number of Tfr cells per mouse, defined as CD3 + Foxp3 + cells within the GC, per 5,000 mum 2 . Each dot represents the average number of Tfr cells per 5,000 mum 2 of GC area per mouse, from 2-6 GCs. (F) Representative flow cytometry contour plots of CXCR5 + PD-1 + Tfh cells from Foxp3 - CD4 + cells. (G and H) Quantification of the (G) frequency and (H) absolute number of CXCR5 + PD-1 + Tfh cells. (I) Representative flow cytometry contour plots of Bcl6 + PD-1 + Tfh cells of Foxp3 - CD4 + cells. (J and K) Qu
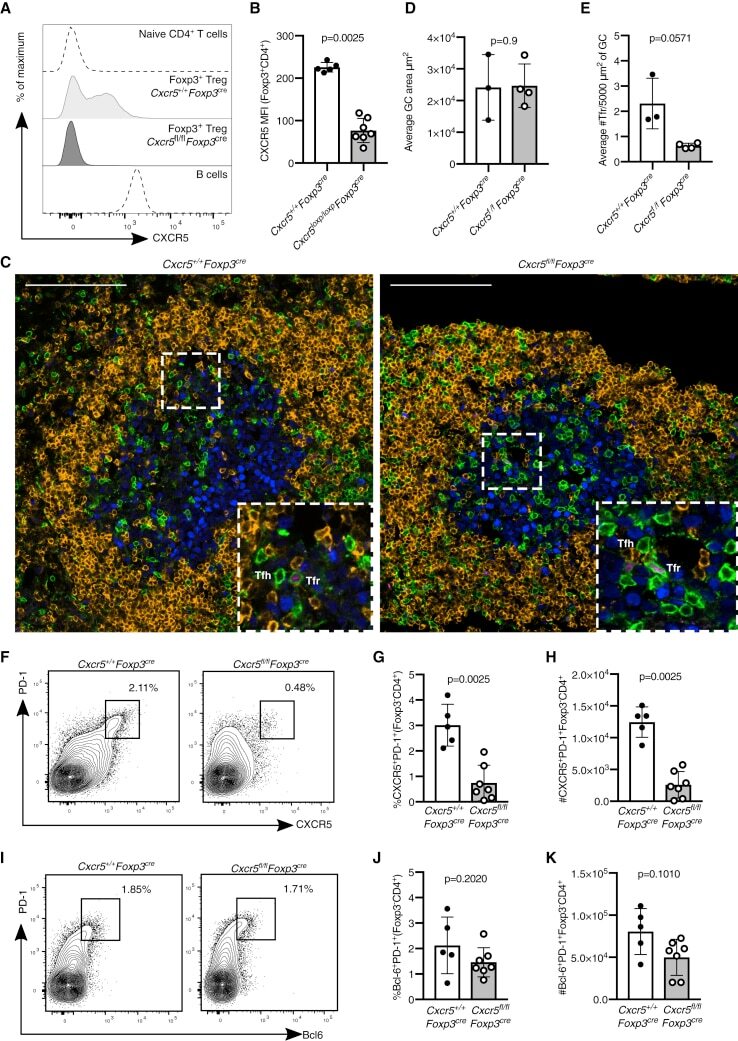
- Submitted by
- Invitrogen Antibodies (provider)
- Main image
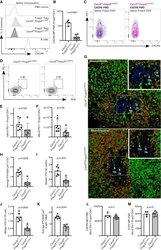
- Experimental details
- Figure 2 Fewer Tfr Cells Are Present in the GC of Cxcr5 fl/fl Foxp3 cre-ERT2 Mice (A-C) Histogram (A), quantification (B). and dot plots (C) of CXCR5 expression on Foxp3 + CD4 + Treg cells in mesenteric lymph nodes three weeks after initiating the tamoxifen diet, before immunization, in Cxcr5 fl/fl Foxp3 cre-ERT2 and Cxcr5 +/+ Foxp3 cre-ERT2 mice. A fluorescence minus one (FMO) control serves as a negative control, and B220 + B cells serve as a CXCR5-positive population. (D-M) Mice were immunized with NP-KLH/alum s.c., and the GC response was analyzed in draining lymph nodes 14 days after immunization. (D) Representative flow cytometry contour plots of PD-1 + Bcl6 + cells within Foxp3 + CD4 + cells (Tfr cells). (E and F) Quantification of the (E) percentage and (F) absolute number of Bcl6 + PD-1 + Tfr cells. (G) Cryosections from iLNs were stained for Foxp3 (magenta), Ki67 (blue), CD3 (green), and IgD (orange). Scale bar, 100 mum. Representative confocal image of the GC, with Tfr cells and Tfh cells indicated by the arrows. (H) Quantification of the median number of Tfr cells, defined as CD3 + Foxp3 + , per 5,000 mum 2 of GC area. (I) Quantification of confocal images of the median number of CD3 + Foxp3 + Tfr cells per GC per mouse. (J) Quantification of the median number of Tfr cells per 10 Tfh cells, defined as Foxp3 - CD3 + . (K) Quantification of the median number of Treg cells, defined as CD3 + Foxp3 + , per 5,000 mum 2 of IgD + B cell follicle area. (L and M) CXCR4 MFI

- Submitted by
- Invitrogen Antibodies (provider)
- Main image
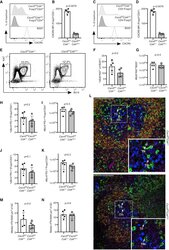
- Experimental details
- Figure 4 Cxcr5 fl/fl Cd4 cre/+ Mice Have an Intact GC Response after Influenza Infection Analysis of the GC response in Cxcr5 fl/fl Cd4 cre/+ mice 14 days after influenza A virus (HKx31) infection. (A) Representative histogram of CXCR5 expression in Foxp3 + CD4 + Treg cells and B220 + B cells. (B) Quantification of the MFI (geometric mean) of CXCR5 in Foxp3 + CD4 + Treg cells. (C) Representative histogram of CXCR5 expression in Foxp3 - CD4 + T cells and B220 + B cells. (D) Quantification of the MFI (geometric mean) of CXCR5 in Foxp3 - CD4 + T cells. (E) Flow cytometry contour plots of GC B cells, gated as Bcl6 + Ki67 + cells of B220 + cells. (F and G) Quantification of the (F) frequency and (G) absolute number of Bcl6 + Ki67 + B cells. (H and I) Quantification of the (H) percentage and (I) number of Bcl6 + PD-1 + Foxp3 - CD4 + Tfh cells. (J and K) Quantification of the (J) percentage and (K) number of Bcl6 + PD-1 + Foxp3 + CD4 + Tfr cells. (L) Cryosections were stained for Foxp3 (magenta), Ki67 (blue), CD3 (green), and IgD (orange). Scale bar, 100 mum. Representative confocal image of the GC, with Tfr cells and Tfh cells indicated by the arrows. (M) Quantification of the median number of Tfr cells, defined as CD3 + Foxp3 + cells, per 5,000 mum 2 . (N) Quantification of the median number of Tfh cells, defined as CD3 + Foxp3 - cells, per 5,000 mum 2 . Each symbol represents one mouse, the horizontal bars represent mean values, and the error bars show the SD. The p values were d
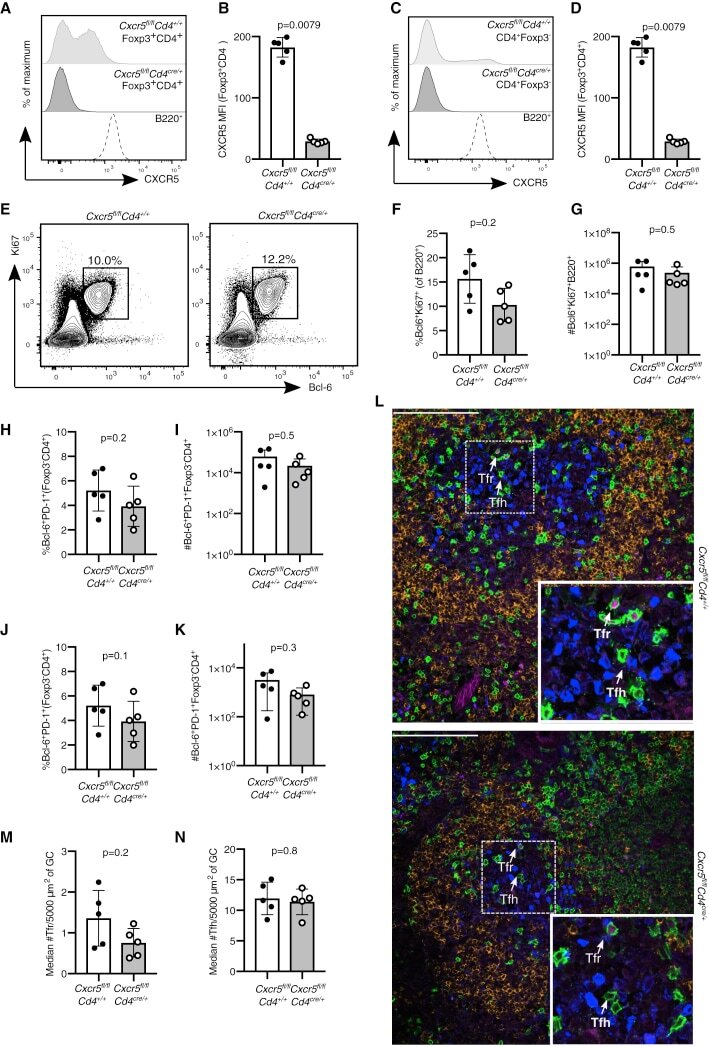
- Submitted by
- Invitrogen Antibodies (provider)
- Main image
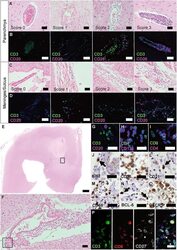
- Experimental details
- Figure 1 Ectopic lymphoid structures in progressive MS are characterized by infiltration of lymphocytes, FDCs and plasma cells. (A) Parenchyma of FFPE sections of brain and spinal cord of progressive MS patients were screened for infiltrated regions by H&E staining. (B) IF staining for CD3 + T cells and CD20 + B cells on serial sections were used to determine the infiltration score. Score 0, no or
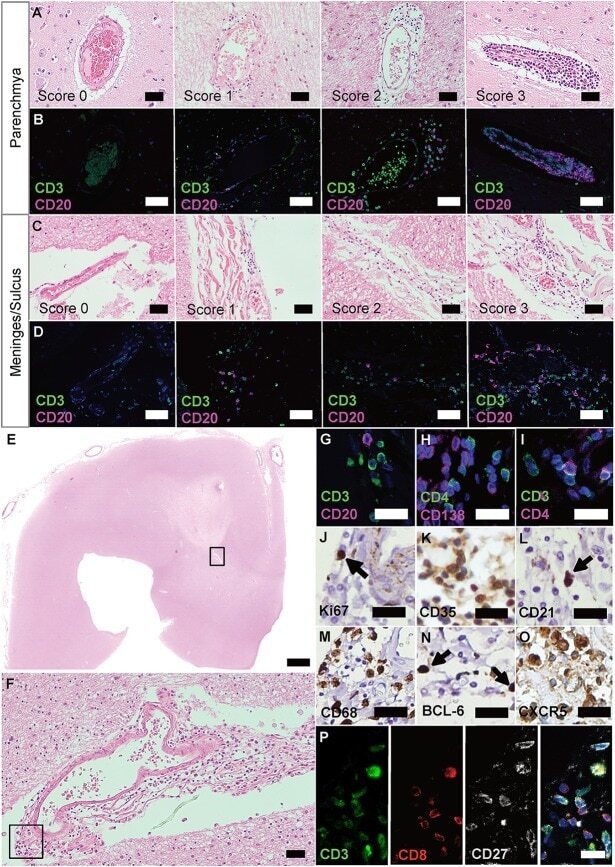
- Submitted by
- Invitrogen Antibodies (provider)
- Main image
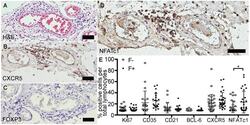
- Experimental details
- Figure 3 Follicle-like structures of SPMS brains are devoid of FOXP3 expression, but exhibit NFATc1 + cells. (A) Representative meningeal follicle-like structure of SPMS spinal cord, which was screened based on H&E staining and characterized by >60 lymphocytes (score 3), detection of Ki67 + , CD35 + /CD21 + , and CD138 + cells on serial sections, termed F+. F-, if no or not all criteria were fulfilled. (B) Follicle-like structures could be characterized by CXCR5 + , (C) but not by FOXP3 + cells. (D) NFATc1 + cells were present in follicle-like structures. (E) IHC stainings of Ki67, CD35, CD21, BCL-6, CXCR5, and NFATc1 were quantified as frequency of total cells in follicle-like structures (F+) and less defined infiltrates (F-). Ki67 : F-, M = 1.52, SD = 3.73, n = 45; F+, M = 1.89, SD = 3.55, n = 38; Mann Whitney test, U = 734.0, p = 0.161. CD35 : F-, M = 15.41, SD = 22.95, n = 22; F+, M = 19.05, SD = 14.75, n = 21; Mann Whitney test, U = 159.0, p = 0.081. CD21 : F-, M = 5.68, SD = 10.63, n = 21; F+, M = 3.51, SD = 5.60, n = 20; Mann Whitney test, U = 183.5, p = 0.488. BCL-6 : F-, M = 0.32, SD = 1.08, n = 44; F+, M = 0.49, SD = 1.62, n = 38; Mann Whitney test, U = 803.0, p = 0.642. CXCR5 : F-, M = 14.72, SD = 17.24, n = 30; F+, M = 20.11, SD = 15.73, n = 29; Mann Whitney test, U = 319.0, p = 0.080. NFATc1 : F-, M = 7.15, SD = 11.68, n = 28; F+, M = 16.36, SD = 21.46, n = 31; Mann Whitney test, U = 307.0, p = 0.043. Scale bars A-D indicate 100 mum. *, p < 0.05.
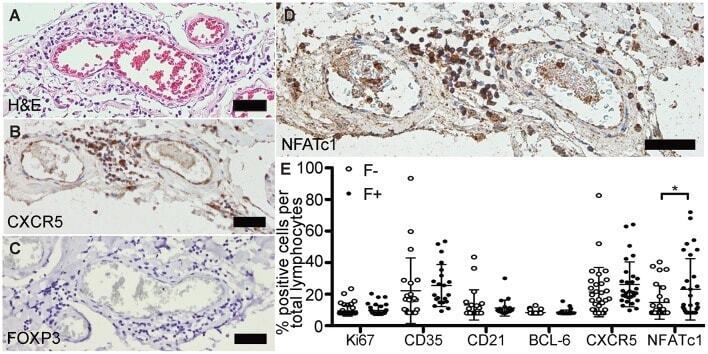
- Submitted by
- Invitrogen Antibodies (provider)
- Main image

- Experimental details
- Figure 1 Anti-commensal IgG Is Associated with the Magnitude of Intestinal Inflammation (A) Analysis of human Ig heavy-chain gene transcripts in healthy and UC colonic biopsies. Data were derived from Gene Expression Omnibus (GEO) dataset GEO: GSE9452 . (B) IgG- and IgA1- and IgA2-bound SYBR green hi microbes in UC and household healthy control (HHC) stool samples were analyzed as household pairs (n = 6 per group). (C) Correlation of pooled IgG- and IgA1- and IgA2-bound bacterial levels with clinical activity index (CAI) (n = 12). (D) Murine colon luminal IgG and IgA levels following two cycles of DSS administration (cDSS) and normalized to total protein content (n = 10 per group). Medians are indicated. (E) Quantification of IgG-bound bacteria in stool after a single acute course of 6-day 2% DSS administration (aDSS) or H 2 O with (red) and without (black) paired serum pre-incubation (n = 6-9 per group). Medians are indicated. (F) Correlation of IgG-bound commensals (no serum) from pooled control and colitic mice at day 21 after aDSS with markers of colonic inflammation; length and neutrophil count (n = 20) are shown. In (D)-(F), data are pooled from two independent experiments. (G) Opsonization of commensal bacterial species with day 21 aDSS serum or healthy control serum (day 0) (n = 5 per group). Medians are indicated. Data are representative of two independent experiments. (H) Confocal image of control or inflamed colons from cDSS-treated mice (red, IgG; green, Ki67; whi
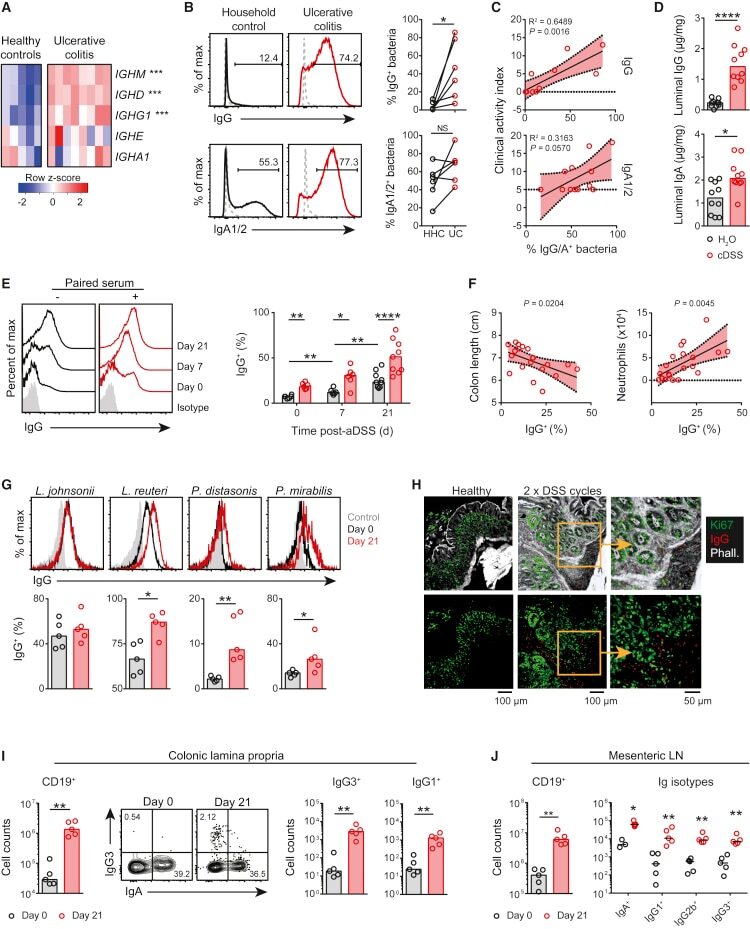
- Submitted by
- Invitrogen Antibodies (provider)
- Main image
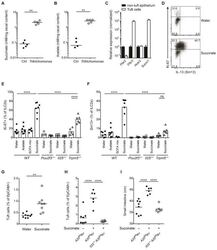
- Experimental details
- Figure 6 Succinate is produced by Tritrichomonas and sufficient to activate the tuft cell - ILC2 circuit (A and B) GF mice monocolonized with Tritrichomonas and concentrations of acetate (A) and succinate (B) measured in the cecal content after 6 weeks. (C) Metabolite receptor mRNA expression quantified by qPCR in tuft cells versus other epithelial cells sorted from small intestine (SI) and normalized to levels in non-tuft epithelial cells. (D-F) Tritrichomonas -free IL-13-reporter (Sm13) mice were treated with succinate, acetate or a SCFA mix (acetate, butyrate, propionate) in drinking water for 4 days. Expression of Ki-67 and IL-13 by ILC2s in SI quantified by flow cytometry and representative dot plot from wild-type (WT) mice shown (D). Expression of Ki-67 (E) and IL-13 (F) by ILC2s from WT, Pou2f3 -/- , Il25 -/- and Trpm5 -/- mice treated with indicated solutions. (G) Tritrichomonas -free WT mice treated with 100 mM succinate in drinking water for 10 days. Frequencies of tuft cells in SI by flow cytometry. (H and I) Tritrichomonas -free A20 fl R+ and Il25 -/- A20 fl R+ mice treated with 100 mM succinate in drinking water for 25 days and frequencies of tuft cells (H) and SI length (I) analyzed. Data from one experiment (A, B) or from one experiment representative of at least two independent experiments (C, D, G-I) or pooled from multiple independent experiments (E, F). C, mean and s.e.m.; n = 3. **p < 0.01, ****p < 0.0001; ns, not significant by M
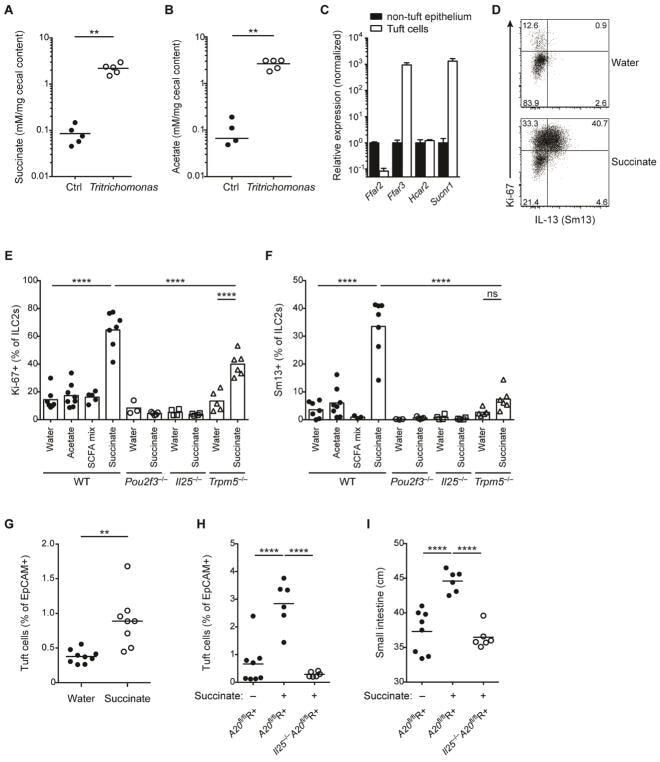
- Submitted by
- Invitrogen Antibodies (provider)
- Main image
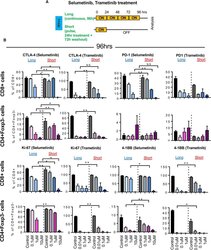
- Experimental details
- Figure 2 Short Schedule of MEKi Treatment Alters T Cell Activation Status ExVivo (A) Schema of ex vivo short versus long treatmentexperiment. (B) CTLA-4, PD1, Ki-67, and 4-1BB expression in CD8+ T cells andCD4+Foxp3 cells by flow cytometry after selumetinib (left) or trametinib (right)treatment for 96 hr. *p < 0.05; **p < 0.01, Welch'stest. Error bars represent SD. Samples were biological replicates. Theexperiment was performed twice, and representative results are shown here.
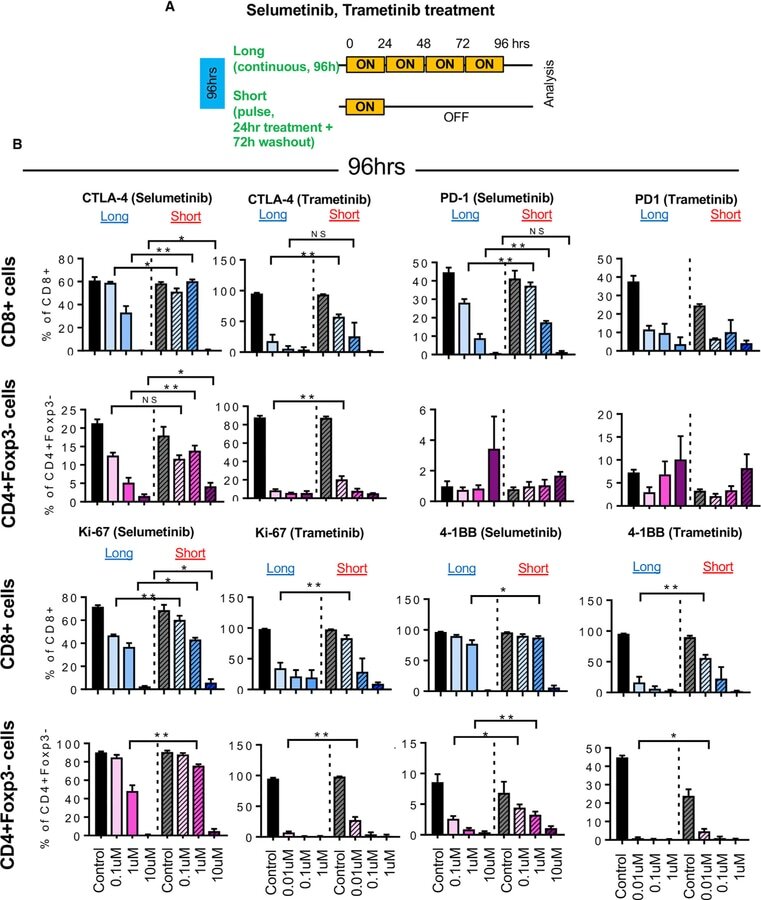
- Submitted by
- Invitrogen Antibodies (provider)
- Main image
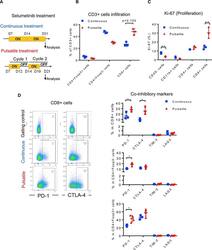
- Experimental details
- Figure 4 Pulsatile Treatment of Selumetinib Induces CTLA-4 and PD-1 Expression In Vivo HKP1 transplantable lung-tumor-bearing mice were treated withselumetinib (25 mg/kg, BID) as presented in (A). After 2 weeks of treatment,lungs were collected and analyzed by flow cytometry. (A) Schema of selumetinib treatment in HKP1 lung-tumor-bearing mice in vivo . (B) Frequency of CD3+ T cell subsets in lung tumors by flowcytometry. (C) Ki-67 of diverse cell populations in lung tumors by flowcytometry. (D) Scatterplots of PD-1 and CTLA-4 marker (left) and co-inhibitorymarker expression from CD3+ T cell subsets of lung tumors by flow cytometry(right). Gating controls are samples without either PD-1 or CTLA-4antibodies. *p < 0.05; **p < 0.01; ***p < 0.001, Mann-Whitneytest. Samples were biological replicates. The experiment was performed 3 times,and representative results are shown here.
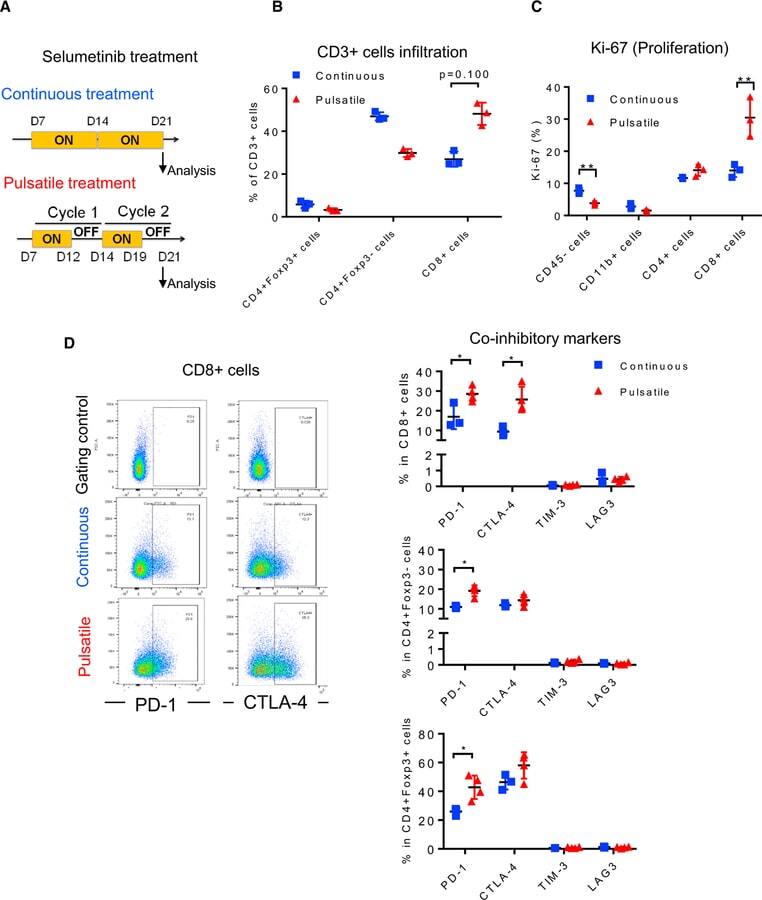
- Submitted by
- Invitrogen Antibodies (provider)
- Main image
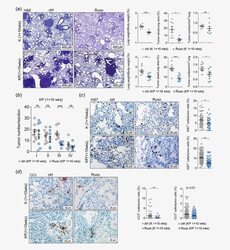
- Experimental details
- Figure 3 Ruxolitinib attenuates tumorigenesis of autochthonous K-RAS-driven lung AC. ( a ) Left panel: representative pictures of hematoxylin and eosin stained lung sections of vehicle control (ctrl) or ruxolitinib (Ruxo) treated K - ras G12D (K) mice ( n = 7 per group) and K - ras G12D : p53 fl/fl (KP) mice ( n = 8 per group). Treatment was started 1 week post tumor initiation, and continued for 10 weeks, with ruxolitinib being administered at 90 mg/kg body weight, seven times per week, BID (scale bars: 400 mum). Right panel: quantitation of hematoxylin and eosin stained lung sections from K mice (upper) and KP-mice (lower) treated with ctrl or Ruxo started 1 week post tumor initiation and continued for 10 weeks. ( b ) Graph depicts tumor numbers per section stratified by tumor grades. Per mouse, one section was analyzed ( n = 8 mice per group). ( c ) Left panel: representative pictures of immunohistochemical stainings for KI67 positive cells of lungs stemming from ctrl and Ruxo treated K and KP mice. Right panel: quantitation of indicated stainings. ( d ) Left panel: cleaved caspase-3 positive cells of lungs of ctrl and Ruxo treated K and KP mice. Right panel: quantitation of indicated stainings (scale bars: 50 mum). ( c , d ) Mann-Whitney U -test, * p < 0.05, ** p < 0.01, *** p < 0.001. Others: Student's t -test. * p < 0.05, ** p < 0.01, *** p < 0.001. For all graphs data presented as means +- SEM. [Color figure can be viewed at http://wileyonlinelib

- Submitted by
- Invitrogen Antibodies (provider)
- Main image
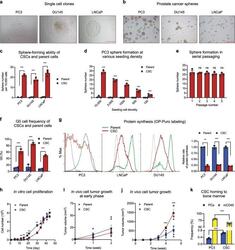
- Experimental details
- Fig. 1 Isolation and characterization of prostate CSCs. a Morphology of single cell clones isolated from PC3, DU145, and LNCaP. Scale bar: 500 mum. b Cancer sphere formed from CSCs cultured in sphere medium in bacteriological petri dishes. Scale bar: 500 mum. c Sphere formation of the CSC lines and their respective parent cells at seeding density of 10,000 per 2 ml in 35-mm dishes ( n = 3). d Sphere formation of PC3 CSCs and parent cells at 100-10,000 cells per 2 ml in 35-mm dishes ( n = 3). e Sphere formation during serial passaging (10,000 cells per 2 ml in 35-mm dishes) ( n = 3). f G0 cell population of CSCs and parent cell lines determined by flow cytometry after Ki-67 and 7-AAD staining ( n = 3). g Protein synthesis rate in CSCs and parent cells determined by OP-Puro incorporation followed by flow cytometry analysis ( n = 3). Geometric mean was calculated by FlowJo. Bar graphs representing relative protein synthesis rate between CSCs and respective parent cells. h In vitro growth curves of CSCs and parent cells of PC3. Seeding density was 10,000 cells per well of 48-well plates ( n = 3). Early ( i ) and late ( j ) phase of in vivo growth of PC3 CSCs and parent cells in NSG mice. A mixture of 50 mul HBSS containing 50,000 cells and 50 mul Matrigel was inoculated in NSG mice ( n = 8). Tumor size was measured every week. k Bone marrow niche binding of PC3 cells and CSCs. GFP-labeled PC3 cells or CSCs were administered to NSG mice that had been transp
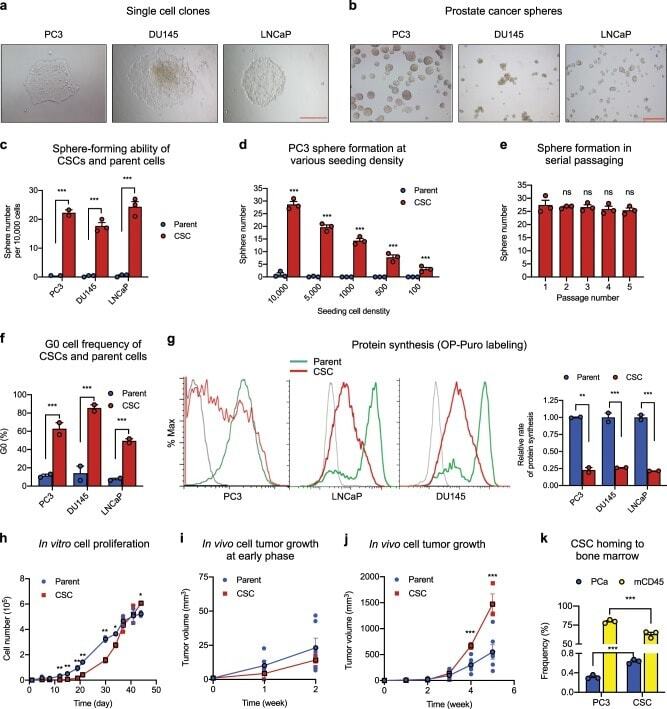
- Submitted by
- Invitrogen Antibodies (provider)
- Main image
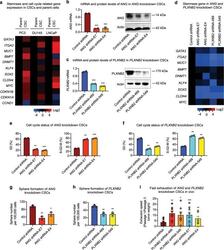
- Experimental details
- Fig. 3 Knockdown of ANG or PLXNB2 decreases stemness of prostate CSCs. a mRNA levels of cancer stemness-related genes in prostate CSCs and parent cells ( n = 5). Values in the CSCs were normalized to the respective parent cells. mRNA and protein levels of ANG ( b ) and PLXNB2 ( c ) in knockdown CSCs. mRNA levels were determined by qRT-PCR and normalized to control shRNA transfectants ( n = 3). Protein levels were determined by immunoblotting. d mRNA level of cancer stemness-related genes in ANG and PLXNB2 knockdown CSCs ( n = 3). Values were normalized to the control shRNA transfectants. Cell cycle status of ANG ( e ) and PLXNB2 ( f ) knockdown CSCs, analyzed by flow cytometry after Ki-67 and 7-AAD staining ( n = 2). Sphere formation of ANG ( g ) and PLXNB2 ( h ) knockdown CSCs ( n = 3). i CSC exhaustion during serial passaging in vivo. Cells were passaged in NSG mice ( n = 5-8) for three times. In each passage, 100,000 cells were inoculated per mouse. Tumors were excised and weighed 4 weeks post inoculation in each passage. Exhaustion rate was calculated as the ratio of tumor weight from first passage to third passage. * p < 0.05; ** p < 0.01; *** p < 0.001.
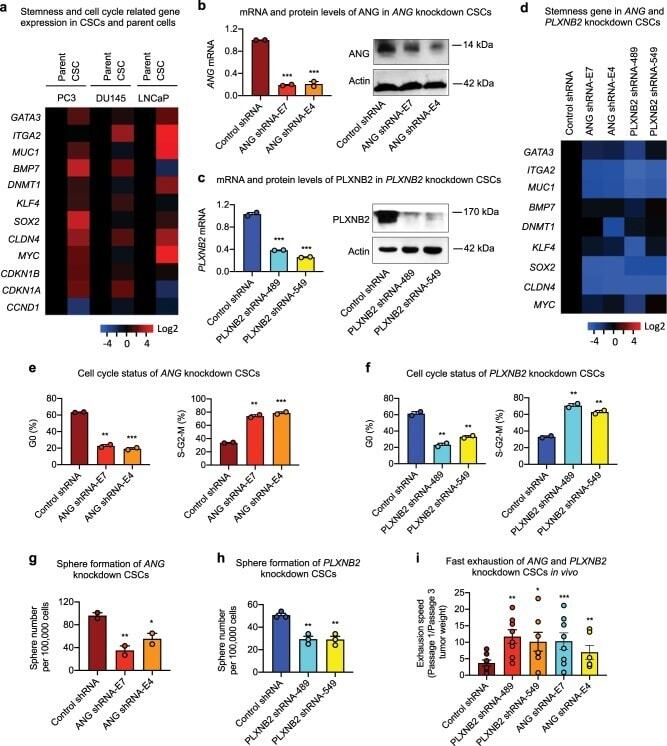
- Submitted by
- Invitrogen Antibodies (provider)
- Main image

- Experimental details
- Fig. 2 sTREM2 promotes microgliosis in 5xFAD mice and microglial migration. a The hippocampus was dissected from vehicle- or sTREM2-injected 5xFAD mice. After RNA extraction, the relative mRNA levels of Iba1 and GFAP in the hippocampus shown as a bar graph were determined by quantitative real-time PCR. beta-actin was used as an internal control ( n = 4 mice per group, paired Student's t test). b Iba1 and GFAP proteins were analyzed by Western blotting 7 days after sTREM2 injection to the hippocampus of 5xFAD mice. c Quantitation of the protein levels of Iba1 and GFAP in b ( n = 4 mice per group, paired Student's t test). d Coronal sections from injected 5xFAD mice were stained with DAPI (blue) for nuclei, Ki67 (green) for proliferating cells, and Iba1 (red) for microglia. Representative z-stack images of the hippocampus regions are shown. Original magnification x20; scale bar, 100 mum. Images on the right represent enlarged Ki67-positive cells with a scale bar equal to 20 mum. e Quantitation of the number of Iba1-positive cells in d ( n = 5 mice, 22 fields of each group for analysis, paired Student's t test). f Quantitation of the number of proliferating microglial cells, as indicated by the co-staining of Ki67 and Iba1 (Iba1 + Ki67 + ) ( n = 5 mice, 22 fields of each group for analysis, paired Student's t test). g Primary microglial cells (10 5 ) from WT mice were plated onto transwell chamber inserts. Following 24-h incubation with vehicle (PBS
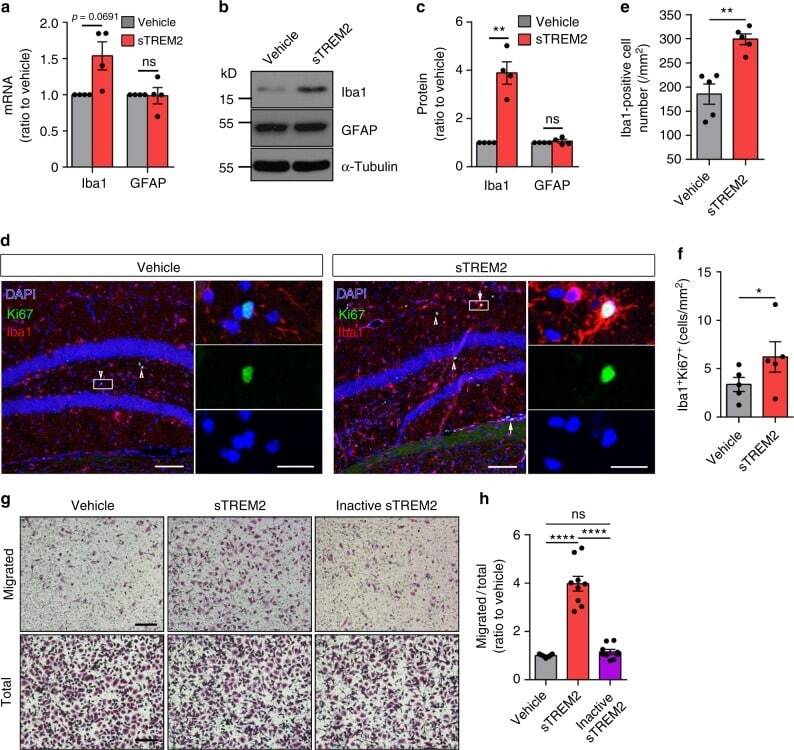
- Submitted by
- Invitrogen Antibodies (provider)
- Main image
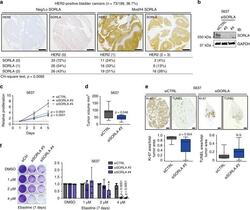
- Experimental details
- Fig. 6 SORLA expression correlates with HER2 and promotes tumorigenesis in bladder carcinoma. a Immunohistochemical staining of a bladder cancer TMA and correlation analyses of SORLA and HER2 levels. Numbers indicate staining intensity, 0 = negative, 1 = weak, 2 = moderate, 3 = high. b Western blot analysis of SORLA levels in siCTRL and siSORLA (siSORLA#3, siSORLA#4) 5637 bladder cancer cells. GAPDH is a loading control. c Analysis of siCTRL and siSORLA (siSORLA#3, siSORLA#4) 5637 cell proliferation (mean +- s.d; n = 4 independent experiments; statistical analysis: two-way ANOVA). d Analysis of tumour growth of subcutaneously injected 5637 cells, with transient SORLA (siSORLA #3) or scramble (siCTRL) silencing, at day 29 in nude mice ( n = 9 siCTRL and 10 siSORLA mice; statistical analysis: unpaired Student's t test). e Ki-67 and TUNEL staining of tumour samples prepared as described in d and quantifications displayed as box plots ( n = 9 siCTRL and 10 siSORLA mice; statistical analysis: Mann-Whitney test). f Colony formation assay with SORLA-silenced and control-silenced 5637 cells treated with different concentrations of ebastine for 7 days. Quantification of confluency was performed using ImageJ Colony Area Plug-in 49 . Results are shown as mean +- s.d. ( n = 4 independent experiments; statistical analysis: unpaired Students t test). Scale bars: 200 um ( a ), 500 um ( e ). Box plots represent median and IQR and whiskers extend to maximum and minimum
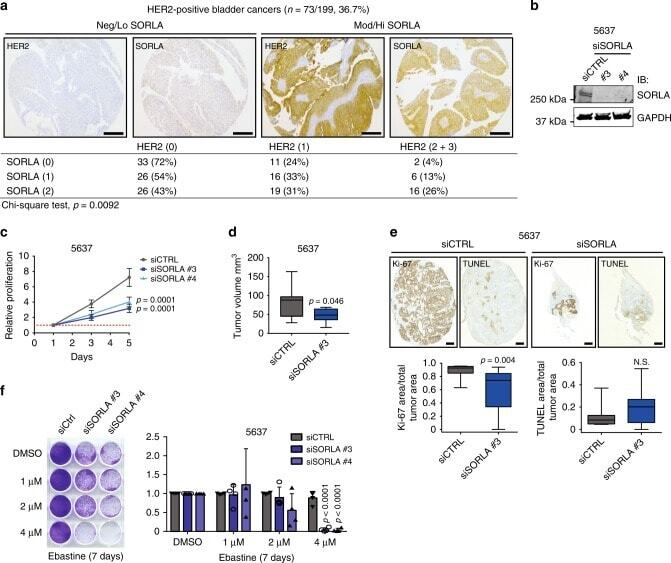
- Submitted by
- Invitrogen Antibodies (provider)
- Main image
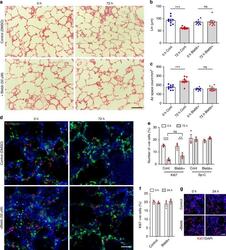
- Experimental details
- Fig. 7 Blebbistatin inhibits ex vivo alveologenesis. H&E stained sections from P3 PCLS at 0 and 72 h, cultured with DMSO control (top panels) or 50 muM blebbistatin (bottom panels) ( a ). Scale bar = 100 um. Mean linear intercept (Lm) ( b ) and airspace count ( c ) obtained from H&E sections of P3 PCLS treated with DMSO control or 50 muM blebbistatin at 0 and 72 h, n = 3 independent experiments using 3 separate mice, 3 H&E sections from each PCLS from each mouse were quantified per group, per experiment, each dot represents per field count ( b , c ); *** p < 0.001, ns = not significant, one-way ANOVA with Tukey's post hoc test. Confocal single plane z-stack images of DMSO control (top panels) and 50 uM blebbistatin (bottom panels) P3 PCLS at 0 and 72 h culture, immunostained with Ki67 (red), Sp-C (green) and DAPI (blue) ( d ). Scale bar = 50 um. Quantification of Ki67 and Sp-C +ve cells in control and blebbistatin-treated P3 PCLS at 0 and 72 h culture ( e ), n = 3 independent experiments using 3 separate mice, with duplicate slices per group per experiment. Two fields were quantified per slice. Each dot represents mean value of per field counts per experiment; ** p < 0.01; *** p < 0,001; ns = not significant; one-way ANOVA with Tukey's post hoc test. Quantification of Ki67 +ve cells in DMSO control and blebbistatin-treated P3 PCLS at 0 and 24 h in culture ( f ), n = 3 independent experiments using 3 separate mice, with duplicate slices per group, per experiment. Two
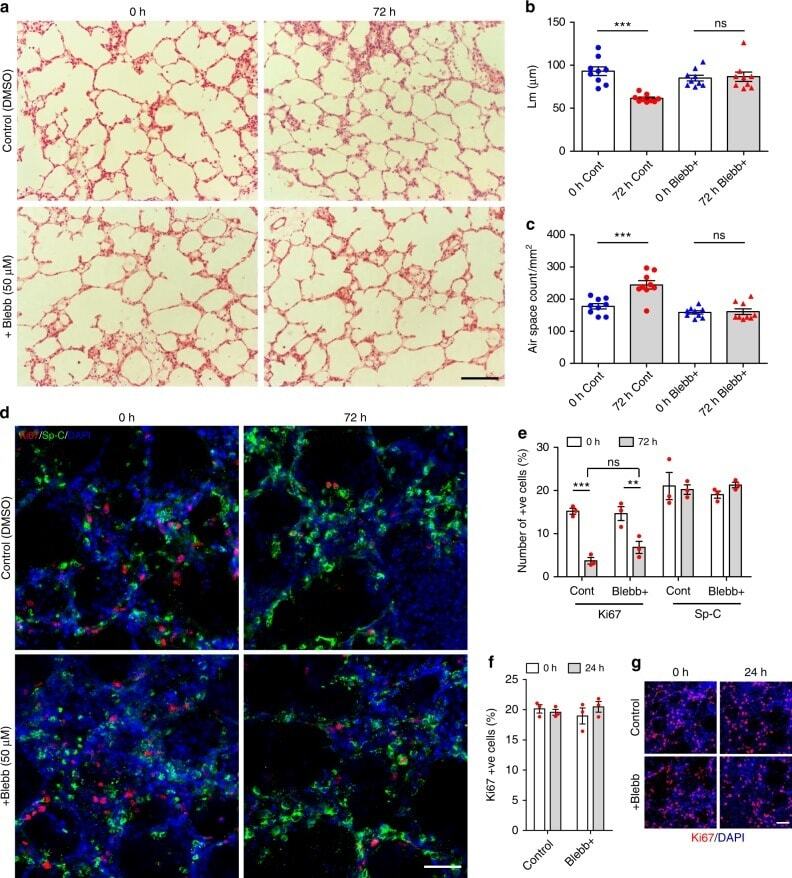
- Submitted by
- Invitrogen Antibodies (provider)
- Main image
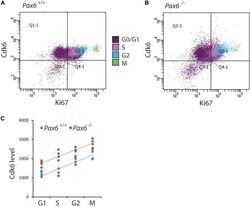
- Experimental details
- FIGURE 4 Flow cytometric analysis of Cdk6 levels at different phases of the cell cycle in Pax6 +/+ and Pax6 -/- cortex at E12.5. (A,B) Fluorescence intensity of Cdk6 against Ki67: Samples from a Pax6 +/+ and a Pax6 -/- embryo with cells classified according to their cell cycle phase by methods illustrated in Figure 3 . G1 cells were distinguished from G0 cells by positivity for Ki67 in quadrants Q2-1 and Q4-1 (cells in quadrants 1-1 and 3-1 were negative for Ki67). (C) Relative levels of Cdk6 in the cortex of four Pax6 +/+ and four Pax6 -/- embryos at each phase of the cell cycle. Each data point is the average level in the cortex of one embryo. Regression analysis of levels of Cdk6 against cells cycle phase gave r 2 values of 0.78 for Pax6 +/+ data and 0.81 for Pax6 -/- data. ANOVA showed a significant effect of genotype (alpha = 0.05) and Sidak's multiple comparisons tests showed significantly higher levels of Cdk6 in Pax6 -/- cortex in all phases (G1, p = 0.0075; S, p < 0.0001; G2, p = 0.0167; M, p = 0.0019).
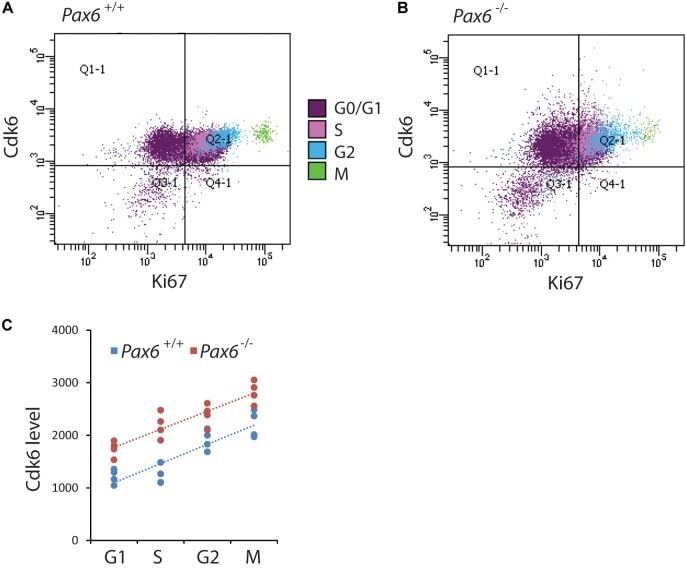
- Submitted by
- Invitrogen Antibodies (provider)
- Main image
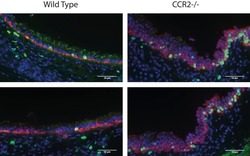
- Experimental details
- Figure 4. Increased cell cycle reentry of airway basal cells in CCR2 -/- airways following resolution of influenza virus infection. Representative immunostaining of murine tracheal epithelium of C57BL/6 and CCR2 -/- mice, for Ki67 (green), Krt5 (red), and nuclei (blue) at 14 d after H1N1/PR8 influenza A infection. Two representative images are shown for each mouse strain at 14 d after influenza virus infection. All images were obtained using 20x objective lens with scale bars, 50 um.

- Submitted by
- Invitrogen Antibodies (provider)
- Main image
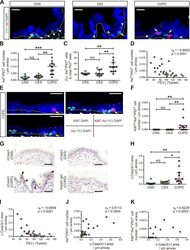
- Experimental details
- Figure 8. Proliferation of Axl-expressing basal cells is correlated with the abundance of apoptotic cells in small airways of patients with COPD. (A) Immunostaining of human small airway epithelium for P63 (a basal cell marker, green) and Axl (magenta) in control never-smokers (CNS), control ex-smokers (CES), and ex-smokers with COPD. Yellow arrows or white arrowheads indicate Axl + /TP63 + cells or Axl - /TP63 + cells, respectively. Dotted lines show basement membranes. (B and C) Quantification of the number of Axl-expressing TP63 + basal cells/um airway (B) and the percentage of Axl-expressing TP63 + basal cells to total TP63 + basal cells (C) in CNS, CES, and COPD. (D) Correlation between Axl + /TP63 + cell number/um airway and airflow limitation detected as forced expiratory volume in 1 s (FEV 1 , %pred). (E) Immunostaining for Ki67 (red), TP63 (green), and Axl (magenta) in small airways of COPD lung tissues. Yellow arrows indicate Ki67 + /Axl + /TP63 + cells. Dotted lines show basement membranes. (F) The increase in the Ki67-expressing Axl + /TP63 + basal cells in COPD compared with CNS and CES. (G) Immunohistochemistry of cleaved caspase 3 (cCasp3, brown, arrows) in bronchiolar epithelium of human lung tissues from CNS, CES, and COPD. Nuclei (purple) were visualized by hematoxylin. (H) Quantification of cCasp3-positive area/um of airways. (I) Correlation between cCasp3-positive area/um of airways and FEV 1 , %pred. (J and K) cCasp3 positivity is
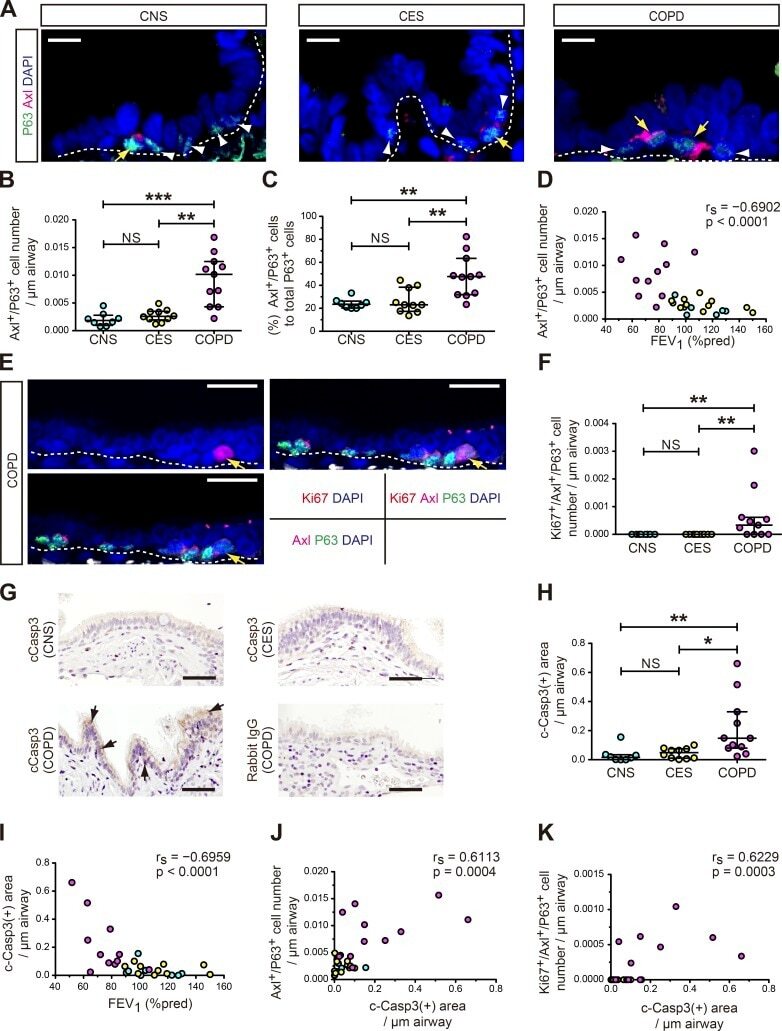
- Submitted by
- Invitrogen Antibodies (provider)
- Main image
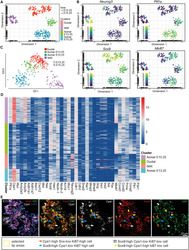
- Experimental details
- Figure 6 Single-Cell RNA Sequencing Analysis Suggests Early Fate Restriction and Ductal Origin of Progenitors (A and B) (A) t-SNE plot obtained from combining 516 single cells from pancreas obtained from n = 7 mice (n = 5 embryos at E13.25 and n = 2 embryos at E15.25) showing ductal, islet and early (E13.25) and late (E15.25) acinar clusters, as identified by the expression of marker genes shown in (B), Neurog3 (upper left ), Ptf1a (upper right and Figures S7 B and S7C), and Sox9 (lower left and Figures S7 D and S7E). Lower right of (B) shows MKi67 proliferation marker expression, showing evidence of segregation of the ductal cluster. Cell color indicates log transformed normalised read counts. Note that clusters of islet and ductal cells overlap at the two time points. (C) Diffusion pseudo-time plot reveals evidence of lineage segregation with ductal cells at the apex of a hierarchy that branches separately into acinar and islet lineages. (D) Expression levels of pancreas genes for individual cells at E13.25 and E15.25. (E) 7-mum-thick pancreatic section immunostained for Sox9, Cpa1, and Ki67 expression reveals molecular heterogeneity within ductal termini, with Ki67+ cells showing reciprocal expression of Sox9 and Cpa1 (blue and red arrows) as well as some cells positive for both markers (yellow arrows), and Sox9+ Ki67-high cells in the trunk areas (white arrows). See also Figure S7 .
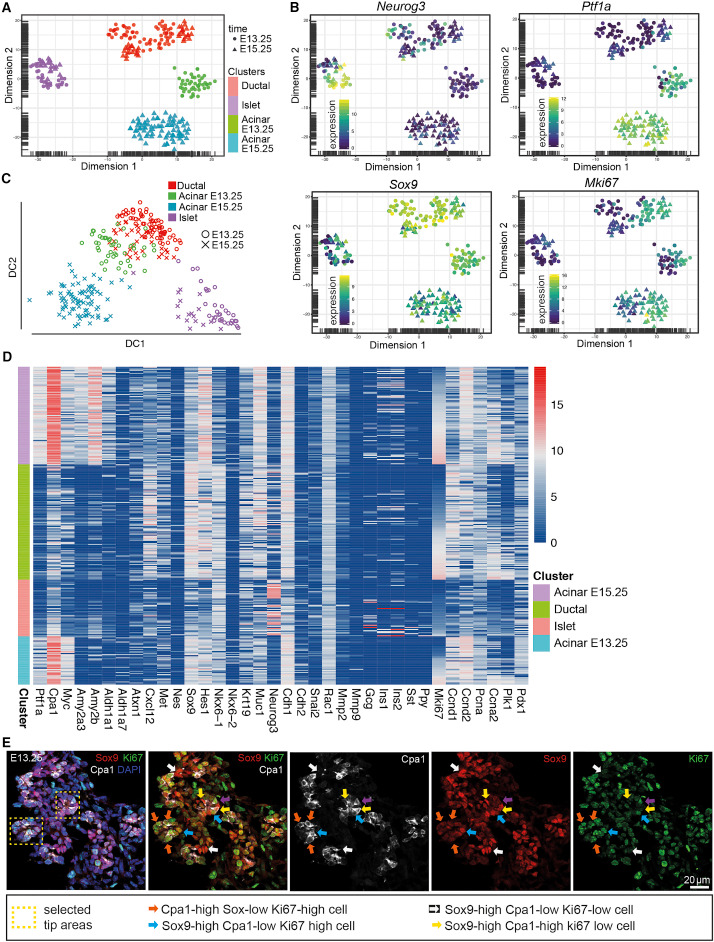
- Submitted by
- Invitrogen Antibodies (provider)
- Main image
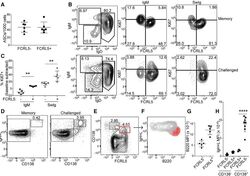
- Experimental details
- Figure 6. FCRL5 + MBCs Exhibit Robust Recall Responses (A) FCRL5 + and FCRL5 - MSP1-specific MBCs (B220 + CD38 + CD138 - GL7 - IgD - ) were sorted from mouse spleens 3-4 months post-infection. Antibody- secreting cells (ASCs) were enumerated by EliSPOT after 3 days restimulation in interleukin-2 (IL-2) + R848. (B-H) Four months after infection, mice were either challenged with 10 7 P. chabaudi parasites or were not challenged (memory). MSP1-specific B cells were analyzed 5 days later. (B) Representative flow plots of isotype distribution and Ki67 labeling in MSP1-specific MBCs (B220 + CD38 + CD138 - GL7 - ) with or without challenge. (C) Change in the percentage of IgM + and SwIg MBCs expressing Ki67 after challenge, relative to % Ki67 + without challenge. (D) Representative flow plots from memory and challenged mice showing the emergence of antibody-secreting cells (CD138 + IgH+L hi ) after challenge. (E) FCRL5 expression on CD138 int and CD138 hi cells in challenged mice. (F) Representative flow plot depicting expression of intracellular IgH+L and B220 on the populations defined in (E). (G and H) Levels of B220 (G) and intracellular IgH+L (H) on the populations defined in (E). In (H), IgH+L expression in CD138 - B cells is shown for comparison. Two independent experiments were performed and pooled (A-H). Graphs depict mean +- SEM and symbols represent individual mice. **p < 0.01 by Mann-Whitney test (C). ****p < 0.0001 by one-way ANOVA with Tukey's post-test. S
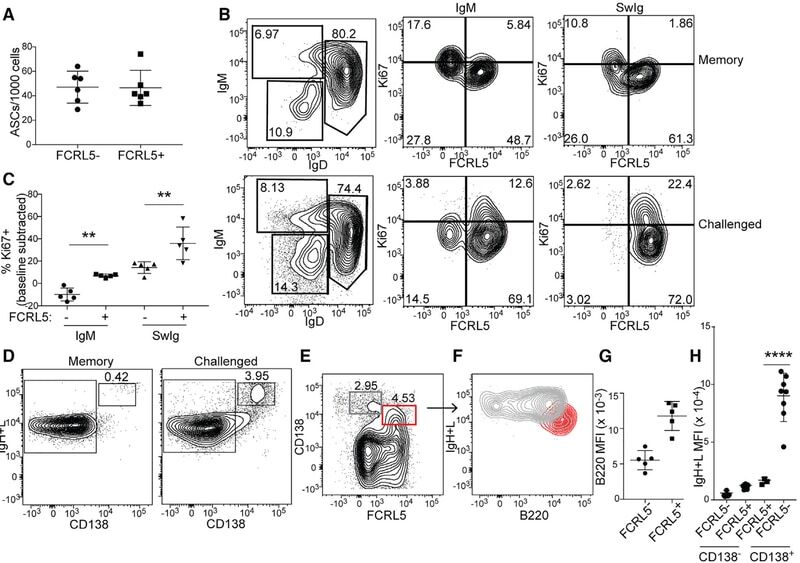
- Submitted by
- Invitrogen Antibodies (provider)
- Main image
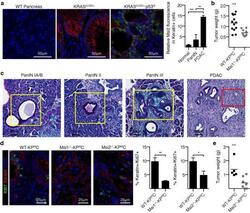
- Experimental details
- Extended Data Figure 4 Analysis of tumors from Msi KP f/f C mice ( a ) Msi2 (green) and Keratin (red) immunofluorescent staining was performed on tissue sections from WT pancreas (Normal, n=3 samples), KRAS G12D/+ ;Ptf1a Cre/+ (PanIN, n=2 samples), and KRAS G12D/+ ;p53 f/f ;Ptf1a Cre/+ (PDAC, n=3 samples) mice with quantification of Msi2 fluorescence in Keratin positive cells. ( b ) Average weights of WT-KP f/f C (n=13) and Msi1 -/- -KP f/f C tumors (n=9). See also Figure 2h-i . for tumor volume analysis ( c ) PAS and Alcian Blue stained sections of pancreata isolated from WT-KP f/f C represent areas used to identify the stages of PanINs (yellow boxes) and adenocarcinoma (red box). ( d ) Tumors from 11-13 week old WT-KP f/f C (n=6), Msi1 -/- -KP f/f C (n=3), and Msi2 -/- -KP f/f C (n=3) mice were stained and quantified for percent of Keratin+ tumor cells (red) expressing Ki67 (green); DAPI staining is shown in blue. ( e ) Average weights of WT-KP f/f C (n=5) and Msi2 -/- -KP f/f C tumors (n=7). See also Figure 2h-I for tumor volume analysis. Data are represented as mean +- SEM. * P < 0.05, ** P < 0.01 , *** P < 0.001 by Student's t-test or One-way ANOVA. Source Data for all panels are available online.
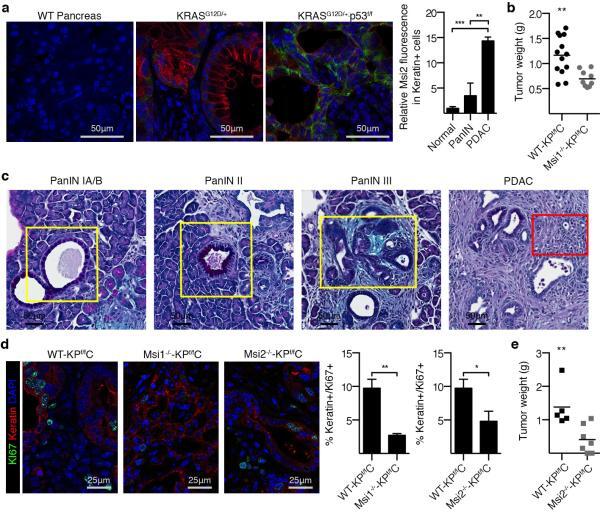
- Submitted by
- Invitrogen Antibodies (provider)
- Main image

- Experimental details
- 6 FIGURE Down-regulation of the inwardly rectifying K ir 4.1 channel in a fraction of proliferating non-juxtavascular astrocytes and juxtavascular astrocytes. (a-f) Confocal maximum z-projections (optical sections 1-27) of a lesioned hemisphere 5 dpi (P51). The four upper pictures show from left to right and up to down Aldh1l1-eGFP expressing astrocytes (a), K ir 4.1 staining (b), blood vessels and activated microglia visualized with TL 649 (c), and the proliferation marker Ki67 (d). (e) The left lower picture shows an overlay of Aldh1l1-eGFP positive astrocytes coded in green and the blood vessels and activated microglial cells in red. (f) The overlay shows Aldh1l1-eGFP-positive astrocytes (green), K ir 4.1 (red), and Ki67-positive nuclei (blue). Arrows indicate non-juxtavascular and juxtavascular non-proliferating astrocytes immunopositive for K ir 4.1. The dashed double arrows point to non-juxtavascular and juxtavascular astrocytes that are double positive for K ir 4.1 and Ki67. Proliferative (Ki67-positive), but K ir 4.1-negative astrocytes are marked with an asterisk. The dashed circle indicates the astrocytic domain of two proliferating astrocytes that are negative for K ir 4.1. Scale bar: 38 mum. (g) Ki67-positive non-juxtavascular and juxtavascular astrocytes were counted in five lesioned Aldh1l1-eGFP mice (P51-65) at 5 dpi. The majority of the proliferative astrocytes were K ir 4.1-postive. The difference between the two subclasses of astrocytes was a more pronounced
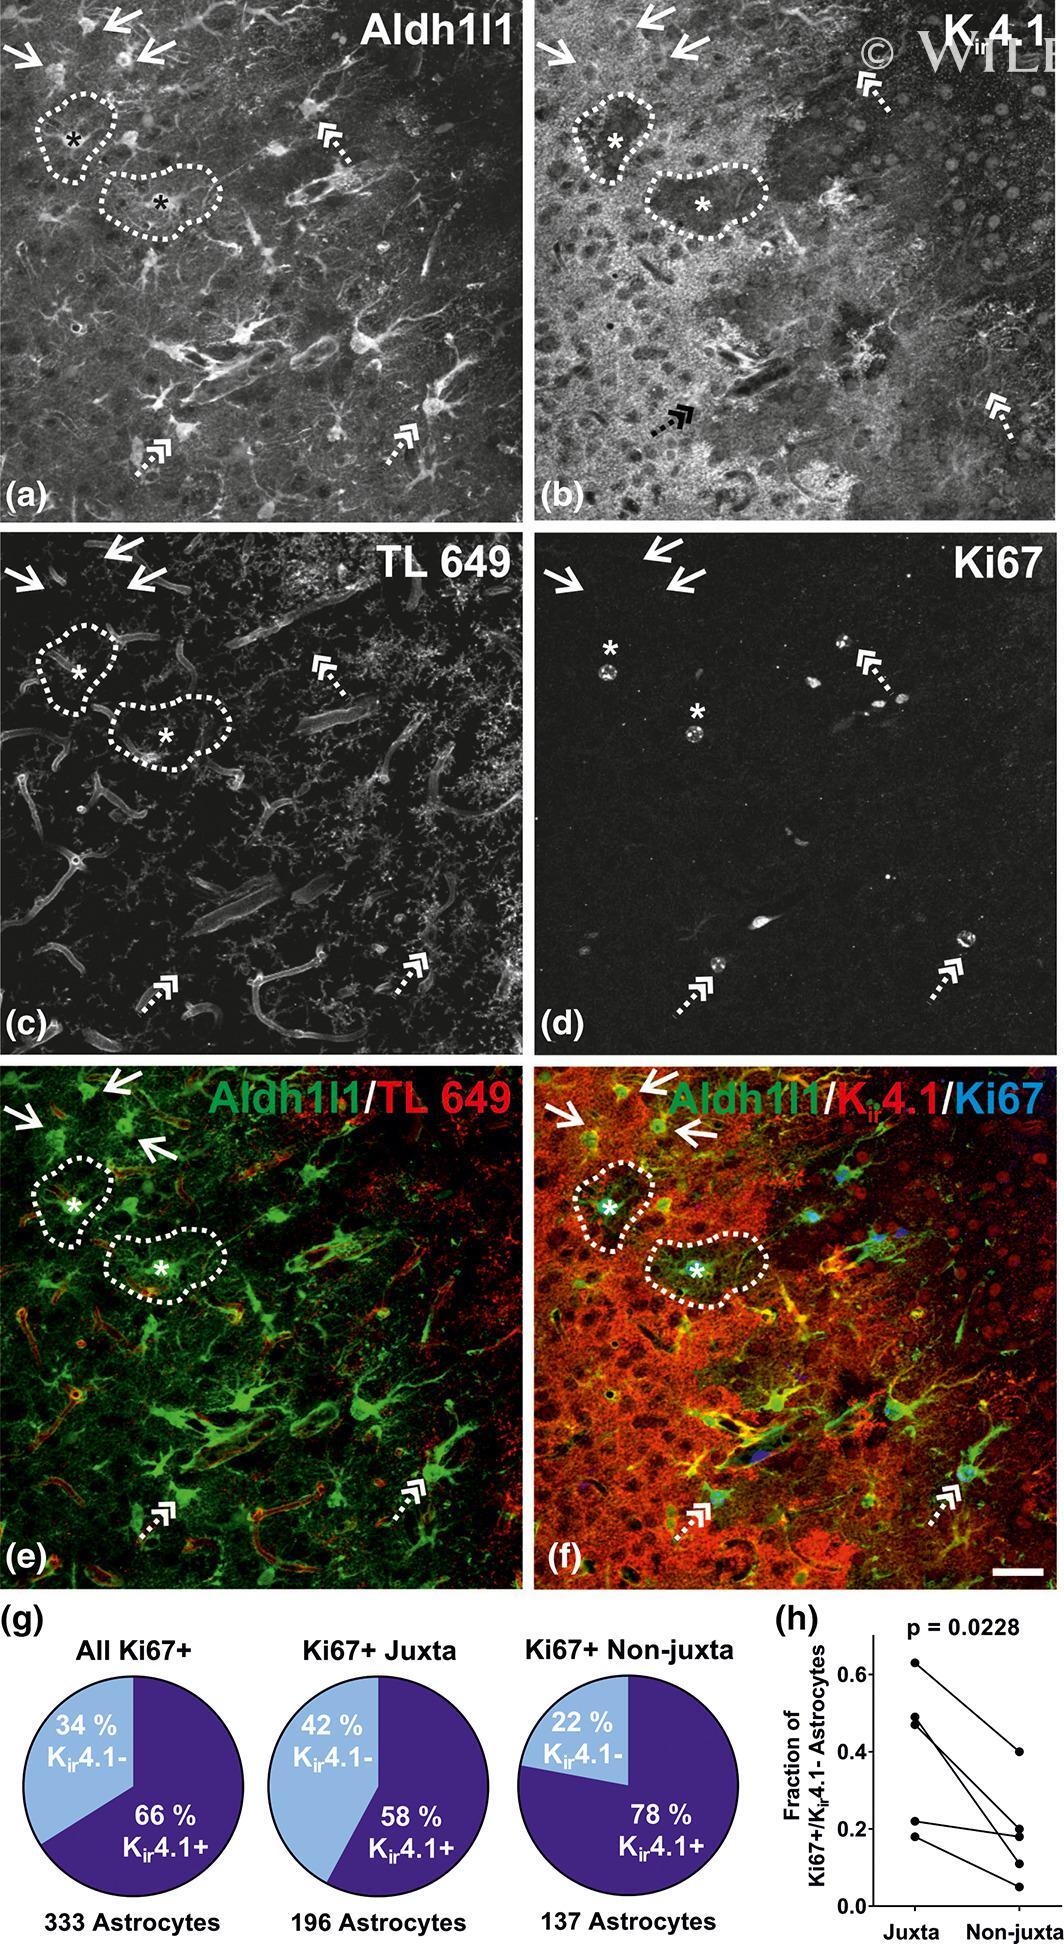
- Submitted by
- Invitrogen Antibodies (provider)
- Main image
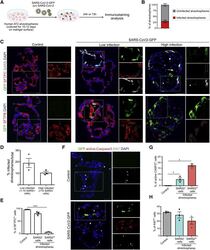
- Experimental details
- Figure 4 SARS-CoV-2 Infection Induces Loss of Surfactants and AT2 Death (A) Schematic for SARS-CoV-2-GFP infection in human alveolospheres. Alveolospheres were cultured in SFFF medium, infected with SARS-CoV-2 virus, and collected for histological analysis. (B) Quantification of the percentage of SARS-CoV-2-infected alveolospheres. (C) Immunostaining for GFP (green), SFTPC (red), and SARS (gray) (top panel) and GFP (green) and SFTPB (red) (bottom panel) in control, ""low,"" and ""high"" SARS-CoV-2-GFP-infected human lung alveolospheres at 72 h post-infection. Scale bar: 50 mum. (D) Quantification of low-infected (1-10 SARS-CoV-2 + cells) and high-infected (10 or more SARS-CoV-2 + cells) alveolospheres. (E) Quantification of SFTPC + cells in uninfected control and SARS - and SARS + cells in virus-infected alveolospheres. (F) Immunostaining for GFP (green) in combination with the apoptotic marker active caspase 3 (red) and proliferation marker Ki67 (gray) in control and SARS-CoV-2-GFP-infected alveolospheres. Scale bar: 30 mum. (G and H) Quantification of active caspase-3 (CASP3) + (G) and Ki67 + (H) cells in uninfected control (gray), SARS-CoV-2 - cells (blue), and SARS-CoV-2 + cells in infected alveolospheres. The white box in the merged image indicates the region of single-channel images. DAPI stains nuclei (blue). All quantification data are presented as mean +- SEM.
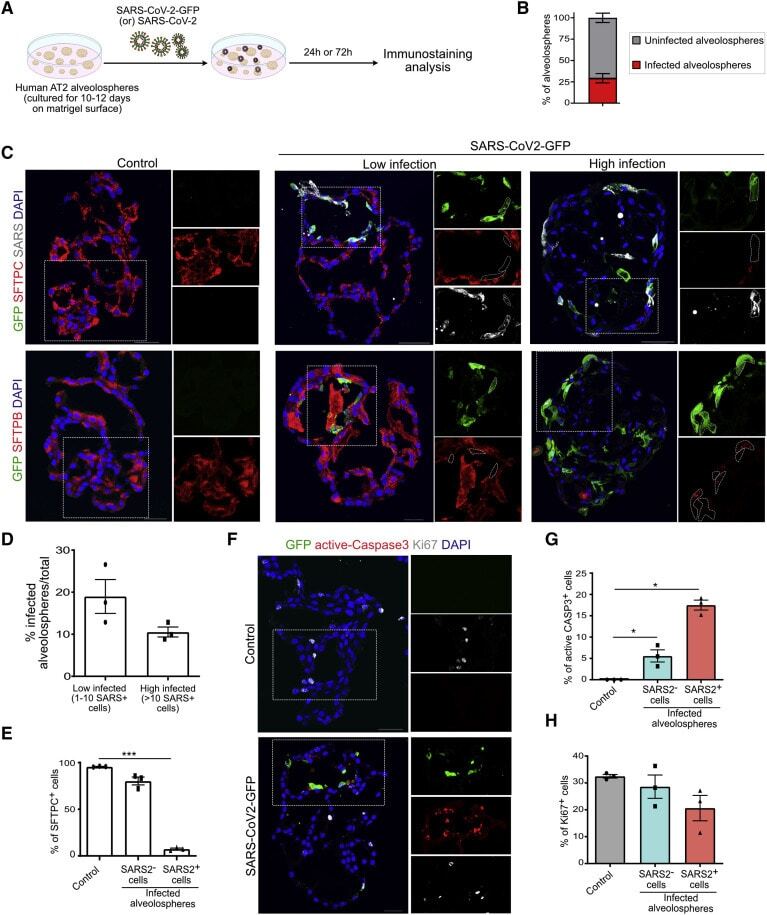
- Submitted by
- Invitrogen Antibodies (provider)
- Main image
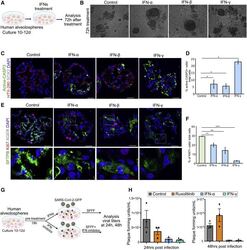
- Experimental details
- Figure 6 IFN Treatment Recapitulates Features of SARS-CoV-2 Infection Including Cell Death and Loss of Surfactants in Alveolosphere-Derived AT2s (A) Schematic of experimental design. Human lung alveolospheres were treated with IFNalpha, IFNbeta or IFNgamma for 72 h. (B) Representative images of control and IFNalpha-, IFNbeta-, and IFNgamma-treated human lung alveolospheres. (C) Immunostaining for active-caspase-3 (green), HTII-280 (red), and SOX2 (gray) in control and IFN-treated alveolospheres. DAPI stains nuclei (blue). Scale bar: 30 mum. (D) Quantification of active caspase-3 + cells in total DAPI + (per alveolosphere) cells in control and IFN-treated human alveolospheres. (E) Immunostaining for SFTPB (green), Ki67 (red), and AGER (gray) in controls and IFNalpha-, IFNbeta-, or IFNgamma-treated human alveolospheres. DAPI stains nuclei (blue). Scale bar: 30 mum. (F) Quantification of Ki67 + cells in total DAPI + cells in control and IFN-treated human alveolospheres. * p < 0.05; ** p < 0.01; *** p < 0.001. (G) Schematic of IFNs or IFN inhibitor treatment followed by SARS-CoV-2 infection. (H) Viral titers in control (gray), ruxolitinib-treated (orange), IFNalpha-treated (blue), and IFNgamma-treated (green) cultures were determined by plaque assay using media collected from alveolosphere cultures at 24 and 48 h post-infection. Data are presented as mean +- SEM.
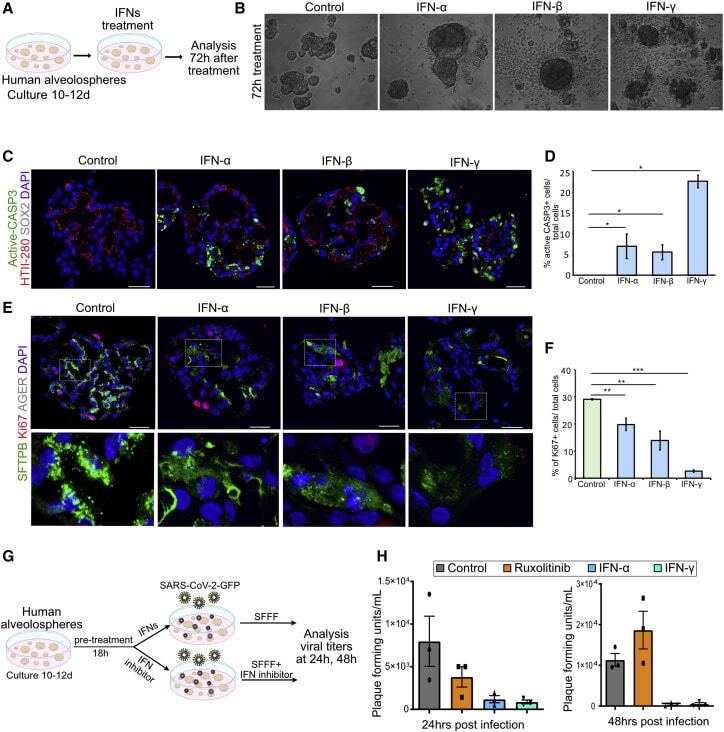
- Submitted by
- Invitrogen Antibodies (provider)
- Main image
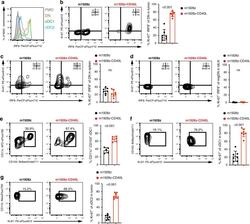
- Experimental details
- Fig. 3 m1928z-CD40L CAR T cells stimulate tumor-resident CD11b-CD103- DN cDCs to proliferate, upregulate IRF8, and differentiate to cDC1s. a IRF8 expression in CD11b - CD103 - double-negative (DN) (orange), CD11b - CD103 + cDC1 (green), and CD11b + CD103 + cDC2 (blue) in the tumor of untreated A20.GL tumor-bearing mice. FMO, flow minus one. b - d Ki-67 and IRF8 expression shown as flow cytometry contour plots in CD11b - CD103 - DN cDCs in the tumor ( b ), spleen ( c ), and tumor-draining lymph nodes (tdLN) ( d ) of A20.GL tumor-bearing mice on day 7 after CAR T cell treatment. Percentage of Ki-67 + IRF8 + DN cDCs is summarized from two independent experiments ( n = 7/group). e CD45.2 + A20.GL tumor-bearing mice were treated with 3 x 10 6 CAR T cells i.v. and CD45.2 + CD11b - CD103 - DN cDCs were isolated from the tumor on day 3 by FACS. Sorted CD45.2 + DN cells were cultured in vitro on a CD45.1 + bone-marrow stromal layer for 3 days and the percentage of CD11c + CD103 + cDC1s of all CD45.2 + cells was analyzed. Shown are representative contour plots and the quantification of the percentage of CD11c + CD103 + cDC1s. Each dot represents one in vitro culture. Data were collected from two independently performed experiments (m1928z, n = 5; m1928z-CD40L, n = 6). f , g Ki-67 expression shown as contour plots in CD11b - CD103 + cDC1s ( f ) and CD11b + CD103 - cDC2s ( g ) in the tumor of A20.GL tumor-bearing mice on day 7 after CAR T cell treatment. Percentage of Ki-67 + cells is su
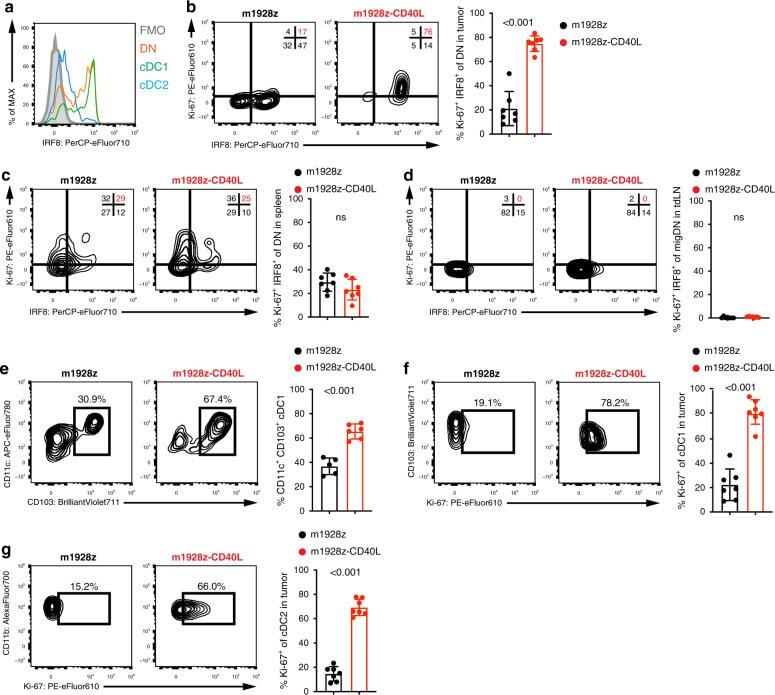
- Submitted by
- Invitrogen Antibodies (provider)
- Main image
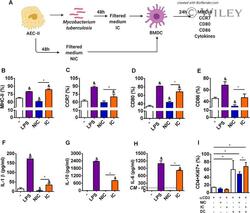
- Experimental details
- 2 FIGURE Alveolar epithelial cells infected by M. tuberculosis positively modulate maturation of DCs . ( A ) BMDC (1 x 10 6 cells/well) were cultured for 24 h in different conditions: media (-), LPS 100 ng/mL (LPS), supernatants from noninfected MLE-15 cells (NIC), and M. tuberculosis -free supernatants from infected MLE-15 cells (IC). ( B ) MHC-II, ( C ) CCR7, ( D ) CD80, ( E ) CD86 expression on CD11c + CD11b + F4/80 - cells were analyzed by flow cytometry. ( F ) IL-1beta, ( G ) IL-10, and ( H ) IL-6 secretion were measured at 24 h by ELISA. ( I ) Flow cytometry analysis of Ki67, a marker of proliferation of naive CD4 + CD62L + cells stimulated with mAb anti-CD3 and cocultured for 96 h with nonstimulated BMDC, or BMDC previously stimulated with NIC or IC for 24 h. The results are representative of 3 independent experiments expressed as the mean +- SEM ( n = 4/experimental condition). * P
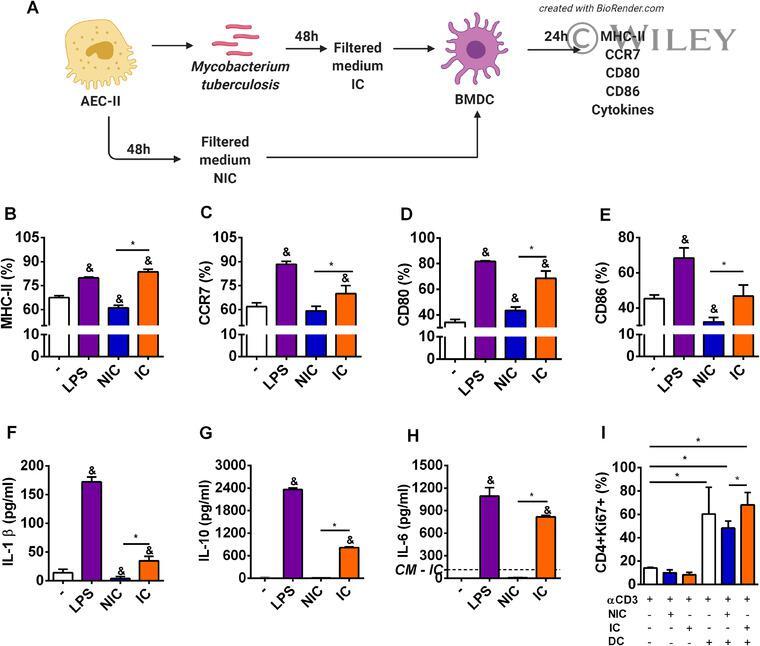
- Submitted by
- Invitrogen Antibodies (provider)
- Main image
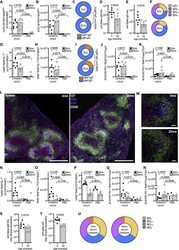
- Experimental details
- Figure 6 Impaired B cell responses after ChAdOx1 nCoV-19 immunization of aged mice (A and B) B cell response in 3-month-old (3mo) or 22-month-old (22mo) mice 9 days after immunization with ChAdOx1 nCoV-19 or PBS. Flow cytometric evaluation of the percentage (A) and number (B) of plasma cells in the iliac lymph node. (C) Pie charts showing the proportion of IgM + IgD - (orange) and switched IgM - IgD - (blue) plasma cells from (A) and (B). (D and E) Serum IgM (D) and IgG (E) anti-spike antibodies 9 days after immunization. (F) Pie charts showing the proportion of anti-spike IgG of the indicated subclasses in the serum 9 days after immunization. (G and H) Percentage (G) and number (H) of germinal center B cells in the iliac lymph node. (I) Pie charts showing the proportion of IgM + IgD - (orange) and switched IgM - IgD - (blue) germinal center cells from (G) and (H). (J-M) Number of T follicular helper (J) and T follicular regulatory (K) cells in the draining lymph node. Confocal images of the spleen of ChAdOx1 nCoV-19-immunized mice of the indicated ages; in (L), the scale bars represent 500 mum; in (M), the scale bars represent 50 mum. IgD + B cell follicle are in green, CD3 + T cells in magenta, Ki67 + cells in blue, and CD35 + follicular dendritic cells in white. (N and O) Percentage (N) and number (O) of splenic germinal center B cells. (P) Percentage of Ki67 + B cells in the spleen. (Q and R) Number of splenic T follicular helper (Q) and T follicular regulatory (R) cells.
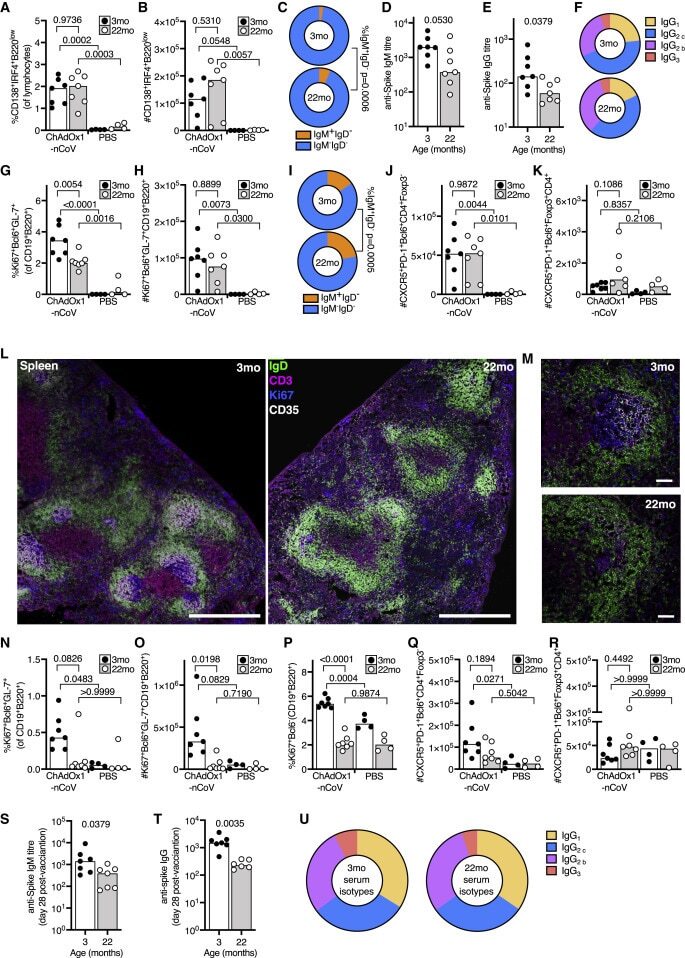
- Submitted by
- Invitrogen Antibodies (provider)
- Main image
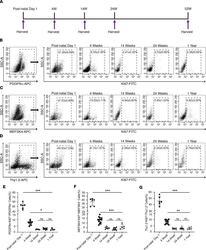
- Experimental details
- Figure 2 Cardiac fibroblast proliferation with advancing age assessed by Ki67 coexpression. ( A ) Schematic depicting timing of harvest of heart for cardiac fibroblast isolation. ( B-D ) Cardiac fibroblasts were sorted from the nonmyocyte cell population by flow sorting for ( B ) PDGFRalpha, ( C ) MEFSK4, and ( D ) Thy 1.2, and Ki67 expression in each of those fractions determined by flow cytometry at postnatal day 1, 4 weeks, 14 weeks, 24 weeks, and 1 year. Quantitation of ( E ) PDGFRalpha, ( F ) MEFSK4, and ( G ) Thy 1.2 cardiac fibroblasts that coexpressed Ki67 at different ages. Postnatal day 1 value was compared with each value at 4 weeks, 14 weeks, 24 weeks, and 1 year, respectively. The 4-week value was similarly compared with each value at 14 weeks, 24 weeks, and 1 year. *** P < 0.0001, ** P < 0.01, * P < 0.05, ns = P > 0.05. Data are represented as the mean +- SD. Data analysis was performed by 1-way ANOVA with multiple-comparisons correction.
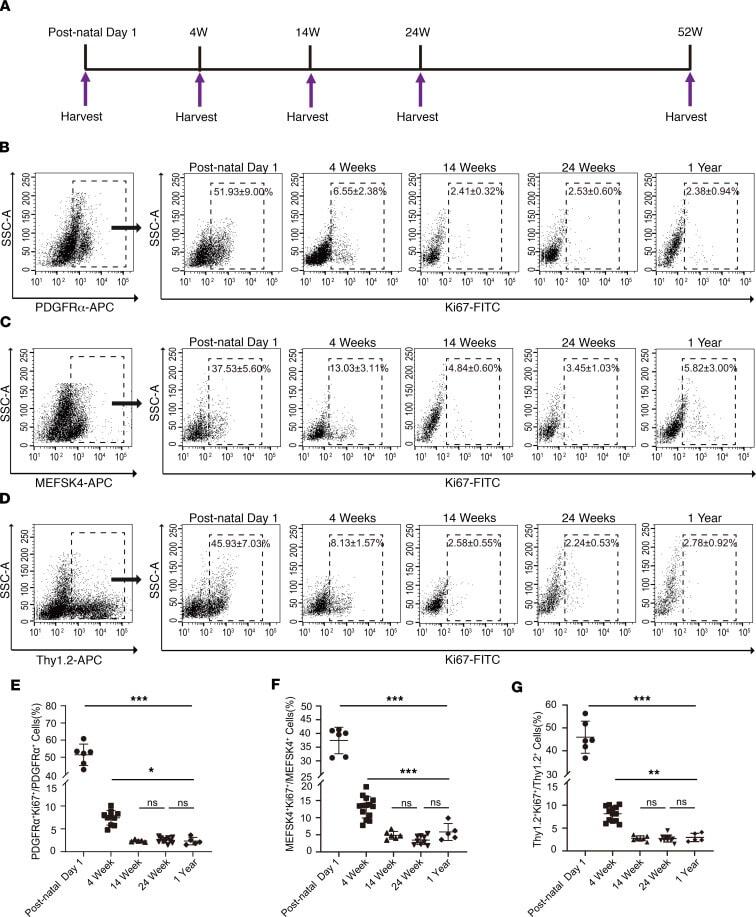
- Submitted by
- Invitrogen Antibodies (provider)
- Main image

- Experimental details
- 6 Figure TSP2 does not coexpress with proliferative marker Ki67. Transverse femoral fractures were induced in TSP2-GFP reporter mice. Femurs were harvested at days 1, 3, 5, 7, and 14 post-fracture (day 5 is shown). A, representative callus immunofluorescent stitched image of DAPI (blue), TSP2 (green), and Ki67 (red). The image was selected from a day 5 callus at a region of mixed T2GFP expression where a heterogenous population of pluripotent cells and chondrocytes are proliferating. B-E, confocal 60x z-stack images of an ROI within the callus demonstrating a TSP2+ Ki67+ (solid red arrowhead), TSP2+ Ki67- (solid white arrowhead), TSP2-Ki67+ (red arrowhead outline), and TSP2-Ki67- (white arrowhead outline) cell. In (A) is a stitched composite of individual 4x images with a 10% overlap to show the location of ROI (white box) within the callus. Scale bars is indicated for the confocal z-stack. Samples were examined under a BioTek Lionheart FX or Olympus FV1000 microscope for epi-fluorescent or confocal imaging, respectively. Representative section was selected from n = 4 to 6 femur samples per time point. ROI, region of interest; TSP2, thrombospondin-2 [Color figure can be viewed at wileyonlinelibrary.com ]