Explore
 Validate
 Learn
Learn Immunocytochemistry
Antibody data
- Antibody Data
- Antigen structure
- References [24]
- Comments [0]
- Validations
- Immunocytochemistry [2]
- Immunohistochemistry [1]
- Other assay [16]
Submit
Validation data
Reference
Comment
Report error
- Product number
- 14-5699-82 - Provider product page

- Provider
- Invitrogen Antibodies
- Product name
- Ki-67 Monoclonal Antibody (20Raj1), eBioscience™
- Antibody type
- Monoclonal
- Antigen
- Other
- Description
- Description: The monoclonal antibody 20Raj1 recognizes the human Ki-67 protein. Two isoforms of Ki-67 exist, a 345 and 395 kDa form that are expressed in dividing cells. Ki-67 is expressed in all cell types and is detectable during active phases of the cell cycle (G1, S, G2, and mitosis) but is absent from resting cells (G0). During interphase, Ki-67 expression is localized to the nucleus but redistributes to the chromosomes during mitosis and has specifically been found to associate with heterochromatin-bound proteins such as chromobox protein homolog 3 (CBX3). In studies of tumor cells, Ki-67 expression has been used as a marker for determining the fraction of proliferating cells within a given population of tumor cells.
- Antibody clone number
- 20Raj1
- Concentration
- 0.5 mg/mL
Submitted references T cells drive negative feedback mechanisms in cancer associated fibroblasts, promoting expression of co-inhibitory ligands, CD73 and IL-27 in non-small cell lung cancer.
Protein/AS01(B) vaccination elicits stronger, more Th2-skewed antigen-specific human T follicular helper cell responses than heterologous viral vectors.
Acetyl-CoA Synthetase 2: A Critical Linkage in Obesity-Induced Tumorigenesis in Myeloma.
Functional Study of the Retrotransposon-Derived Human PEG10 Protease.
Single residue in CD28-costimulated CAR-T cells limits long-term persistence and antitumor durability.
Circulating Tumor Cells Exhibit Metastatic Tropism and Reveal Brain Metastasis Drivers.
Human Liver Memory CD8(+) T Cells Use Autophagy for Tissue Residence.
Niraparib activates interferon signaling and potentiates anti-PD-1 antibody efficacy in tumor models.
Tissue-resident memory T cells are epigenetically cytotoxic with signs of exhaustion in human urinary bladder cancer.
Streptomyces Levis ABRIINW111 Inhibits SW480 Cells Growth by Apoptosis Induction.
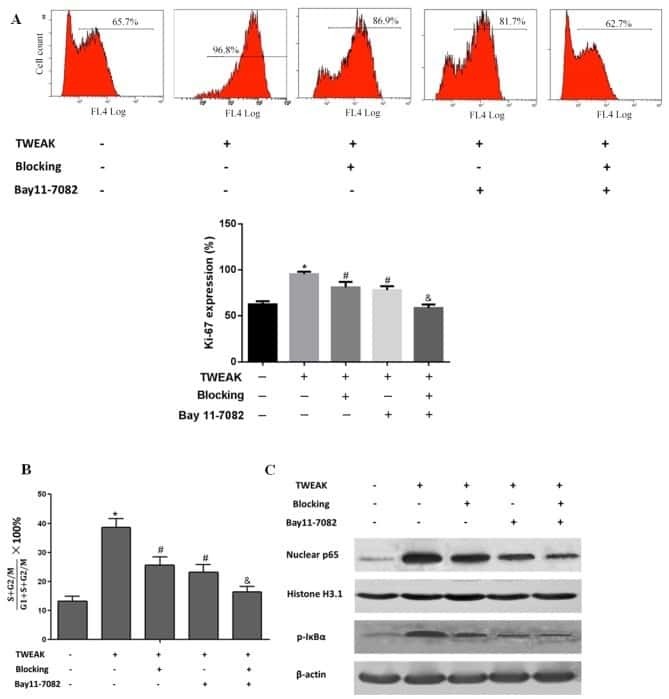
Involvement of TWEAK and the NF-κB signaling pathway in lupus nephritis.
Highly multiplexed immunofluorescence imaging of human tissues and tumors using t-CyCIF and conventional optical microscopes.
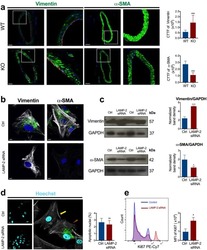
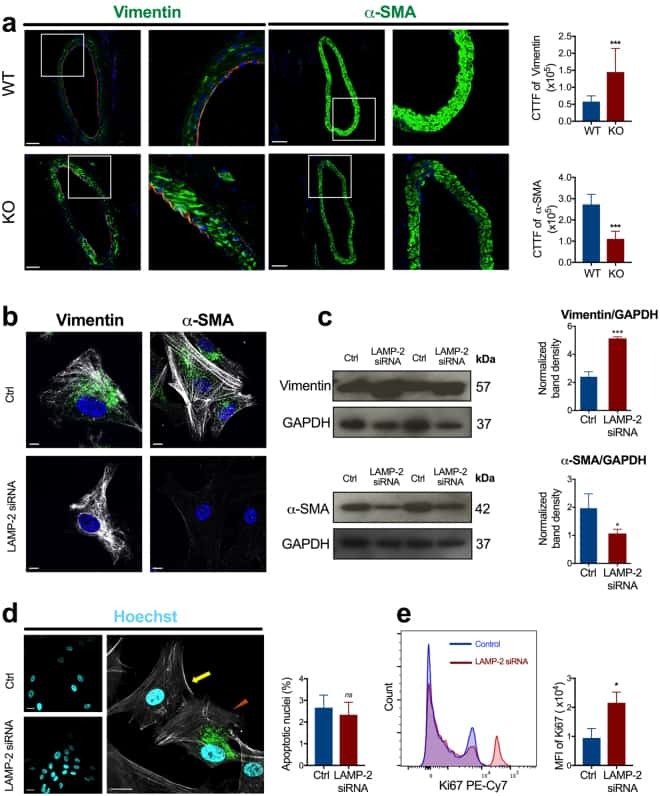
Small-Vessel Vasculopathy Due to Aberrant Autophagy in LAMP-2 Deficiency.
Macrophages induce AKT/β-catenin-dependent Lgr5(+) stem cell activation and hair follicle regeneration through TNF.
Core Transcription Factors, MicroRNAs, and Small Molecules Drive Transdifferentiation of Human Fibroblasts Towards The Cardiac Cell Lineage.
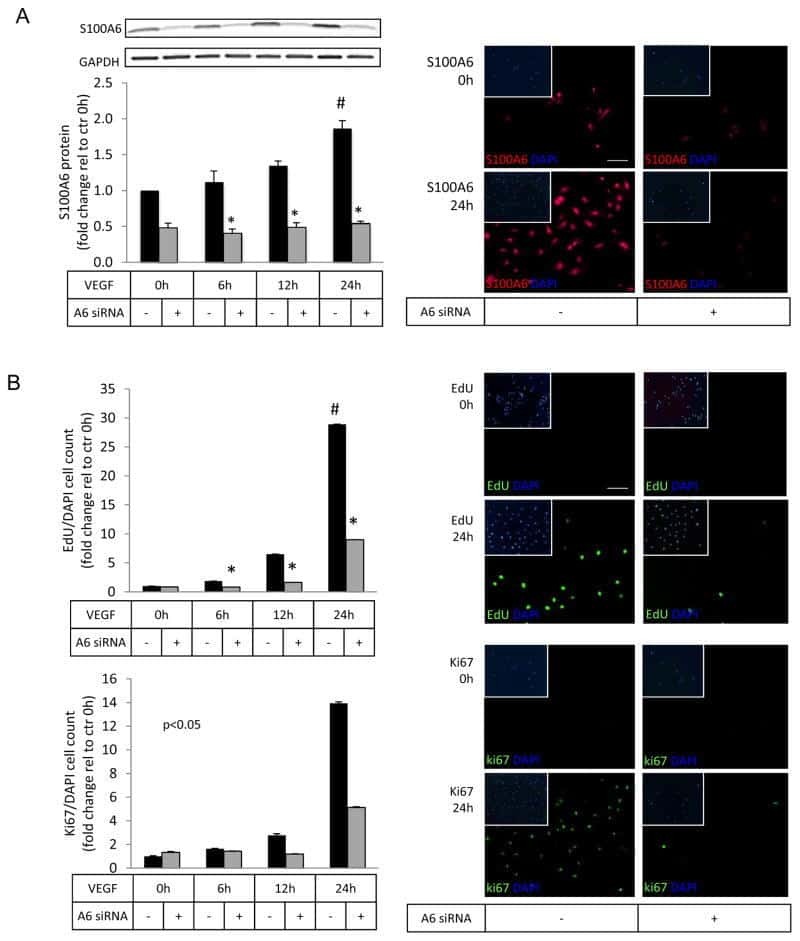
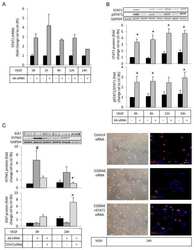
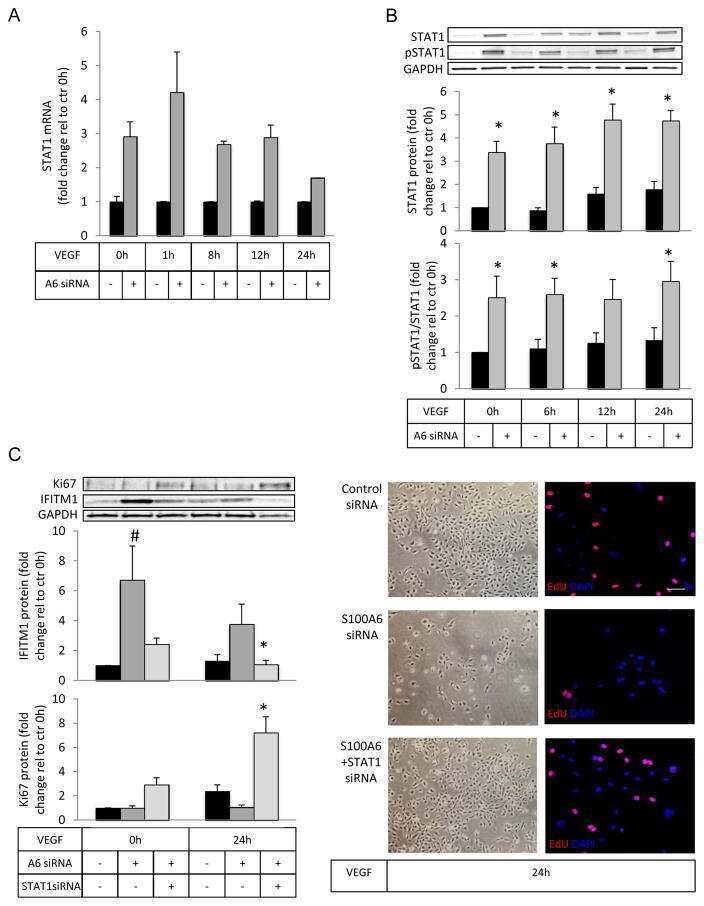
S100A6 Regulates Endothelial Cell Cycle Progression by Attenuating Antiproliferative Signal Transducers and Activators of Transcription 1 Signaling.
Interleukin-7 and Toll-like receptor 7 induce synergistic B cell and T cell activation.
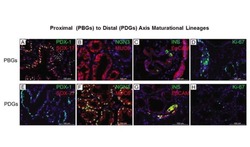
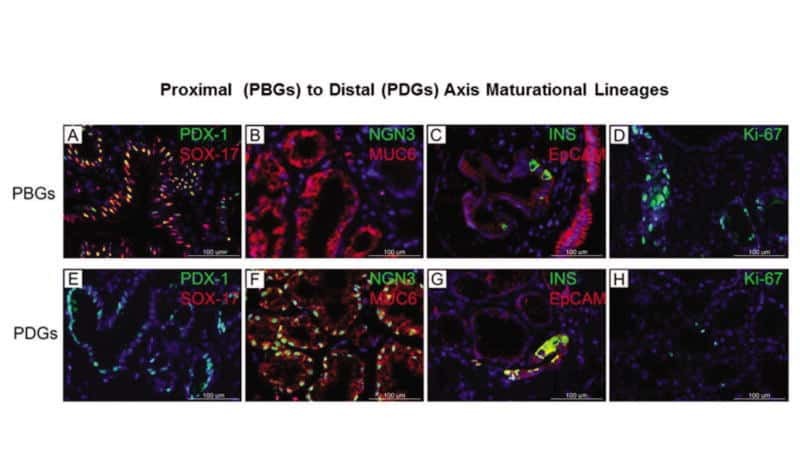
Biliary tree stem cells, precursors to pancreatic committed progenitors: evidence for possible life-long pancreatic organogenesis.
Somatostatin expression in human hair follicles and its potential role in immune privilege.
Dll4-Notch signaling in Flt3-independent dendritic cell development and autoimmunity in mice.
Ki-Mcm6, a new monoclonal antibody specific to Mcm6: comparison of the distribution profile of Mcm6 and the Ki-67 antigen.
Detection of growth fraction in tumors by Ki67 monoclonal antibody in cytologic smears: a prospective study of 40 cases.
The cell proliferation-associated antigen of antibody Ki-67: a very large, ubiquitous nuclear protein with numerous repeated elements, representing a new kind of cell cycle-maintaining proteins.
Ki-67 immunostaining in uveal melanoma. The effect of pre-enucleation radiotherapy.
O'Connor RA, Chauhan V, Mathieson L, Titmarsh H, Koppensteiner L, Young I, Tagliavini G, Dorward DA, Prost S, Dhaliwal K, Wallace WA, Akram AR
Oncoimmunology 2021;10(1):1940675
Oncoimmunology 2021;10(1):1940675
Protein/AS01(B) vaccination elicits stronger, more Th2-skewed antigen-specific human T follicular helper cell responses than heterologous viral vectors.
Nielsen CM, Ogbe A, Pedroza-Pacheco I, Doeleman SE, Chen Y, Silk SE, Barrett JR, Elias SC, Miura K, Diouf A, Bardelli M, Dabbs RA, Barfod L, Long CA, Haynes BF, Payne RO, Minassian AM, Bradley T, Draper SJ, Borrow P
Cell reports. Medicine 2021 Mar 16;2(3):100207
Cell reports. Medicine 2021 Mar 16;2(3):100207
Acetyl-CoA Synthetase 2: A Critical Linkage in Obesity-Induced Tumorigenesis in Myeloma.
Li Z, Liu H, He J, Wang Z, Yin Z, You G, Wang Z, Davis RE, Lin P, Bergsagel PL, Manasanch EE, Wong STC, Esnaola NF, Chang JC, Orlowski RZ, Yi Q, Yang J
Cell metabolism 2021 Jan 5;33(1):78-93.e7
Cell metabolism 2021 Jan 5;33(1):78-93.e7
Functional Study of the Retrotransposon-Derived Human PEG10 Protease.
Golda M, Mótyán JA, Mahdi M, Tőzsér J
International journal of molecular sciences 2020 Mar 31;21(7)
International journal of molecular sciences 2020 Mar 31;21(7)
Single residue in CD28-costimulated CAR-T cells limits long-term persistence and antitumor durability.
Guedan S, Madar A, Casado-Medrano V, Shaw C, Wing A, Liu F, Young RM, June CH, Posey AD Jr
The Journal of clinical investigation 2020 Jun 1;130(6):3087-3097
The Journal of clinical investigation 2020 Jun 1;130(6):3087-3097
Circulating Tumor Cells Exhibit Metastatic Tropism and Reveal Brain Metastasis Drivers.
Klotz R, Thomas A, Teng T, Han SM, Iriondo O, Li L, Restrepo-Vassalli S, Wang A, Izadian N, MacKay M, Moon BS, Liu KJ, Ganesan SK, Lee G, Kang DS, Walmsley CS, Pinto C, Press MF, Lu W, Lu J, Juric D, Bardia A, Hicks J, Salhia B, Attenello F, Smith AD, Yu M
Cancer discovery 2020 Jan;10(1):86-103
Cancer discovery 2020 Jan;10(1):86-103
Human Liver Memory CD8(+) T Cells Use Autophagy for Tissue Residence.
Swadling L, Pallett LJ, Diniz MO, Baker JM, Amin OE, Stegmann KA, Burton AR, Schmidt NM, Jeffery-Smith A, Zakeri N, Suveizdyte K, Froghi F, Fusai G, Rosenberg WM, Davidson BR, Schurich A, Simon AK, Maini MK
Cell reports 2020 Jan 21;30(3):687-698.e6
Cell reports 2020 Jan 21;30(3):687-698.e6
Niraparib activates interferon signaling and potentiates anti-PD-1 antibody efficacy in tumor models.
Wang Z, Sun K, Xiao Y, Feng B, Mikule K, Ma X, Feng N, Vellano CP, Federico L, Marszalek JR, Mills GB, Hanke J, Ramaswamy S, Wang J
Scientific reports 2019 Feb 12;9(1):1853
Scientific reports 2019 Feb 12;9(1):1853
Tissue-resident memory T cells are epigenetically cytotoxic with signs of exhaustion in human urinary bladder cancer.
Hartana CA, Ahlén Bergman E, Broomé A, Berglund S, Johansson M, Alamdari F, Jakubczyk T, Huge Y, Aljabery F, Palmqvist K, Holmström B, Glise H, Riklund K, Sherif A, Winqvist O
Clinical and experimental immunology 2018 Oct;194(1):39-53
Clinical and experimental immunology 2018 Oct;194(1):39-53
Streptomyces Levis ABRIINW111 Inhibits SW480 Cells Growth by Apoptosis Induction.
Faramarzian Azimi Maragheh B, Fatourachi P, Mohammadi SM, Valipour B, Behtari M, Dehnad A, Nozad Charoudeh H
Advanced pharmaceutical bulletin 2018 Nov;8(4):675-682
Advanced pharmaceutical bulletin 2018 Nov;8(4):675-682
Involvement of TWEAK and the NF-κB signaling pathway in lupus nephritis.
Sun F, Teng J, Yu P, Li W, Chang J, Xu H
Experimental and therapeutic medicine 2018 Mar;15(3):2611-2619
Experimental and therapeutic medicine 2018 Mar;15(3):2611-2619
Highly multiplexed immunofluorescence imaging of human tissues and tumors using t-CyCIF and conventional optical microscopes.
Lin JR, Izar B, Wang S, Yapp C, Mei S, Shah PM, Santagata S, Sorger PK
eLife 2018 Jul 11;7
eLife 2018 Jul 11;7
Small-Vessel Vasculopathy Due to Aberrant Autophagy in LAMP-2 Deficiency.
Nguyen HT, Noguchi S, Sugie K, Matsuo Y, Nguyen CTH, Koito H, Shiojima I, Nishino I, Tsukaguchi H
Scientific reports 2018 Feb 20;8(1):3326
Scientific reports 2018 Feb 20;8(1):3326
Macrophages induce AKT/β-catenin-dependent Lgr5(+) stem cell activation and hair follicle regeneration through TNF.
Wang X, Chen H, Tian R, Zhang Y, Drutskaya MS, Wang C, Ge J, Fan Z, Kong D, Wang X, Cai T, Zhou Y, Wang J, Wang J, Wang S, Qin Z, Jia H, Wu Y, Liu J, Nedospasov SA, Tredget EE, Lin M, Liu J, Jiang Y, Wu Y
Nature communications 2017 Mar 27;8:14091
Nature communications 2017 Mar 27;8:14091
Core Transcription Factors, MicroRNAs, and Small Molecules Drive Transdifferentiation of Human Fibroblasts Towards The Cardiac Cell Lineage.
Christoforou N, Chakraborty S, Kirkton RD, Adler AF, Addis RC, Leong KW
Scientific reports 2017 Jan 10;7:40285
Scientific reports 2017 Jan 10;7:40285
S100A6 Regulates Endothelial Cell Cycle Progression by Attenuating Antiproliferative Signal Transducers and Activators of Transcription 1 Signaling.
Lerchenmüller C, Heißenberg J, Damilano F, Bezzeridis VJ, Krämer I, Bochaton-Piallat ML, Hirschberg K, Busch M, Katus HA, Peppel K, Rosenzweig A, Busch H, Boerries M, Most P
Arteriosclerosis, thrombosis, and vascular biology 2016 Sep;36(9):1854-67
Arteriosclerosis, thrombosis, and vascular biology 2016 Sep;36(9):1854-67
Interleukin-7 and Toll-like receptor 7 induce synergistic B cell and T cell activation.
Bikker A, Kruize AA, van der Wurff-Jacobs KM, Peters RP, Kleinjan M, Redegeld F, de Jager W, Lafeber FP, van Roon JA
PloS one 2014;9(4):e94756
PloS one 2014;9(4):e94756
Biliary tree stem cells, precursors to pancreatic committed progenitors: evidence for possible life-long pancreatic organogenesis.
Wang Y, Lanzoni G, Carpino G, Cui CB, Dominguez-Bendala J, Wauthier E, Cardinale V, Oikawa T, Pileggi A, Gerber D, Furth ME, Alvaro D, Gaudio E, Inverardi L, Reid LM
Stem cells (Dayton, Ohio) 2013 Sep;31(9):1966-79
Stem cells (Dayton, Ohio) 2013 Sep;31(9):1966-79
Somatostatin expression in human hair follicles and its potential role in immune privilege.
Breitkopf T, Lo BK, Leung G, Wang E, Yu M, Carr N, Zloty D, Cowan B, Shapiro J, McElwee KJ
The Journal of investigative dermatology 2013 Jul;133(7):1722-30
The Journal of investigative dermatology 2013 Jul;133(7):1722-30
Dll4-Notch signaling in Flt3-independent dendritic cell development and autoimmunity in mice.
Billiard F, Lobry C, Darrasse-Jèze G, Waite J, Liu X, Mouquet H, DaNave A, Tait M, Idoyaga J, Leboeuf M, Kyratsous CA, Burton J, Kalter J, Klinakis A, Zhang W, Thurston G, Merad M, Steinman RM, Murphy AJ, Yancopoulos GD, Aifantis I, Skokos D
The Journal of experimental medicine 2012 May 7;209(5):1011-28
The Journal of experimental medicine 2012 May 7;209(5):1011-28
Ki-Mcm6, a new monoclonal antibody specific to Mcm6: comparison of the distribution profile of Mcm6 and the Ki-67 antigen.
Heidebrecht HJ, Buck F, Endl E, Kruse ML, Adam-Klages S, Andersen K, Frahm SO, Schulte C, Wacker HH, Parwaresch R
Laboratory investigation; a journal of technical methods and pathology 2001 Aug;81(8):1163-5
Laboratory investigation; a journal of technical methods and pathology 2001 Aug;81(8):1163-5
Detection of growth fraction in tumors by Ki67 monoclonal antibody in cytologic smears: a prospective study of 40 cases.
Rishi M, Schwarting R, Kovatich AJ, Ehya H
Diagnostic cytopathology 1993;9(1):52-6; dicussion 57-8
Diagnostic cytopathology 1993;9(1):52-6; dicussion 57-8
The cell proliferation-associated antigen of antibody Ki-67: a very large, ubiquitous nuclear protein with numerous repeated elements, representing a new kind of cell cycle-maintaining proteins.
Schlüter C, Duchrow M, Wohlenberg C, Becker MH, Key G, Flad HD, Gerdes J
The Journal of cell biology 1993 Nov;123(3):513-22
The Journal of cell biology 1993 Nov;123(3):513-22
Ki-67 immunostaining in uveal melanoma. The effect of pre-enucleation radiotherapy.
Mooy CM, de Jong PT, Van der Kwast TH, Mulder PG, Jager MJ, Ruiter DJ
Ophthalmology 1990 Oct;97(10):1275-80
Ophthalmology 1990 Oct;97(10):1275-80
No comments: Submit comment
Supportive validation
- Submitted by
- Invitrogen Antibodies (provider)
- Main image

- Experimental details
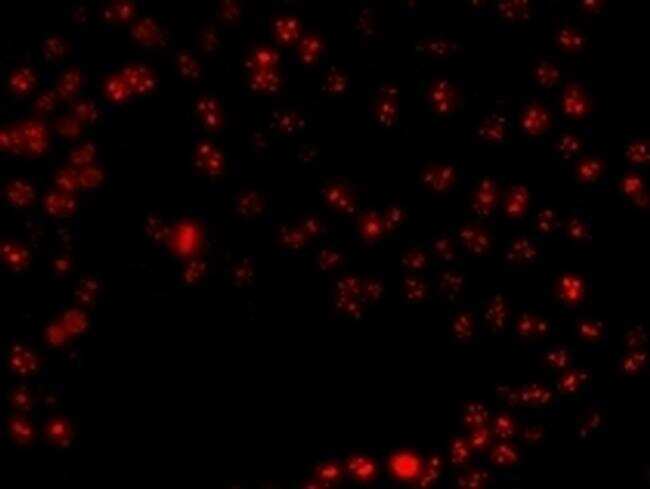
- Immunocytochemistry of fixed and permeabilized MCF-7 cells using 1 µg/mL of Anti-Human Ki-67 Purified followed by Anti-Mouse IgG TRITC.
- Submitted by
- Invitrogen Antibodies (provider)
- Main image
- Experimental details
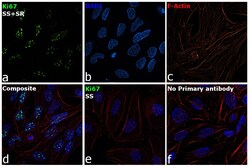
- Immunofluorescence analysis of Ki67 was performed using 70% confluent log phase HeLa cells serum starved for 36 Hrs followed by serum release for 6 Hrs. The cells were fixed with 4% Paraformaldehyde for 10 minutes, permeabilized with 0.1% Triton™ X-100 for 10 minutes, and blocked with 2% BSA for 10 minutes at room temperature. The cells were labeled with Ki-67 Monoclonal Antibody (20Raj1), eBioscience™ (Product # 14-5699-82) at 1 µg/mL in 0.1% BSA, incubated at 4 degree celsius overnight and then labeled with Goat anti-Mouse IgG (H+L) Superclonal™ Recombinant Secondary Antibody, Alexa Fluor® 488 conjugate (Product # A28175, 1:2000 dilution) for 45 minutes at room temperature (Panel a: Green). Nuclei (Panel b: Blue) were stained with SlowFade® Gold Antifade Mountant with DAPI (Product # S36938). F-actin (Panel c: Red) was stained with Rhodamine Phalloidin (Product # R415, 1:300). Panel d represents the merged image showing nuclear localization. Panel e represents serum starved cells with reduced signal. Panel f represents control cells with no primary antibody to assess background. The images were captured at 60X magnification.

Supportive validation
- Submitted by
- Invitrogen Antibodies (provider)
- Main image
- Experimental details
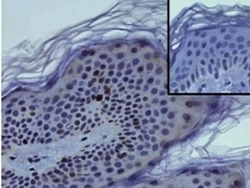
- Immunohistochemistry on formalin-fixed paraffin embedded human skin using 1 µg/mL of Anti-Human Ki-67 Purified (bottom) or Mouse IgG1 kappa Isotype Control Purified (Product # 14-4714-82) (inset, bottom) followed by Anti-Mouse IgG Biotin, and DAB visualization.Nuclei are counterstained with hematoxylin.

Supportive validation
- Submitted by
- Invitrogen Antibodies (provider)
- Main image
- Experimental details
- NULL

- Submitted by
- Invitrogen Antibodies (provider)
- Main image
- Experimental details
- NULL
- Submitted by
- Invitrogen Antibodies (provider)
- Main image
- Experimental details
- NULL
- Submitted by
- Invitrogen Antibodies (provider)
- Main image

- Experimental details
- NULL
- Submitted by
- Invitrogen Antibodies (provider)
- Main image
- Experimental details
- NULL
- Submitted by
- Invitrogen Antibodies (provider)
- Main image

- Experimental details
- NULL
- Submitted by
- Invitrogen Antibodies (provider)
- Main image
- Experimental details
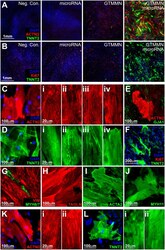
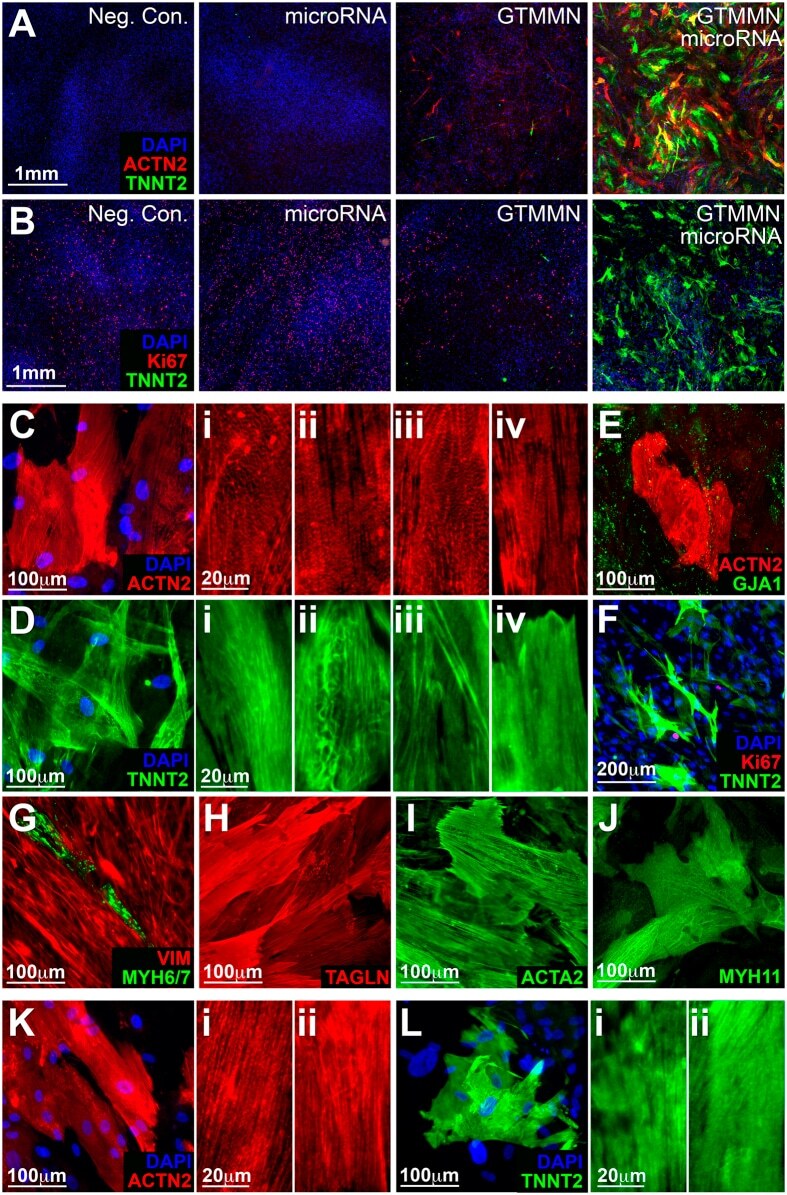
- Figure 2 Immunofluorescence characterization of transdifferentiated iCM (cardiac TF and microRNA). ( A ) Expression of ACTN2 and TNNT2 or ( B ) Expression of TNNT2 and Ki67 in HDF transdifferentiated for 2 weeks using induced expression of GATA4, TBX5, MEF2C, MYOCD, NKX2-5 and transfection with hsa-miR-1 and hsa-miR-133a. (Controls: M2rtTA only, microRNA only, cardiac TF only). ( C ) ACTN2. Panels on the right show varying degrees of cytoskeletal organization of ACTN2. ( D ) TNNT2. Panels on the right show varying degrees of cytoskeletal organization of TNNT2. ( E ) ACTN2 and GJA1. ( F ) TNNT2 and Ki67 expression in iCM. ( G ) VIM and MYH6/7. ( H ) TAGLN. ( I ) SMA. ( J ) MYH11. ( K ) ACTN2 expression in iCM 4 weeks following initiation of transdifferentiation. Panels on the right show varying degrees of cytoskeletal organization of ACTN2. ( L ) TNNT2 expression in iCM 4 weeks following initiation of transdifferentiation. Panels on the right show varying degrees of cytoskeletal organization of TNNT2.
- Submitted by
- Invitrogen Antibodies (provider)
- Main image
- Experimental details
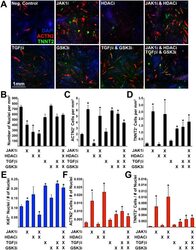
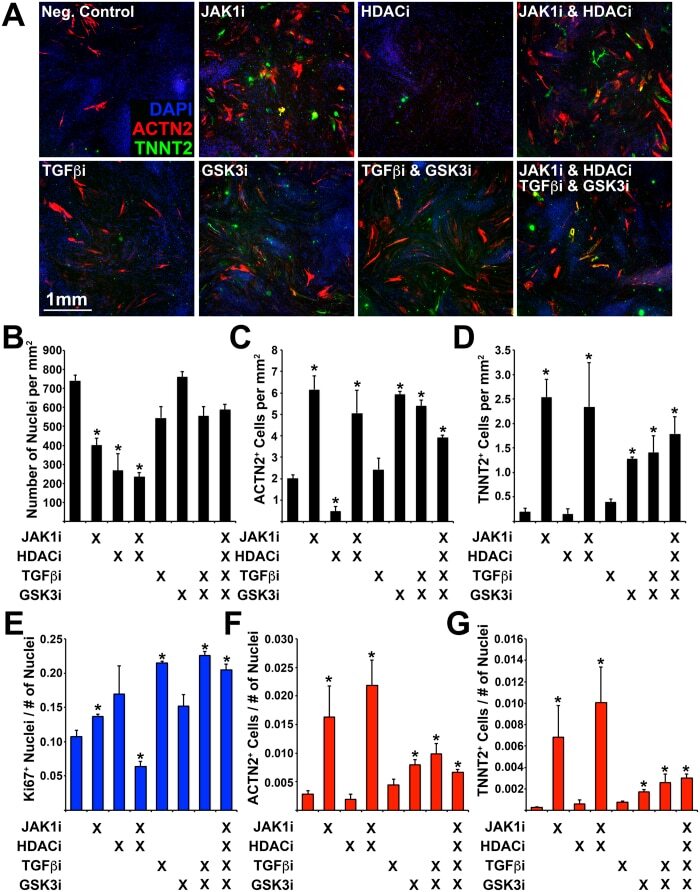
- Figure 6 Determining the effect of small molecule inhibitors on transdifferentiation efficiency. ( A ) Immunofluorescence of transdifferentiated cells (ACTN2/TNNT2) during exposure to small molecule inhibitors: Janus protein tyrosine kinase 1 (JAK1i), Sodium Butyrate (HDACi), SB431542 (TGFbetai), CHIR99021 (GSK3i). ( B ) Number of nuclei, ( C ) Number of ACTN2 + cells, and ( D ) Number of TNNT2 + cells (per mm 2 ). ( E ) Number of Ki67 + nuclei normalized to the total number of nuclei. ( F ) Number of ACTN2 + cells normalized to the total number of nuclei. ( G ) Number of TNNT2 + cells normalized to the total number of nuclei. Experiment performed in triplicate. 4 images were analyzed for each experiment. Error bar represents calculated standard deviation. Significant difference between two values was calculated using t-test (two-tailed distribution, two sample unequal variance).
- Submitted by
- Invitrogen Antibodies (provider)
- Main image
- Experimental details
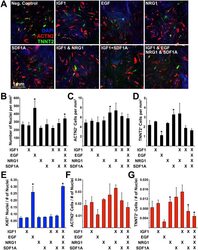
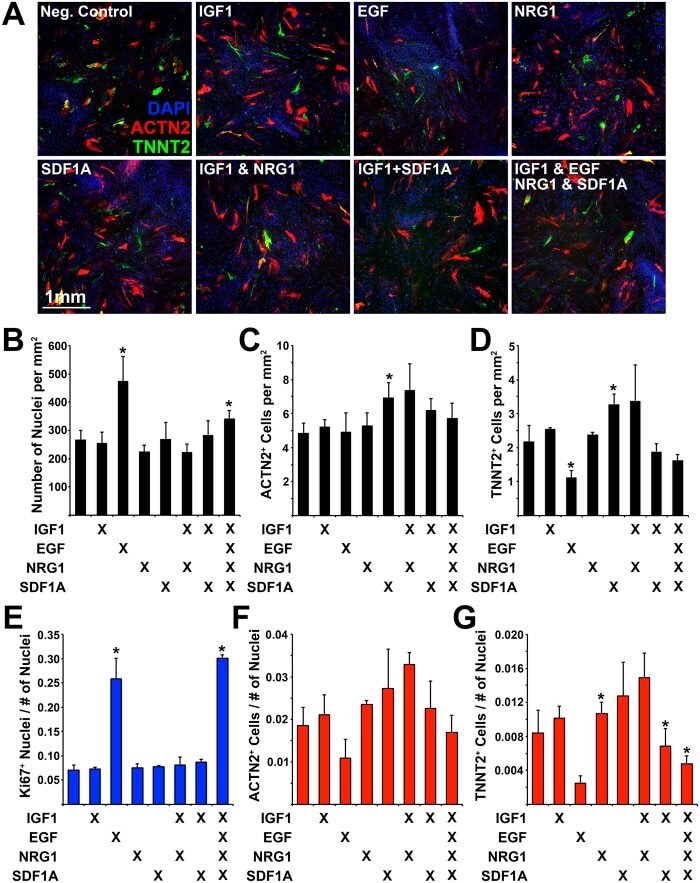
- Figure 7 Determining the effect of protein ligands on transdifferentiation efficiency. ( A ) Immunofluorescence of transdifferentiated cells (ACTN2/TNNT2) during exposure to protein ligands: IGF1, EGF, NRG1, SDF1A. ( B ) Number of nuclei, ( C ) Number of ACTN2 + cells, and ( D ) Number of TNNT2 + cells (per mm 2 ). ( E ) Number of Ki67 + nuclei normalized to the total number of nuclei. ( F ) Number of ACTN2 + cells normalized to the total number of nuclei. ( G ) Number of TNNT2 + cells normalized to the total number of nuclei. Experiment performed in triplicate. 4 images were analyzed for each experiment. Error bar represents calculated standard deviation. Significant difference between two values was calculated using t-test (two-tailed distribution, two sample unequal variance).
- Submitted by
- Invitrogen Antibodies (provider)
- Main image
- Experimental details
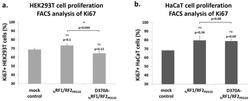
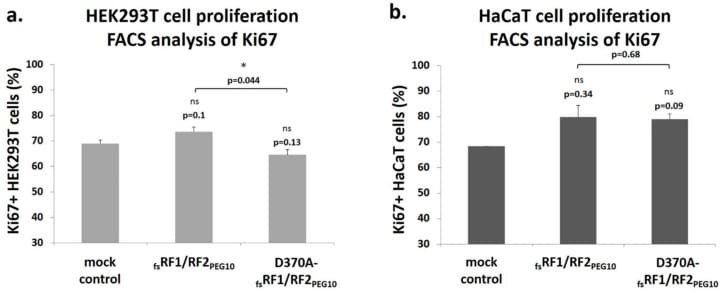
- Figure 12 PR PEG10 influences the proliferation of HEK293T cells. In the cell proliferation assay, HEK293T ( a ) and HaCaT cells ( b ) were stained with FITC-conjugated anti-Ki67 antibody, which was detected using a flow cytometer (FACS). Significance values were determined as compared to mock control, otherwise they are indicated. Note: * p 0.05). Error bars represent SD ( n >= 2).
- Submitted by
- Invitrogen Antibodies (provider)
- Main image
- Experimental details
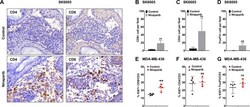
- Figure 2 Niraparib promoted tumor immune cell infiltration in both the BRCA -proficient SK6005 syngeneic and BRCA -deficient MDA-MB-436 NOG-EXL humanized tumor models ( A ) Representative images of CD4 and CD8 immunohistochemical staining in control- and niraparib-treated BRCA -proficient SK6005 tumors. ( B - D ) Quantification of the number of CD4 + cells, CD8 + cells and FoxP3 + cells per field upon niraparib treatment in BRCA -proficient SK6005 tumors. ( E-G ) Percentage of Ki67-positive CD4 + cells, CD8 + cells and FoxP3 + cells among the total CD3 + population by flow cytometry in humanized NOG-EXL MDA-MB-436 tumors. **p-value is less than 0.05 by Student''s t test.

- Submitted by
- Invitrogen Antibodies (provider)
- Main image
- Experimental details
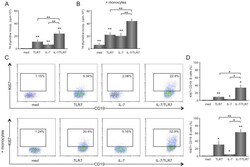
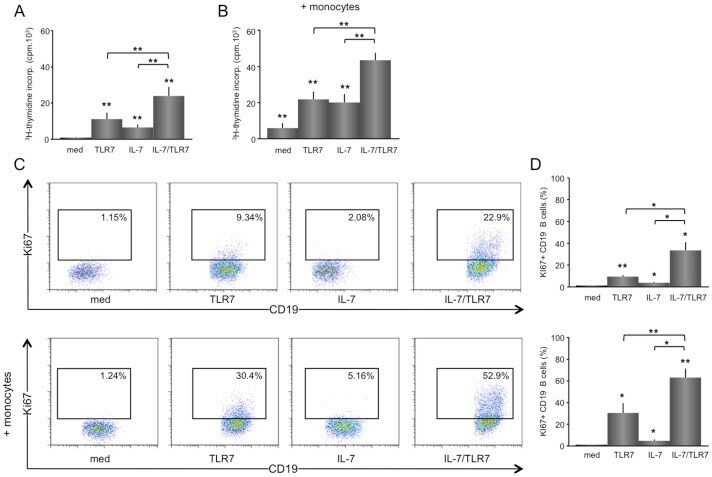
- Figure 1 IL-7 synergistically increases proliferation of TLR7-stimulated B cells in co-culture with CD4 T cells, which is enhanced by monocytes/macrophages. Isolated B cells co-cultured 1:1 (5.10 5 each) together with CD4 T cells for 6 days show an increased lymphocytic proliferation upon TLR7 or IL-7 stimulation, which is additively increased upon combined stimulation with IL-7/TLR7 (n = 8) (A). A similar, but overall enhanced effect for the total proliferation is seen when monocytes/macrophages are added to the culture (5.10 4 B). Representative FACS stainings for KI67 + B cells from an unstimulated, TLR7, IL-7, and TLR7/IL-7 stimulated CD4 T/B cell co-culture -/+ monocytes/macrophages are shown as well as the average data (n = 5) (C, D). TLR7 induces a significant increase in the percentage of KI67 + B cells. IL-7 stimulation induces a small, but statistically significant increase in Ki67 + B cells. When TLR7 and IL-7 are added together a synergistic increase in proliferation is observed (C). Overall the effects are enhanced by addition of monocytes/macrophages to the T/B cell co-cultures (D). * and ** indicate a statistical significant differences of p
- Submitted by
- Invitrogen Antibodies (provider)
- Main image
- Experimental details
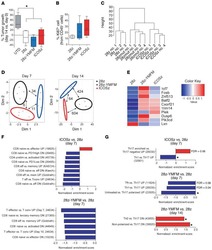
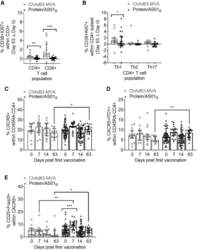
- Figure 1 PfRH5 vaccination with the ChAd63-MVA platform induces greater activation of total circulating CD8 + and CD4 + T cell populations, while the protein/AS01 B platform elicits a more sustained increase in cTfh-phenotype cells PBMCs from days 0, 7, 14, and 63 were stained ex vivo and analyzed using the gating strategies shown in Figures S1-S3 . (A and B) Increases at day 63 in activated CD38 + Ki67 + cells within total CD8 + and CD4 + T cells (A) or Th1 (CXCR3 + CCR6 - ), Th2 (CXCR3 - CCR6 - ), and Th17 (CXCR3 - CCR6 + ) CD4 + T cell subsets (B) were compared between platforms following subtraction of day 0 CD38 + Ki67 + frequencies in paired samples. (C-E) Frequencies of total cTfh cells defined as CXCR5 + (C) or CXCR5 + PD1 + (D) cells within the CD45RA - CD4 + T cell population were compared between platforms and the frequency of cTfr cells within total cTfh cells (defined as the CD25 + Foxp3 + subset) (E). All of the available samples are plotted (ChAd63-MVA/protein/AS01 B ): day 0, n = 15/54; day 7, n = 15/24; day 14, n = 15/54; day 63, n = 12/20. For intra-trial comparisons (E), only vaccinees with all 4 time points were analyzed: ChAd63-MVA, n = 12, protein/AS01 B , n = 17. Comparisons were performed with Mann-Whitney tests (between trials) or Friedman tests with Dunn's correction for multiple comparisons (within trials comparing day 0 to post-vaccination time points). *p < 0.5, **p < 0.01, and ***p < 0.001. In all of the panels, each point represents a vaccinee.

- Submitted by
- Invitrogen Antibodies (provider)
- Main image

- Experimental details
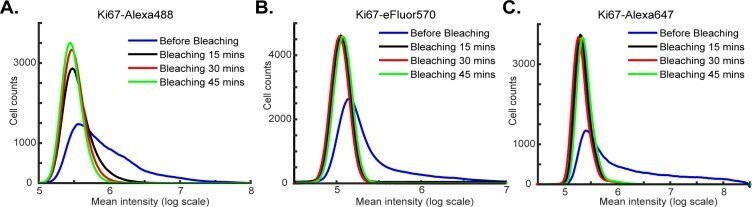
- Figure 4-figure supplement 1. Impact of bleaching time on fluorophore inactivation. Intensity distributions for specimens stained with an antibody against Ki67 coupled to the following fluorophores: ( A ) Alexa-488, ( B ) Alexa-570 and ( C ) Alexa-647 prior to bleaching (blue curves) and after 15, 30 or 45 min of bleaching (black, red and green curves respectively). The distributions were calculated from the average fluorescence intensities of single cells as determined after image segmentation.
- Submitted by
- Invitrogen Antibodies (provider)
- Main image
- Experimental details
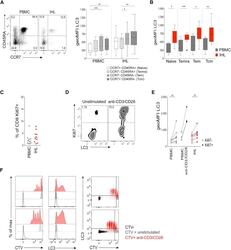
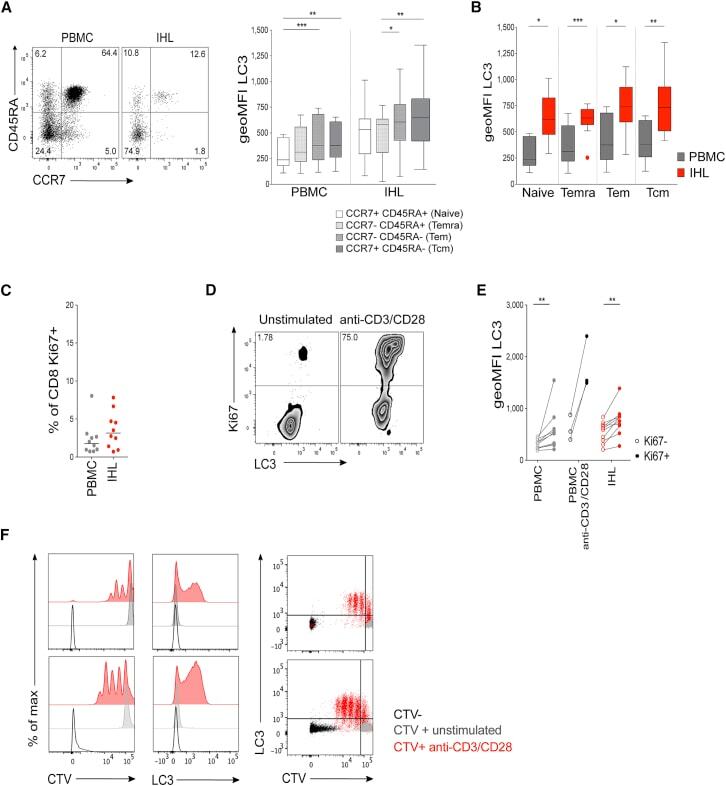
- Figure 2 High Autophagy Level of Intrahepatic T Cells Is Not a Result of a Difference in Differentiation Status or Recent Proliferation (A) Example plot of CD45RA versus CCR7 staining (CD8 + T cells) from a PBMC or IHL sample and summary data for LC3 staining of CD8 + T cell memory subsets (PBMC, 9; and IHL, 15, biological replicates; box whisker, Tukey). (B) Comparison of LC3 staining of CD8 + T cell memory subsets between paired PBMC and IHL samples (9 biological replicates; box whisker, Tukey; outliers shown as dots). (C) Ex vivo CD8 + T cell Ki67 expression. (D and E) Example plots (CD8 + T cells, PBMC) (D) and summary data for LC3 staining on Ki67 - and Ki67 + CD8 + T cells (E) in PBMCs and IHLs ex vivo (10 biological replicates) or after anti-CD3/CD28 stimulation (overnight, 0.5 mug/mL each; three biological replicates) in PBMCs. (F) Histograms showing the dilution of CellTrace Violet (CTV), LC3 staining, and co-staining of LC3 and CTV on CD8 + T cells after 5 days of stimulation with anti-CD3/CD28 (red), compared with that without stimulation (gray) or without CTV staining (black; two representative biological replicates of five, PBMCs). Cells were treated with bafA1 (A-F). Friedman test (ANOVA) with Dunn's post hoc test for pairwise multiple comparisons (A and B). Mann-Whitney t test (C and E). * p < 0.05, ** p < 0.005, *** p < 0.001.
- Submitted by
- Invitrogen Antibodies (provider)
- Main image
- Experimental details
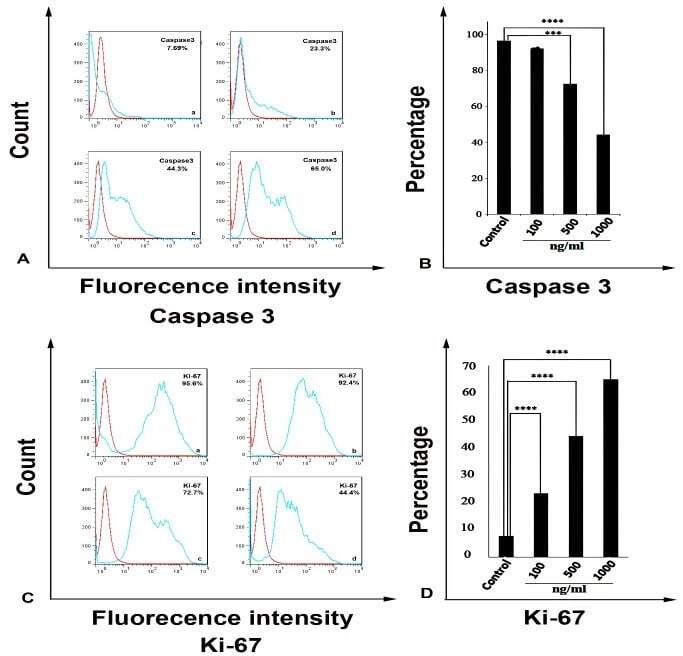
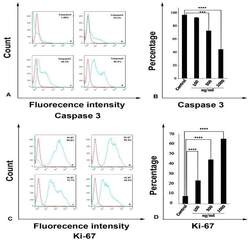
- Figure 4 Streptomyces Levis ABRIINW111 can alter the apoptosis and proliferation of colon cancer cells. SW480 was treated with indicated concentrations of metabolites for 48 h and was evaluated by flow cytometry (FACS) for Caspase3 and Ki-67 expression. (a) FACS profile of Caspase 3 expression: Control cells (a) 100 ng ml -1 (b) 500 ng ml -1 (c) 1000 ng ml -1 (d).(b) Mean (SD) proportion of Caspase 3 expression with an indicated concentration of metabolites. (c) FACS profile of Ki67 expression: Control cells (a) 100 ng ml -1 (b) 500 ng ml -1 (c) 1000 ng ml -1 (d). (d) Mean (SD) proportion of Ki67 expression with the indicated concentrations of metabolites. Values are demonstrated as mean +- SD from 4 independent experiments (P_Value