 Explore
 Validate
 Learn
Learn Western blot
Antibody data
- Antibody Data
- Antigen structure
- References [8]
- Comments [0]
- Validations
- Western blot [1]
- ELISA [2]
- Immunocytochemistry [3]
- Chromatin Immunoprecipitation [3]
- Other assay [8]
Submit
Validation data
Reference
Comment
Report error
- Product number
- 49-1005 - Provider product page

- Provider
- Invitrogen Antibodies
- Product name
- H3K4me3 Polyclonal Antibody
- Antibody type
- Polyclonal
- Antigen
- Synthetic peptide
- Description
- 49-1005, H3K4me3 antibody, has been shown to recognize several plant species: Arabidopsis, rice, tomato, maize, poplar, and silena latifolia.
- Reactivity
- Human, Mouse, Zebrafish
- Host
- Rabbit
- Isotype
- IgG
- Vial size
- 50 µg
- Concentration
- 1.3 mg/mL
- Storage
- -20° C, Avoid Freeze/Thaw Cycles
Submitted references The Jumonji-domain histone demethylase inhibitor JIB-04 deregulates oncogenic programs and increases DNA damage in Ewing Sarcoma, resulting in impaired cell proliferation and survival, and reduced tumor growth.
Tumorigenicity of Ewing sarcoma is critically dependent on the trithorax proteins MLL1 and menin.
A bivalent promoter contributes to stress-induced plasticity of CXCR4 in Ewing sarcoma.
DNA methylation and not H3K4 trimethylation dictates the expression status of miR-152 gene which inhibits migration of breast cancer cells via DNMT1/CDH1 loop.
Epigenetic drift towards histone modifications regulates CAV1 gene expression in colon cancer.
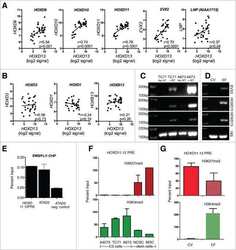
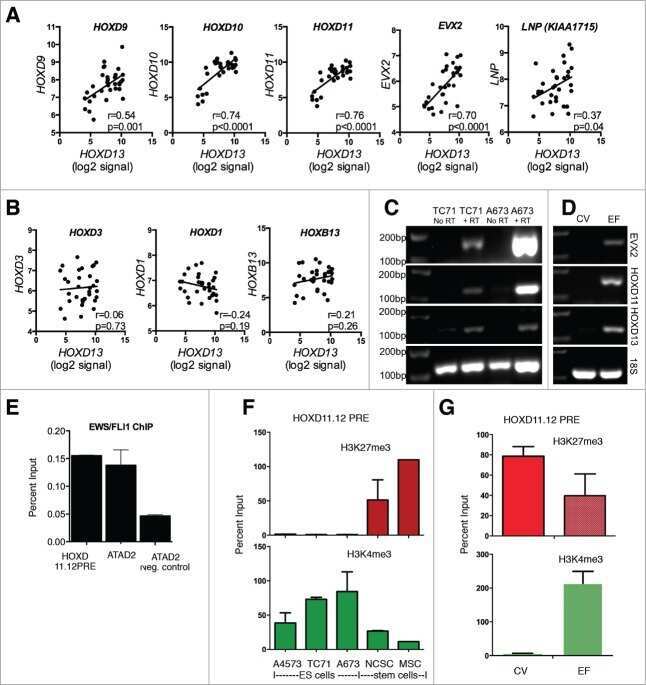
Overexpression of HOX genes is prevalent in Ewing sarcoma and is associated with altered epigenetic regulation of developmental transcription programs.
Replication stress is a potent driver of functional decline in ageing haematopoietic stem cells.
Cross-species genomic and epigenomic landscape of retinoblastoma.
Parrish JK, McCann TS, Sechler M, Sobral LM, Ren W, Jones KL, Tan AC, Jedlicka P
Oncotarget 2018 Sep 4;9(69):33110-33123
Oncotarget 2018 Sep 4;9(69):33110-33123
Tumorigenicity of Ewing sarcoma is critically dependent on the trithorax proteins MLL1 and menin.
Svoboda LK, Bailey N, Van Noord RA, Krook MA, Harris A, Cramer C, Jasman B, Patel RM, Thomas D, Borkin D, Cierpicki T, Grembecka J, Lawlor ER
Oncotarget 2017 Jan 3;8(1):458-471
Oncotarget 2017 Jan 3;8(1):458-471
A bivalent promoter contributes to stress-induced plasticity of CXCR4 in Ewing sarcoma.
Krook MA, Hawkins AG, Patel RM, Lucas DR, Van Noord R, Chugh R, Lawlor ER
Oncotarget 2016 Sep 20;7(38):61775-61788
Oncotarget 2016 Sep 20;7(38):61775-61788
DNA methylation and not H3K4 trimethylation dictates the expression status of miR-152 gene which inhibits migration of breast cancer cells via DNMT1/CDH1 loop.
Sengupta D, Deb M, Rath SK, Kar S, Parbin S, Pradhan N, Patra SK
Experimental cell research 2016 Aug 15;346(2):176-87
Experimental cell research 2016 Aug 15;346(2):176-87
Epigenetic drift towards histone modifications regulates CAV1 gene expression in colon cancer.
Deb M, Sengupta D, Kar S, Rath SK, Roy S, Das G, Patra SK
Gene 2016 Apr 25;581(1):75-84
Gene 2016 Apr 25;581(1):75-84
Overexpression of HOX genes is prevalent in Ewing sarcoma and is associated with altered epigenetic regulation of developmental transcription programs.
Svoboda LK, Harris A, Bailey NJ, Schwentner R, Tomazou E, von Levetzow C, Magnuson B, Ljungman M, Kovar H, Lawlor ER
Epigenetics 2014 Dec;9(12):1613-25
Epigenetics 2014 Dec;9(12):1613-25
Replication stress is a potent driver of functional decline in ageing haematopoietic stem cells.
Flach J, Bakker ST, Mohrin M, Conroy PC, Pietras EM, Reynaud D, Alvarez S, Diolaiti ME, Ugarte F, Forsberg EC, Le Beau MM, Stohr BA, Méndez J, Morrison CG, Passegué E
Nature 2014 Aug 14;512(7513):198-202
Nature 2014 Aug 14;512(7513):198-202
Cross-species genomic and epigenomic landscape of retinoblastoma.
Benavente CA, McEvoy JD, Finkelstein D, Wei L, Kang G, Wang YD, Neale G, Ragsdale S, Valentine V, Bahrami A, Temirov J, Pounds S, Zhang J, Dyer MA
Oncotarget 2013 Jun;4(6):844-59
Oncotarget 2013 Jun;4(6):844-59
No comments: Submit comment
Supportive validation
- Submitted by
- Invitrogen Antibodies (provider)
- Main image
- Experimental details
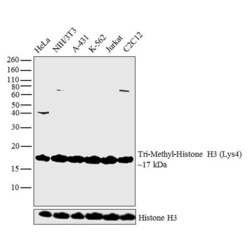
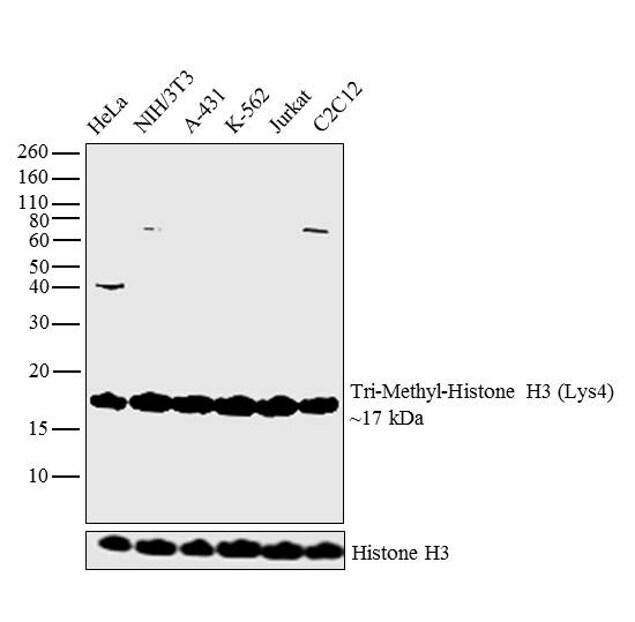
- Western blot analysis was performed on acid extracts (20 µg lysate) of HeLa (Lane 1), NIH/3T3 (Lane 2), A-431 (Lane 3), K-562 (Lane 4), Jurkat (Lane 5) and C2C12 (Lane 6). The blot was probed with Anti-Tri-Methyl-Histone H3 (Lys4) (Product # 49-1005, 1:500 dilution) and detected by chemiluminescence using Goat anti-Rabbit IgG (H+L) Superclonal™ Secondary Antibody, HRP conjugate (Product # A27036, 0.25 µg/mL, 1:4000 dilution). A 17 kDa band corresponding to Tri-Methyl-Histone H3 (Lys4) was observed across the cell lines tested.
Supportive validation
- Submitted by
- Invitrogen Antibodies (provider)
- Main image
- Experimental details
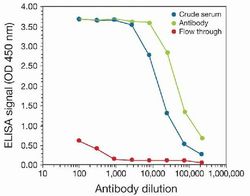
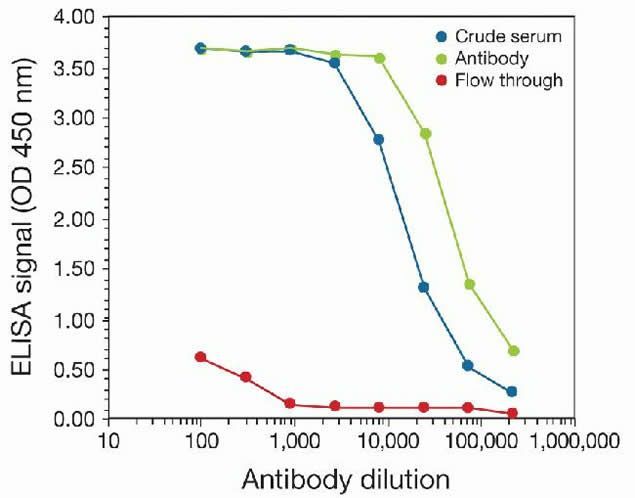
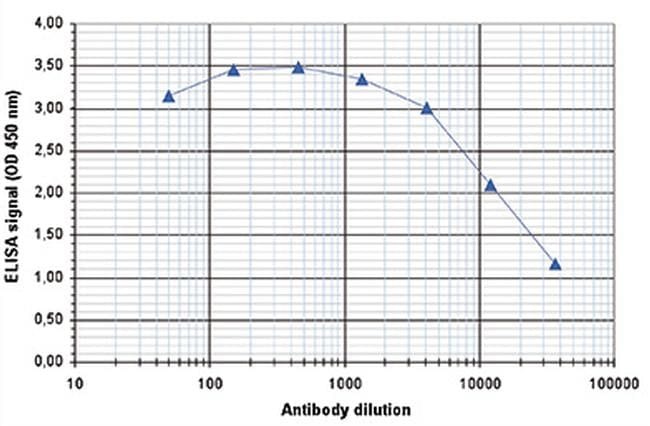
- To determine the titer, an ELISA was performed using anti-H3K4me3 crude serum, the anti-H3K4me3 antibody (Product # 49-1005), and the column flow through obtained from the antibody purification step. The antigen used was a peptide containing the histone H3 modification (trimethylated lysine 4). By plotting the absorbance against the antibody dilution, the titer of the affinity-purified antibody was estimated to be 1:50,000.
- Submitted by
- Invitrogen Antibodies (provider)
- Main image
- Experimental details
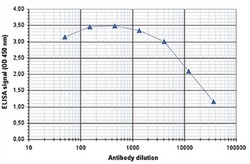
- To determine the titer of the antibody, an ELISA was performed using a serial dilution of the anti-H3K4me3 antibody (Product # 49-1005). The antigen used was a peptide containing the histone modification of interest. By plotting the absorbance against the antibody dilution, the titer of the antibody was estimated to be 1:18,350.
Supportive validation
- Submitted by
- Invitrogen Antibodies (provider)
- Main image

- Experimental details
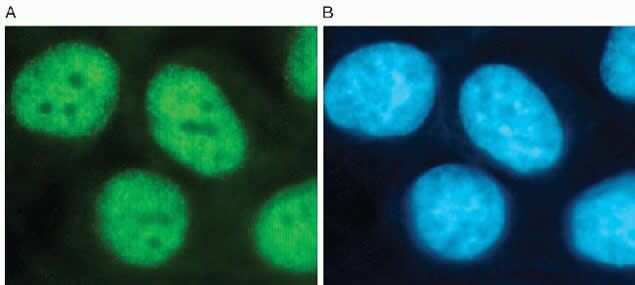
- HeLa cells were methanol fixed for 10 minutes and then blocked with 1% BSA containing PBS. The fixation step stabilizes the morphology of the cells and permeabilizes membranes. (A) Cells were labeled with the H3K4me3 Polyclonal Antibody, Rabbit (diluted 1:200 and incubated for 1 hour at room temperature) followed by a FITC-labeled goat anti-rabbit secondary antibody. (B) Nuclei were stained using the DNA-specific stain DAPI. Both, the H3K4me3 Polyclonal Antibody, Rabbit and DAPI produced clear nuclear staining.
- Submitted by
- Invitrogen Antibodies (provider)
- Main image

- Experimental details
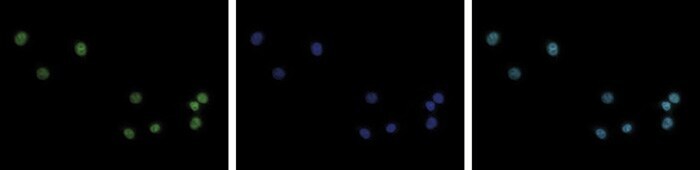
- HeLa cells were stained with the anti-H3K4me3 antibody (Product # 49-1005) and with DAPI. Cells were fixed with 4% formaldehyde for 10’ and blocked with PBS/TX-100 containing 5% normal goat serum and 1% BSA. The cells were immunofluorescently labeled with the H3K4me3 antibody (left) diluted 1:200 in blocking solution followed by an anti-rabbit antibody conjugated to Alexa488. The middle panel shows staining of the nuclei with DAPI. A merge of the two stainings is shown on the right.
- Submitted by
- Invitrogen Antibodies (provider)
- Main image
- Experimental details
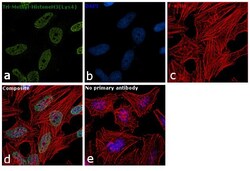
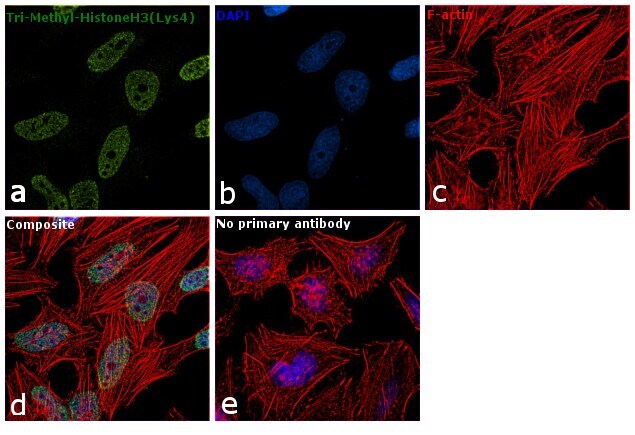
- Immunofluorescence analysis of Tri-Methyl-Histone H3 (Lys4) was performed using 70% confluent log phase HeLa cells. The cells were fixed with 4% paraformaldehyde for 10 minutes, permeabilized with 0.1% Triton™ X-100 for 10 minutes, and blocked with 1% BSA for 1 hour at room temperature. The cells were labeled with Rabbit Polyclonal Antibody (Product # 49-1005) at 5 µg/mL in 0.1% BSA and incubated overnight at 4 degree and then labeled with Goat anti-Rabbit IgG (H+L) Superclonal™ Secondary Antibody, Alexa Fluor® 488 conjugate (Product # A27034) at a dilution of 1:2000 for 45 minutes at room temperature (Panel a: green). Nuclei (Panel b: blue) were stained with SlowFade® Gold Antifade Mountant with DAPI (Product # S36938). F-actin (Panel c: red) was stained with Rhodamine Phalloidin (Product # R415, 1:300). Panel d represents the merged image showing nuclear localization. Panel e represents control cells with no primary antibody to assess background. The images were captured at 60X magnification.
Supportive validation
- Submitted by
- Invitrogen Antibodies (provider)
- Main image

- Experimental details
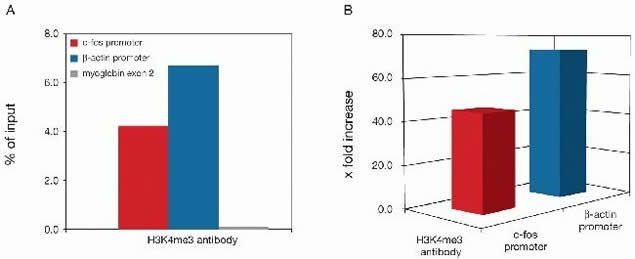
- ChIP assays were performed using U-2 OS cells, the anti-H3K4me3 antibody (Product # 49-1005), and optimized PCR primer sets for qPCR. Each ChIP assay used sheared chromatin from 1 million cells and 1 µg of anti-H3K4me3 antibody. Recovery (%: ChIP⁄input) and occupancy (x fold: positive⁄negative) are shown here. Recovery and occupancy of the c-fos promoter (red bars) by histone H3 (K4me3); recovery and occupancy of β-actin promoter (blue bars) by histone H3 (K4me3). Occupancy of the two promoters by the modified histone H3 is evident based on fluorescent qPCR analysis of immunoprecipitated DNA. Controls for IP and PCR specificity include primers for the myoglobin exon 2 (grey bar, negative control).
- Submitted by
- Invitrogen Antibodies (provider)
- Main image
- Experimental details
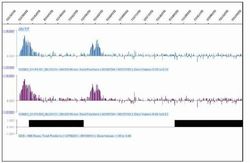
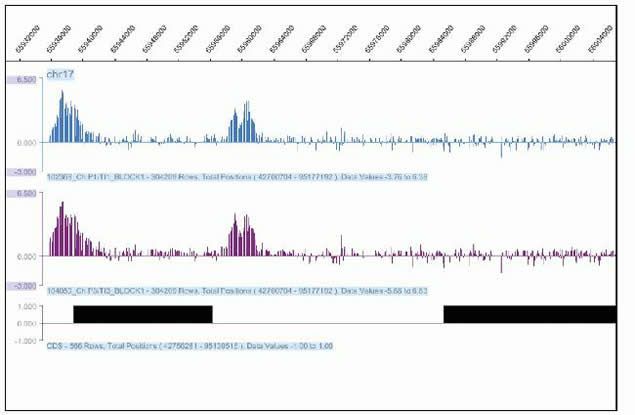
- ChIP assays were performed using U-2 OS cells, the anti-H3K4me3 antibody (Product # 49-1005), and optimized PCR primer sets for qPCR. Each ChIP assay used sheared chromatin from 1 million cells and 1 µg of anti-H3K4me3 antibody. The DNA of four ChIP assays was pooled and amplified. Subsequently, the DNA was hybridized on a tiling array (NimbleGen®, Set 34 MM8, Roche, Inc.). This figure shows the H3K4me3 ChIP-on-chip profile of an ubiquitin-like gene (GenBank® AK147046, US Dept. of Health and Human Services) on chromosome 17 of two different mouse cell lines (ES14 in blue and LF2 in purple). The ChIP-on-chip profile shows the clear presence of H3K4me3 at the promoter of the gene.
- Submitted by
- Invitrogen Antibodies (provider)
- Main image

- Experimental details
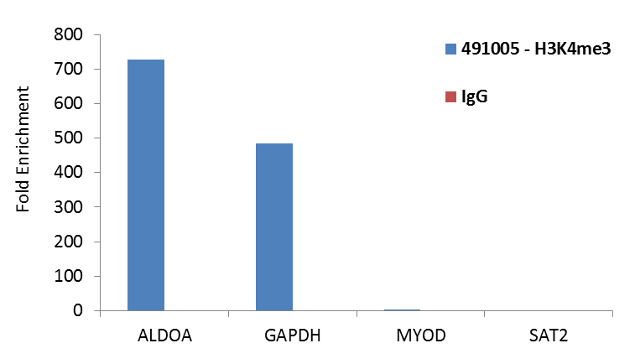
- Enrichment of endogenous Tri-Methyl-Histone H3 (Lys4) protein at specific gene loci using Anti-Tri-Methyl-Histone H3 (Lys4) Rabbit Polyclonal Antibody: Chromatin Immunoprecipitation (ChIP) was performed using Anti-Tri-Methyl-Histone H3 (Lys4) Rabbit Polyclonal Antibody (Product # 49-1005, 3 ug) on sheared chromatin from 2 million HeLa cells using the "MAGnify ChIP system" kit (Product # 49-2024). Normal Rabbit IgG was used as a negative IP control. The purified DNA was analyzed by qPCR with PCR primer pairs for the promoters of ALDOA, GAPDH used as positive, and MYOD and SAT2 satellite repeats used as negative target genes/binding sites. Data is presented as fold enrichment of the antibody signal versus the negative control IgG using the comparative CT method.
Supportive validation
- Submitted by
- Invitrogen Antibodies (provider)
- Main image
- Experimental details
- NULL
- Submitted by
- Invitrogen Antibodies (provider)
- Main image
- Experimental details
- NULL
- Submitted by
- Invitrogen Antibodies (provider)
- Main image
- Experimental details
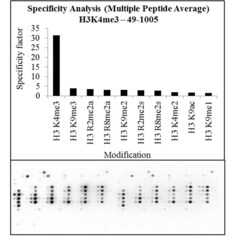
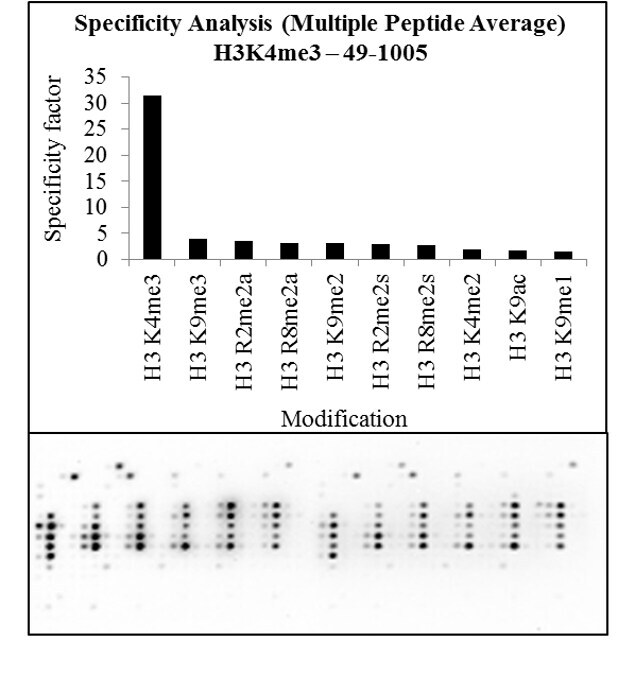
- Antibody specificity for modified targets can be established using peptide arrays by quantifying detection of the target protein along with closely related proteins. Peptide array of Histone H3K4me3 using Anti-Tri-Methyl-Histone H3 (Lys4) Polyclonal Antibody: An array of the specific peptide and other relevant peptides when tested using Anti-Tri-Methyl-Histone H3 (Lys4) Polyclonal Antibody (Product # 49-1005), showed that the Histone H3K4me3 modification was specifically recognized by the antibody.
- Submitted by
- Invitrogen Antibodies (provider)
- Main image

- Experimental details
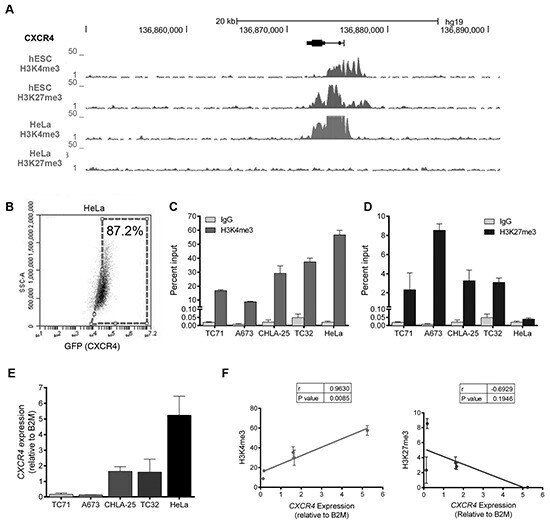
- Figure 3 The CXCR4 promoter is enriched with both the H3K4me3 and H3K27me3 histone marks in Ewing sarcoma cells A. Gene tracks for H3K4me3 and H3K27me3 at the CXCR4 promoter in human embryonic stem cells (hESC) and HeLa cells assembled from the ENCODE database demonstrate a bivalent state in hESC cells and a univalent active state in HeLa cells. B. FACS analysis of HeLa cells shows that most cells express CXCR4. C. Targeted ChIP-qPCR studies showed that the H3K4me3 is enriched at the CXCR4 promoter in both Ewing sarcoma and in HeLa cells. D. Targeted ChIP-qPCR studies showed that the H3K27me3 modification is enriched at the CXCR4 promoter of Ewing sarcoma cells but is not present in HeLa cells. E. CXCR4 expression as determined in a panel of Ewing sarcoma cell lines and HeLa cells using qRT-PCR. Data represented as mean +- SEM of three independent experiments. F. Expression of CXCR4 correlates directly with enrichment of H3K4me3 and inversely with H3K27me3 at the CXCR4 promoter. r= Pearson correlation co-efficient.
- Submitted by
- Invitrogen Antibodies (provider)
- Main image

- Experimental details
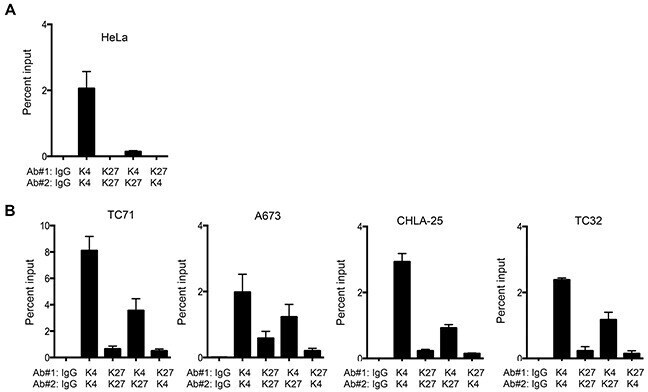
- Figure 4 The CXCR4 promoter is bivalent in Ewing sarcoma cells A. Sequential ChIP-qPCR experiments (ChIP-re-ChIP) for H3K4me3 followed by H3K27me3 (K4/K27) and vice versa (K27/K4), demonstrated only the H3K4me3 modification in HeLa cells, confirming its univalent chromatin state. B. ChIP-re-ChIP of Ewing sarcoma cells showed H3K4me3 at H3K27me3-marked chromatin (K4/K27), and vice versa (K27/K4) thus confirming that the CXCR4 promoter is bivalent. IgG, K4/K4, and K27/K27 served as controls. Data represented as mean +- SEM of three independent experiments.
- Submitted by
- Invitrogen Antibodies (provider)
- Main image
- Experimental details
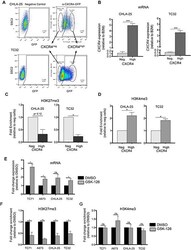
- Figure 5 Upregulation of CXCR4 is associated with loss of H3K27me3 A. CHLA-25 and TC32 cells were FACS-sorted into CXCR4 Neg (bottom 10%) and CXCR4 High (top 10%) populations. B. qRT-PCR confirmed that expression of CXCR4 mRNA correlated with CXCR4 surface protein expression in sorted cells. C. ChIP-qPCR experiments revealed that the H3K27me3 modification is relatively reduced in CXCR4 High populations compared to CXCR4 Neg cells. D. In contrast to H3K27me3, the H3K4me3 mark was shown to be increased in CXCR4 High populations. E. Exposure of Ewing sarcoma cells to GSK-126 resulted in an increase in CXCR4 expression. F. GSK-126 treated cells showed a loss of H3K27me3 at the CXCR4 promoter G. GSK-126 had no impact on H3K4me3 enrichment. Data represented as mean +- SEM of three independent experiments. *. P

- Submitted by
- Invitrogen Antibodies (provider)
- Main image
- Experimental details
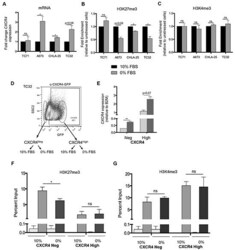
- Figure 6 Ewing sarcoma cells lose the repressive H3K27me3 mark at the CXCR4 promoter in response to stress A. qRT-PCR shows that serum starvation resulted in upregulated expression of CXCR4 expression in three of four Ewing sarcoma cell lines. B. CHIP-qPCR confirmed diminished H3K27me3 enrichment at the CXCR4 promoter in cells with upregulated transcript expression. C. No change in H3K4me3 enrichment was induced by serum deprivation. D. TC32 cells were FACS-sorted to isolate CXCR4 negative cells which were then placed into 10% FBS or serum deprived conditions for 24 hours. E. CXCR4 mRNA expression was induced by serum deprivation in CXCR4 negative (p

- Submitted by
- Invitrogen Antibodies (provider)
- Main image
- Experimental details
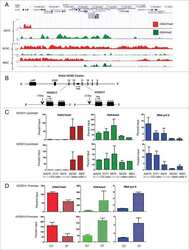
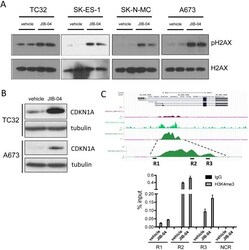
- Figure 5 Effects of JIB-04 on DNA damage and CDKN1A expression (A) Levels of phosphorylated H2AX (pH2AX, Ser139) in vehicle and JIB-04-treated cells (TC32: 0.3 muM; SK-ES-1 and SK-N-MC: 1 muM; A673: 2 muM), as determined by immunoblotting of acid-extracted histones. (B) CDKN1A protein levels in TC32 cells (0.3 muM JIB-04 for 36 hours) and A673 (2 muM JIB-04 for 36 hours) cells, as determined by immunoblotting. (C) H3K4me3 ChIP-seq signal at CDKN1A promoter in A673 cells (data in UCSC browser from Tomazou et al [ 11 ]; top panel). Levels of H3K4me3 at the indicated CDKN1A promoter regions (R1-R3) in vehicle and JIB-04-treated cells (2 muM for 36 hours), as determined by ChIP-qPCR; data are plotted as mean and SEM of percent input from two independent ChIP experiments; NCR: negative control region (10 Kbp upstream of MCAM promoter [ 18 ]); see Supplementary Figure 2 for ChIP-qPCR signal in IgG samples as well as NCR.
