Explore
 Validate
 Learn
Learn ELISA
ELISA Immunocytochemistry
Antibody data
- Antibody Data
- Antigen structure
- References [0]
- Comments [0]
- Validations
- Immunocytochemistry [1]
- Chromatin Immunoprecipitation [4]
- Other assay [7]
Submit
Validation data
Reference
Comment
Report error
- Product number
- MA5-23516 - Provider product page

- Provider
- Invitrogen Antibodies
- Product name
- H3K27ac Monoclonal Antibody, ChIP-Verified
- Antibody type
- Monoclonal
- Antigen
- Synthetic peptide
- Description
- Click here for Master Lot linking information.
- Reactivity
- Human
- Host
- Mouse
- Isotype
- IgG
- Vial size
- 50 µg
- Concentration
- 1 mg/mL
- Storage
- -20°C or -80°C if preferred
No comments: Submit comment
Supportive validation
- Submitted by
- Invitrogen Antibodies (provider)
- Main image
- Experimental details
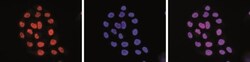
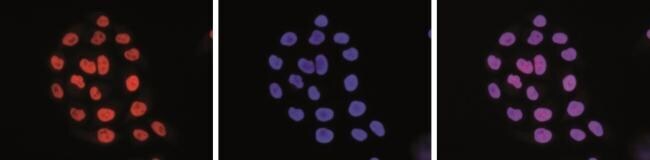
- Immunofluorescent detection of Acetyl-Histone H3 (Lys27) in HeLa cells stained with Acetyl-Histone H3 (Lys27) monoclonal antibody (Product # MA5-23516). Cells were fixed with 4% formaldehyde for 10' and blocked with PBS/Triton X-100 containing 5% normal goat serum and 1% BSA. The cells were immunofluorescently labelled with the H3K27ac antibody (left) at a dilution of 1:500 in blocking solution followed by an anti-mouse antibody conjugated to AlexaFluor 594. The middle panel shows staining of the nuclei with DAPI. A merge of the two stainings is shown on the right.
Supportive validation
- Submitted by
- Invitrogen Antibodies (provider)
- Main image
- Experimental details
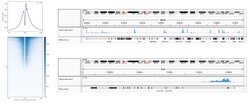
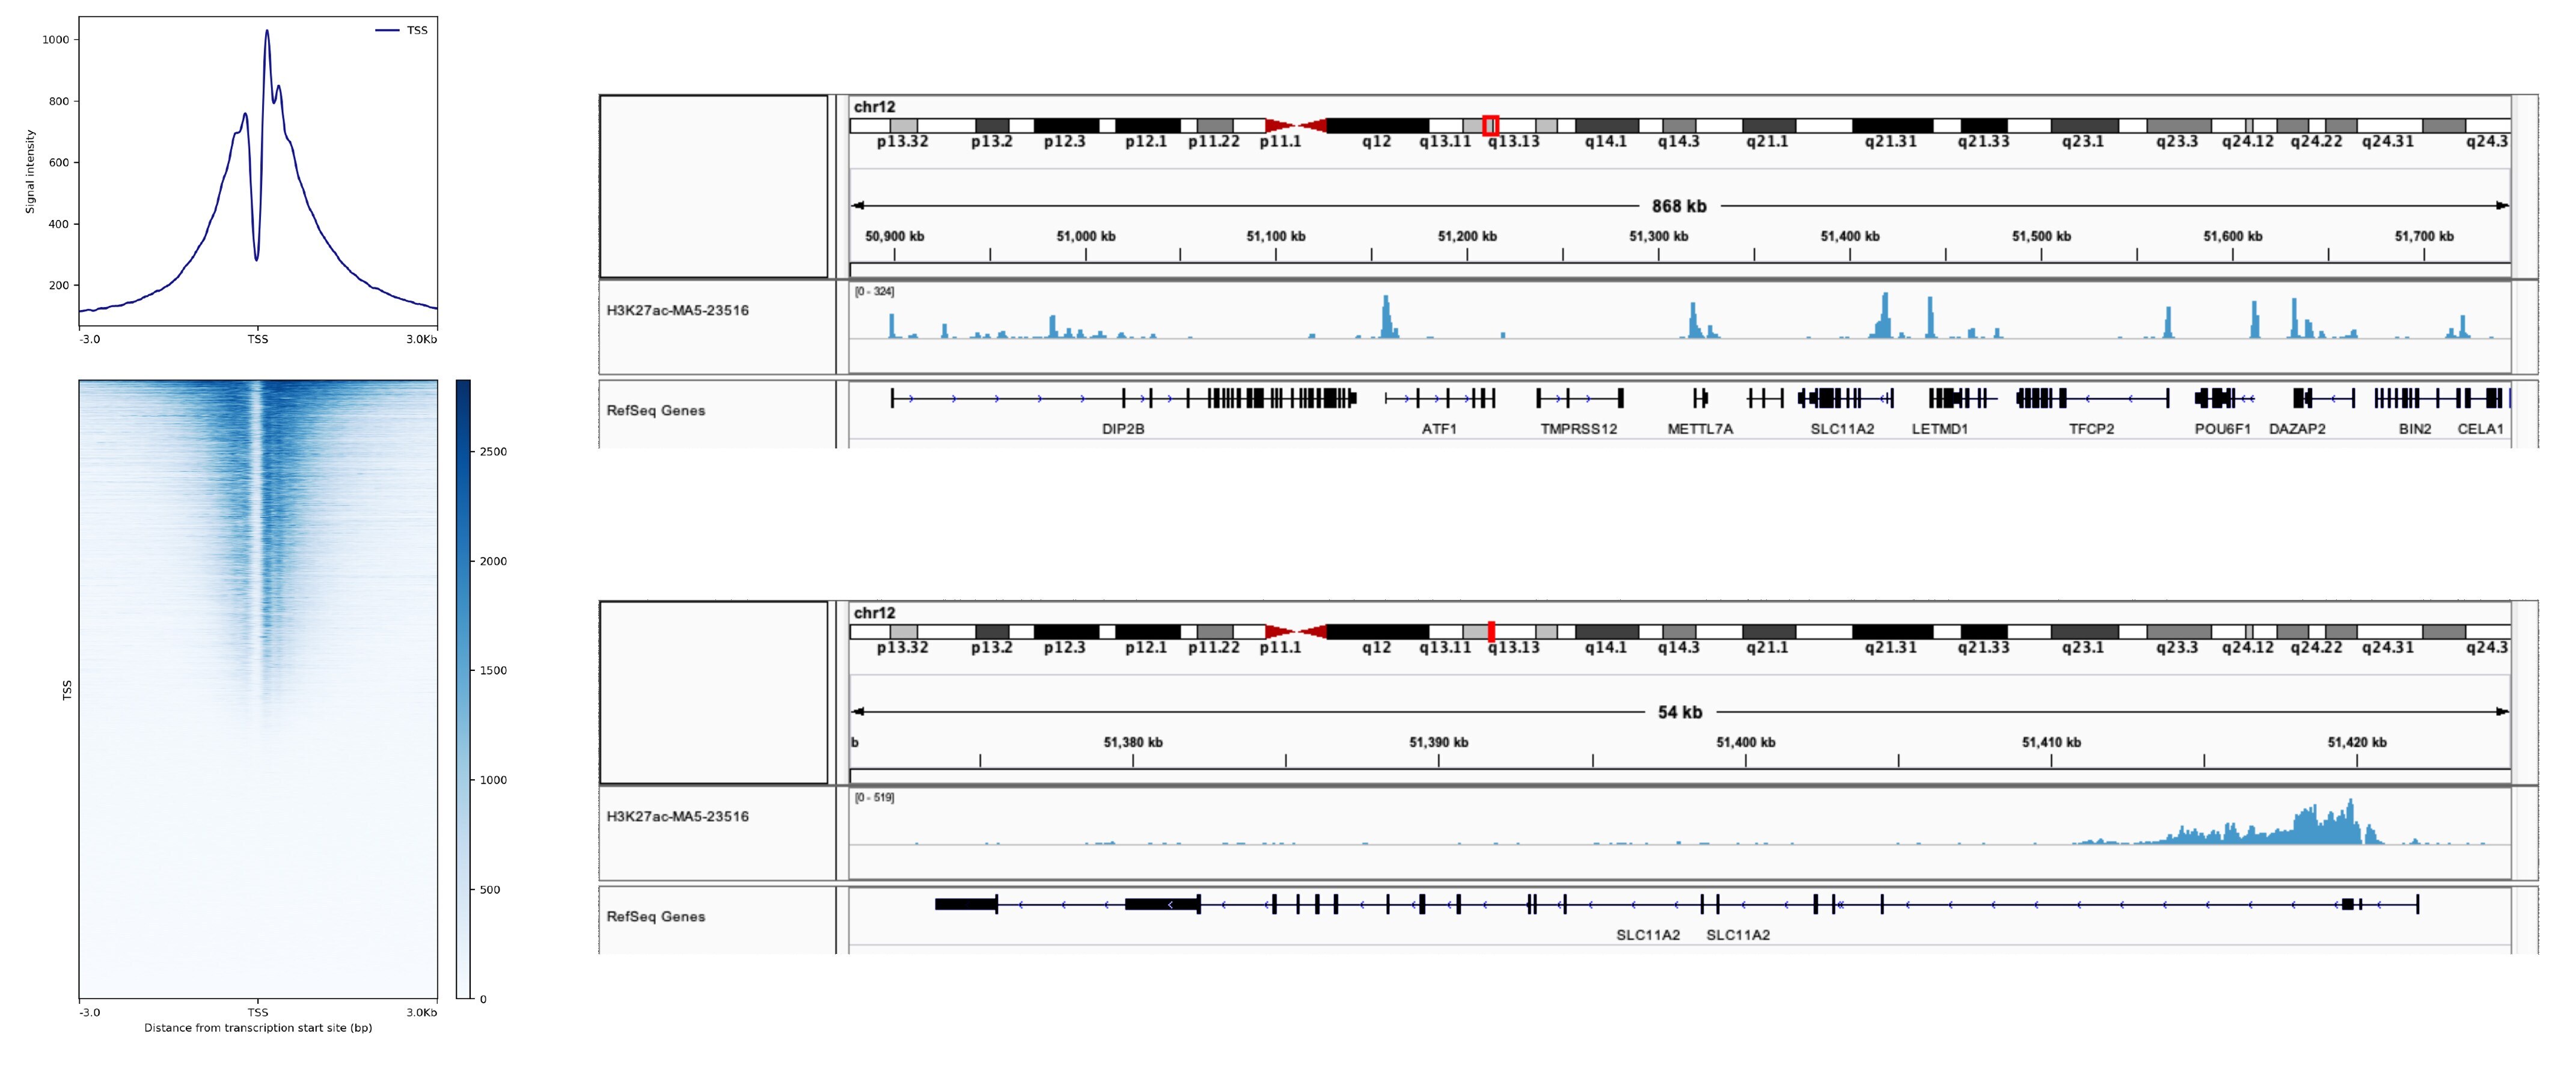
- Genome-wide enrichment analysis and two representative genomic regions are shown for H3K27ac ChIP-seq data generated using human K562 cells. Data shown are representative of H3K27ac ChIP antibody (Product # MA5-23516). Note not all lots of this antibody have been tested in ChIP-seq. Native ChIP-seq was performed by EpiCypher ™ using published methods (see reference ) with SNAP-ChIP ™ Spike-in (Product # A47358) nucleosome controls added prior to chromatin digestion to confirm antibody specificity and ChIP efficiency. Paired-end sequencing reads were aligned to the human genome using Bowtie 2 (Johns Hopkins University). Bigwig files of read enrichment in binned genomic regions (signal intensity) flanking the indicated gene features were used to create a cumulative histogram plot as well as heatmap colored by signal intensity. Gene browser shots were generated using the Integrative Genomics Viewer (IGV, Broad Institute) with the window size denoted (top).
- Submitted by
- Invitrogen Antibodies (provider)
- Main image

- Experimental details
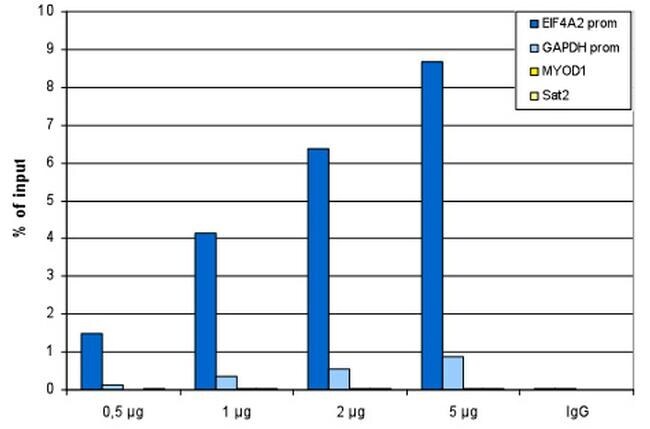
- ChIP assays were performed using human HeLa cells, the anti-H3K27ac antibody (Product # MA5-23516) and optimized PCR primer pairs for qPCR. ChIP was performed using sheared chromatin from 1 million cells. A titration consisting of 0.5, 1, 2 and 5 µg of antibody per ChIP experiment was analyzed. IgG (1µg/IP) was used as a negative IP control. Quantitative PCR was performed with primers specific for the promoters of the EIF4A2 and GAPDH genes, used as positive controls, and for the inactive MYOD1 gene and the Sat2 satellite repeat, used as negative controls. The figure shows the recovery, expressed as a % of input (the relative amount of immunoprecipitated DNA compared to input DNA after qPCR analysis).
- Submitted by
- Invitrogen Antibodies (provider)
- Main image

- Experimental details
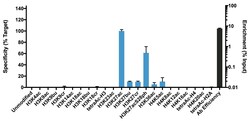
- K-AcylStat Panel, SNAP-ChIP™ Spike-in (Product # A47358), a proprietary technology developed by EpiCypher™ was used to analyze the performance of H3K27ac antibody (Product # MA5-23516) in ChIP. SNAP-ChIP panels consist of a pool of DNA-barcoded recombinant nucleosomes harboring histone PTMs that are spiked-in to a ChIP reaction to assess efficiency and specificity of the antibody. The K-AcylStat panel includes an unmodified control plus nucleosomes containing histones with single acylations (acetylation, butrylation, or crotonylation) and combinatorial PTM configurations (x-axis). Recovery of each unique DNA-barcoded nucleosome is quantified to determine how much of each PTM is immunoprecipitated in the ChIP reaction (for more information see reference). H3K27ac antibody was tested in native ChIP with 3 µg K-562 cell chromatin and 3 µg antibody. Specificity (left Y-axis) was determined by qPCR to each modified nucleosome in the panel (X-axis). Black bar represents antibody efficiency (right Y-axis; log scale) and indicates percentage of the barcoded nucleosome target immunoprecipitated relative to Input. All bars represent mean ± SEM.

- Submitted by
- Invitrogen Antibodies (provider)
- Main image

- Experimental details
- ChIP assays were performed using human HeLa cells, the anti-H3K27ac antibody (Product # MA5-23516) and optimized PCR primer pairs for qPCR. ChIP was performed using sheared chromatin from 1 million cells. A titration consisting of 0.5, 1, 2 and 5 µg of antibody per ChIP experiment was analyzed. IgG (1µg/IP) was used as a negative IP control. Quantitative PCR was performed with primers specific for the promoters of the EIF4A2 and GAPDH genes, used as positive controls, and for the inactive MYOD1 gene and the Sat2 satellite repeat, used as negative controls. The figure shows the recovery, expressed as a % of input (the relative amount of immunoprecipitated DNA compared to input DNA after qPCR analysis).

Supportive validation
- Submitted by
- Invitrogen Antibodies (provider)
- Main image
- Experimental details
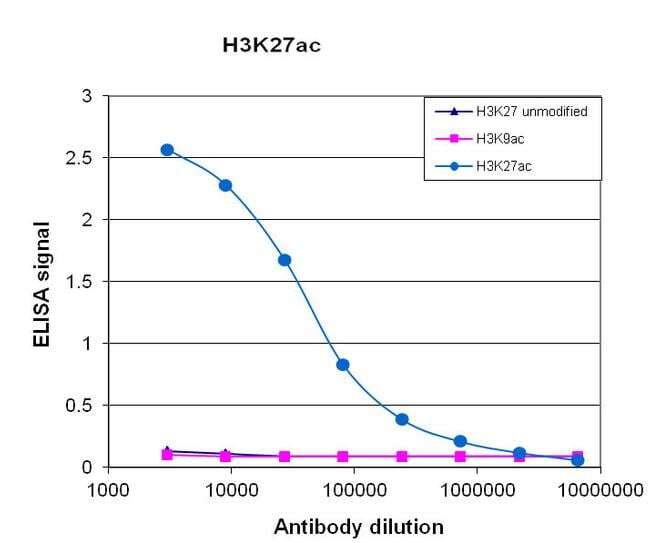
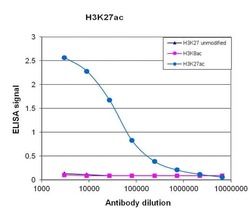
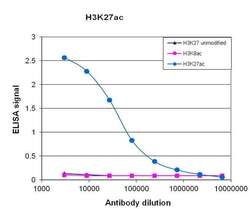
- To test the specificity, an ELISA was performed using a serial dilution of Acetyl-Histone H3 (Lys27) monoclonal antibody (Product # MA5-23516). The wells were coated with peptides containing the unmodified H3K27 region as well as the acetylated H3K27 and the acetylated H3K9. Figure 1 shows a high specificity of the antibody for the peptide containing the modification of interest.

- Submitted by
- Invitrogen Antibodies (provider)
- Main image
- Experimental details
- Antibody specificity was demonstrated by detection of enrichment of the targeted histone modification using SNAP-ChIP™ Spike-in, a proprietary technology developed by EpiCypher™. SNAP-ChIP™ spike-in was performed using H3K27ac Monoclonal Antibody (Product # MA5-23516) and H3K27ac was enriched compared to the other histone modifications in the SNAP-ChIP™ K-AcylStat Panel (Product # A47358).

- Submitted by
- Invitrogen Antibodies (provider)
- Main image
- Experimental details
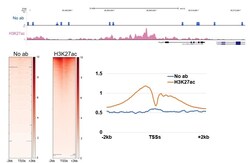
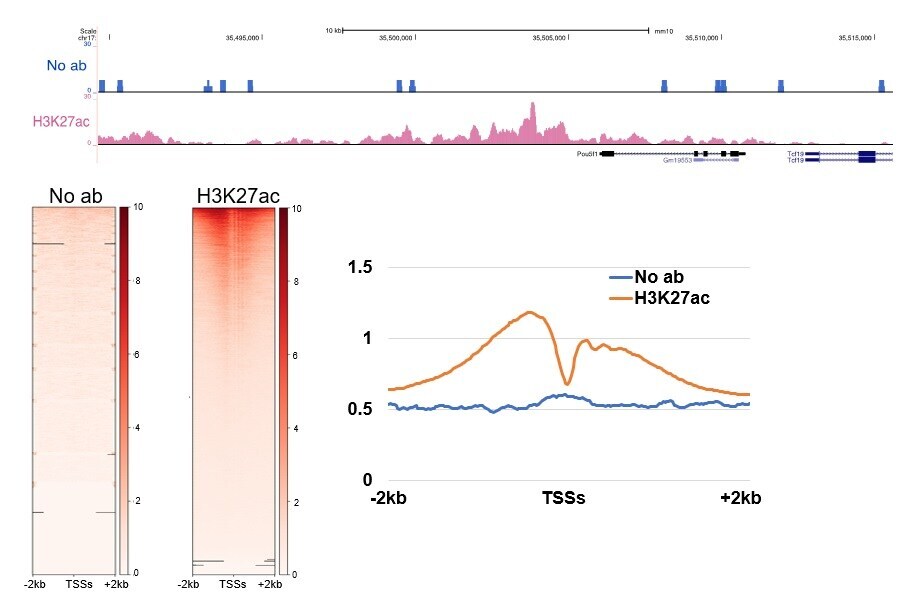
- CUT&RUN was performed using 100,000 E14 mouse embryonic stem cells with monoclonal H3K27ac antibody (Product # MA5-23516) or no antibody control. Sequencing reads were aligned to annotated TSS (+/- 2kbp) of 43,511 annotated TSSs (from HOMER). Libraries were sequenced to ~10 million mapped reads. Gray lines indicate regions of no sequence coverage. Data courtesy of Sarah Hainer at University of Pittsburgh.

- Submitted by
- Invitrogen Antibodies (provider)
- Main image
- Experimental details
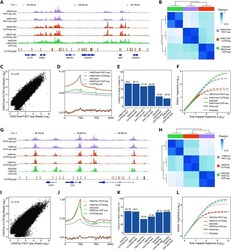
- Figure 3. FACT-seq decodes genome-wide repressive and active histone modifications in human B-cells (GM12878 cells). ( A ) Genome browser tracks for H3K27me3 sequencing libraries in GM12878 cells: Results from FACT-seq, CUT&Tag, ENCODE ChIP-seq and CUT&Tag IgG control. The gene names are shown at the bottom. Chr. = Chromosome. ( B ) Pearson correlation heat map showing sample-by-sample unsupervised clustering on all peaks identified across different types of libraries. ( C ) Genome-wide correlation of H3K27me3 FACT-seq sequencing reads and H3K27me3 CUT&Tag sequencing reads from GM12878 cells. Each dot represents an individual peak. R = Pearson correlation. ( D ) Metaplots showing the distribution of sequencing reads across transcription start sites (TSSs) and transcription end sites (TESs) from H3K27me3 FACT-seq, H3K27me3 CUT&Tag, ENCODE H3K27me3 ChIP-seq, and H3K27me3 CUT&Tag IgG control in GM12878 cells. ( E ) Quantification of the fraction of reads in peaks (FRiP) for each sequencing library. ( F ) Library complexity for different sequencing libraries. ( G ) Genome browser tracks for H3K27ac sequencing libraries in GM12878 cells: Results from FACT-seq, CUT&Tag, ENCODE ChIP-seq, and CUT&Tag IgG control. The gene names are shown at the bottom. Chr. = Chromosome. ( H ) Pearson correlation heat map showing sample-by-sample unsupervised clustering on all peaks identified across different types of libraries. ( I ) Genome-wide correlation of H3K27ac FACT-seq sequencing reads and

- Submitted by
- Invitrogen Antibodies (provider)
- Main image

- Experimental details
- Genome-wide enrichment analysis and two representative genomic regions are shown for H3K27ac ChIP-seq data generated using human K562 cells. Data shown are representative of H3K27ac ChIP antibody (Product # MA5-23516). Note not all lots of this antibody have been tested in ChIP-seq. Native ChIP-seq was performed by EpiCypher ™ using published methods (see reference ) with SNAP-ChIP ™ Spike-in (Product # A47358) nucleosome controls added prior to chromatin digestion to confirm antibody specificity and ChIP efficiency. Paired-end sequencing reads were aligned to the human genome using Bowtie 2 (Johns Hopkins University). Bigwig files of read enrichment in binned genomic regions (signal intensity) flanking the indicated gene features were used to create a cumulative histogram plot as well as heatmap colored by signal intensity. Gene browser shots were generated using the Integrative Genomics Viewer (IGV, Broad Institute) with the window size denoted (top).

- Submitted by
- Invitrogen Antibodies (provider)
- Main image

- Experimental details
- CUT&RUN was performed using 100,000 E14 mouse embryonic stem cells with monoclonal H3K27ac antibody (Product # MA5-23516) or no antibody control. Sequencing reads were aligned to annotated TSS (+/- 2kbp) of 43,511 annotated TSSs (from HOMER). Libraries were sequenced to ~10 million mapped reads. Gray lines indicate regions of no sequence coverage. Data courtesy of Sarah Hainer at University of Pittsburgh.
- Submitted by
- Invitrogen Antibodies (provider)
- Main image
- Experimental details
- To test the specificity, an ELISA was performed using a serial dilution of Acetyl-Histone H3 (Lys27) monoclonal antibody (Product # MA5-23516). The wells were coated with peptides containing the unmodified H3K27 region as well as the acetylated H3K27 and the acetylated H3K9. Figure 1 shows a high specificity of the antibody for the peptide containing the modification of interest.