Explore
 Validate
 Learn
Learn Flow cytometry
Antibody data
- Antibody Data
- Antigen structure
- References [13]
- Comments [0]
- Validations
- Flow cytometry [1]
- Other assay [6]
Submit
Validation data
Reference
Comment
Report error
- Product number
- 12-9381-42 - Provider product page

- Provider
- Invitrogen Antibodies
- Product name
- Podoplanin Monoclonal Antibody (NZ-1.3), PE, eBioscience™
- Antibody type
- Monoclonal
- Antigen
- Other
- Description
- Description: Podoplanin is a 40-kDa type I transmembrane sialomucin-like glycoprotein involved in platelet aggregation and cancer metastasis. This protein is expressed on lymphatic endothelial cells and follicular dendritic cells, as well as on many human cancers, including squamous cell carcinoma, glioblastoma, seminoma, and mesothelioma. Podoplanin expression has been demonstrated to be regulated by the Fos protein of the Activating Protein-1 (AP-1) transcription factor complex. Much of its functionality arises via interaction with its endogenous receptor, C-type lectin-like receptor-2 (CLEC-2). This antibody has been reported to block the interaction between Podoplanin and CLEC-2. Applications Reported: This NZ-1.3 antibody has been reported for use in flow cytometric analysis. Applications Tested: This NZ-1.3 antibody has been pre-titrated and tested by flow cytometric analysis of U87 cells. This can be used at 5 µL (0.25 µg) per test. A test is defined as the amount (µg) of antibody that will stain a cell sample in a final volume of 100 µL. Cell number should be determined empirically but can range from 10^5 to 10^8 cells/test. Excitation: 488-561 nm; Emission: 578 nm; Laser: Blue Laser, Green Laser, Yellow-Green Laser. Filtration: 0.2 µm post-manufacturing filtered.
- Reactivity
- Human
- Host
- Rat
- Conjugate
- Yellow dye
- Isotype
- IgG
- Antibody clone number
- NZ-1.3
- Vial size
- 100 Tests
- Concentration
- 5 µL/Test
- Storage
- 4° C, store in dark, DO NOT FREEZE!
Submitted references Reprogramming bone progenitor identity and potency through control of collagen density and oxygen tension.
Phenotypic and functional characterization of synovial fluid-derived fibroblast-like synoviocytes in rheumatoid arthritis.
Dissecting human embryonic skeletal stem cell ontogeny by single-cell transcriptomic and functional analyses.
Directed induction of alveolar type I cells derived from pluripotent stem cells via Wnt signaling inhibition.
Kaposi's sarcoma-associated herpesvirus vFLIP promotes MEndT to generate hybrid M/E state for tumorigenesis.
Distinctive Properties of Endothelial Cells from Tumor and Normal Tissue in Human Breast Cancer.
Origin-Specific Adhesive Interactions of Mesenchymal Stem Cells with Platelets Influence Their Behavior After Infusion.
Human Extravillous Trophoblasts Penetrate Decidual Veins and Lymphatics before Remodeling Spiral Arteries during Early Pregnancy.
Role of podoplanin in the high interleukin-17A secretion resulting from interactions between activated lymphocytes and psoriatic skin-derived mesenchymal cells.
Rheumatoid synovial fibroblasts differentiate into distinct subsets in the presence of cytokines and cartilage.
Interaction among activated lymphocytes and mesenchymal cells through podoplanin is critical for a high IL-17 secretion.
Syk and Src family kinases regulate C-type lectin receptor 2 (CLEC-2)-mediated clustering of podoplanin and platelet adhesion to lymphatic endothelial cells.
Characterization of anti-podoplanin monoclonal antibodies: critical epitopes for neutralizing the interaction between podoplanin and CLEC-2.
Al Hosni R, Bozec L, Roberts SJ, Cheema U
iScience 2022 Apr 15;25(4):104059
iScience 2022 Apr 15;25(4):104059
Phenotypic and functional characterization of synovial fluid-derived fibroblast-like synoviocytes in rheumatoid arthritis.
Køster D, Egedal JH, Lomholt S, Hvid M, Jakobsen MR, Müller-Ladner U, Eibel H, Deleuran B, Kragstrup TW, Neumann E, Nielsen MA
Scientific reports 2021 Nov 12;11(1):22168
Scientific reports 2021 Nov 12;11(1):22168
Dissecting human embryonic skeletal stem cell ontogeny by single-cell transcriptomic and functional analyses.
He J, Yan J, Wang J, Zhao L, Xin Q, Zeng Y, Sun Y, Zhang H, Bai Z, Li Z, Ni Y, Gong Y, Li Y, He H, Bian Z, Lan Y, Ma C, Bian L, Zhu H, Liu B, Yue R
Cell research 2021 Jul;31(7):742-757
Cell research 2021 Jul;31(7):742-757
Directed induction of alveolar type I cells derived from pluripotent stem cells via Wnt signaling inhibition.
Kanagaki S, Ikeo S, Suezawa T, Yamamoto Y, Seki M, Hirai T, Hagiwara M, Suzuki Y, Gotoh S
Stem cells (Dayton, Ohio) 2021 Feb;39(2):156-169
Stem cells (Dayton, Ohio) 2021 Feb;39(2):156-169
Kaposi's sarcoma-associated herpesvirus vFLIP promotes MEndT to generate hybrid M/E state for tumorigenesis.
Chen W, Ding Y, Liu D, Lu Z, Wang Y, Yuan Y
PLoS pathogens 2021 Dec;17(12):e1009600
PLoS pathogens 2021 Dec;17(12):e1009600
Distinctive Properties of Endothelial Cells from Tumor and Normal Tissue in Human Breast Cancer.
Wilkus K, Brodaczewska K, Kajdasz A, Kieda C
International journal of molecular sciences 2021 Aug 17;22(16)
International journal of molecular sciences 2021 Aug 17;22(16)
Origin-Specific Adhesive Interactions of Mesenchymal Stem Cells with Platelets Influence Their Behavior After Infusion.
Sheriff L, Alanazi A, Ward LSC, Ward C, Munir H, Rayes J, Alassiri M, Watson SP, Newsome PN, Rainger GE, Kalia N, Frampton J, McGettrick HM, Nash GB
Stem cells (Dayton, Ohio) 2018 Jul;36(7):1062-1074
Stem cells (Dayton, Ohio) 2018 Jul;36(7):1062-1074
Human Extravillous Trophoblasts Penetrate Decidual Veins and Lymphatics before Remodeling Spiral Arteries during Early Pregnancy.
He N, van Iperen L, de Jong D, Szuhai K, Helmerhorst FM, van der Westerlaken LA, Chuva de Sousa Lopes SM
PloS one 2017;12(1):e0169849
PloS one 2017;12(1):e0169849
Role of podoplanin in the high interleukin-17A secretion resulting from interactions between activated lymphocytes and psoriatic skin-derived mesenchymal cells.
Noack M, Ndongo-Thiam N, Miossec P
Clinical and experimental immunology 2016 Oct;186(1):64-74
Clinical and experimental immunology 2016 Oct;186(1):64-74
Rheumatoid synovial fibroblasts differentiate into distinct subsets in the presence of cytokines and cartilage.
Croft AP, Naylor AJ, Marshall JL, Hardie DL, Zimmermann B, Turner J, Desanti G, Adams H, Yemm AI, Müller-Ladner U, Dayer JM, Neumann E, Filer A, Buckley CD
Arthritis research & therapy 2016 Nov 18;18(1):270
Arthritis research & therapy 2016 Nov 18;18(1):270
Interaction among activated lymphocytes and mesenchymal cells through podoplanin is critical for a high IL-17 secretion.
Noack M, Ndongo-Thiam N, Miossec P
Arthritis research & therapy 2016 Jun 23;18:148
Arthritis research & therapy 2016 Jun 23;18:148
Syk and Src family kinases regulate C-type lectin receptor 2 (CLEC-2)-mediated clustering of podoplanin and platelet adhesion to lymphatic endothelial cells.
Pollitt AY, Poulter NS, Gitz E, Navarro-Nuñez L, Wang YJ, Hughes CE, Thomas SG, Nieswandt B, Douglas MR, Owen DM, Jackson DG, Dustin ML, Watson SP
The Journal of biological chemistry 2014 Dec 26;289(52):35695-710
The Journal of biological chemistry 2014 Dec 26;289(52):35695-710
Characterization of anti-podoplanin monoclonal antibodies: critical epitopes for neutralizing the interaction between podoplanin and CLEC-2.
Ogasawara S, Kaneko MK, Price JE, Kato Y
Hybridoma (2005) 2008 Aug;27(4):259-67
Hybridoma (2005) 2008 Aug;27(4):259-67
No comments: Submit comment
Supportive validation
- Submitted by
- Invitrogen Antibodies (provider)
- Main image
- Experimental details
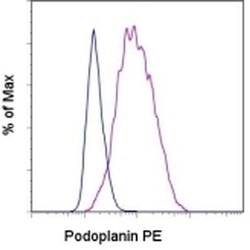
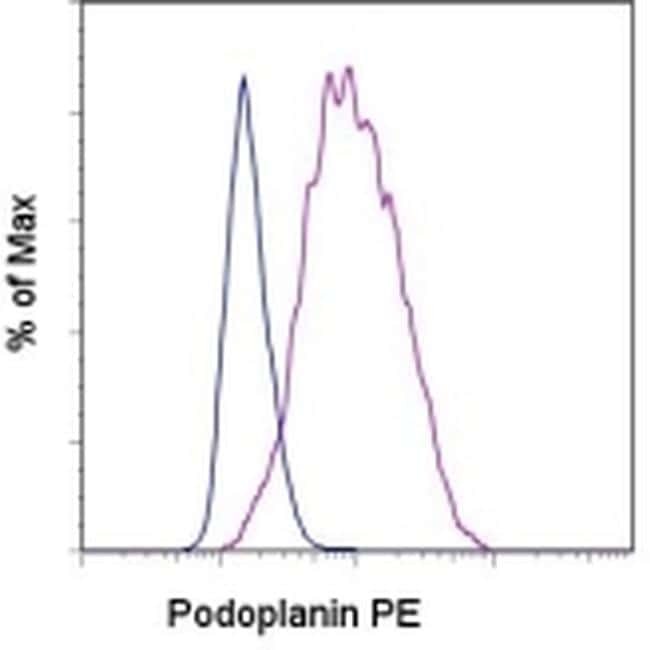
- Staining of the U87 cell line with Rat IgG2a K Isotype Control PE (Product # 12-4321-80) (blue histogram) or Anti-Human Podoplanin PE (purple histogram). Total viable cells were used for analysis.
- Conjugate
- Yellow dye
Supportive validation
- Submitted by
- Invitrogen Antibodies (provider)
- Main image
- Experimental details
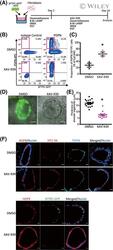
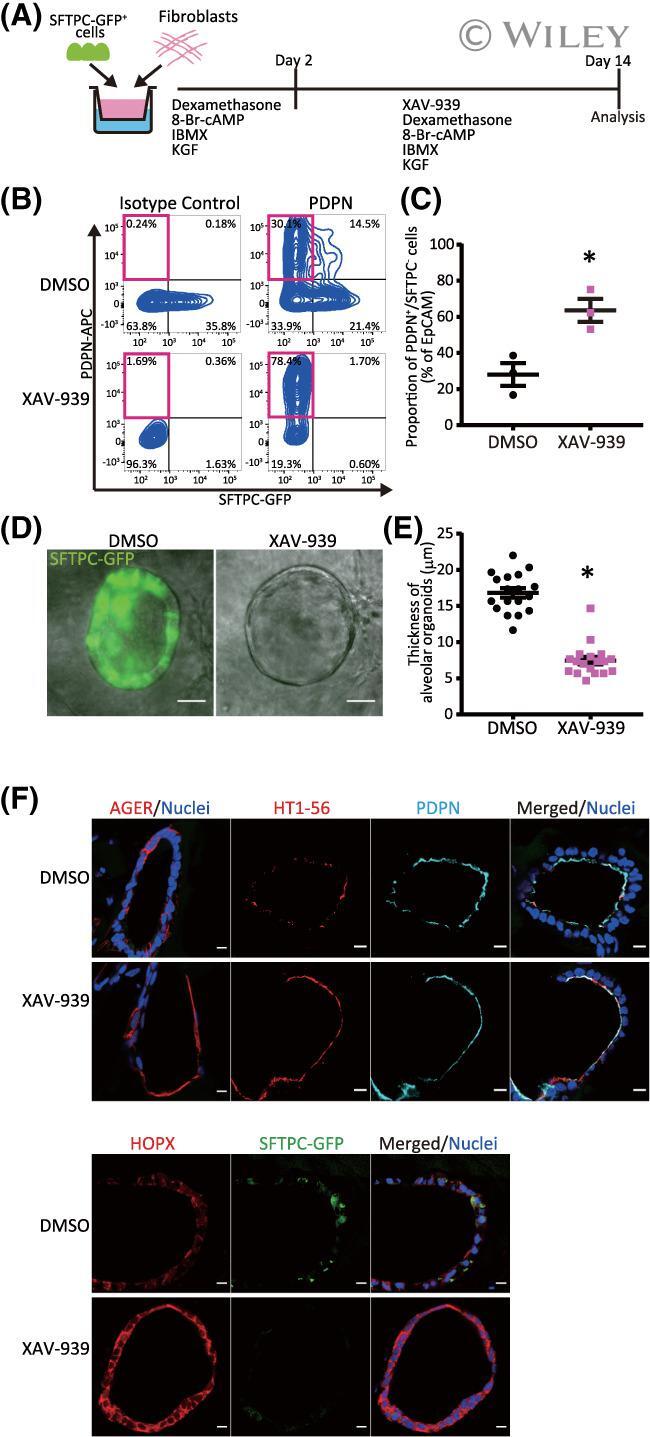
- 6 FIGURE XAV-939 increases the population of iAT1 cells in FD-AOs. A, A schematic diagram of the analysis of the effect of XAV-939 on FD-AOs. B,C, Flow cytometric analyses of the PDPN and SFTPC expression of FD-EpCAM + cells (P2-5). FD-AOs (P2-5) were treated with 10 muM XAV-939 or DMSO from day 2 to 14, and then the proportion of SFPTC - PDPN + cells in FD-AOs was measured on day 14 (mean +- SEM, n = 3 from three independent experiments). The values indicate the percentage of each population. * P < .05 vs DMSO-treated hiPSC-derived SFTPC - PDPN + cells (unpaired two-tailed Student's t test). D,E, Representative bright-field and SFTPC-GFP fluorescence microscopic live cell images of FD-AOs (P2-5) treated with DMSO or 10 muM XAV-939 from day 2 to 14. Thickness of each FD-AO (P2-P5) treated with DMSO or 10 muM XAV-939 was measured (mean +- SEM, n = 18 spheres from three independent experiments). Scale bars = 50 mum. * P < .05 vs DMSO-treated FD-AO (unpaired two-tailed Student's t test). F, Immunostaining of AT1 markers (AGER, HOPX, HT1-56, and/or PDPN) and SFTPC-GFP in DMSO- or XAV-939-treated FD-AOs (P3). Scale bars = 10 mum. DMSO, dimethyl sulfoxide; FD-AOs, fibroblast-dependent alveolar organoids; hiPSC, human induced pluripotent stem cell
- Conjugate
- Yellow dye
- Submitted by
- Invitrogen Antibodies (provider)
- Main image
- Experimental details
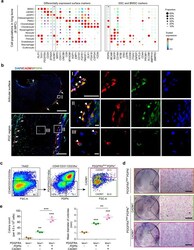
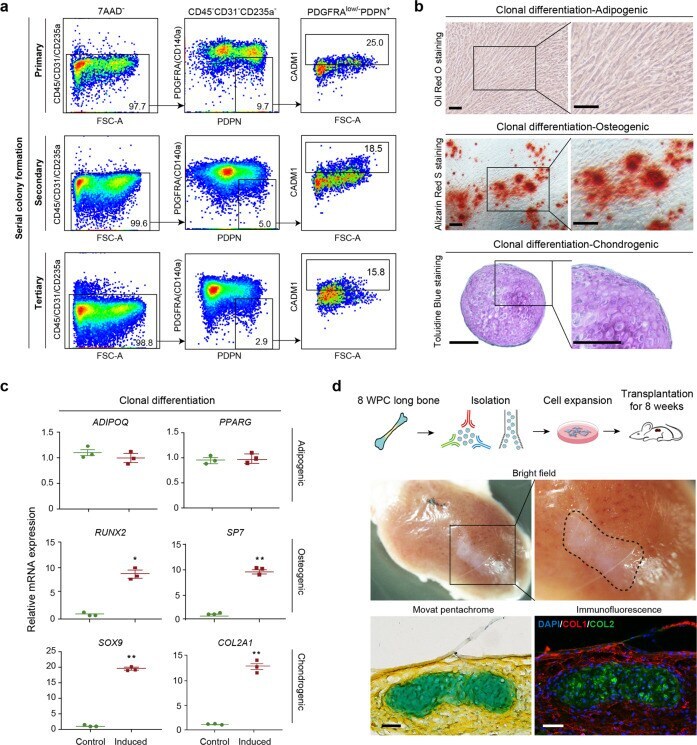
- Fig. 4 Identification of CADM1 as a phenotypic marker of eSSPCs. a Dot plots showing the expression of differentially expressed cell surface genes (left) and candidate SSC markers (right) in 8 WPC human long bone subsets. Asterisks indicated positive markers that were used to enrich eSSPCs. b Immunofluorescent images of PDPN + CADM1 + cells in 8 WPC human long bones. Overviews of PDPN + CADM1 + cells (arrows) in the articular (upper left) and POC (bottom left) regions were shown on the left. PDPN + CADM1 + cells were found in the inner layer of perichondrium in the articular regions (I) and surrounding POC (II). A few PDPN + CADM1 + cells were also found inside POC (III). Arrow heads indicated enlarged PDPN + CADM1 + cells. Merged and single-channel images of DAPI (blue), CADM1 (red) and PDPN (green) were shown ( n = 2 embryos). Scale bars in snapshot images, 50 mum; scale bars in magnified images, 5 mum. c Flow cytometry gating strategies for sorting different populations in 8 WPC long bones ( n = 3 embryos). d Representative crystal violet staining of CFU-F colonies generated by the sorted populations as indicated in c . Magnified images of the boxed areas were shown on the right. Scale bars, 25 mum. e Quantifications of the number (left) and mean diameter (right) of the CFU-F colonies ( n = 3 embryos). The statistical significance of differences was determined using one-way ANOVA with multiple comparison tests (LSD). * P < 0.05; ** P < 0.01; *** P < 0.001. Error bars indic
- Conjugate
- Yellow dye
- Submitted by
- Invitrogen Antibodies (provider)
- Main image
- Experimental details
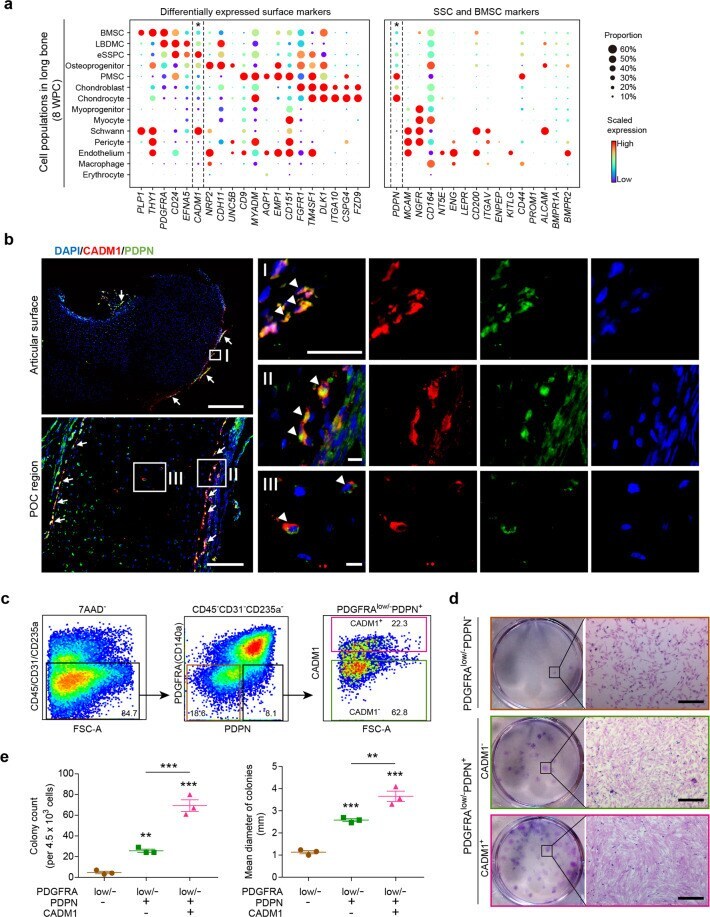
- Fig. 5 Functional characterizations of eSSPCs in vitro and in vivo. a Flow cytometry plots showing the maintenance of phenotypic eSSPCs after serially passaging clonally expanded PDGFRA low/- PDPN + CADM1 + cells ( n = 3 clones). b Representative oil red O (top), alizarin red (middle) and toluidine blue (bottom) staining after adipogenic, osteogenic and chondrogenic differentiation of clonally expanded eSSPCs (PDGFRA low/- PDPN + CADM1 + ). Magnified images of the boxed areas were shown on the right. Scale bars, 200 mum. c qPCR analyses of adipogenic, osteogenic and chondrogenic marker genes in clonally expanded eSSPCs before and after trilineage differentiation in vitro ( n = 3 clones). The statistical significance of differences was determined using Wilcoxon signed rank test. * P < 0.05; ** P < 0.01. Error bars indicated SEM. d Renal subcapsular transplantation. The work flow for functional characterization of eSSPC in vivo (top). Subcapsular xenografts were dissected and sectioned 8 weeks after transplantation of culture expanded eSSPCs into immunodeficient mice. Bright field (middle), Movat pentachrome staining (bottom left; cartilage, blue; bone and fibrous tissue, yellow) and immunofluorescent staining images (bottom right; DAPI, blue; collagen I (COL1), red; collagen II (COL2), green) were shown ( n = 9 grafts from three embryos). Scale bars, 50 mum.
- Conjugate
- Yellow dye
- Submitted by
- Invitrogen Antibodies (provider)
- Main image
- Experimental details
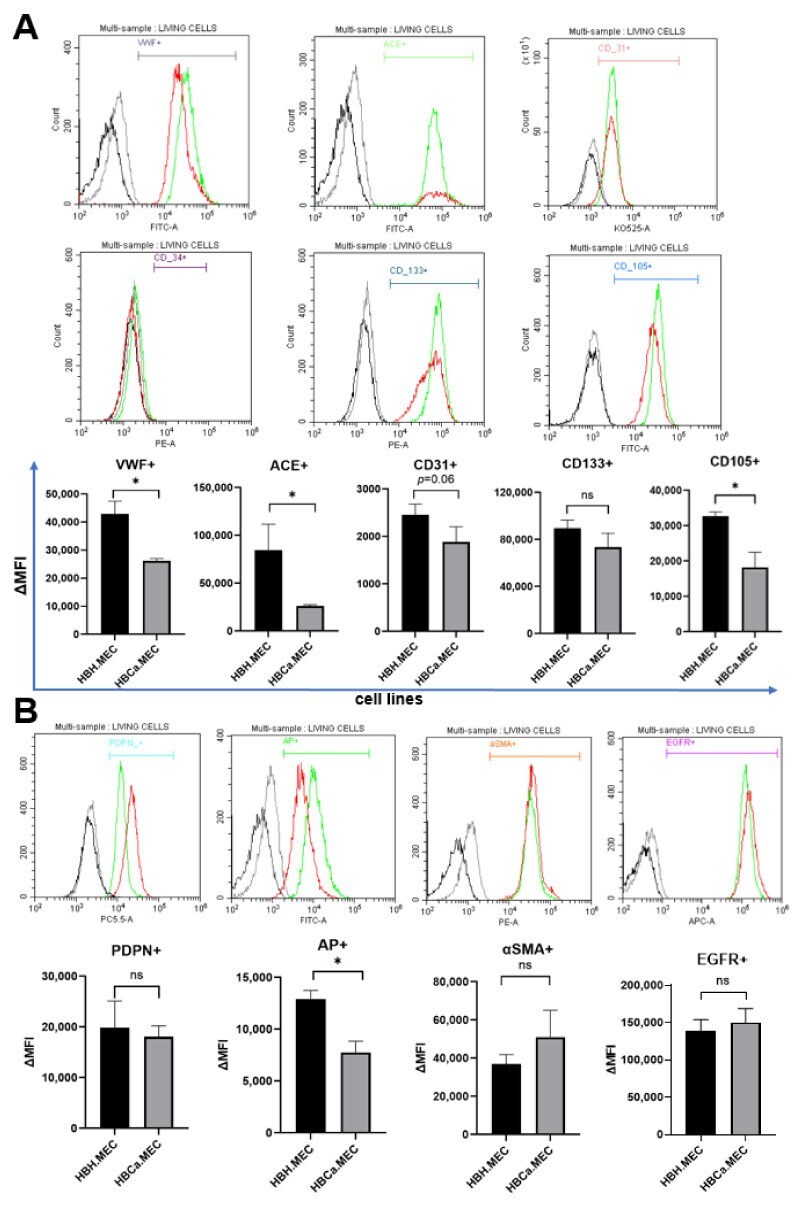
- Figure 2 Characterization of ECs by flow cytometry markers. The cells were stained for the following markers: VWF, ACE, CD31, CD34, CD133, CD105, PDPN, AP, alphaSMA, EGFR. Data were recorded for 10,000 events using CellQuest software (v.2.3.0.84) and presented as histogram overlays. ( A ) The most characteristic markers for ECs and EPCs. ( B ) Markers associated with cancerous phenotype. Histogram overlays display representative repetitions; gray--healthy ECs unstained, black--tumor ECs unstained, green--healthy ECs stained, red--tumor ECs stained. Y axis = the number of events; X axis = fluorescence intensity; the bar charts present delta MFI. Ns--not significant; * p < 0.05 in Student t test vs. HBH.MEC. Data are reported as the means +- SEM (n = 3).
- Conjugate
- Yellow dye
- Submitted by
- Invitrogen Antibodies (provider)
- Main image
- Experimental details
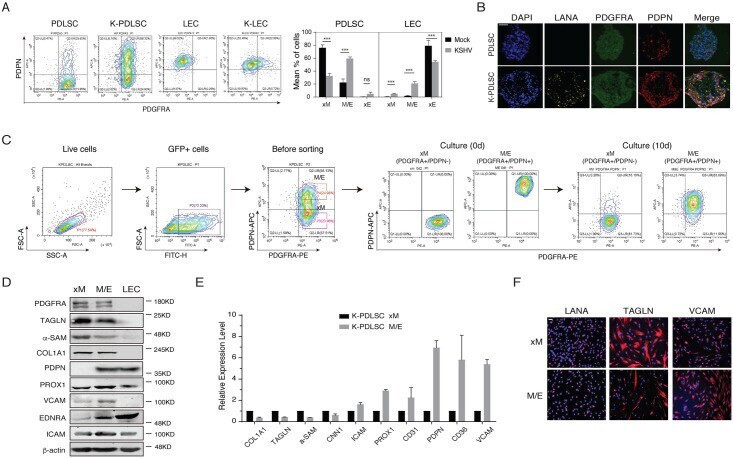
- 10.1371/journal.ppat.1009600.g005 Fig 5 Characterization of KSHV-infected PDLSCs of distinct states in the mesenchymal-to-endothelial differentiation spectrum. (A) Mock- and KSHV-infected PDLSCs and LECs were examined for PDGFRA and PDPN expression profile by flow cytometry analysis. Three subpopulations (xM, hybrid M/E, and xE) were quantified based on the PDGFRA and PDPN profiles ( n = 3 independent experiments). Statistical analyses were performed using two-tailed Student's test and P-values were calculated by GraphPad Prism. *p < 0.05, **p < 0.01, ***p < 0.001. ( B) PDGFRA and PDPN expression in PDLSC and K-PDLSC spheroids at 4 days post-infection were analyzed by IFA. Scale bar, 50 mum. ( C) K-PDLSCs were stained for PDGFRA and PDPN and sorted by flow cytometry. The purified xM and M/E populations were cultured for 10 days and their PDGFRA/PDPN profiles were examined for their phenotypic plasticity. ( D) Western blot analysis of xM, M/E, and LECs for their mesenchymal and endothelial markers. ( E) The expression profiles of mesenchymal and endothelial markers in hybrid M/E and xM state cells were analyzed at the mRNA level by RT-qPCR. ( F) IFA analysis of LANA, TAGLN, and VCAM in xM and M/E state cells. Scale bar, 50 mum.
- Conjugate
- Yellow dye
- Submitted by
- Invitrogen Antibodies (provider)
- Main image
- Experimental details
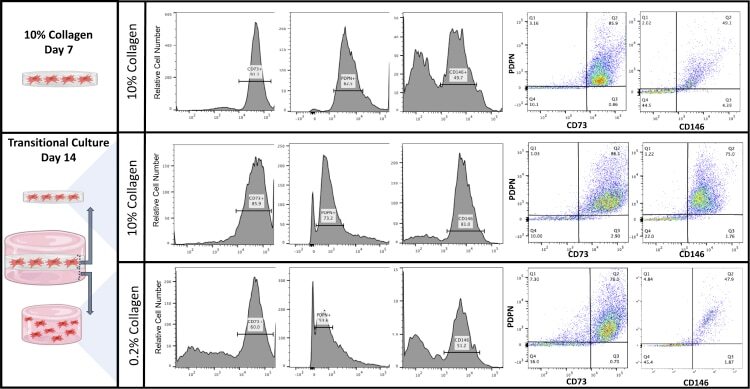
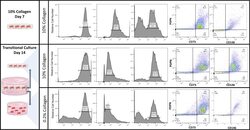
- Cell surface analysis of AMSCs within the transitional culture AMSCs were cultured in a 10% collagen type I gel for 7 days and embedded in a 0.2% collagen type I gel, making up the transitional culture for an additional 14 days. Flow cytometric analysis was conducted for PDPN, CD73, and CD146 (representative data presented).
- Conjugate
- Yellow dye