Explore
 Validate
 Learn
Learn Western blot
 Other assay
Antibody data
- Antibody Data
- Antigen structure
- References [1]
- Comments [0]
- Validations
- Other assay [1]
Submit
Validation data
Reference
Comment
Report error
- Product number
- PA5-82301 - Provider product page

- Provider
- Invitrogen Antibodies
- Product name
- Podoplanin Polyclonal Antibody
- Antibody type
- Polyclonal
- Antigen
- Recombinant full-length protein
- Description
- Immunogen sequence: RLPRVWEARA PSLSGAPAPT PPAPPPSRSS RLGLWPRCFL IFPQLRILLL GPQESNNSTG TMWKVSALLF VLGSASLWVL AEGASTGQPE DDTETTGLEG GVAMPGAEDD VVTPGTSEDR YKSGLTTLVA TSVNS
- Reactivity
- Human
- Host
- Rabbit
- Isotype
- IgG
- Vial size
- 100 µL
- Concentration
- 0.1 mg/mL
- Storage
- Store at 4°C short term. For long term storage, store at -20°C, avoiding freeze/thaw cycles.
Submitted references Diesel Particulate Matter 2.5 Induces Epithelial-to-Mesenchymal Transition and Upregulation of SARS-CoV-2 Receptor during Human Pluripotent Stem Cell-Derived Alveolar Organoid Development.
Kim JH, Kim J, Kim WJ, Choi YH, Yang SR, Hong SH
International journal of environmental research and public health 2020 Nov 13;17(22)
International journal of environmental research and public health 2020 Nov 13;17(22)
No comments: Submit comment
Supportive validation
- Submitted by
- Invitrogen Antibodies (provider)
- Main image
- Experimental details
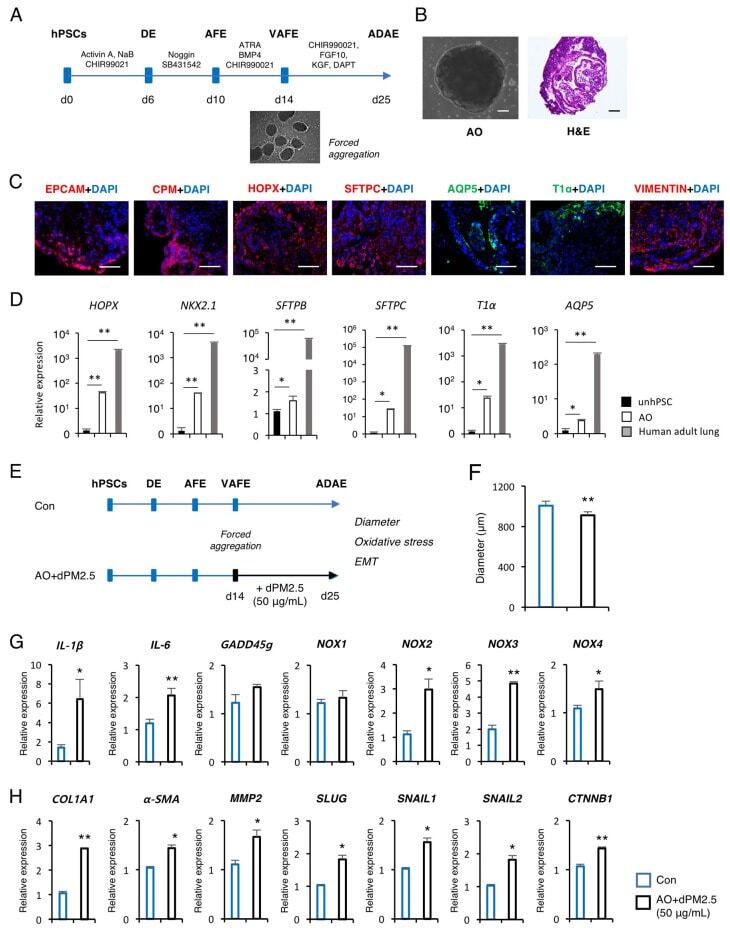
- Figure 4 Effects of dPM2.5 exposure during hPSC-derived alveolar organoid (AO) development. ( A ) Schematic diagram of AO generation from hPSCs. ( B ) Representative bright field and H&E staining images of AOs. Scale bars, 100 mum. ( C ) Immunofluorescence staining for AEP (EPCAM, CPM, and HOPX, red), AEC1 (AQP5 and T1 alpha , green), AEC2 (SFTPC, red) and mesenchymal stromal cell (VIMENTIN, red) markers in AOs on day 25 of induction. Nuclei were counterstained with 4',6-diamidino-2-phenylindole (DAPI) (blue). Scale bars, 100 mum. ( D ) qPCR analysis of the indicated AEP and AEC markers in AOs. Data are shown as fold-change relative to undifferentiated hPSCs (unhPSC). Data is presented as mean +- SD. * p < 0.05, ** p < 0.01. ( E ) Schematic diagram of dPM2.5 treatment during hPSC-derived AO development. Black lines indicate the duration of dPM2.5 treatment. Scale bars, 100 mum. ( F ) Measurement of AO size was taken by averaging the longest and shortest diameter of AOs. ( G , H ) Transcript levels of inflammation, fibrosis, and EMT-related genes were measured using qPCR. Data is presented as mean +- SD. * p < 0.05, ** p < 0.01 (vs. Control).