Explore
 Validate
 Learn
Learn Western blot
 ELISA
ELISA Immunocytochemistry
Antibody data
- Antibody Data
- Antigen structure
- References [17]
- Comments [0]
- Validations
- Immunocytochemistry [5]
- Immunohistochemistry [1]
- Flow cytometry [3]
- Other assay [14]
Submit
Validation data
Reference
Comment
Report error
- Product number
- MA5-15886 - Provider product page

- Provider
- Invitrogen Antibodies
- Product name
- MMP9 Monoclonal Antibody (5G3)
- Antibody type
- Monoclonal
- Antigen
- Purifed from natural sources
- Description
- MA5-15886 targets MMP9 in indirect ELISA, FACS, IF, IHC, and WB applications and shows reactivity with Human samples. The MA5-15886 immunogen is purified recombinant fragment of human MMP9 expressed in E. Coli. . MA5-15886 detects MMP9 which has a predicted molecular weight of approximately 92kDa.
- Reactivity
- Human, Mouse
- Host
- Mouse
- Isotype
- IgG
- Antibody clone number
- 5G3
- Vial size
- 100 μL
- Concentration
- Conc. Not Determined
- Storage
- Store at 4°C short term. For long term storage, store at -20°C, avoiding freeze/thaw cycles.
Submitted references Methamphetamine induces transcriptional changes in cultured HIV-infected mature monocytes that may contribute to HIV neuropathogenesis.
EIF5A2 Is Involved in the Biological Process of Cervical Cancer Cells through AGR2.
TGF-β1/SH2B3 axis regulates anoikis resistance and EMT of lung cancer cells by modulating JAK2/STAT3 and SHP2/Grb2 signaling pathways.
Hsa_circ_0134111 promotes intervertebral disc degeneration via sponging miR-578.
Ozone combined with doxorubicin exerts cytotoxic and anticancer effects on Luminal-A subtype human breast cancer cell line.
MUC 15 Promotes Osteosarcoma Cell Proliferation, Migration and Invasion through Livin, MMP-2/MMP-9 and Wnt/β-Catenin Signal Pathway.
GYY4137 Regulates Extracellular Matrix Turnover in the Diabetic Kidney by Modulating Retinoid X Receptor Signaling.
Identification of circ_0058357 as a regulator in non-small cell lung cancer cells resistant to cisplatin by miR-361-3p/ABCC1 axis.
Exogenous hydrogen sulfide and miR-21 antagonism attenuates macrophage-mediated inflammation in ischemia reperfusion injury of the aged kidney.
Testicular orphan receptor 4 (TR4) promotes papillary thyroid cancer invasion via activating circ-FNLA/miR-149-5p/MMP9 signaling.
Adiponectin and Leptin Exert Antagonizing Effects on HUVEC Tube Formation and Migration Modulating the Expression of CXCL1, VEGF, MMP-2 and MMP-9.
Sevoflurane inhibits the proliferation and invasion of hepatocellular carcinoma cells through regulating the PTEN/Akt/GSK‑3β/β‑catenin signaling pathway by downregulating miR‑25‑3p.
miR-939-3p promotes epithelial-mesenchymal transition and may be used as a prognostic marker in hepatocellular carcinoma.
Hydrogen sulphide mitigates homocysteine-induced apoptosis and matrix remodelling in mesangial cells through Akt/FOXO1 signalling cascade.
MMP-2 and MMP-9 as prognostic markers for the early detection of urinary bladder cancer.
Characterization of metastatic tumor antigen 1 and its interaction with hepatitis B virus X protein in NF-κB signaling and tumor progression in a woodchuck hepatocellular carcinoma model.
An essential role of syntaxin 3 protein for granule exocytosis and secretion of IL-1α, IL-1β, IL-12b, and CCL4 from differentiated HL-60 cells.
Chilunda V, Weiselberg J, Martinez-Meza S, Mhamilawa LE, Cheney L, Berman JW
Frontiers in immunology 2022;13:952183
Frontiers in immunology 2022;13:952183
EIF5A2 Is Involved in the Biological Process of Cervical Cancer Cells through AGR2.
Shen X, Li L, He Y, Lv X, Ma J
Pharmacology 2022;107(7-8):376-385
Pharmacology 2022;107(7-8):376-385
TGF-β1/SH2B3 axis regulates anoikis resistance and EMT of lung cancer cells by modulating JAK2/STAT3 and SHP2/Grb2 signaling pathways.
Wang LN, Zhang ZT, Wang L, Wei HX, Zhang T, Zhang LM, Lin H, Zhang H, Wang SQ
Cell death & disease 2022 May 19;13(5):472
Cell death & disease 2022 May 19;13(5):472
Hsa_circ_0134111 promotes intervertebral disc degeneration via sponging miR-578.
Yan P, Sun C, Luan L, Han J, Qu Y, Zhou C, Xu D
Cell death discovery 2022 Feb 8;8(1):55
Cell death discovery 2022 Feb 8;8(1):55
Ozone combined with doxorubicin exerts cytotoxic and anticancer effects on Luminal-A subtype human breast cancer cell line.
Karagulle OO, Yurttas AG
Revista da Associacao Medica Brasileira (1992) 2022 Apr;68(4):507-513
Revista da Associacao Medica Brasileira (1992) 2022 Apr;68(4):507-513
MUC 15 Promotes Osteosarcoma Cell Proliferation, Migration and Invasion through Livin, MMP-2/MMP-9 and Wnt/β-Catenin Signal Pathway.
Chen T, Chen Z, Lian X, Wu W, Chu L, Zhang S, Wang L
Journal of Cancer 2021;12(2):467-473
Journal of Cancer 2021;12(2):467-473
GYY4137 Regulates Extracellular Matrix Turnover in the Diabetic Kidney by Modulating Retinoid X Receptor Signaling.
Juin SK, Pushpakumar S, Sen U
Biomolecules 2021 Oct 7;11(10)
Biomolecules 2021 Oct 7;11(10)
Identification of circ_0058357 as a regulator in non-small cell lung cancer cells resistant to cisplatin by miR-361-3p/ABCC1 axis.
Chu D, Li P, Li Y, Shi J, Huang S, Jiao P
Thoracic cancer 2021 Nov;12(21):2894-2906
Thoracic cancer 2021 Nov;12(21):2894-2906
Exogenous hydrogen sulfide and miR-21 antagonism attenuates macrophage-mediated inflammation in ischemia reperfusion injury of the aged kidney.
Pushpakumar S, Kundu S, Weber G, Sen U
GeroScience 2021 Jun;43(3):1349-1367
GeroScience 2021 Jun;43(3):1349-1367
Testicular orphan receptor 4 (TR4) promotes papillary thyroid cancer invasion via activating circ-FNLA/miR-149-5p/MMP9 signaling.
Ouyang X, Feng L, Yao L, Xiao Y, Hu X, Zhang G, Liu G, Wang Z
Molecular therapy. Nucleic acids 2021 Jun 4;24:755-767
Molecular therapy. Nucleic acids 2021 Jun 4;24:755-767
Adiponectin and Leptin Exert Antagonizing Effects on HUVEC Tube Formation and Migration Modulating the Expression of CXCL1, VEGF, MMP-2 and MMP-9.
Nigro E, Mallardo M, Polito R, Scialò F, Bianco A, Daniele A
International journal of molecular sciences 2021 Jul 13;22(14)
International journal of molecular sciences 2021 Jul 13;22(14)
Sevoflurane inhibits the proliferation and invasion of hepatocellular carcinoma cells through regulating the PTEN/Akt/GSK‑3β/β‑catenin signaling pathway by downregulating miR‑25‑3p.
Cao Y, Lv W, Ding W, Li J
International journal of molecular medicine 2020 Jul;46(1):97-106
International journal of molecular medicine 2020 Jul;46(1):97-106
miR-939-3p promotes epithelial-mesenchymal transition and may be used as a prognostic marker in hepatocellular carcinoma.
Chen F, Ni X, Chen L, Wang X, Xu J
Oncology letters 2020 Apr;19(4):2727-2732
Oncology letters 2020 Apr;19(4):2727-2732
Hydrogen sulphide mitigates homocysteine-induced apoptosis and matrix remodelling in mesangial cells through Akt/FOXO1 signalling cascade.
Majumder S, Ren L, Pushpakumar S, Sen U
Cellular signalling 2019 Sep;61:66-77
Cellular signalling 2019 Sep;61:66-77
MMP-2 and MMP-9 as prognostic markers for the early detection of urinary bladder cancer.
Fouad H, Salem H, Ellakwa DE, Abdel-Hamid M
Journal of biochemical and molecular toxicology 2019 Apr;33(4):e22275
Journal of biochemical and molecular toxicology 2019 Apr;33(4):e22275
Characterization of metastatic tumor antigen 1 and its interaction with hepatitis B virus X protein in NF-κB signaling and tumor progression in a woodchuck hepatocellular carcinoma model.
Li YT, Liu CJ, Su TH, Cheng HR, Jeng YM, Lin HL, Wang CC, Kao JH, Chen PJ, Chen DS, Wu HL
Oncotarget 2016 Jul 26;7(30):47173-47185
Oncotarget 2016 Jul 26;7(30):47173-47185
An essential role of syntaxin 3 protein for granule exocytosis and secretion of IL-1α, IL-1β, IL-12b, and CCL4 from differentiated HL-60 cells.
Naegelen I, Plançon S, Nicot N, Kaoma T, Muller A, Vallar L, Tschirhart EJ, Bréchard S
Journal of leukocyte biology 2015 Mar;97(3):557-71
Journal of leukocyte biology 2015 Mar;97(3):557-71
No comments: Submit comment
Supportive validation
- Submitted by
- Invitrogen Antibodies (provider)
- Main image
- Experimental details
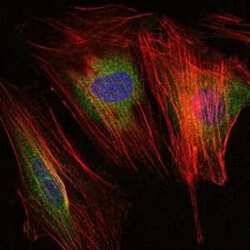
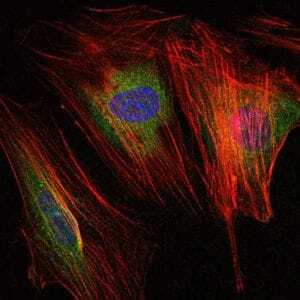
- Immunofluorescence analysis of NIH/3T3 cells using MMP9 monoclonal antibody (Product # MA5-15886) (Green). Blue: DRAQ5 fluorescent DNA dye. Red: actin filaments have been labeled with phalloidin.

- Submitted by
- Invitrogen Antibodies (provider)
- Main image
- Experimental details
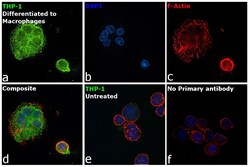
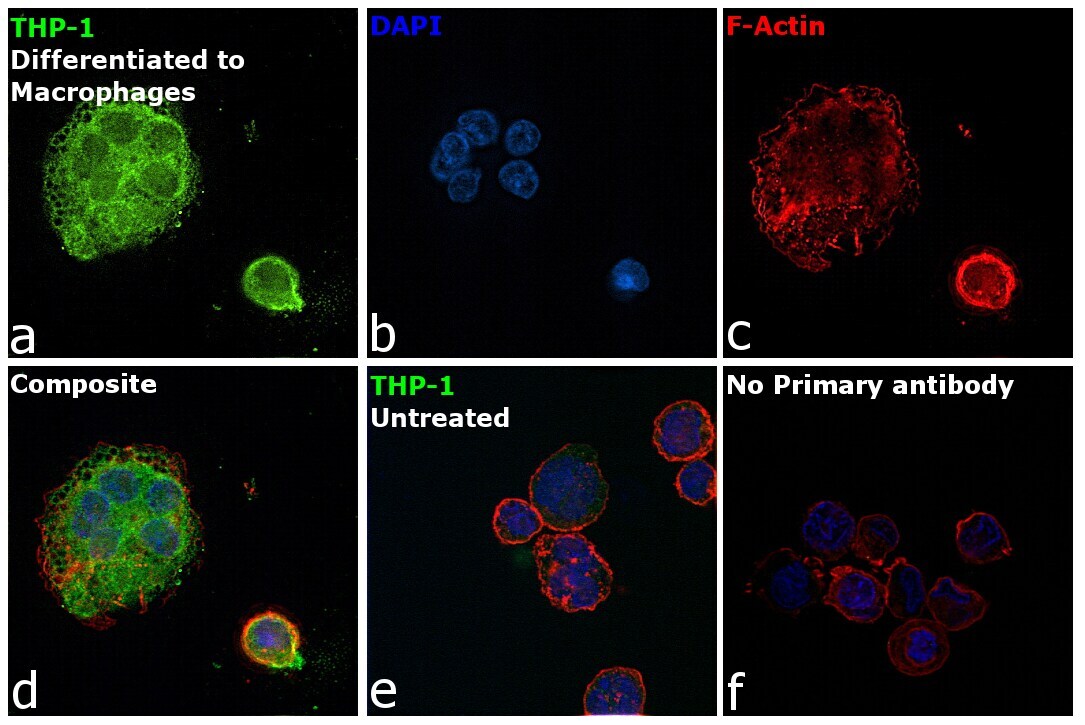
- Immunofluorescence analysis of Matrix metalloproteinase-9 was performed using 70% confluent log phase THP-1 cells differentiated to Macrophages using PMA (100nM 48 hours). The cells were fixed with 4% paraformaldehyde for 10 minutes, permeabilized with 0.1% Triton™ X-100 for 15 minutes, and blocked with 2% BSA for 45 minutes at room temperature. The cells were labeled with MMP9 Monoclonal Antibody (5G3) (Product # MA5-15886) at 1:500 dilution in 0.1% BSA, incubated at 4 degree celsius overnight and then labeled with Goat anti-Mouse IgG (H+L) Highly Cross-Adsorbed Secondary Antibody, Alexa Fluor Plus 488 (Product # A32723), (1:2000 dilution), for 45 minutes at room temperature (Panel a: Green). Nuclei (Panel b: Blue) were stained with ProLong™ Diamond Antifade Mountant with DAPI (Product # P36962). F-actin (Panel c: Red) was stained with Rhodamine Phalloidin (Product # R415, 1:300 dilution). Panel d represents the merged image showing cytoplasmic localization. Panel e represents undifferentiated THP-1 cells. Panel f represents control cells with no primary antibody to assess background. The images were captured at 60X magnification.
- Submitted by
- Invitrogen Antibodies (provider)
- Main image

- Experimental details
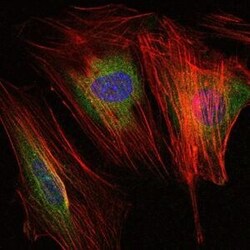
- Immunofluorescence analysis of NIH/3T3 cells using MMP9 monoclonal antibody (Product # MA5-15886) (Green). Blue: DRAQ5 fluorescent DNA dye. Red: actin filaments have been labeled with phalloidin.
- Submitted by
- Invitrogen Antibodies (provider)
- Main image
- Experimental details
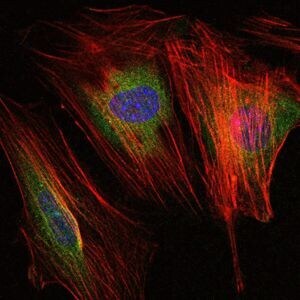
- Immunofluorescence analysis of NIH/3T3 cells using MMP9 monoclonal antibody (Product # MA5-15886) (Green). Blue: DRAQ5 fluorescent DNA dye. Red: actin filaments have been labeled with phalloidin.
- Submitted by
- Invitrogen Antibodies (provider)
- Main image

- Experimental details
- Immunofluorescence analysis of Matrix metalloproteinase-9 was performed using 70% confluent log phase THP-1 cells differentiated to Macrophages using PMA (100nM 48 hours). The cells were fixed with 4% paraformaldehyde for 10 minutes, permeabilized with 0.1% Triton™ X-100 for 15 minutes, and blocked with 2% BSA for 45 minutes at room temperature. The cells were labeled with MMP9 Monoclonal Antibody (5G3) (Product # MA5-15886) at 1:500 dilution in 0.1% BSA, incubated at 4 degree celsius overnight and then labeled with Goat anti-Mouse IgG (H+L) Highly Cross-Adsorbed Secondary Antibody, Alexa Fluor Plus 488 (Product # A32723), (1:2000 dilution), for 45 minutes at room temperature (Panel a: Green). Nuclei (Panel b: Blue) were stained with ProLong™ Diamond Antifade Mountant with DAPI (Product # P36962). F-actin (Panel c: Red) was stained with Rhodamine Phalloidin (Product # R415, 1:300 dilution). Panel d represents the merged image showing cytoplasmic localization. Panel e represents undifferentiated THP-1 cells. Panel f represents control cells with no primary antibody to assess background. The images were captured at 60X magnification.

Supportive validation
- Submitted by
- Invitrogen Antibodies (provider)
- Main image
- Experimental details
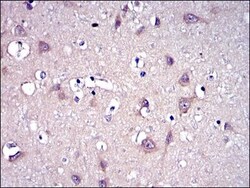
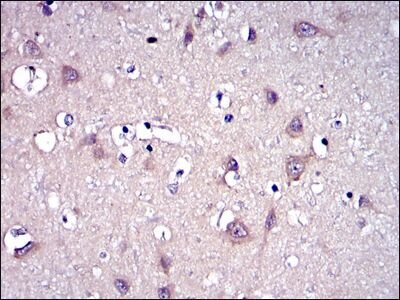
- Immunohistochemical analysis of paraffin-embedded brain tissues using MMP9 monoclonal antibody (Product # MA5-15886) followed with DAB staining.
Supportive validation
- Submitted by
- Invitrogen Antibodies (provider)
- Main image

- Experimental details
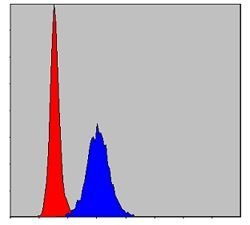
- Flow cytometric analysis of HeLa cells using MMP9 monoclonal antibody (Product # MA5-15886) (blue) and negative control (red).
- Submitted by
- Invitrogen Antibodies (provider)
- Main image

- Experimental details
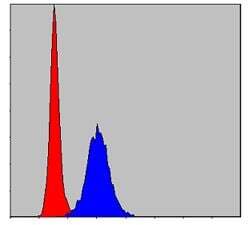
- Flow cytometric analysis of HeLa cells using MMP9 monoclonal antibody (Product # MA5-15886) (blue) and negative control (red).

- Submitted by
- Invitrogen Antibodies (provider)
- Main image

- Experimental details
- Flow cytometric analysis of HeLa cells using MMP9 monoclonal antibody (Product # MA5-15886) (blue) and negative control (red).
Supportive validation
- Submitted by
- Invitrogen Antibodies (provider)
- Main image
- Experimental details
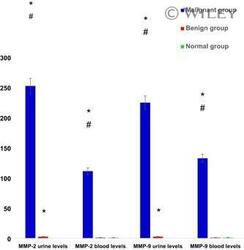
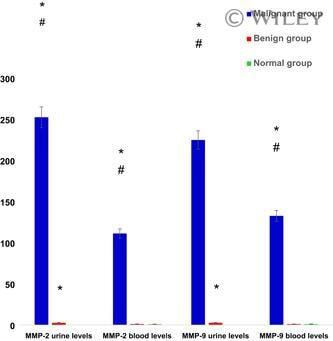
- 1 Blood and urinary protein levels of MMP-2 and MMP-9 in groups of the study by Western blot. *Significant P versus control group, # significant P versus benign bladder disorders group. Y axis represents a ratio between each target gene expression and housekeeping gene expression. MMP, matrix metalloproteinase
- Submitted by
- Invitrogen Antibodies (provider)
- Main image
- Experimental details
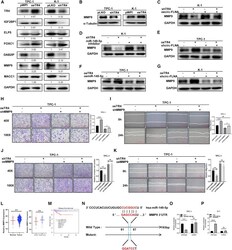
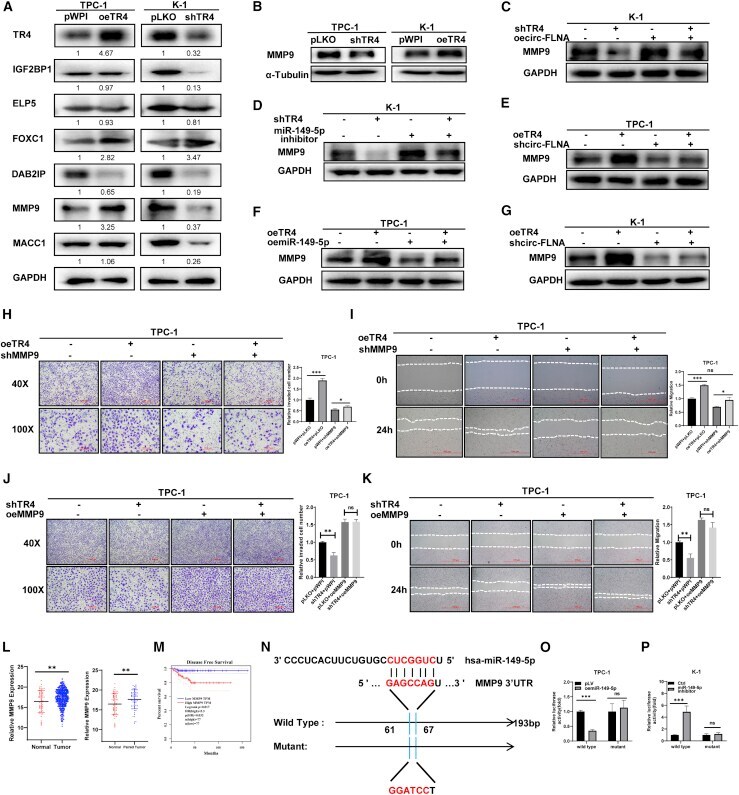
- Figure 5 MMP9 is the downstream effector controlling TR4/circ-FLNA/miR-149-5p-induced cell invasion/migration of PTC cells (A) Several genes as predicated as miR-149-5p were detected by western blotting before and after TR4 manipulation in K-1 cells and TPC-1 cells. GAPDH was served as internal control. (B) Western blot assay was used to check MMP9 expression after shTR4 in TPC-1 cells or oeTR4 in K-1 cells. alpha-tubulin was served as internal control. (C and D) oecirc-FLNA (C) or inhibition of miR-149-5p (D) could block shTR4-reduced MMP9 expression in K-1 cells by western blotting analysis. GAPDH was loading control. (E and F) Knockdown of circ-FLNA (E) or miR-149-5p (F) attenuated TR4-induced MMP9 expression in TPC-1 cells by western blotting analysis. GAPDH was internal control. (G) Western blot assay was used to check MMP9 expression after oeTR4/shcirc-FLNA in K-1 cells. GAPDH was internal control. (H and I) TR4-induced cell invasion (H) and cell migration (I) of TPC-1 cells were attenuated when MMP9 was knocked down. Transwell invasion assay/wound-healing migration assay was used to check invasion/migration capacity after oeTR4/shMMP9 in TPC-1 cells. Left, representative invasion/migration images of TPC-1 cells; right, quantification of invading or migrating TPC-1 cells. (J and K) shTR4-reduced cell invasion (J) and cell migration (K) of TPC-1 cells were attenuated when MMP9 was overexpressed. Transwell invasion assay/wound-healing migration assay was used to check inv
- Submitted by
- Invitrogen Antibodies (provider)
- Main image

- Experimental details
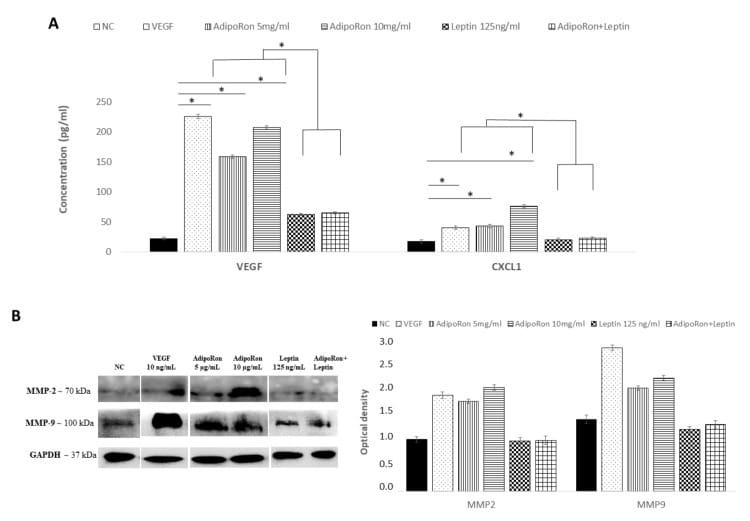
- Figure 5 AdipoRon and leptin exert antagonizing effects on HIF-1alpha, CXCL1, VEGF-A, MMP-2 and MMP-9 protein levels. ( A ) Elisa assay of CXCL1 and VEGF-A; ( B ) representative images of immunoblotting of total MMP-2 and MMP-9 proteins and their quantitation. HUVEC endothelial cells were treated with AdipoRon (5 or 10 mug/mL), Leptin (125 ng/mL) and a combination of AdipoRon+leptin (5 mug/mL and 125 ng/mL, respectively) for 24 h. Untreated cells were used as negative control (NC); VEGF (10 ng/mL) was used as a positive control. Data are reported as mean +- Standard Deviation (SD) of three independent experiments were reported. * p < 0.05.
- Submitted by
- Invitrogen Antibodies (provider)
- Main image
- Experimental details
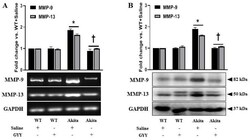
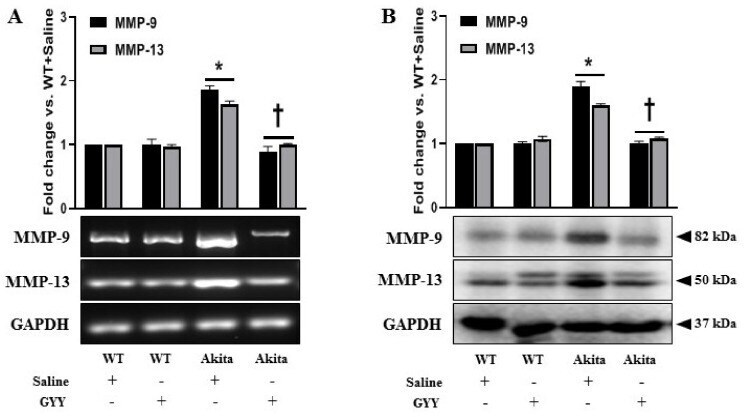
- Figure 5 Elevated expressions of MMP-9 and MMP-13 were alleviated by GYY treatment in diabetic kidney. ( A ) Saline- or GYY-treated kidneys from WT and Akita mice were collected in Trizol for total RNA extraction, and semi-quantitative RT-PCR analyses were performed for MMP-9 and MMP-13 gene expression. ( B ) Protein was extracted from the saline- or GYY-treated kidneys from WT and Akita mice and analyzed for the expression of MMP-9 and MMP-13 by Western blot. GAPDH was used as a loading control for all RT-PCR and immunoblot analyses. The bar graphs represent the mean fold change +- SD vs. WT + Saline. n = 6/group, * p < 0.05 vs. WT + Saline, + p < 0.05 vs. Akita + Saline.
- Submitted by
- Invitrogen Antibodies (provider)
- Main image
- Experimental details
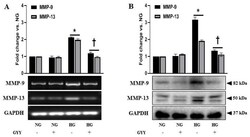
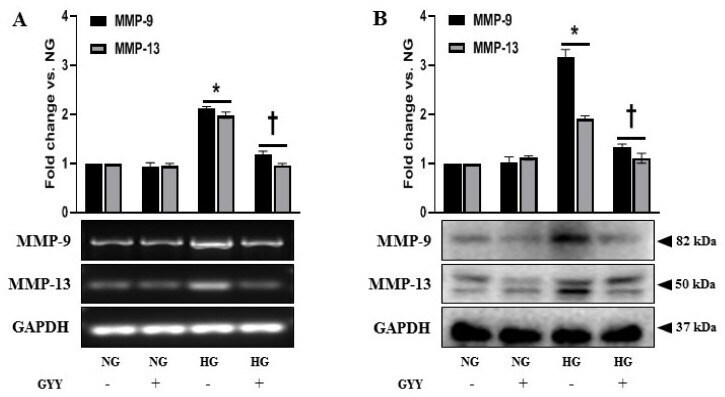
- Figure 6 Elevated expressions of MMP-9 and MMP-13 were alleviated by GYY treatment in MCs under HG condition. ( A ) Untreated or GYY-treated mouse MCs in NG or HG condition were collected in Trizol for total RNA extraction, and semi-quantitative RT-PCR analyses were performed for MMP-9 and MMP-13 gene expression. ( B ) Protein was extracted from the untreated or GYY-treated mouse MCs in NG or HG condition and analyzed for the expression of MMP-9 and MMP-13 by Western blot. GAPDH was used as a loading control for all RT-PCR and immunoblot analyses. The bar graphs represent the mean fold change +- SD vs. NG. n = 3 independent experiments, * p < 0.05 vs. NG, + p < 0.05 vs. HG.
- Submitted by
- Invitrogen Antibodies (provider)
- Main image
- Experimental details
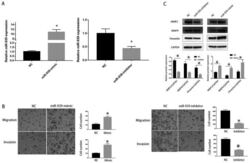
- Figure 2. miR-939-3p promotes invasion and EMT in a HCC cell line. (A) Transfection efficiency of miR-939-3p mimic and inhibitor was detected by reverse transcription quantitative PCR. *P

- Submitted by
- Invitrogen Antibodies (provider)
- Main image
- Experimental details
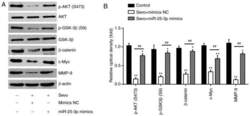
- Figure 5 Sevo blocks the PTEN/Akt/GSK-3beta/beta-catenin signaling pathway by modulating the expression of miR-25-3p in HCC cells. HCCLM3 and Huh7 cells were transfected with miR-25-3p mimics or miR-25-3p inhibitor for 24 h followed by Sevo treatment for 6 h. (A) Protein levels of p-Akt, Akt, p-GSK-3beta, GSK-3beta, beta-catenin, c-Myc and MMP9 were measured using western blotting. beta-actin served as the loading control. (B) The bands were semi quantitatively analyzed using ImageJ and normalized to beta-actin density. Data are presented as the mean +- standard deviation. (n=3) of three representative experiments. * P

- Submitted by
- Invitrogen Antibodies (provider)
- Main image
- Experimental details
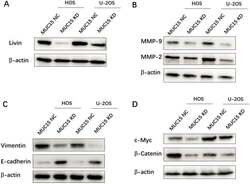
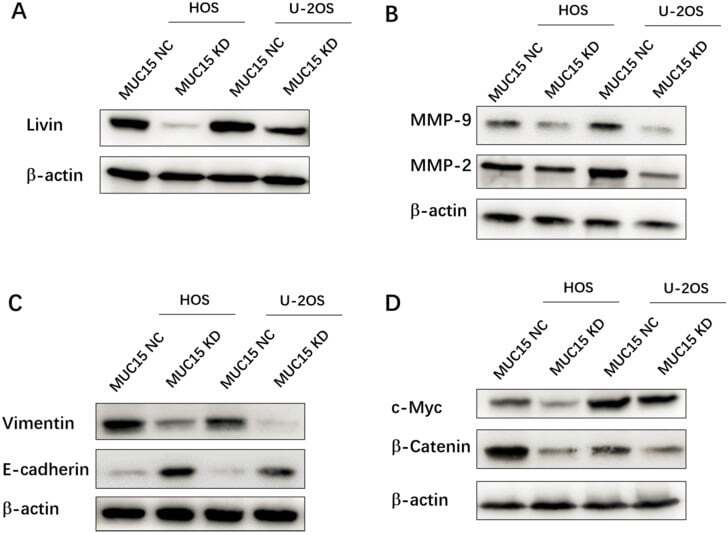
- Figure 3 Mechanisms of MUC15 on osteosarcoma proliferation, migration and invasion. Western blot detected the apoptosis-inhibiting protein Livin ( A ), the migration-related proteins MMP-9 /MMP-2 ( B ), EMT related proteins ( C ) and the Wnt/b-Catenin signaling pathway of OS cell ( D ).
- Submitted by
- Invitrogen Antibodies (provider)
- Main image
- Experimental details
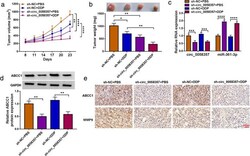
- FIGURE 8 Inhibition of circ_0058357 represses tumor growth and sensitizes A549/DDP cells to DDP in vivo. (a)-(e) A549/DDP cells infected with sh-circ_0058357 or sh-NC were injected (4 x 10 6 cells each mouse) subcutaneously into BALB/c nude mice. After eight days, DDP (30 mg/kg, every 3 days) or PBS administration and tumor volume measurement began. Each group included six mice. Twenty-three days later, tumors were collected. (a) Growth curve of the tumors. (b) Representative images and mean weight of the xenograft tumors. (c) qRT-PCR analysis of circ_0058357 and miR-361-3p levels in the tumors. (d) Western blot showing ABCC1 protein level in the excised tumors. (e) Immunohistochemistry of ABCC1 and MMP9 protein levels in the tumors. Scale bar: 100 mum. * p < 0.05, ** p < 0.01, *** p < 0.001, **** p < 0.0001

- Submitted by
- Invitrogen Antibodies (provider)
- Main image
- Experimental details
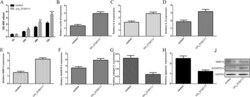
- Fig. 5 circ_0134111 overexpression induced proliferation, pro-inflammatory cytokine secretion, and ECM degradation in NP cells. A circ_0134111 overexpression promoted NP cell proliferation as shown by the CCK-8 assay. B Ectopic expression of circ_0134111 increased the cyclin D1 expression. C-F Overexpression of circ_0134111 induced C IL-6, D IL-8, E MMP-9, and F ADAMTS-5 expression as shown by qRT-PCR assay. G, H The expression of type II collagen and aggrecan was determined by qRT-PCR assay. Ectopic expression of circ_0134111 decreased G type II collagen and H aggrecan expression in NP cells. J The protein expression of MMP-9 and ADAMTS-5 was measured by western blots. * p < 0.05, ** p < 0.01, and *** p < 0.001.

- Submitted by
- Invitrogen Antibodies (provider)
- Main image
- Experimental details
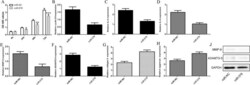
- Fig. 6 Ectopic expression of miR-578 inhibited proliferation, pro-inflammatory cytokine secretion, and ECM degradation in NP cells. A miR-578 overexpression inhibited NP cell proliferation as shown by the CCK-8 assay. B The expression of cyclin D1 was analyzed by using qRT-PCR and GAPDH was used as the internal control. C-F Overexpression of miR-578 suppressed C IL-6, D IL-8, E MMP-9, and F ADAMTS-5 expression as shown by qRT-PCR. G, H The expression of type II collagen and aggrecan was determined by qRT-PCR assay. Ectopic expression of circ_0134111 decreased G type II collagen and H aggrecan expression in NP cells. J The protein expression of MMP-9 and ADAMTS-5 was measured by western blots. * p < 0.05, ** p < 0.01, and *** p < 0.001.

- Submitted by
- Invitrogen Antibodies (provider)
- Main image
- Experimental details
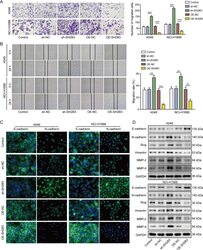
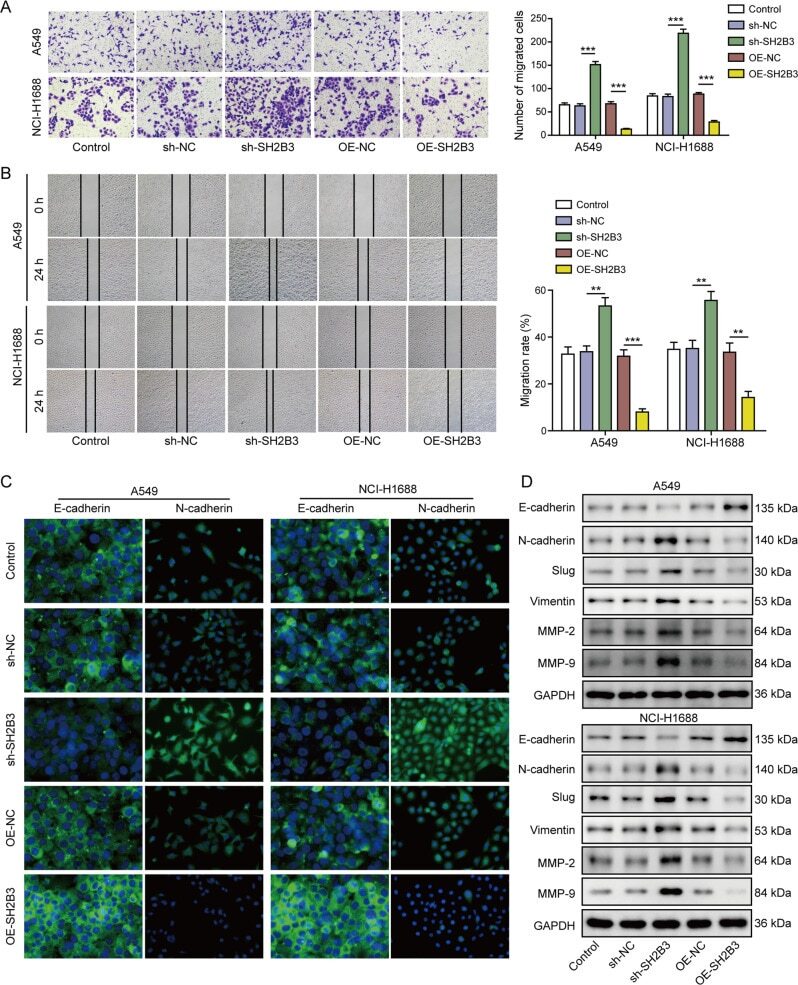
- Fig. 3 SH2B3 suppressed EMT and cell migration and invasion of lung cancer. A Transwell assay to measure invasion capacity of transfected cancer cells. B Scratch wound-healing assay to determine the migration ability of transfected cancer cells. C Immunostaining to test E-cadherin and N-cadherin protein levels in transfected cancer cells. D Western blotting to measure levels of EMT-related markers including E-cadherin, N-cadherin, slug, vimentin, MMP-2, and MMP-9 in transfected cancer cells. *** P < 0.001 and ** P < 0.01.
- Submitted by
- Invitrogen Antibodies (provider)
- Main image
- Experimental details
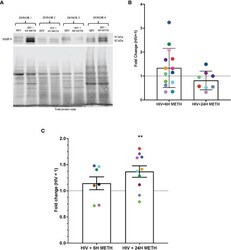
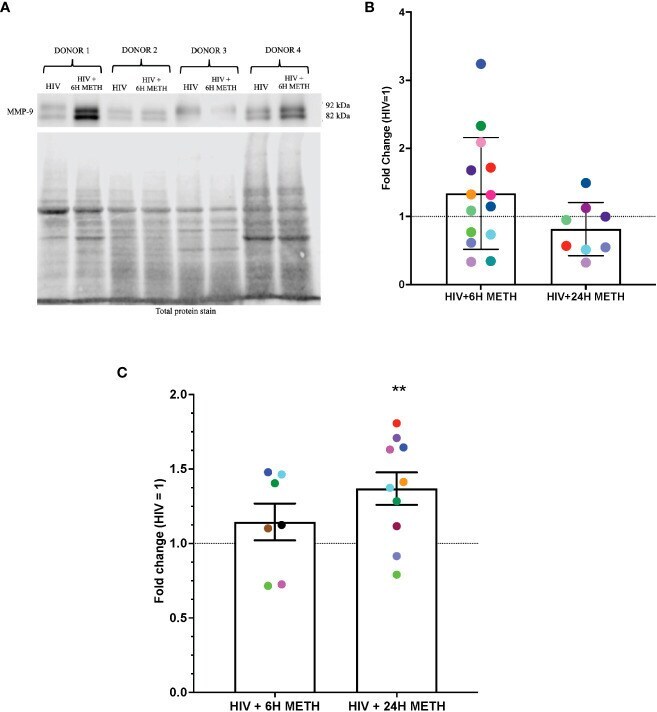
- Figure 4 MMP-9 protein is increased in HIV-infected mature monocytes treated with meth. (A) A representative western blot with corresponding total protein stain of HIV-infected mature monocytes either untreated or treated for 6 h with meth. (B) Fold change of normalized MMP-9 protein from HIV-infected mature monocytes treated with meth over untreated HIV-infected mature monocytes. Each colored dot represents an individual donor. The columns and error bars depict mean and standard deviation (SD), respectively. n=7-14. (C) Fold change of normalized MMP-9 protein in supernatants of HIV-infected mature monocytes treated with meth over untreated HIV-infected cells. Each colored dot represents an individual donor. The columns and error bars depict mean and standard error of the mean (SEM), respectively; n=7-10; **, p
- Submitted by
- Invitrogen Antibodies (provider)
- Main image
- Experimental details
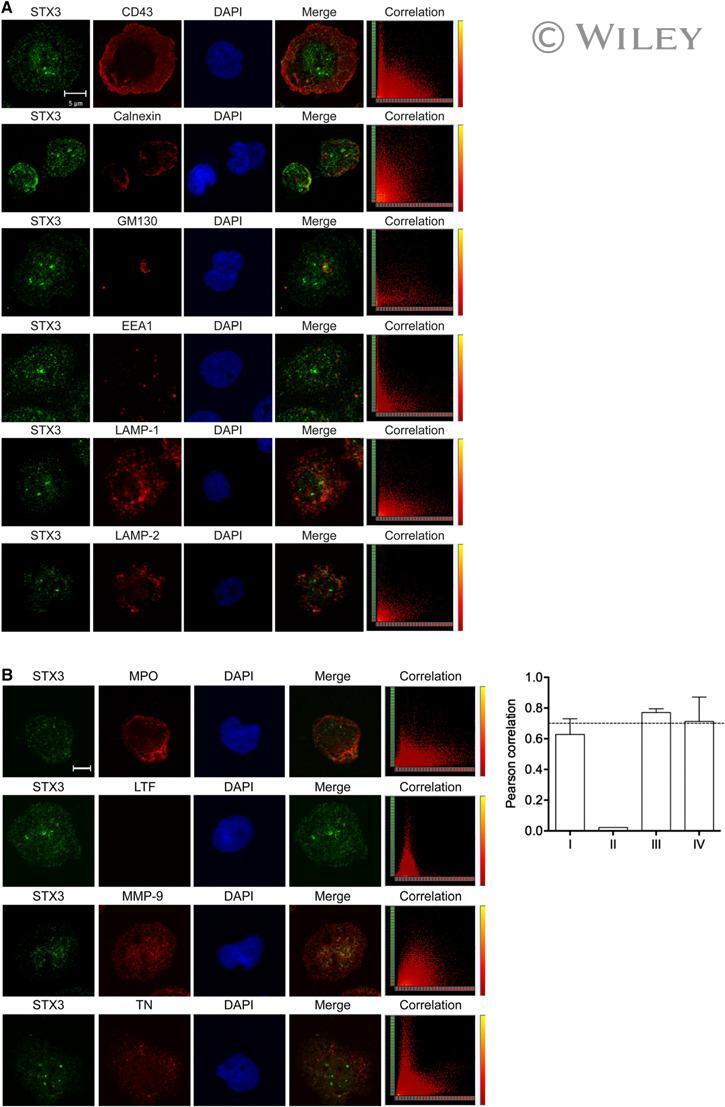
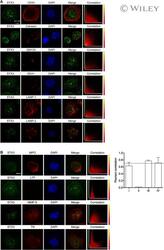
- 7 Intracellular STX3 localization in dHL-60 cells. Colocalization experiments by immunofluorescence staining were performed with STX3 (green); (A) CD43 for plasma membrane, CNX for endoplasmic reticulum, GM130 for Golgi, EEA1 for early endosomes, LAMP-1 and LAMP-2 for late endosomes/lysosomes, (B) MPO for azurophil granules, LTF for specific granules, MMP-9 for gelatinase granules, and TN for secretory vesicles (red); and DAPI for cell nucleus (blue). Original scale bars, 5 mu m. Merge confocal images only represent green and red channels to conclude for colocalization. Corresponding scatter plots of the paired intensities of the green ( y -axis for STX3 pixels) and red ( x -axis for CD43, CNX, GM130, EEA1, LAMP-1, LAMP-2, MPO, LTF, MMP-9, or TN pixels) channels are depicted in the right column for the entire overlay image. PCCs were calculated for both channels in deconvolved z -stack confocal images by AutoQuant X3. Values >=0.7 were considered strongly positive for colocalization. I, II, III, and IV represent the azurophil, specific and gelatinase granules, as well as secretory vesicles, respectively .