Explore
 Validate
 Learn
LearnPA5-85267
antibody from Invitrogen Antibodies
Targeting: ARG1
 Western blot ELISA
 Immunocytochemistry Immunoprecipitation Immunohistochemistry Flow cytometry Other assay
Antibody data
- Antibody Data
- Antigen structure
- References [3]
- Comments [0]
- Validations
- Immunocytochemistry [2]
- Immunoprecipitation [1]
- Immunohistochemistry [6]
- Flow cytometry [2]
- Other assay [5]
Submit
Validation data
Reference
Comment
Report error
- Product number
- PA5-85267 - Provider product page

- Provider
- Invitrogen Antibodies
- Product name
- Arginase 1 Polyclonal Antibody
- Antibody type
- Polyclonal
- Antigen
- Recombinant full-length protein
- Description
- Keep as concentrated solution. Predicted reactivity: Mouse (86%), Rat (86%), Pig (89%), Rabbit (91%), Bovine (90%). Positive Control: Huh7, HepG2, mouse liver, rat liver. Store product as a concentrated solution. Centrifuge briefly prior to opening the vial.
- Reactivity
- Human, Mouse, Rat
- Host
- Rabbit
- Isotype
- IgG
- Vial size
- 100 μL
- Concentration
- 0.72 mg/mL
- Storage
- Store at 4°C short term. For long term storage, store at -20°C, avoiding freeze/thaw cycles.
Submitted references HA-coated collagen nanofibers for urethral regeneration via in situ polarization of M2 macrophages.
DA-DRD5 signaling controls colitis by regulating colonic M1/M2 macrophage polarization.
Clusterin regulates macrophage expansion, polarization and phagocytic activity in response to inflammation in the kidneys.
Niu Y, Stadler FJ, Yang X, Deng F, Liu G, Xia H
Journal of nanobiotechnology 2021 Sep 22;19(1):283
Journal of nanobiotechnology 2021 Sep 22;19(1):283
DA-DRD5 signaling controls colitis by regulating colonic M1/M2 macrophage polarization.
Liu L, Wu Y, Wang B, Jiang Y, Lin L, Li X, Yang S
Cell death & disease 2021 May 17;12(6):500
Cell death & disease 2021 May 17;12(6):500
Clusterin regulates macrophage expansion, polarization and phagocytic activity in response to inflammation in the kidneys.
Weng X, Zhao H, Guan Q, Shi G, Feng S, Gleave ME, Nguan CC, Du C
Immunology and cell biology 2021 Mar;99(3):274-287
Immunology and cell biology 2021 Mar;99(3):274-287
No comments: Submit comment
Supportive validation
- Submitted by
- Invitrogen Antibodies (provider)
- Main image
- Experimental details
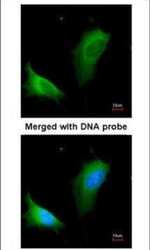
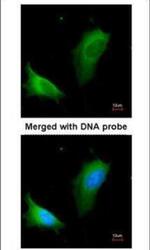
- Immunocytochemistry analysis of Arginase 1 in 4% paraformaldehyde-fixed HeLa cells using Arginase 1 polyclonal antibody (Product # PA5-85267) at a dilution of 1:200.

- Submitted by
- Invitrogen Antibodies (provider)
- Main image
- Experimental details
- Immunocytochemistry analysis of Arginase 1 in 4% paraformaldehyde-fixed HeLa cells using Arginase 1 polyclonal antibody (Product # PA5-85267) at a dilution of 1:200.

Supportive validation
- Submitted by
- Invitrogen Antibodies (provider)
- Main image
- Experimental details
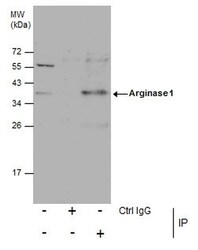
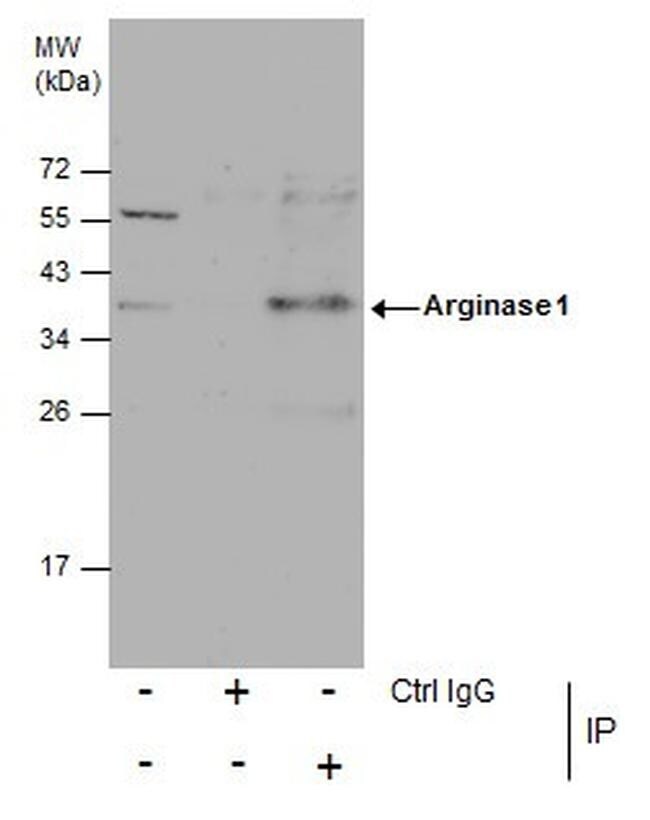
- Immunoprecipitation analysis of Arginase 1 in HepG2 whole cell extracts with Arginase 1 polyclonal antibody (Product # PA5-85267) using 5 µg of sample, followed by anti-Rabbit IgG secondary antibody.

Supportive validation
- Submitted by
- Invitrogen Antibodies (provider)
- Main image
- Experimental details
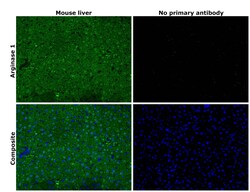
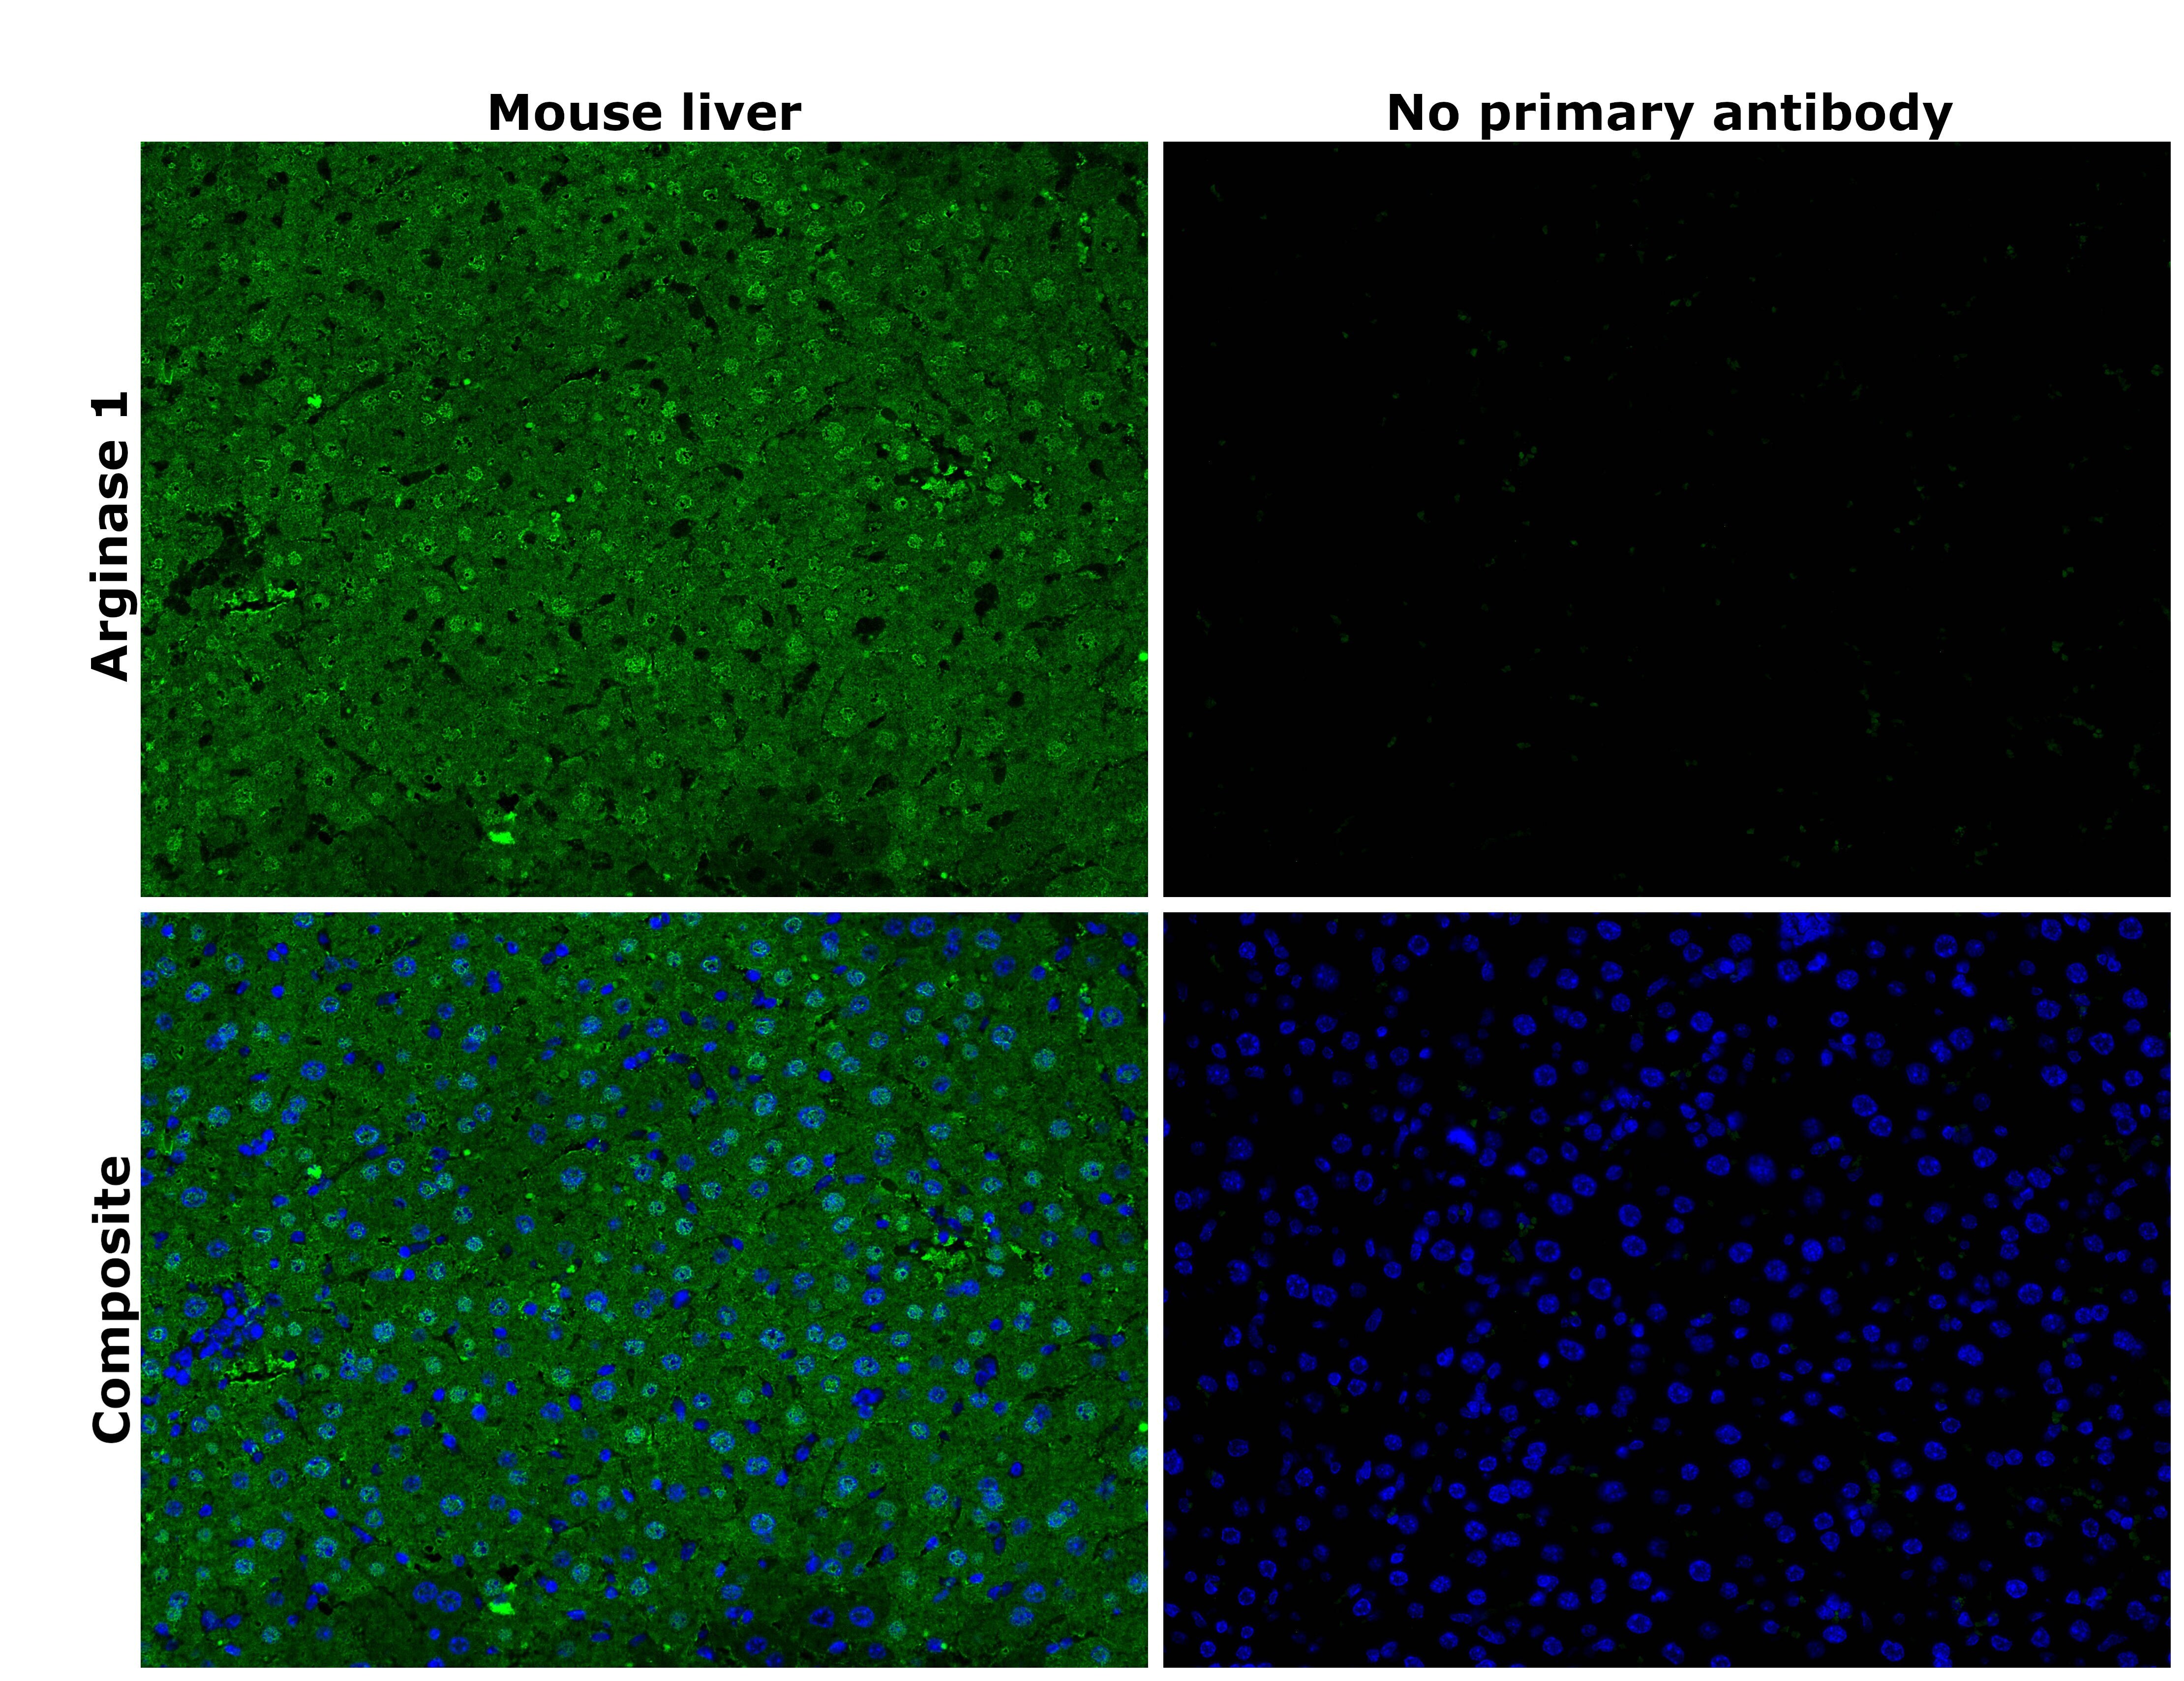
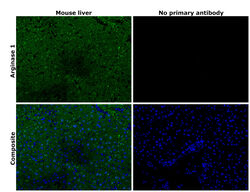
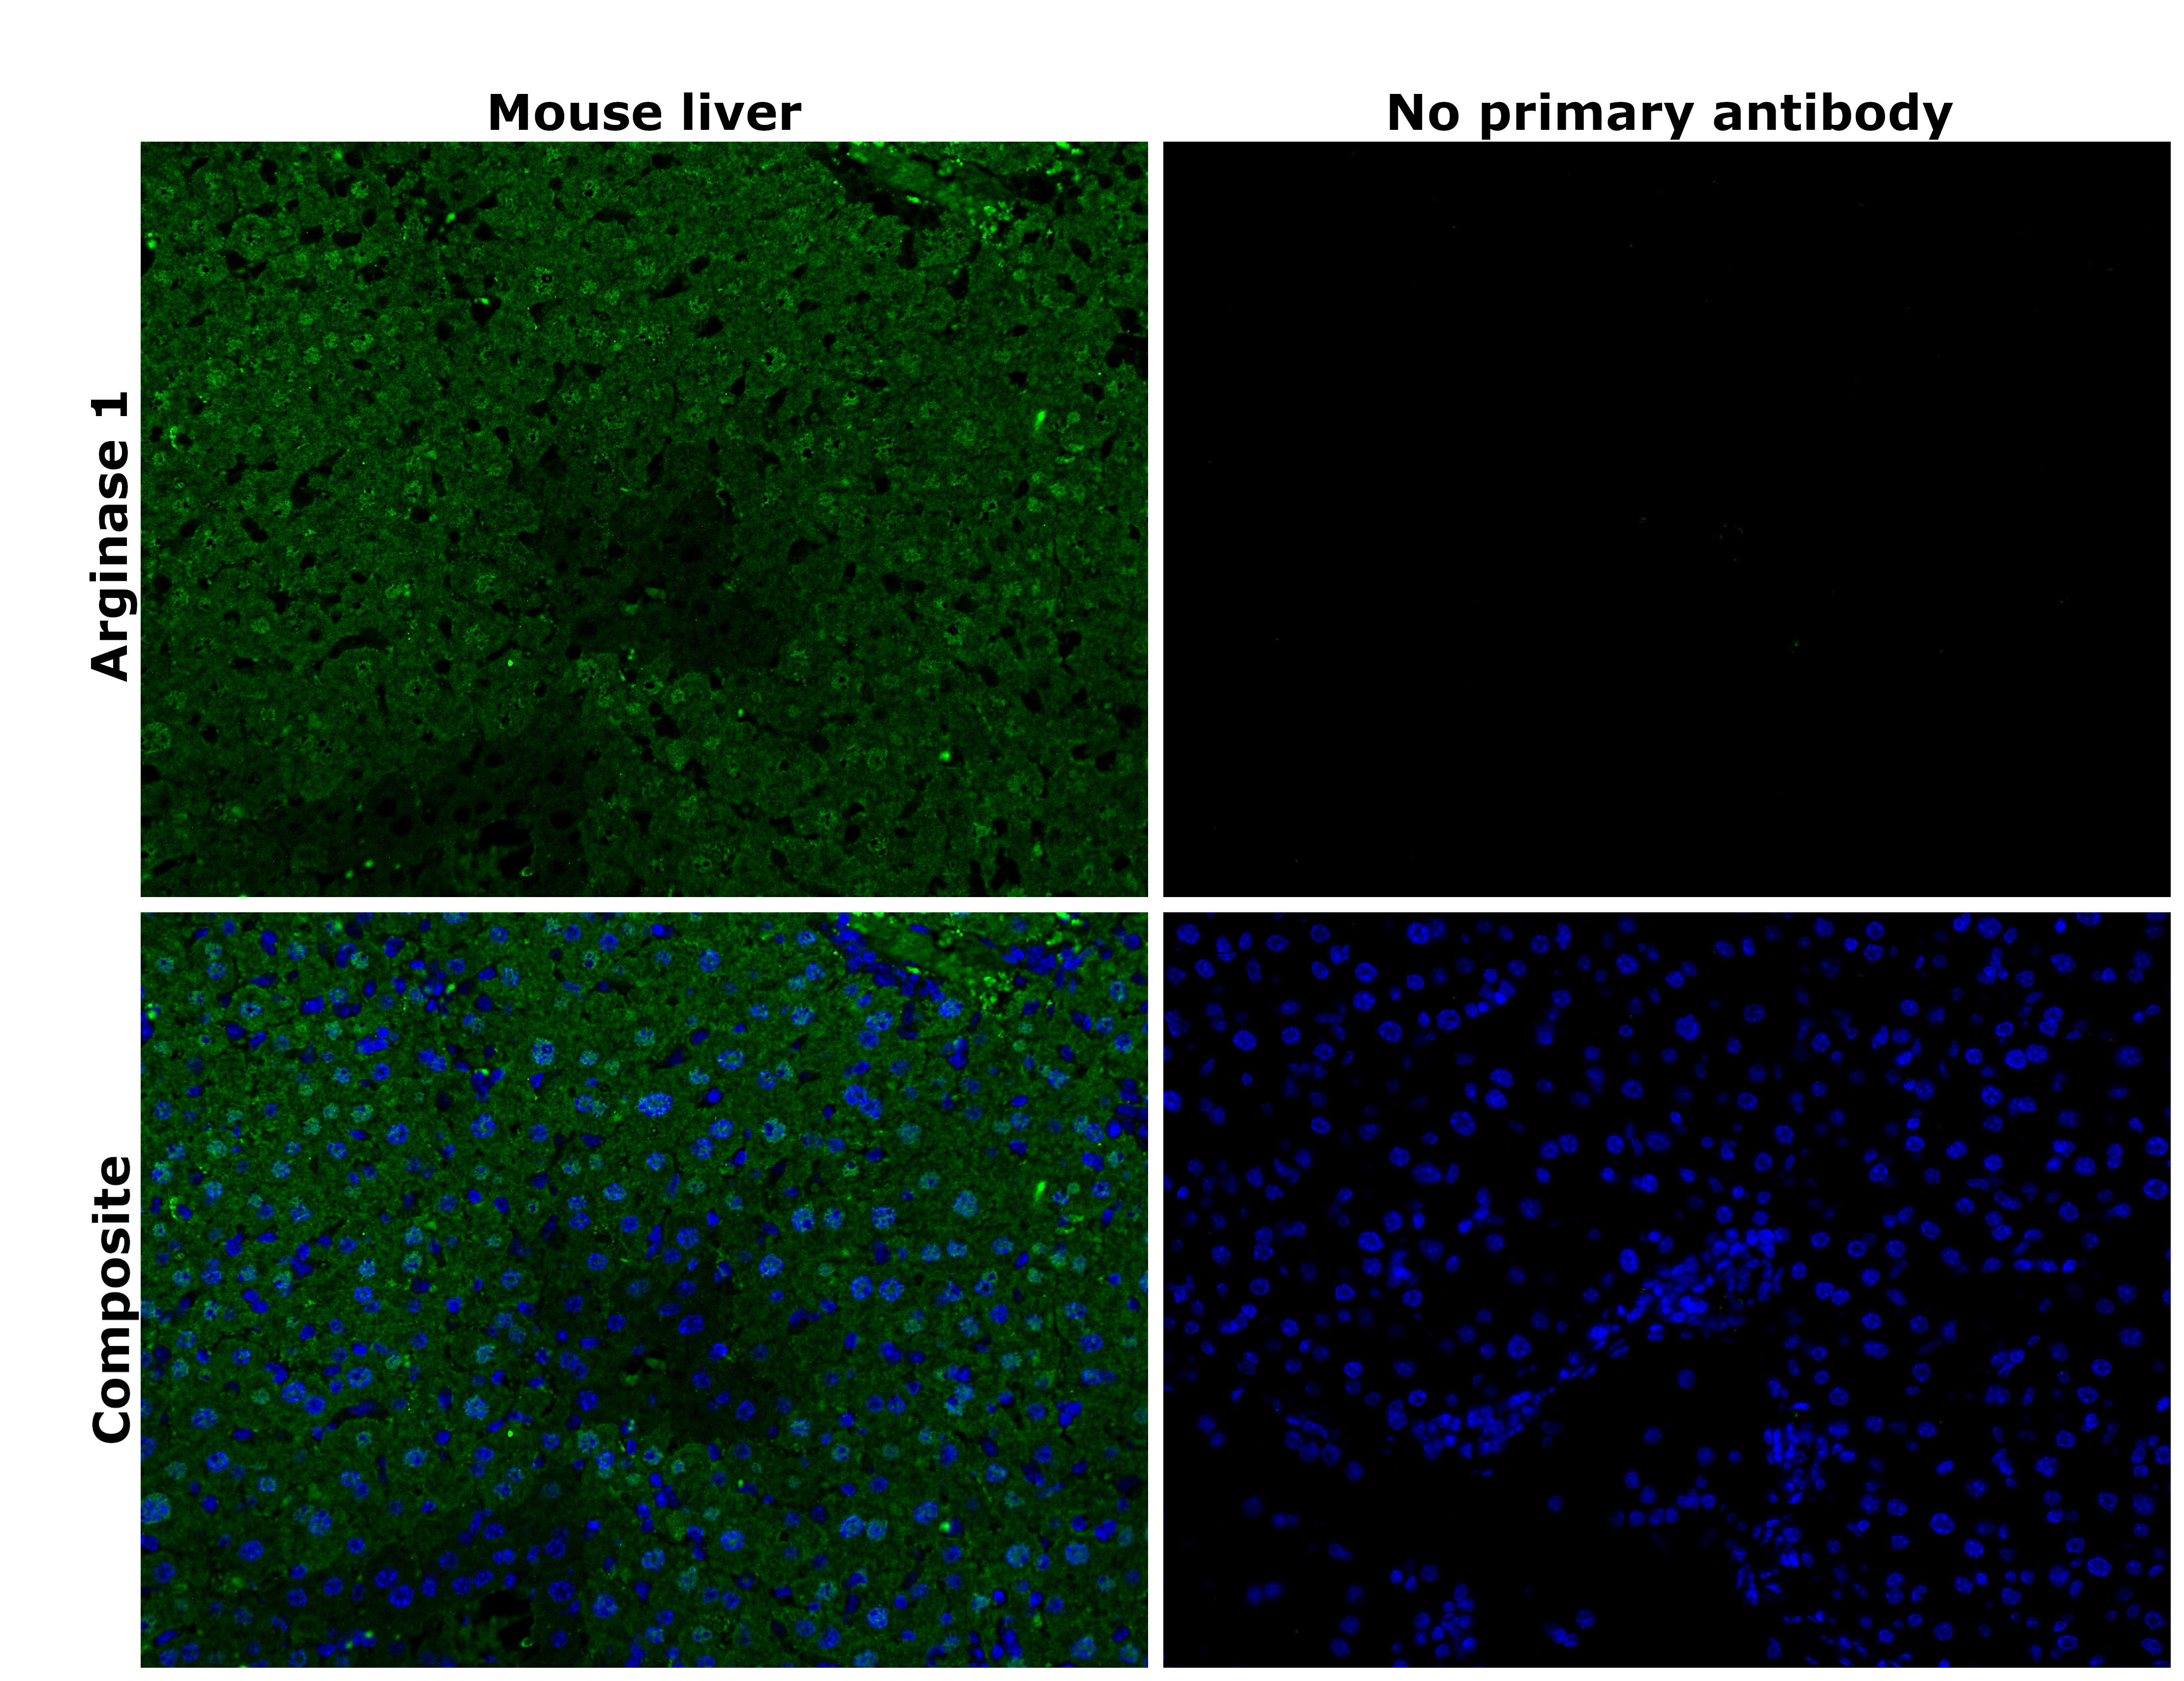
- Immunohistochemical analysis of Arginase 1 was performed using formalin-fixed paraffin-embedded mouse liver tissue sections. To expose the target protein, heat-induced epitope retrieval was performed on de-paraffinized sections using eBioscience™ IHC Antigen Retrieval Solution - Low pH (10X) (Product # 00-4955-58) diluted to 1X solution in water in a decloaking chamber at 110 degree Celsius for 15 minutes. Following antigen retrieval, the sections were blocked with 2% normal goat serum in 1X PBS for 45 minutes at room temperature and then probed with or without Arginase 1 Polyclonal Antibody (Product # PA5-85267) at 1:100 dilution in 0.1% normal goat serum overnight at 4 degree Celsius in a humidified chamber. Detection was performed using Goat anti-Rabbit IgG (H+L) Highly Cross-Adsorbed Secondary Antibody, Alexa Fluor™ Plus 488 (Product # A32731) at a dilution of 1:2,000 in 0.1% normal goat serum for 45 minutes at room temperature. ReadyProbes™ Tissue Autofluorescence Quenching Kit (Product # R37630) was used to quench autofluorescence from the tissues. Nuclei were stained with DAPI (Product # D1306) and the sections were mounted using ProLong™ Glass Antifade Mountant (Product # P36984). The images were captured on EVOS™ M7000 Imaging System (Product # AMF7000) at 20X magnification and externally deconvoluted.
- Submitted by
- Invitrogen Antibodies (provider)
- Main image
- Experimental details
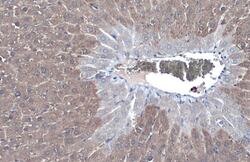
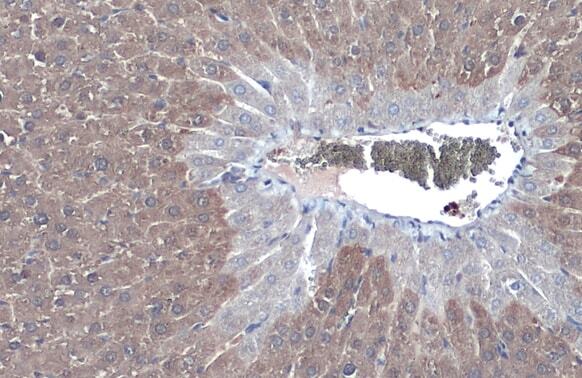
- Immunohistochemistry (Paraffin) analysis of Arginase 1 was performed in paraffin-embedded mouse liver tissue using Arginase 1 Polyclonal Antibody (Product # PA5-85267) at a dilution of 1:500. Antigen Retrieval: Citrate buffer, pH 6.0, 15 min.
- Submitted by
- Invitrogen Antibodies (provider)
- Main image
- Experimental details
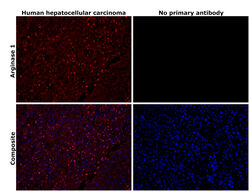
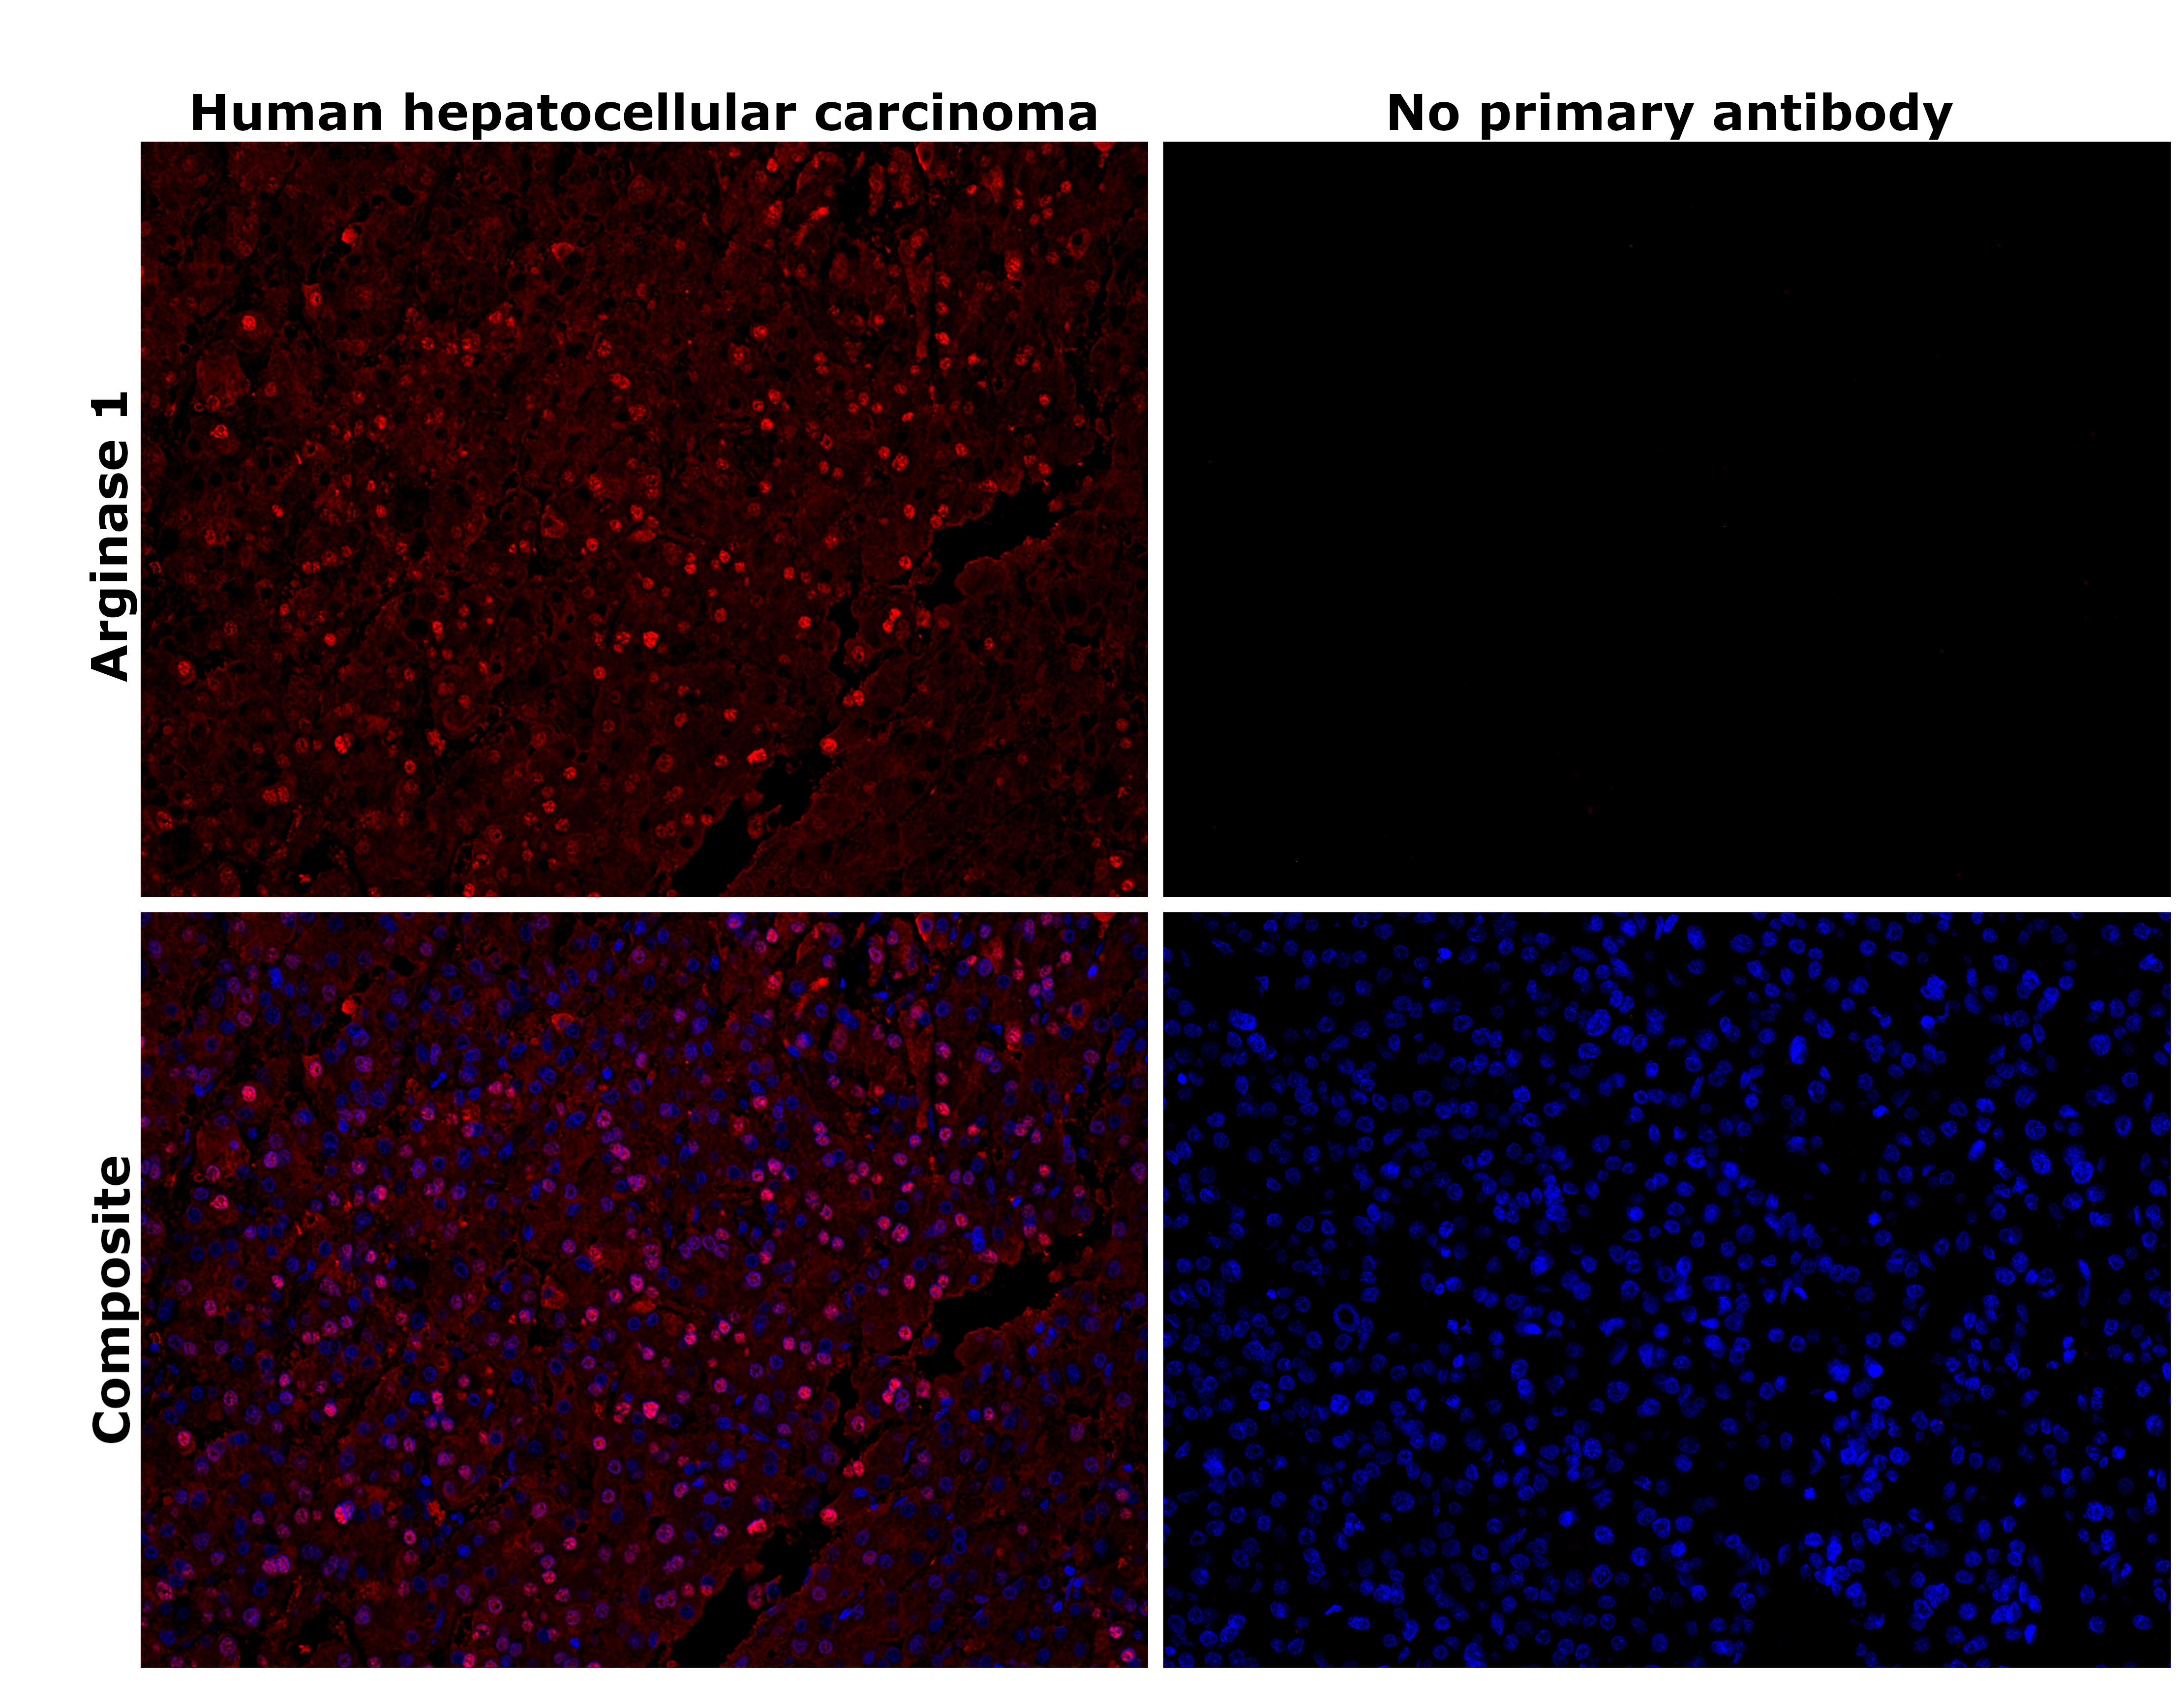
- Immunohistochemical analysis of Arginase 1 was performed using formalin-fixed paraffin-embedded human hepatocellular carcinoma tissue sections. To expose the target protein, heat-induced epitope retrieval was performed on de-paraffinized sections using eBioscience™ IHC Antigen Retrieval Solution - High pH (10X) (Product # 00-4956-58) diluted to 1X solution in water in a decloaking chamber at 110 degree Celsius for 15 minutes. Following antigen retrieval, the sections were blocked with 2% normal goat serum in 1X PBS for 45 minutes at room temperature and then probed with or without Arginase 1 Polyclonal Antibody (Product # PA5-85267) at 1:100 dilution in 0.1% normal goat serum overnight at 4 degree Celsius in a humidified chamber. Detection was performed using Goat anti-Rabbit IgG (H+L) Highly Cross-Adsorbed Secondary Antibody, Alexa Fluor™ Plus 647 (Product # A32733) at a dilution of 1:2,000 in 0.1% normal goat serum for 45 minutes at room temperature. ReadyProbes™ Tissue Autofluorescence Quenching Kit (Product # R37630) was used to quench autofluorescence from the tissues. Nuclei were stained with DAPI (Product # D1306) and the sections were mounted using ProLong™ Glass Antifade Mountant (Product # P36984). The images were captured on EVOS™ M7000 Imaging System (Product # AMF7000) at 20X magnification and externally deconvoluted.
- Submitted by
- Invitrogen Antibodies (provider)
- Main image
- Experimental details
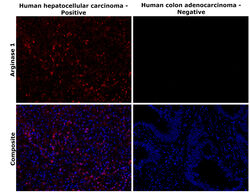
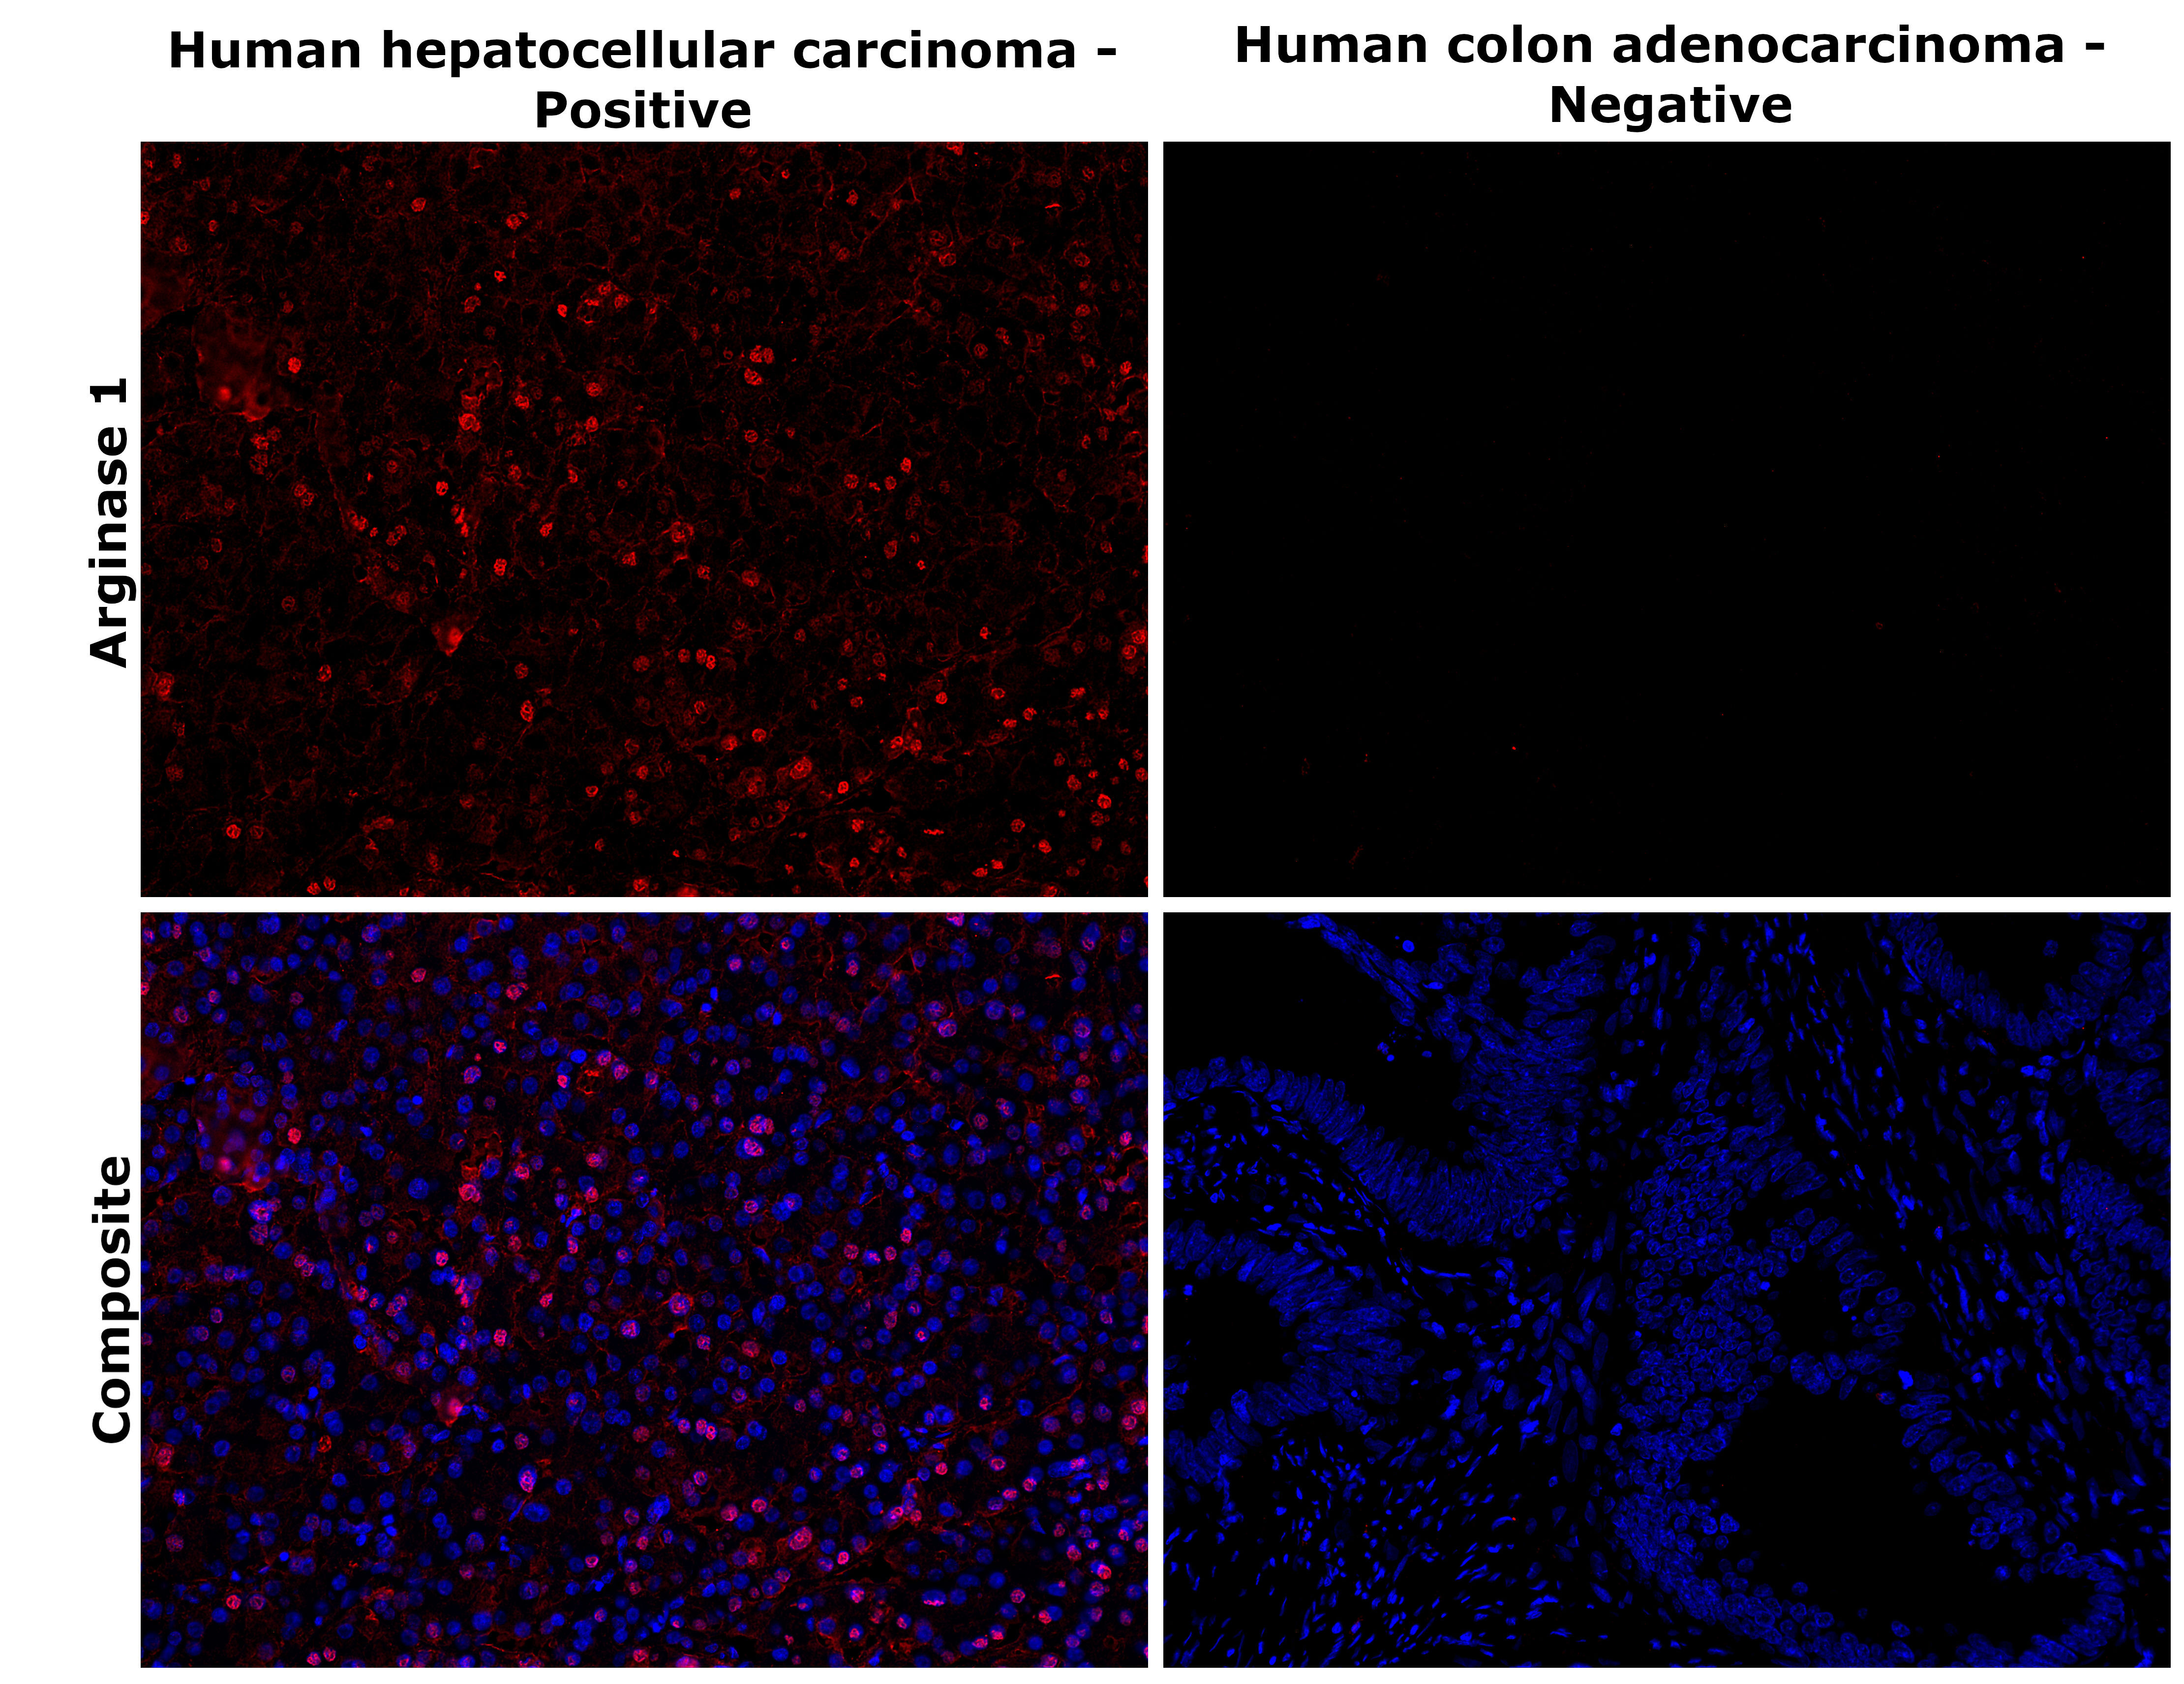
- Immunohistochemical analysis of Arginase 1 was performed using formalin-fixed paraffin-embedded human hepatocellular carcinoma and human colon adenocarcinoma tissue sections. To expose the target protein, heat-induced epitope retrieval was performed on de-paraffinized sections using eBioscience™ IHC Antigen Retrieval Solution - Low pH (10X) (Product # 00-4955-58) diluted to 1X solution in water in a decloaking chamber at 110 degree Celsius for 15 minutes. Following antigen retrieval, the sections were blocked with 2% normal goat serum in 1X PBS for 45 minutes at room temperature and then probed with Arginase 1 Polyclonal Antibody (Product # PA5-85267) at 1:100 dilution in 0.1% normal goat serum overnight at 4 degree Celsius in a humidified chamber. Detection was performed using Goat anti-Rabbit IgG (H+L) Highly Cross-Adsorbed Secondary Antibody, Alexa Fluor™ Plus 647 (Product # A32733) at a dilution of 1:2,000 in 0.1% normal goat serum for 45 minutes at room temperature. ReadyProbes™ Tissue Autofluorescence Quenching Kit (Product # R37630) was used to quench autofluorescence from the tissues. Nuclei were stained with DAPI (Product # D1306) and the sections were mounted using ProLong™ Glass Antifade Mountant (Product # P36984). The images were captured on EVOS™ M7000 Imaging System (Product # AMF7000) at 20X magnification and externally deconvoluted.
- Submitted by
- Invitrogen Antibodies (provider)
- Main image
- Experimental details
- Immunohistochemical analysis of Arginase 1 was performed using formalin-fixed paraffin-embedded mouse liver tissue sections. To expose the target protein, heat-induced epitope retrieval was performed on de-paraffinized sections using eBioscience™ IHC Antigen Retrieval Solution - High pH (10X) (Product # 00-4956-58) diluted to 1X solution in water in a decloaking chamber at 110 degree Celsius for 15 minutes. Following antigen retrieval, the sections were blocked with 2% normal goat serum in 1X PBS for 45 minutes at room temperature and then probed with or without Arginase 1 Polyclonal Antibody (Product # PA5-85267) at 1:100 dilution in 0.1% normal goat serum overnight at 4 degree Celsius in a humidified chamber. Detection was performed using Goat anti-Rabbit IgG (H+L) Highly Cross-Adsorbed Secondary Antibody, Alexa Fluor™ Plus 488 (Product # A32731) at a dilution of 1:2,000 in 0.1% normal goat serum for 45 minutes at room temperature. ReadyProbes™ Tissue Autofluorescence Quenching Kit (Product # R37630) was used to quench autofluorescence from the tissues. Nuclei were stained with DAPI (Product # D1306) and the sections were mounted using ProLong™ Glass Antifade Mountant (Product # P36984). The images were captured on EVOS™ M7000 Imaging System (Product # AMF7000) at 20X magnification and externally deconvoluted.
- Submitted by
- Invitrogen Antibodies (provider)
- Main image
- Experimental details
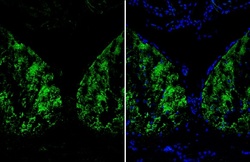
- Immunohistochemistry (Frozen) analysis of Arginase-1 was performed in frozen-sectioned mouse hippocampus tissue using Arginase 1 Polyclonal Antibody (Product # PA5-85267) at a dilution of 1:250 (Green). Blue: Fluoroshield with DAPI.

Supportive validation
- Submitted by
- Invitrogen Antibodies (provider)
- Main image
- Experimental details
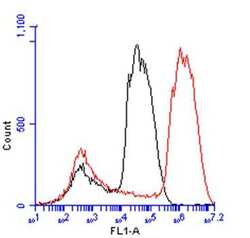
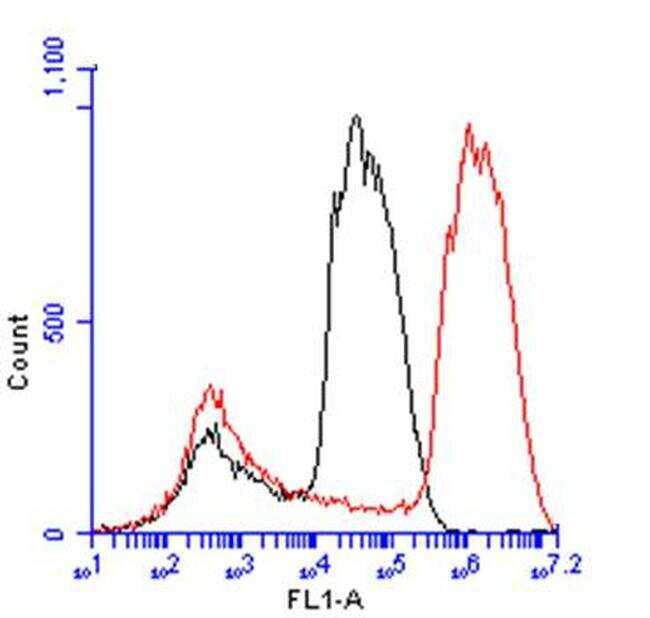
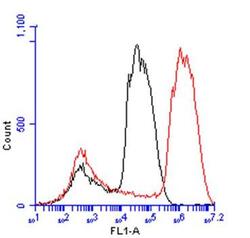
- Flow cytometry analysis of Arginase 1 in HepG2 cells (control: unlabeled cells) using Arginase 1 polyclonal antibody (Product # PA5-85267) at a dilution of 1:50. Dylight 488-conjugated was used as a secondary antibody.
- Submitted by
- Invitrogen Antibodies (provider)
- Main image
- Experimental details
- Flow cytometry analysis of Arginase 1 in HepG2 cells (control: unlabeled cells) using Arginase 1 polyclonal antibody (Product # PA5-85267) at a dilution of 1:50. Dylight 488-conjugated was used as a secondary antibody.

Supportive validation
- Submitted by
- Invitrogen Antibodies (provider)
- Main image
- Experimental details
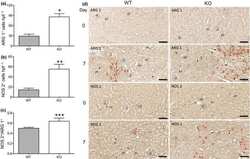
- Figure 6 CLU expression is associated with decreased ratio of NOS 2 + (M1 marker)/ARG 1 + (M2 marker) cells at day 7 following renal IRI. ARG 1 + and NOS 2 + cells were identified by immunohistochemistry as described in the ""Methods"" section. (a) The numbers of ARG 1 + cells. * P = 0.0010 (WT versus KO, two-tailed t -test). (b) The numbers of NOS 2 + cells. ** P = 0.0021 (WT versus KO, two-tailed t -test). (c) The difference in the M1/M2 ratio between the WT and CLU-KO groups was confirmed by the NOS 2 + /ARG 1 + ratio in each kidney. *** P = 0.0179 (WT versus KO, two-tailed t -test). Data in a , b and c are representative of three independent experiments and presented as the mean +- s.d. ( n = 3). (d) Representative images of three independent experiments. ARG 1 + (top 2) and NOS 2 + (bottom 2) cells (dark brown) in the tubulointerstitial area, the perivascular space and injured tubular epithelium of the renal cortical and medullary junction. Red arrowheads represent positively stained cells; Black arrowheads correspond to false-positive staining. Scale bar: 100 um. ARG 1; arginase 1; CLU, clusterin; DT, distal convoluted tubule; G, glomerulus; IA, interlobular artery; KO, clusterin knockout; NOS 2, nitric oxide synthase 2; PT, proximal convoluted tubule; WT, wild type.
- Submitted by
- Invitrogen Antibodies (provider)
- Main image

- Experimental details
- Immunoprecipitation analysis of Arginase 1 in HepG2 whole cell extracts with Arginase 1 polyclonal antibody (Product # PA5-85267) using 5 µg of sample, followed by anti-Rabbit IgG secondary antibody.
- Submitted by
- Invitrogen Antibodies (provider)
- Main image
- Experimental details
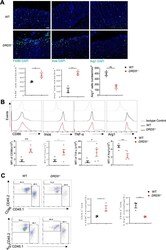
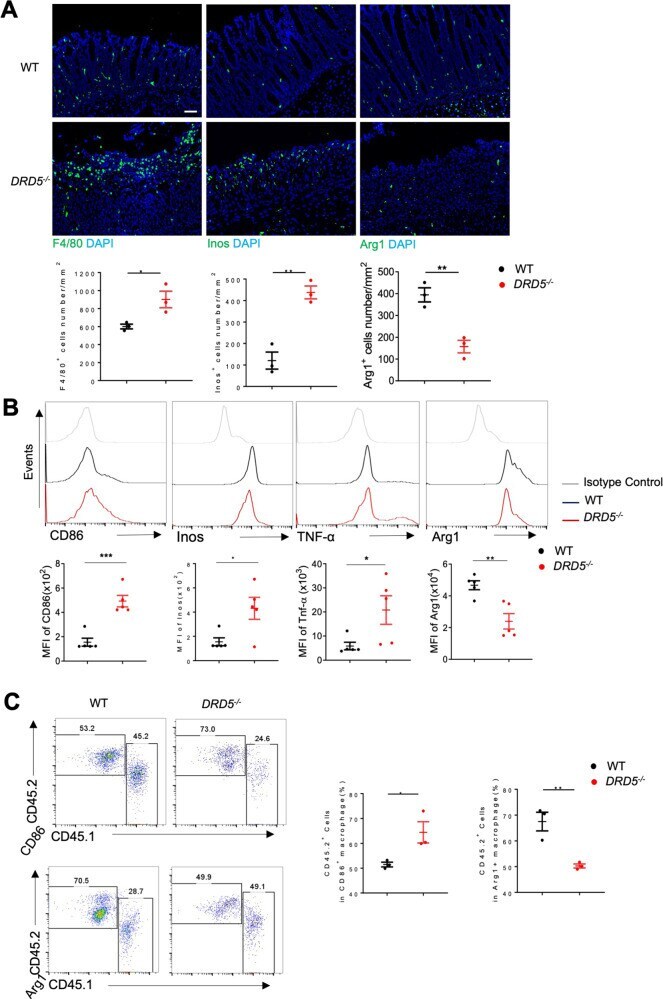
- Fig. 5 The deficiency of DRD5 signaling increased colonic M1 macrophages but reduced M2 cells in the colon of DSS colitis mice. A Immunofluorescent labeling of F4/80 + , Arg1 + , and Inos + colonic macrophages of WT and DRD5 -/- mice on day 6 after DSS treatment (top). The cell numbers are quantified by Image pro plus (bottom) ( n = 3). Scale bars, 200 mum. B Flow cytometry analysis of colonic macrophages of WT and DRD5 -/- mice ( n = 5 mice per group) on day 6 after DSS treatment as indicated. Data are presented as representative plots (top) and summary graphs of quantified percentages (bottom). C Flow cytometry analysis of the CD45.2 + cells percentage in Arg1 + and CD86 + colonic macrophages of lethally irradiated mice reconstituted with DRD5 -/- CD45.2/WT CD45.1 bone marrow (1:1 ratio), and a control WT CD45.2/WT CD45.1 group (1:1 ratio) on day 6 after DSS treatment ( n = 3 mice per group). Data are presented as representative plots (left) and summary graphs of quantified percentages (right). Data are pooled from two or three independent experiments. Error bars show means +- SEM. * p < 0.05, **p < 0.01, *** p < 0.001. Two-tailed unpaired student's t -test ( A , B , C ).
- Submitted by
- Invitrogen Antibodies (provider)
- Main image

- Experimental details
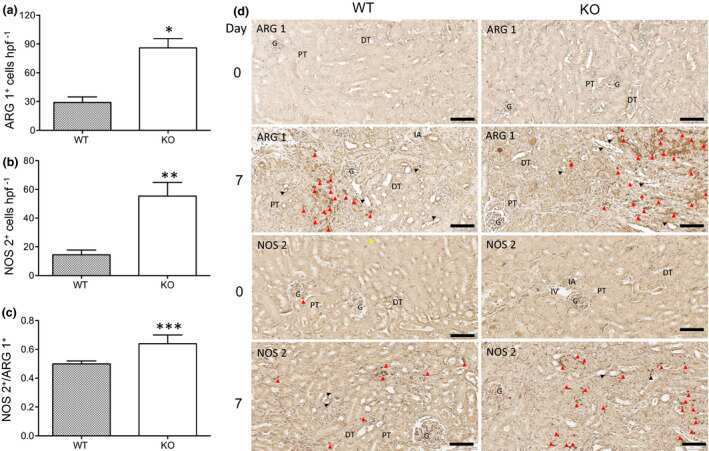
- Figure 6 CLU expression is associated with decreased ratio of NOS 2 + (M1 marker)/ARG 1 + (M2 marker) cells at day 7 following renal IRI. ARG 1 + and NOS 2 + cells were identified by immunohistochemistry as described in the ""Methods"" section. (a) The numbers of ARG 1 + cells. * P = 0.0010 (WT versus KO, two-tailed t -test). (b) The numbers of NOS 2 + cells. ** P = 0.0021 (WT versus KO, two-tailed t -test). (c) The difference in the M1/M2 ratio between the WT and CLU-KO groups was confirmed by the NOS 2 + /ARG 1 + ratio in each kidney. *** P = 0.0179 (WT versus KO, two-tailed t -test). Data in a , b and c are representative of three independent experiments and presented as the mean +- s.d. ( n = 3). (d) Representative images of three independent experiments. ARG 1 + (top 2) and NOS 2 + (bottom 2) cells (dark brown) in the tubulointerstitial area, the perivascular space and injured tubular epithelium of the renal cortical and medullary junction. Red arrowheads represent positively stained cells; Black arrowheads correspond to false-positive staining. Scale bar: 100 um. ARG 1; arginase 1; CLU, clusterin; DT, distal convoluted tubule; G, glomerulus; IA, interlobular artery; KO, clusterin knockout; NOS 2, nitric oxide synthase 2; PT, proximal convoluted tubule; WT, wild type.

- Submitted by
- Invitrogen Antibodies (provider)
- Main image
- Experimental details
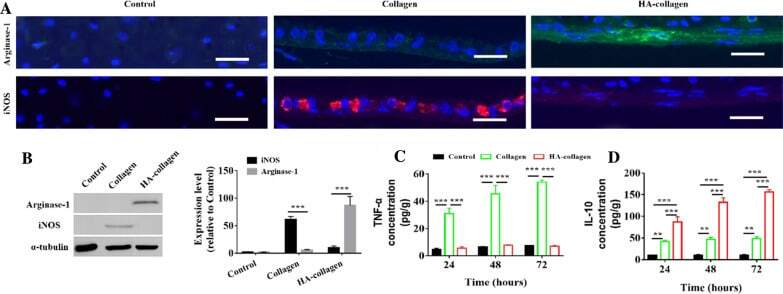
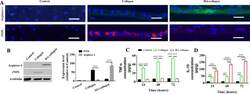
- Fig. 4 The polarization of macrophages to M2 phenotype is related to the elongated cell shape. A Fluorescence micrographs of Raw 264.7 macrophages immune-stained for arginase-1 (green), iNOS (red), and nuclear counterstain (blue) on cell plate (control), collagen and HA-collagen nanofibrous films. Scale bars: 15 mum. B Representative Western blot of arginase-1, iNOS, and tubulin of control, collagen and HA-collagen nanofibrous films and quantification of average across three separate experiments. Quantified TNF-alpha C and IL-10 D secretion from macrophages cultured on different nanofibrous scaffolds or culture plates using ELISA assay. n = 3, ** p < 0.01, *** p < 0.001