 Explore
 Validate
 Learn
Learn Western blot
 ELISA
ELISAAntibody data
- Antibody Data
- Antigen structure
- References [23]
- Comments [0]
- Validations
- ELISA [2]
- Other assay [17]
Submit
Validation data
Reference
Comment
Report error
- Product number
- PA5-29645 - Provider product page

- Provider
- Invitrogen Antibodies
- Product name
- Arginase 1 Polyclonal Antibody
- Antibody type
- Polyclonal
- Antigen
- Recombinant protein fragment
- Description
- Recommended positive controls: Mouse liver, rat liver. Predicted reactivity: Mouse (85%), Rat (83%), Pig (90%), Rabbit (90%), Bovine (89%). Store product as a concentrated solution. Centrifuge briefly prior to opening the vial.
- Reactivity
- Human, Mouse, Rat
- Host
- Rabbit
- Isotype
- IgG
- Vial size
- 100 µL
- Concentration
- 0.41 mg/mL
- Storage
- Store at 4°C short term. For long term storage, store at -20°C, avoiding freeze/thaw cycles.
Submitted references Epithelial arginase-1 is a key mediator of age-associated delayed healing in vaginal injury.
Histone methyltransferase enhancer of zeste 2 polycomb repressive complex 2 subunit exacerbates inflammation in depression rats by modulating microglia polarization.
Anti-Inflammatory CDGSH Iron-Sulfur Domain 2: A Biomarker of Central Nervous System Insult in Cellular, Animal Models and Patients.
Atractylenolide III ameliorates spinal cord injury in rats by modulating microglial/macrophage polarization.
VX-765 reduces neuroinflammation after spinal cord injury in mice.
Cholecystokinin Receptor Antagonist Improves Efficacy of Chemotherapy in Murine Models of Pancreatic Cancer by Altering the Tumor Microenvironment.
Exposure to Microbial Metabolite Butyrate Prolongs the Survival Time and Changes the Growth Pattern of Human Papillomavirus 16 E6/E7-Immortalized Keratinocytes in Vivo.
Inactivation of Interleukin-4 Receptor α Signaling in Myeloid Cells Protects Mice From Angiotensin II/High Salt-Induced Cardiovascular Dysfunction Through Suppression of Fibrotic Remodeling.
Attenuation of clinical and immunological outcomes during SARS-CoV-2 infection by ivermectin.
Ultrashort Wave Combined with Human Umbilical Cord Mesenchymal Stem Cell (HUC-MSC) Transplantation Inhibits NLRP3 Inflammasome and Improves Spinal Cord Injury via MK2/TTP Signalling Pathway.
CISD2 Attenuates Inflammation and Regulates Microglia Polarization in EOC Microglial Cells-As a Potential Therapeutic Target for Neurodegenerative Dementia.
Inhibiting P2Y12 in Macrophages Induces Endoplasmic Reticulum Stress and Promotes an Anti-Tumoral Phenotype.
Fruquintinib inhibits VEGF/VEGFR2 axis of choroidal endothelial cells and M1-type macrophages to protect against mouse laser-induced choroidal neovascularization.
Partial Inhibition of Glycolysis Reduces Atherogenesis Independent of Intraplaque Neovascularization in Mice.
Knockdown of Leptin Receptor Affects Macrophage Phenotype in the Tumor Microenvironment Inhibiting Breast Cancer Growth and Progression.
Macrophage miR-34a Is a Key Regulator of Cholesterol Efflux and Atherosclerosis.
CRID3, a blocker of apoptosis associated speck like protein containing a card, ameliorates murine spinal cord injury by improving local immune microenvironment.
Formyl Peptide Receptor 2 Activation Ameliorates Dermal Fibrosis and Inflammation in Bleomycin-Induced Scleroderma.
Vaccine against gastrin, a polyclonal antibody stimulator, decreases pancreatic cancer metastases.
Sub-clinical dose of bone morphogenetic protein-2 does not precipitate rampant, sustained inflammatory response in bone wound healing.
Diet Supplementation in ω3 Polyunsaturated Fatty Acid Favors an Anti-Inflammatory Basal Environment in Mouse Adipose Tissue.
Colony‑stimulating factor 1 receptor inhibition blocks macrophage infiltration and endometrial cancer cell proliferation.
Umbilical cord-derived mesenchymal stem cell extracts reduce colitis in mice by re-polarizing intestinal macrophages.
Wilkinson HN, Reubinoff B, Shveiky D, Hardman MJ, Menachem-Zidon OB
Frontiers in endocrinology 2022;13:927224
Frontiers in endocrinology 2022;13:927224
Histone methyltransferase enhancer of zeste 2 polycomb repressive complex 2 subunit exacerbates inflammation in depression rats by modulating microglia polarization.
Huang X, Yang Q, Xie L, Lei S
Bioengineered 2022 Mar;13(3):5509-5524
Bioengineered 2022 Mar;13(3):5509-5524
Anti-Inflammatory CDGSH Iron-Sulfur Domain 2: A Biomarker of Central Nervous System Insult in Cellular, Animal Models and Patients.
Kung WM, Lin CC, Chen WJ, Jiang LL, Sun YY, Hsieh KH, Lin MS
Biomedicines 2022 Mar 27;10(4)
Biomedicines 2022 Mar 27;10(4)
Atractylenolide III ameliorates spinal cord injury in rats by modulating microglial/macrophage polarization.
Xue MT, Sheng WJ, Song X, Shi YJ, Geng ZJ, Shen L, Wang R, Lü HZ, Hu JG
CNS neuroscience & therapeutics 2022 Jul;28(7):1059-1071
CNS neuroscience & therapeutics 2022 Jul;28(7):1059-1071
VX-765 reduces neuroinflammation after spinal cord injury in mice.
Chen J, Chen YQ, Shi YJ, Ding SQ, Shen L, Wang R, Wang QY, Zha C, Ding H, Hu JG, Lü HZ
Neural regeneration research 2021 Sep;16(9):1836-1847
Neural regeneration research 2021 Sep;16(9):1836-1847
Cholecystokinin Receptor Antagonist Improves Efficacy of Chemotherapy in Murine Models of Pancreatic Cancer by Altering the Tumor Microenvironment.
Malchiodi ZX, Cao H, Gay MD, Safronenka A, Bansal S, Tucker RD, Weinberg BA, Cheema A, Shivapurkar N, Smith JP
Cancers 2021 Sep 30;13(19)
Cancers 2021 Sep 30;13(19)
Exposure to Microbial Metabolite Butyrate Prolongs the Survival Time and Changes the Growth Pattern of Human Papillomavirus 16 E6/E7-Immortalized Keratinocytes in Vivo.
Li M, McGhee EM, Shinno L, Lee K, Lin YL
The American journal of pathology 2021 Oct;191(10):1822-1836
The American journal of pathology 2021 Oct;191(10):1822-1836
Inactivation of Interleukin-4 Receptor α Signaling in Myeloid Cells Protects Mice From Angiotensin II/High Salt-Induced Cardiovascular Dysfunction Through Suppression of Fibrotic Remodeling.
Song J, Frieler RA, Vigil TM, Ma J, Brombacher F, Goonewardena SN, Goldstein DR, Mortensen RM
Journal of the American Heart Association 2021 Jul 6;10(13):e017329
Journal of the American Heart Association 2021 Jul 6;10(13):e017329
Attenuation of clinical and immunological outcomes during SARS-CoV-2 infection by ivermectin.
de Melo GD, Lazarini F, Larrous F, Feige L, Kornobis E, Levallois S, Marchio A, Kergoat L, Hardy D, Cokelaer T, Pineau P, Lecuit M, Lledo PM, Changeux JP, Bourhy H
EMBO molecular medicine 2021 Aug 9;13(8):e14122
EMBO molecular medicine 2021 Aug 9;13(8):e14122
Ultrashort Wave Combined with Human Umbilical Cord Mesenchymal Stem Cell (HUC-MSC) Transplantation Inhibits NLRP3 Inflammasome and Improves Spinal Cord Injury via MK2/TTP Signalling Pathway.
Na L, Wang S, Liu T, Zhang L
BioMed research international 2020;2020:3021750
BioMed research international 2020;2020:3021750
CISD2 Attenuates Inflammation and Regulates Microglia Polarization in EOC Microglial Cells-As a Potential Therapeutic Target for Neurodegenerative Dementia.
Lin MS
Frontiers in aging neuroscience 2020;12:260
Frontiers in aging neuroscience 2020;12:260
Inhibiting P2Y12 in Macrophages Induces Endoplasmic Reticulum Stress and Promotes an Anti-Tumoral Phenotype.
Pavlović N, Kopsida M, Gerwins P, Heindryckx F
International journal of molecular sciences 2020 Oct 31;21(21)
International journal of molecular sciences 2020 Oct 31;21(21)
Fruquintinib inhibits VEGF/VEGFR2 axis of choroidal endothelial cells and M1-type macrophages to protect against mouse laser-induced choroidal neovascularization.
Liu X, Guo A, Tu Y, Li W, Li L, Liu W, Ju Y, Zhou Y, Sang A, Zhu M
Cell death & disease 2020 Nov 27;11(11):1016
Cell death & disease 2020 Nov 27;11(11):1016
Partial Inhibition of Glycolysis Reduces Atherogenesis Independent of Intraplaque Neovascularization in Mice.
Perrotta P, Van der Veken B, Van Der Veken P, Pintelon I, Roosens L, Adriaenssens E, Timmerman V, Guns PJ, De Meyer GRY, Martinet W
Arteriosclerosis, thrombosis, and vascular biology 2020 May;40(5):1168-1181
Arteriosclerosis, thrombosis, and vascular biology 2020 May;40(5):1168-1181
Knockdown of Leptin Receptor Affects Macrophage Phenotype in the Tumor Microenvironment Inhibiting Breast Cancer Growth and Progression.
Gelsomino L, Naimo GD, Malivindi R, Augimeri G, Panza S, Giordano C, Barone I, Bonofiglio D, Mauro L, Catalano S, Andò S
Cancers 2020 Jul 27;12(8)
Cancers 2020 Jul 27;12(8)
Macrophage miR-34a Is a Key Regulator of Cholesterol Efflux and Atherosclerosis.
Xu Y, Xu Y, Zhu Y, Sun H, Juguilon C, Li F, Fan D, Yin L, Zhang Y
Molecular therapy : the journal of the American Society of Gene Therapy 2020 Jan 8;28(1):202-216
Molecular therapy : the journal of the American Society of Gene Therapy 2020 Jan 8;28(1):202-216
CRID3, a blocker of apoptosis associated speck like protein containing a card, ameliorates murine spinal cord injury by improving local immune microenvironment.
Chen YQ, Wang SN, Shi YJ, Chen J, Ding SQ, Tang J, Shen L, Wang R, Ding H, Hu JG, Lü HZ
Journal of neuroinflammation 2020 Aug 29;17(1):255
Journal of neuroinflammation 2020 Aug 29;17(1):255
Formyl Peptide Receptor 2 Activation Ameliorates Dermal Fibrosis and Inflammation in Bleomycin-Induced Scleroderma.
Park GT, Kwon YW, Lee TW, Kwon SG, Ko HC, Kim MB, Kim JH
Frontiers in immunology 2019;10:2095
Frontiers in immunology 2019;10:2095
Vaccine against gastrin, a polyclonal antibody stimulator, decreases pancreatic cancer metastases.
Osborne N, Sundseth R, Gay MD, Cao H, Tucker RD, Nadella S, Wang S, Liu X, Kroemer A, Sutton L, Cato A, Smith JP
American journal of physiology. Gastrointestinal and liver physiology 2019 Nov 1;317(5):G682-G693
American journal of physiology. Gastrointestinal and liver physiology 2019 Nov 1;317(5):G682-G693
Sub-clinical dose of bone morphogenetic protein-2 does not precipitate rampant, sustained inflammatory response in bone wound healing.
Grey ZJ, Howie RN, Durham EL, Hall SR, Helke KL, Steed MB, LaRue AC, Muise-Helmericks RC, Cray JJ
Wound repair and regeneration : official publication of the Wound Healing Society [and] the European Tissue Repair Society 2019 Jul;27(4):335-344
Wound repair and regeneration : official publication of the Wound Healing Society [and] the European Tissue Repair Society 2019 Jul;27(4):335-344
Diet Supplementation in ω3 Polyunsaturated Fatty Acid Favors an Anti-Inflammatory Basal Environment in Mouse Adipose Tissue.
Colson C, Ghandour RA, Dufies O, Rekima S, Loubat A, Munro P, Boyer L, Pisani DF
Nutrients 2019 Feb 20;11(2)
Nutrients 2019 Feb 20;11(2)
Colony‑stimulating factor 1 receptor inhibition blocks macrophage infiltration and endometrial cancer cell proliferation.
Hua F, Tian Y, Gao Y, Li C, Liu X
Molecular medicine reports 2019 Apr;19(4):3139-3147
Molecular medicine reports 2019 Apr;19(4):3139-3147
Umbilical cord-derived mesenchymal stem cell extracts reduce colitis in mice by re-polarizing intestinal macrophages.
Song JY, Kang HJ, Hong JS, Kim CJ, Shim JY, Lee CW, Choi J
Scientific reports 2017 Aug 25;7(1):9412
Scientific reports 2017 Aug 25;7(1):9412
No comments: Submit comment
Supportive validation
- Submitted by
- Invitrogen Antibodies (provider)
- Main image

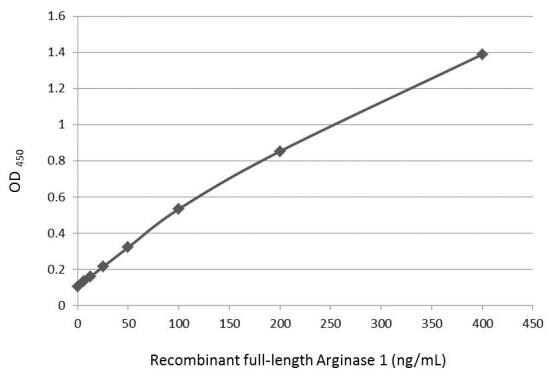
- Experimental details
- Sandwich ELISA detection of recombinant full-length Arginase 1 protein using Arginase 1 Polyclonal Antibody (Product # PA5-29645) as capture antibody at concentration of 5 µg/mL and Arginase 1 Monoclonal Antibody (GT5811) (Product # MA5-31577) as detection antibody at concentration of 1 µg/mL. Mouse IgG antibody (HRP) was diluted at 1:10,000 and used to detect the primary antibody.
- Submitted by
- Invitrogen Antibodies (provider)
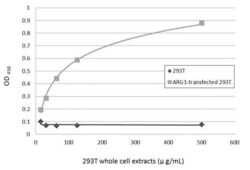
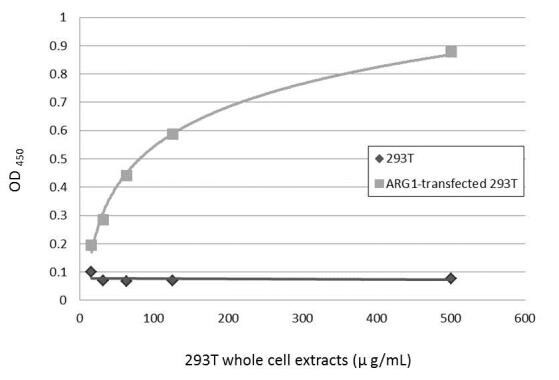
- Main image
- Experimental details
- Sandwich ELISA detection of non-transfected and transfected 293T whole cell extracts using Arginase 1 Polyclonal Antibody (Product # PA5-29645) as capture antibody at concentration of 5 µg/mL and Arginase 1 Monoclonal Antibody (GT5811) (Product # MA5-31577) as detection antibody at concentration of 1 µg/mL. Mouse IgG antibody (HRP) was diluted at 1:10,000 and used to detect the primary antibody.
Supportive validation
- Submitted by
- Invitrogen Antibodies (provider)
- Main image

- Experimental details
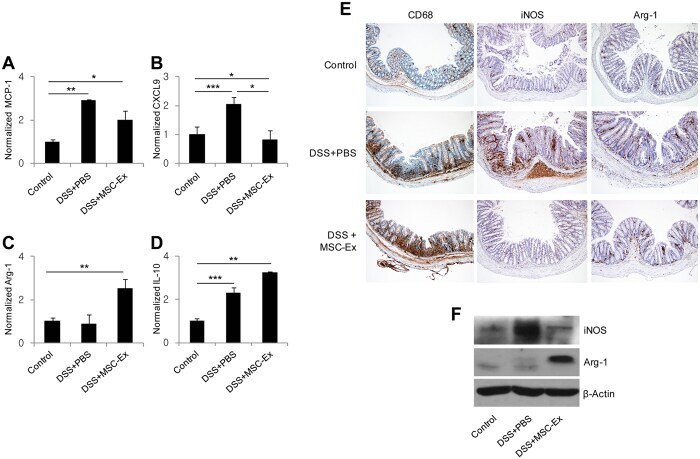
- Figure 4 MSC-Ex shifted the macrophage phenotype from M1 to M2 in the colon of mice with chronic colitis. The relative expressions of the macrophage phenotype-associated genes were evaluated by qRT-PCR: (A,B) MCP-1 and CXCL9 (M1 marker), (C,D) Arg-1 and IL-10 (M2 marker). (E) Representative photomicrographs of CD68 (macrophage marker), iNOS (M1 marker), and Arg-1 (M2 marker), immunohistochemically labeled in the colonic tissues of colitis mice. The photomicrographs were acquired at 100x magnification. (F) The protein levels of intracellular iNOS and Arg-1 were evaluated by western blotting. Data are represented as the means +- s.d. ( n >= 3 ). * P < 0.05, **P < 0.005, ***P < 0.001 .
- Submitted by
- Invitrogen Antibodies (provider)
- Main image
- Experimental details
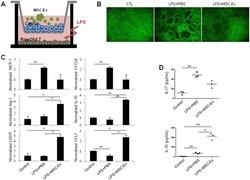
- Figure 6 MSC-Ex protects intestinal adherens junctions in an in vitro model. (A) Schematic representation of the in vitro co-culture system. Caco-2 cells were cultured on the upper transwell inserts in multiple well plates containing RAW 264.7 cells. To imitate inflammation in the gut, LPS was added to the basolateral compartment, and MSC-Ex was administered to the apical side. (B) Immunofluorescent staining for E-cadherin using FITC-conjugated antibodies. Continued epithelial barrier, indicated by E-cadherin staining, is disrupted in the absence of MSC-Ex. Magnification, 40x. (C) The transcripts of MCP-1 (M1 marker), CXCL9 (M1 marker), Arg-1(M2 marker), IL-10 (M2 marker), LIGHT (M2 marker), and CCL1 (M2 marker) in RAW 264.7 cells were examined by qRT-PCR analysis after 4 h of LPS (1 mug/mL) treatment and subsequent MSC-Ex (30 mug/mL) administration for 24 h. (D) The protein levels of IL-17 (top) and IL-10 (bottom) were measured by ELISA using culture supernatants from the basolateral side. Data are represented as the means +- s.d. ( n > 3 ). * P < 0.05, **P < 0.005, ***P < 0.001 .

- Submitted by
- Invitrogen Antibodies (provider)
- Main image
- Experimental details
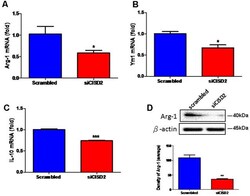
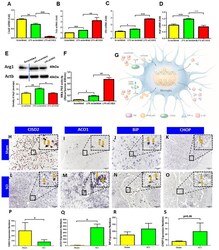
- Figure 2 Knockdown of CISD2 expression downregulated (A) Arg-1, (B) YM1, (C) IL-10 mRNA expression, and (D) Arg-1 protein expression in non-stimulated EOC microglial cells. In (A-C) , data indicate means (+-SEM) of fold decrease of Arg-1, YM1, and IL-10 mRNA in comparison to that in the scrambled control group analyzed by real-time qRT-PCR in siCID2-transfected groups ( n = 3 in each group). * p < 0.05; *** p < 0.001 as compared with scrambled control. In (D) , the upper panel demonstrates the immunoblot results of Arg-1 at 40 kDa, and beta-actin serves as an internal control; the lower panel indicates the mean (+-SEM) of Arg-1/beta-actin band intensity in ratio with the scrambled control ( n = 3). ** p < 0.01 indicates the significant difference compared with scrambled control.

- Submitted by
- Invitrogen Antibodies (provider)
- Main image
- Experimental details
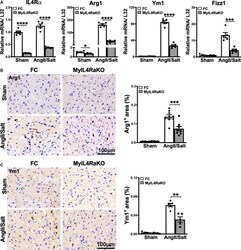
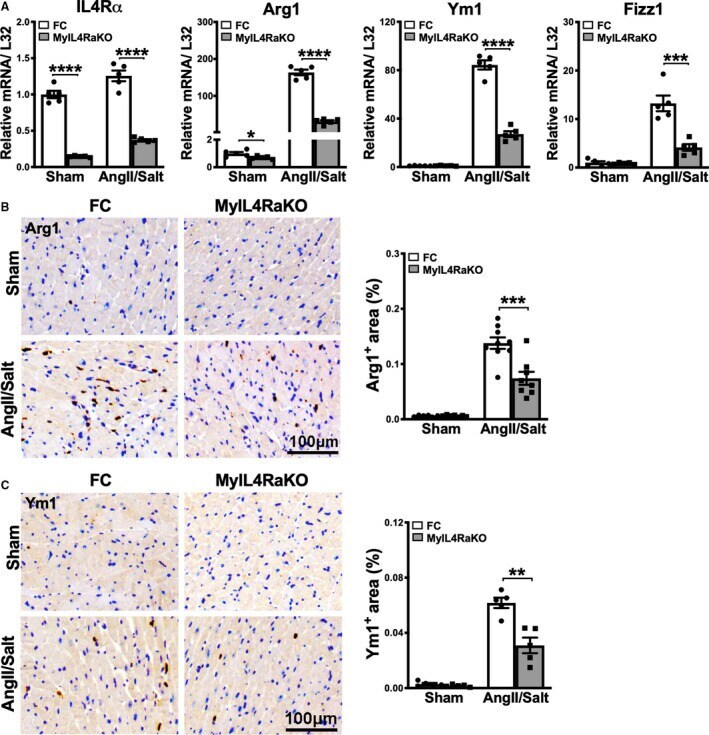
- Figure 2 Myeloid-specific IL-4Ralpha deficiency attenuates alternative macrophage activation in AngII/salt-induced cardiac remodeling in vivo. A , Gene expression analysis of CD11b + F4/80 + macrophages sorted by flow cytometry from indicated hearts. mRNA levels of IL-4Ralpha and M2-like (alternatively activated) macrophage markers Arg1, Ym1 , and Relmalpha/Fizz1 were determined using quantitative reverse transcription-polymerase chain reaction. Pooled samples of 4 sham mice or 2 AngII/salt-treated mice are shown. Each dot represents 1 RNA sample from the pooled mice. n=5 per group. B , Representative pictures of Arg1-stained heart sections with or without exposure to AngII/salt (bar=100 mum). The percentage of Arg1-positive areas in indicated hearts was quantified and is shown on the right (n=6-9 per group). C , Representative images of Ym1-stained heart sections with or without AngII/salt treatment (bar=100 mum). Quantification of the percentage of Ym1-positive areas is shown on the right (n=5 per group). Results are presented as mean+-SEM. * P
- Submitted by
- Invitrogen Antibodies (provider)
- Main image
- Experimental details
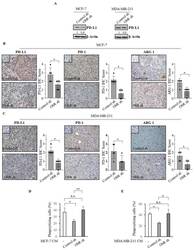
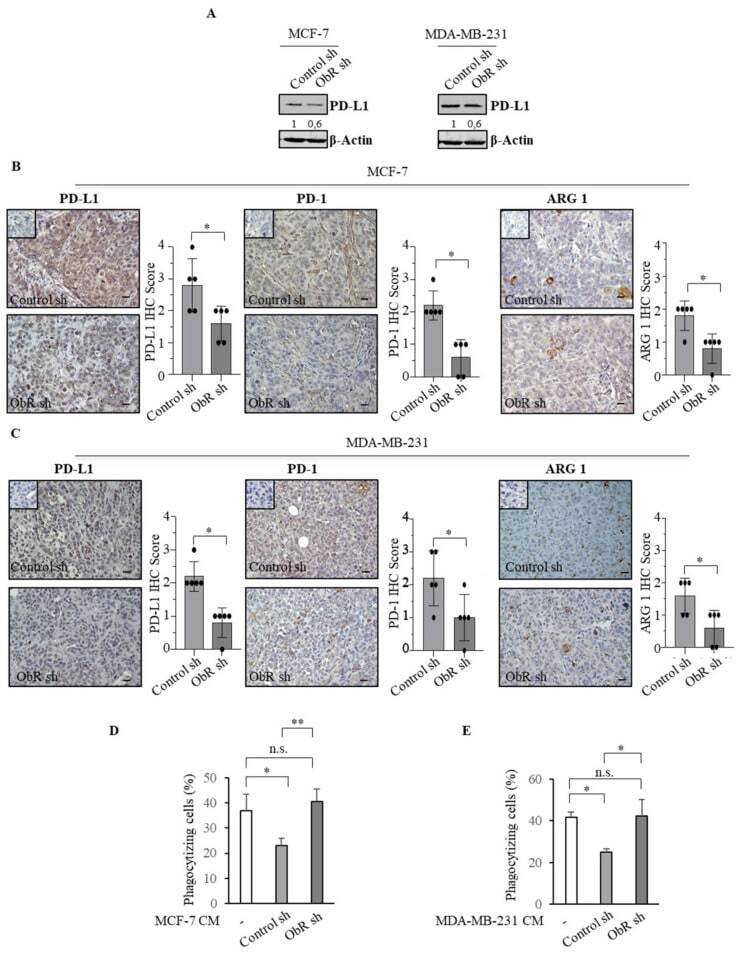
- Figure 7 Effects of the lack of ObR on the tumor immune microenvironment. ( A ) Immunoblotting showing programmed death ligand 1 (PD-L1) protein expression in Control sh and ObR sh MCF-7 and MDA-MB-231 breast cancer cells. beta-Actin was used as a control for equal loading and transfer. Italicized numbers below blots represent the mean of the band optical density expressed as fold over Control sh ObR cells. PD-L1, programmed cell death protein (PD-1) and arginase (ARG 1) immunohistochemical staining and relative score of Control sh and ObR sh MCF-7 ( B ) and MDA-MB-231 ( C ) xenograft tumor sections. Inset, negative control. Scale bar = 25 mum. THP-1 cells were stimulated with phorbol 12-myristate 13-acetate (PMA, 100 nM) for 14 h followed by 24 h rest to obtain THP-1 macrophage-like cells (M0). Phagocytic activity of M0 treated with 5% charcoal stripped media (-) or incubated with conditioned media (CM) derived from control sh and ObR sh MCF-7 breast cancer cells for 5 days ( D ) and MDA-MB-231 for 3 days ( E ). Cells were incubated with latex beads conjugated with FITC-IgG for 2 h. Pixel intensity of FITC labeled beads was normalized to number of cells and results are expressed as percentage. The values represent the mean +- SD of three different experiments, each performed in triplicate. n.s., nonsignificant; * p < 0.05; ** p < 0.005.
- Submitted by
- Invitrogen Antibodies (provider)
- Main image

- Experimental details
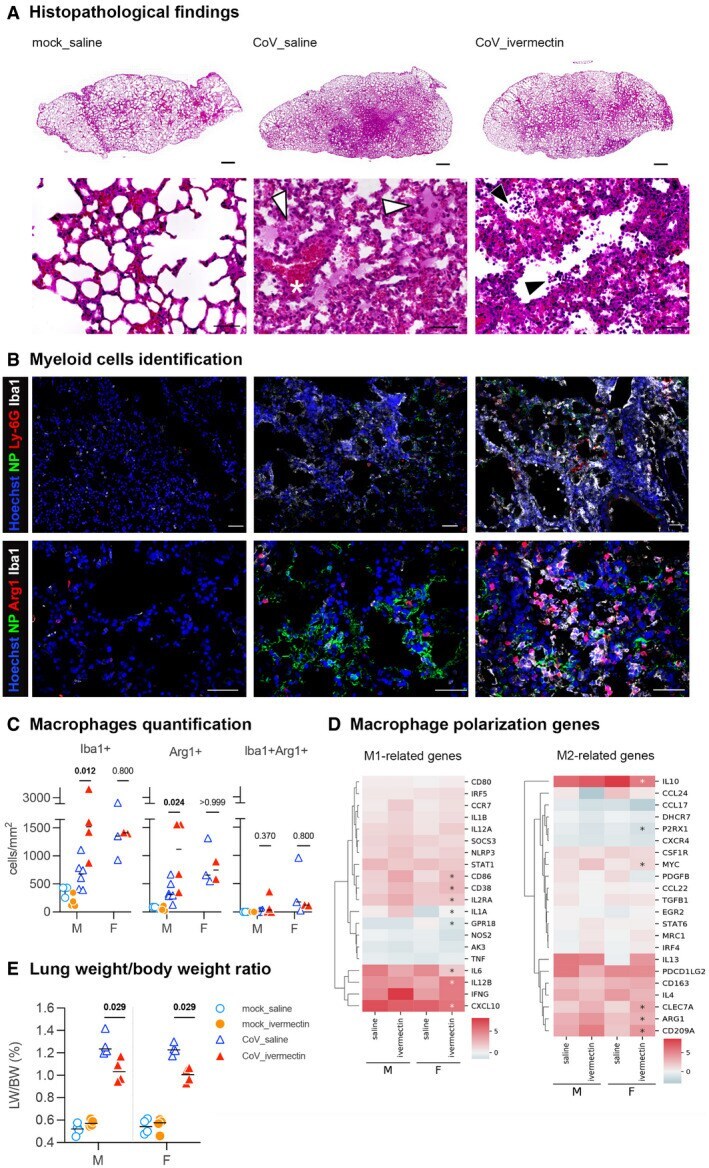
- Figure 3 Identification of macrophages in the lung of SARS-CoV-2-infected hamsters with and without ivermectin treatment and characterization of their transcriptomic profile related to M1/M2 polarization A Representative histopathology photomicrographies of lungs according to the different groups: mock_saline, CoV_saline, and CoV_ivermectin. Top panels: whole lung sections. Bottom panels: high magnification. CoV_saline section exhibits important congestion (*), edema associated with few mononuclear cells (white arrowheads). Note the thickening of the alveolar walls. CoV_ivermectin section exhibits important amounts of mononuclear cells (black arrowheads) and less marked signs of congestion or edema. Hematoxylin and eosin. Scale bars = 1 mm (top panels) and 20 mum (bottom panels). B Representative immunofluorescence photomicrographies of neutrophils (Ly-6G), monocytes/macrophages (Iba1), M2 macrophages (Arg1), and SARS-CoV-2 (NP) in the lung. Scale bars = 50 mum. C Quantification of Iba1 + cells, Arg1 + cells, and Iba1 + Arg1 + cells in the lungs. mock_saline n = 3 (males), mock_ivermectin n = 4 (males), CoV_saline n = 9 (6 males and 3 females), and CoV_ivermectin n = 6 (4 males and 2 females). D Heatmaps showing the differentially expressed genes related to the M1/M2 polarization in comparison with mock-infected hamsters. *indicates Benjamini-Hochberg-adjusted P -value < 0.05 in the comparison between saline and ivermectin within the same sex. Color gradient represents the tr
- Submitted by
- Invitrogen Antibodies (provider)
- Main image
- Experimental details
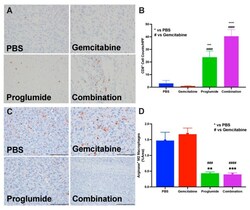
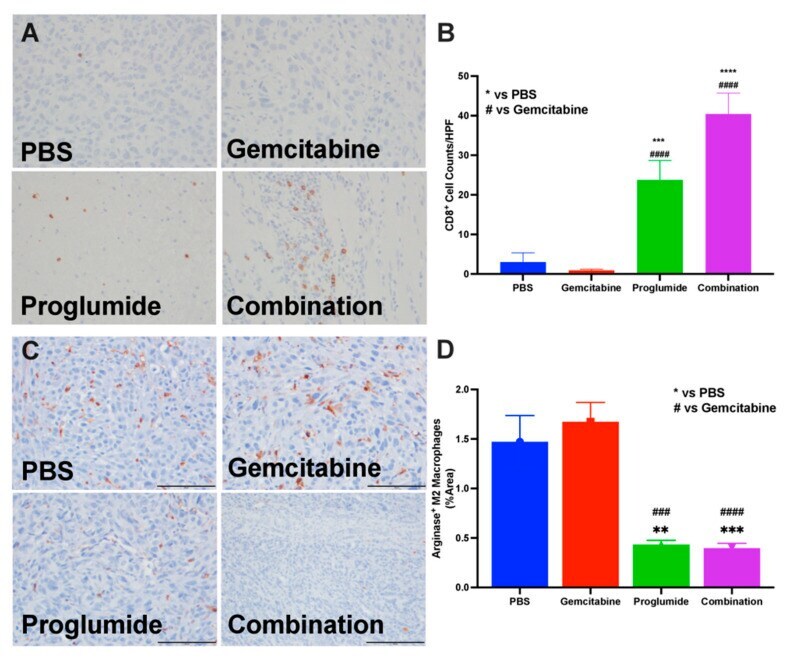
- Figure 3 Proglumide therapy alters the tumor immune cell signature. ( A ) A representative tumor section from each treatment group showing immunoreactivity for CD8 + tumor-infiltrating lymphocytes from mT3-2D tumors. The 5 um tissue sections were imaged with a 10x objective, 200 um. ( B ) Analysis of the number of tumor-infiltrating CD8 + T-lymphocytes is shown. Columns represent means per group +- SEM ( # compared to gemcitabine, * compared to PBS controls; *** and ### p < 0.001; **** and #### p < 0.0001). ( C ) Representative images from tumors of each treatment group of the mT3-2D tumors shows immunoreactivity for arginase indicating immune suppression within the TME in each tumor section. ( D ) Analysis of the percentage of arginase positive cells per area examined on each tumor section. Columns represent means per group +- SEM ( # compared to gemcitabine, * compared to PBS controls; ** p < 0.005; *** and ### p < 0.001; #### p < 0.0001).
- Submitted by
- Invitrogen Antibodies (provider)
- Main image

- Experimental details
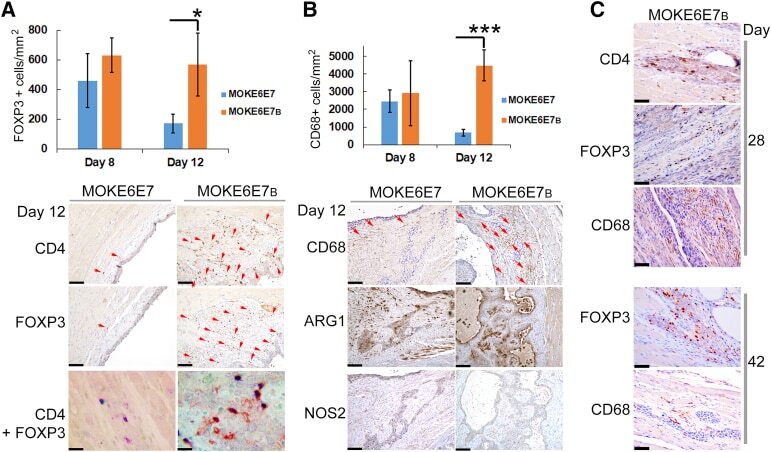
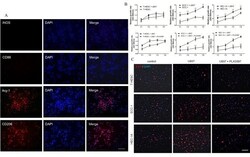
- Presence of immune regulatory cells in lesions formed by HPV16 E6/E7-expressing keratinocytes. A: Top panel: FOXP3 + cell density on day 8 and 12 lesions formed by MOKE6E7 and MOKE6E B cells. Bottom panels: CD4 and FOXP3 immunohistochemistry (IHC) analyses on the day 12 lesions. CD4 and FOXP3 IHC analyses: Red arrows mark positive brown signals. FOXP3/CD4 double IHC: Nuclear blue color represents FOXP3 signals, and membranous red color represents CD4 signals. Almost all FOXP3 + cells detected in both lesions were also CD4 + , which represented regulatory T cells, but not vice versa. B: Top panel: CD68 + cell density on day 8 and 12 lesions. Bottom panels: CD68, arginase 1 (ARG1), and nitric oxide synthase (NOS) 2 IHC analyses on the day 12 lesions. Red arrows mark the CD68 signals. Macrophages present in the lesions are polarized to M2. C: CD4, FOXP3, and CD68 IHC analyses on day 28 and 42 lesions of MOKE6E7 B . Images are representative of the studied mice in the group. Data represent means +- SD ( A and B ). N = 6. * P
- Submitted by
- Invitrogen Antibodies (provider)
- Main image
- Experimental details
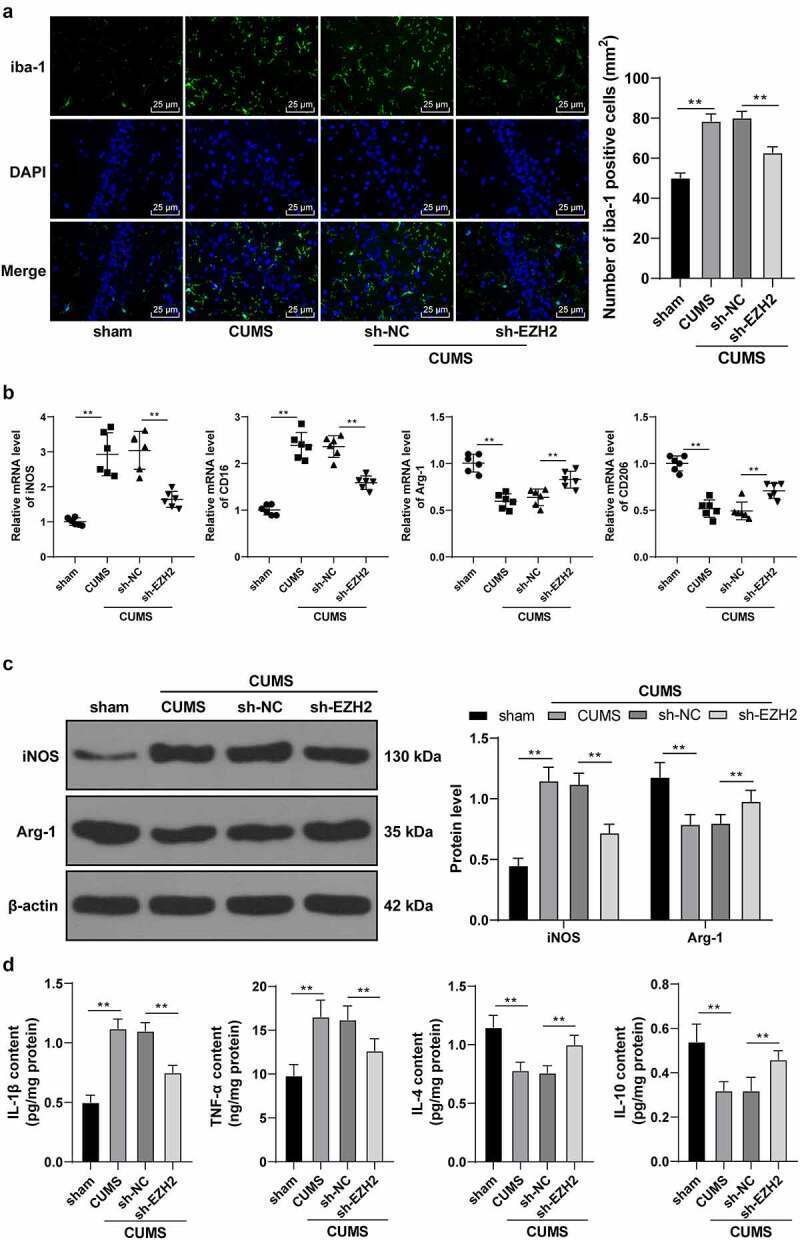
- Figure 3. EZH2 silencing palliates neuroinflammation in depression rats by regulating microglia polarization. (a) Positive rate of iba-1 analyzed by immunofluorescence. (b) mRNA levels of iNOS, CD16, Arg-1 and CD206 detected by RT-qPCR. (c) Protein levels of iNOS and Arg-1 determined by Western blot analysis. (d) Contents of IL-1beta, TNF-alpha, IL-4 and IL-10 measured by ELISA. N = 6. The results in panels A, C and D were presented as mean +- standard deviation. One-way ANOVA was used to analyze the data in panels A, B and D. Two-way ANOVA was used to analyze the data in panel C. Tukey's multiple comparisons test was applied for post hoc test. ** p < 0.01.
- Submitted by
- Invitrogen Antibodies (provider)
- Main image

- Experimental details
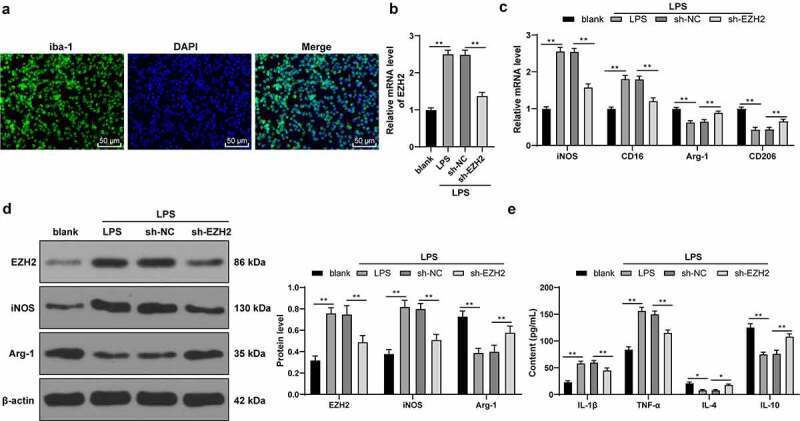
- Figure 4. EZH2 silencing triggers M2 polarization of LPS-induced . (a) Positive rate of iba-1 in LPS-induced microglia analyzed by immunofluorescence. (b) mRNA levels of EZH2 detected by RT-qPCR. (c) mRNA levels of iNOS, CD16, Arg-1 and CD206 detected by RT-qPCR. (d) Protein levels of EZH2, iNOS and Arg-1 determined by Western blot analysis. (e) Contents of IL-1beta, TNF-alpha, IL-4 and IL-10 measured by ELISA. The experiment was performed 3 times. The results were presented as mean +- standard deviation. One-way ANOVA was used to analyze the data in panel B. Two-way ANOVA was used to analyze the data in panels C, D and E. Tukey's multiple comparisons test was applied for post hoc test. * p < 0.05, ** p < 0.01.
- Submitted by
- Invitrogen Antibodies (provider)
- Main image

- Experimental details
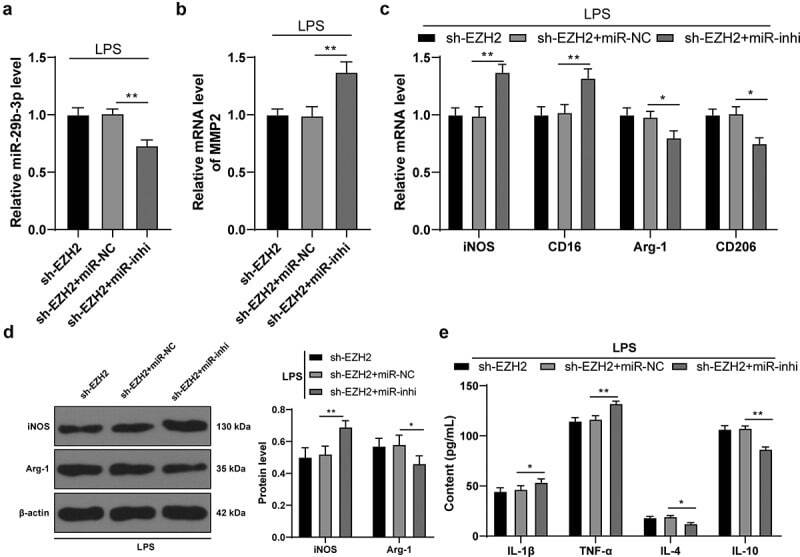
- Figure 6. Inhibition of miR-29b-3p expression mitigates the role of EZH2 silencing in LPS-induced microglia polarization. miR-29b-3p inhibitor was transfected into the microglia in the sh-EZH2 group, with the sh-NC as the control. (a) miR-29b-3p expression assessed by RT-qPCR. (b) Transcription levels of MMP2 detected by RT-qPCR. (c) mRNA levels of iNOS, CD16, Arg-1 and CD206 detected by RT-qPCR. (d) Protein levels of iNOS and Arg-1 determined by Western blot analysis. E, contents of IL-1beta, TNF-alpha, IL-4 and IL-10 measured by ELISA. The experiment was performed 3 times. The results were presented as mean +- standard deviation. One-way ANOVA was used to analyze the data in panels A and B. Two-way ANOVA was used to analyze the data in panels C, D and E. Tukey's multiple comparisons test was applied for post hoc test. * p < 0.05, ** p < 0.01.
- Submitted by
- Invitrogen Antibodies (provider)
- Main image
- Experimental details
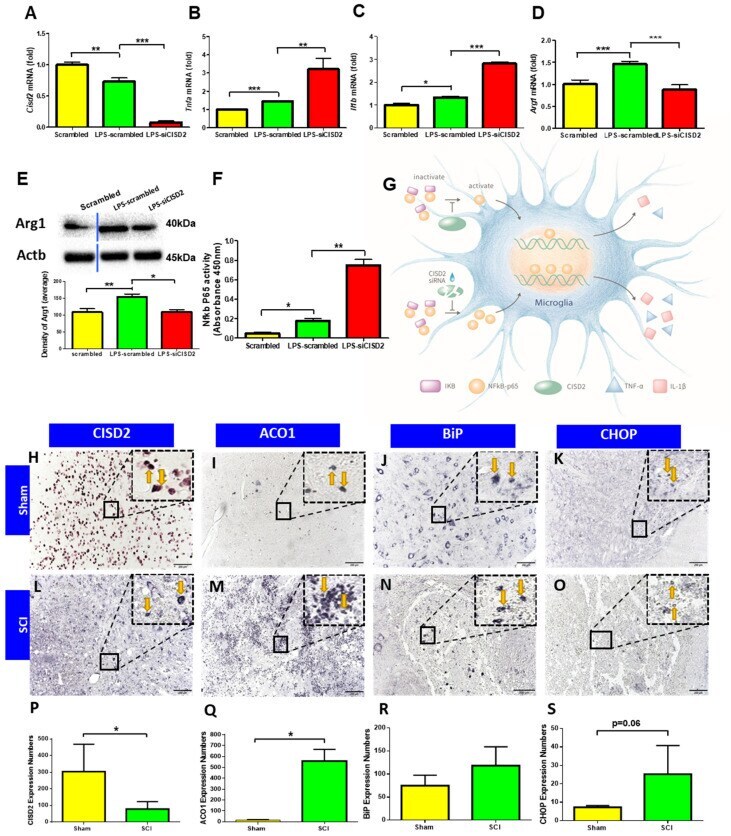
- Figure 5 siCISD2-mediated Cisd2 knockdown exacerbated the inflammatory response, promoted proinflammatory M1 phenotype, and enhanced NF-kappaB p65 nuclear translocation in EOC microglial cells. ( A ) At 8 h post-lipopolysaccharide (LPS) treatment, Cisd2 mRNA expression was decreased in the LPS-stimulated EOC microglial cells. The mRNA expression levels of Tnfa ( B ) and Il1b ( C ) were higher and the mRNA ( D ) and protein expression ( E ) levels of Arg1 (M2 microglial cell marker) were lower in the siCISD2-transfected LPS-stimulated microglial cells than in the scrambled RNA-transfected LPS-stimulated microglial cells. The upper panel in ( E ) indicates a representative immunoblot of the protein expression of Arg1 (40 kDa). Actb (45 kDa) was used as an internal control. ( F ) The results of the enzyme-linked immunosorbent assay (ELISA) revealed that LPS enhanced the DNA-binding activity of NF-kappaB p65 subunit upon Cisd2 knockdown. Vertical bars indicate mean +- standard error of mean of mRNA ( n = 3 for each group), protein ( n = 3 for each group), and ELISA ( n = 3 for each group) analysis results. * p < 0.05, ** p < 0.01, and *** p < 0.001 (pair-wise multiple comparisons between groups were performed using the Newman-Keuls test). ( G ) Schematic diagram of the mechanism underlying the regulation of the IkappaB/NF-kappaB signaling pathway by CISD2 through its anti-inflammatory effects in the microglia. The downregulation of CISD2 suppresses the inhibitory effects of CISD2
- Submitted by
- Invitrogen Antibodies (provider)
- Main image
- Experimental details
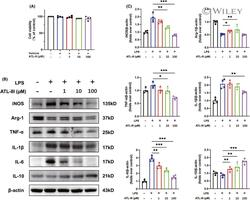
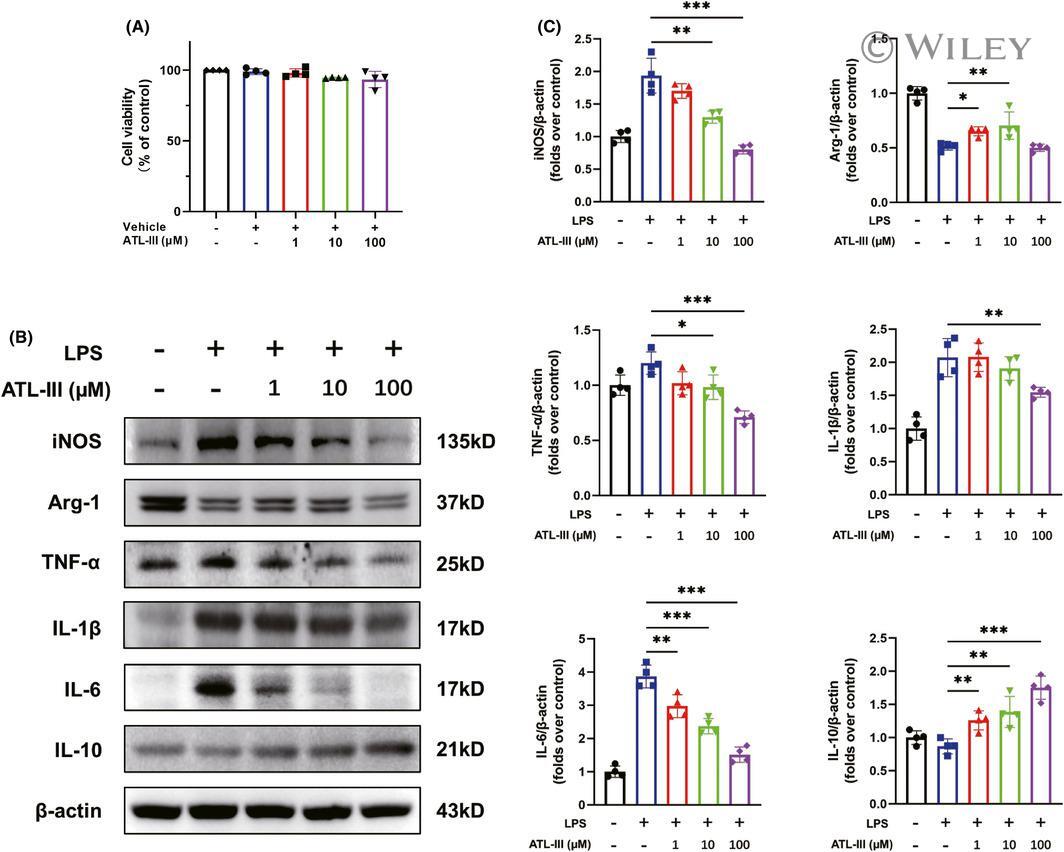
- 6 FIGURE ATL-III regulates the M1/M2 phenotype and the expression of corresponding inflammatory factors after LPS stimulation in microglia. (A) The viability of BV2 cells, as measured by the CCK-8 assay. (B) Western blot analysis of iNOS, Arg-1, inflammatory mediator (TNF-alpha, IL-1beta and IL-6), IL-10 and beta-actin expression. (C) Quantitative analysis of the protein expression levels in microglia. The data are presented as the mean +- SD ( n = 4). * p < 0.05, ** p < 0.01, *** p < 0.001 compared with the control group
- Submitted by
- Invitrogen Antibodies (provider)
- Main image
- Experimental details
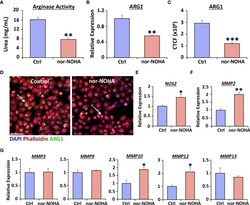
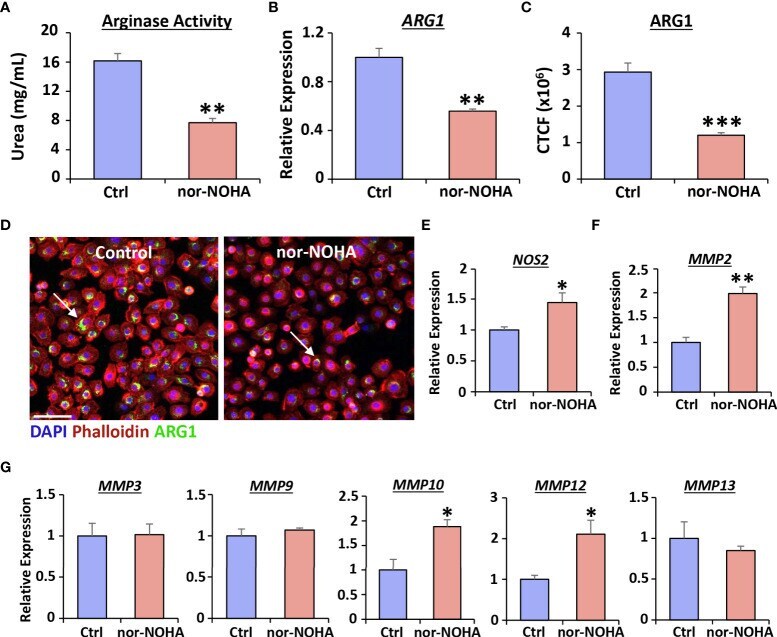
- Nor-NOHA inhibits Arginase 1 and alters cytokine expression in human vaginal epithelial cells. An arginase activity assay was performed in VK2 cells following 24hr exposure to nor-NOHA (A) . Arginase 1 (ARG1) was assessed via qRT-PCR (B) and immunofluorescence (C) . CTCF = corrected total cell fluorescence. Images in (D) ARG1 = Alexa Fluor 488. Rhodamine phalloidin = cytoskeleton. DAPI = cell nuclei. Bar = 100 um. qRT-PCR for NOS2 (E) , MMP2 (F) and other MMPs shown (G) . Mean +/- SEM. Independent t tests performed. *= P < 0.05, **= P < 0.01 and ***= P < 0.001.
- Submitted by
- Invitrogen Antibodies (provider)
- Main image
- Experimental details
- Figure 4. Blocking CSF-1R inhibits proliferation of endometrial cancer cells. (A) Immunofluorescence staining of M1 macrophage (iNOS and CD86) and M2 macrophage (Arg-1 and CD206) in U937 cell lines, co-cultured with ECC-1/HEC-1A cell lines and treated with 100 U/ml M-CSF. (B) Cell counting kit-8 assay found that U937 cells could promote ECC-1 and HEC-1A cell proliferation. Additionally, the CSF-1R inhibitor PLX3397 (10 uM) inhibits proliferation of ECC-1 and HEC-1A cells in the co-culture system. (C) Immunofluorescence staining of Ki67 detecting EC cell proliferation. Data are presented as the mean +- standard deviation from 5 independent experiments; *P

- Submitted by
- Invitrogen Antibodies (provider)
- Main image
- Experimental details
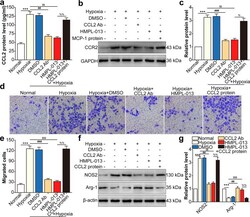
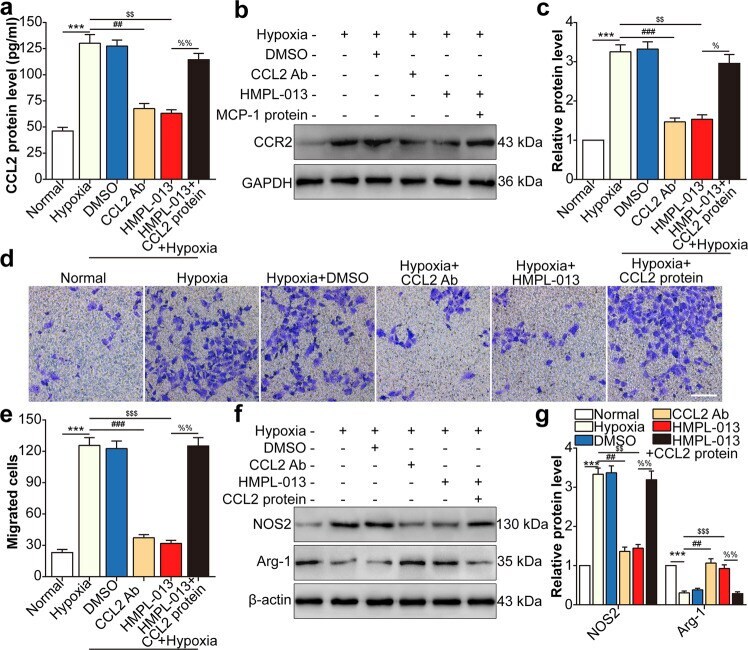
- Fig. 7 HMPL-013 inhibits HCVECs derived CCL2-induced macrophage migration and M1 polarization. HCVECs were randomly assigned into six groups: normal, hypoxia (24 h), hypoxia + DMSO, hypoxia + CCL2-neutralizing antibody (5 mug/mL for 30 min), hypoxia + HMPL-013, and hypoxia + HMPL-013 + recombinant mouse CCL2 protein (100 ng/mL for 24 h). a ELISA was done to detect CCL2 protein level in the macrophage culture supernatant. *** P < 0.005 vs. normal group; ## P < 0.01 and $$ P < 0.01 vs. hypoxia group; %% P < 0.01 vs. hypoxia + HMPL-013 group. b Western blot was done to detect CCR2 protein level in the macrophage lysates. c Densitometry values of CCR2 normalized to GAPDH. *** P < 0.005 vs. normal group; ### P < 0.005 and $$ P < 0.01 vs. hypoxia group; % P < 0.05 vs. hypoxia + HMPL-013 group. d Transwell assay was done to detect macrophage migration. e The average number of migrated macrophages was analyzed. f Western blot was done to detect NOS2 and Arg1 protein level in the macrophage lysates. g Densitometry values of each molecule normalized to GAPDH. *** P < 0.005 vs. normal group; ## P < 0.01, $$$ P < 0.005, and $$ P < 0.01 vs. hypoxia group; %% P < 0.01 vs. hypoxia + HMPL-013 group. n = 4 in each group.
- Submitted by
- Invitrogen Antibodies (provider)
- Main image
- Experimental details
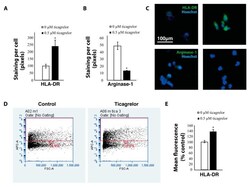
- Figure 5 Ticagrelor increases the expression of anti-tumoral markers. ( A ) Area of positive staining with HLA-DR antibodies in THP1 macrophages treated with ticagrelor and controls. ( B ) Area of positive staining with arginase-1 antibodies in THP1 macrophages treated with ticagrelor and controls. ( C ) Representative images of THP1 macrophages stained with HLA-DR and arginase-1 antibodies. ( D ) Flow cytometry analysis of HLA-DR expression in THP1 macrophages treated with ticagrelor ( E ) Quantification of the flow cytometry analyses * = p < 0.05.
