Explore
 Validate
 Learn
Learn Western blot
 Immunocytochemistry
Antibody data
- Antibody Data
- Antigen structure
- References [20]
- Comments [0]
- Validations
- Immunocytochemistry [3]
- Other assay [17]
Submit
Validation data
Reference
Comment
Report error
- Product number
- 38-9100 - Provider product page

- Provider
- Invitrogen Antibodies
- Product name
- ZO-2 Polyclonal Antibody
- Antibody type
- Polyclonal
- Antigen
- Synthetic peptide
- Reactivity
- Human, Mouse, Rat, Canine
- Host
- Rabbit
- Isotype
- IgG
- Vial size
- 100 µg
- Concentration
- 0.25 mg/mL
- Storage
- -20°C
Submitted references Glycine represses endoplasmic reticulum stress-related apoptosis and improves intestinal barrier by activating mammalian target of rapamycin complex 1 signaling.
Angulin-1 seals tricellular contacts independently of tricellulin and claudins.
Quercetin Alleviates Oxidative Damage by Activating Nuclear Factor Erythroid 2-Related Factor 2 Signaling in Porcine Enterocytes.
Exosome-Mediated Crosstalk between Keratinocytes and Macrophages in Cutaneous Wound Healing.
The effect of endurance training and testosterone supplementation on the expression of blood spinal cord barrier proteins in rats.
Claudins and JAM-A coordinately regulate tight junction formation and epithelial polarity.
MARCKS-related protein regulates cytoskeletal organization at cell-cell and cell-substrate contacts in epithelial cells.
Apical surface supracellular mechanical properties in polarized epithelium using noninvasive acoustic force spectroscopy.
Epidermal E-Cadherin Dependent β-Catenin Pathway Is Phytochemical Inducible and Accelerates Anagen Hair Cycling.
Knockdown of long non-coding RNA XIST increases blood-tumor barrier permeability and inhibits glioma angiogenesis by targeting miR-137.
Visualizing the dynamic coupling of claudin strands to the actin cytoskeleton through ZO-1.
Claudin-2 knockout by TALEN-mediated gene targeting in MDCK cells: claudin-2 independently determines the leaky property of tight junctions in MDCK cells.
A complex of ZO-1 and the BAR-domain protein TOCA-1 regulates actin assembly at the tight junction.
ZO-1 knockout by TALEN-mediated gene targeting in MDCK cells: involvement of ZO-1 in the regulation of cytoskeleton and cell shape.
Lipopolysaccharide precipitates hepatic encephalopathy and increases blood-brain barrier permeability in mice with acute liver failure.
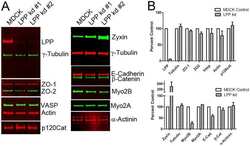
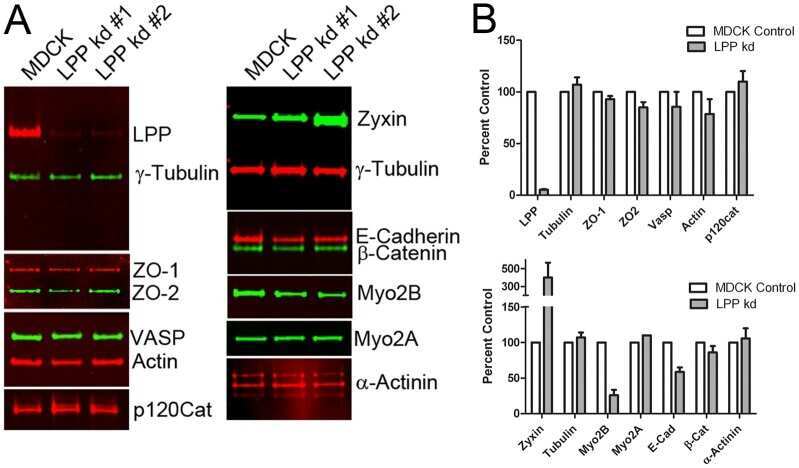
Biotin ligase tagging identifies proteins proximal to E-cadherin, including lipoma preferred partner, a regulator of epithelial cell-cell and cell-substrate adhesion.
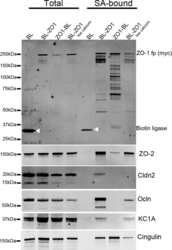
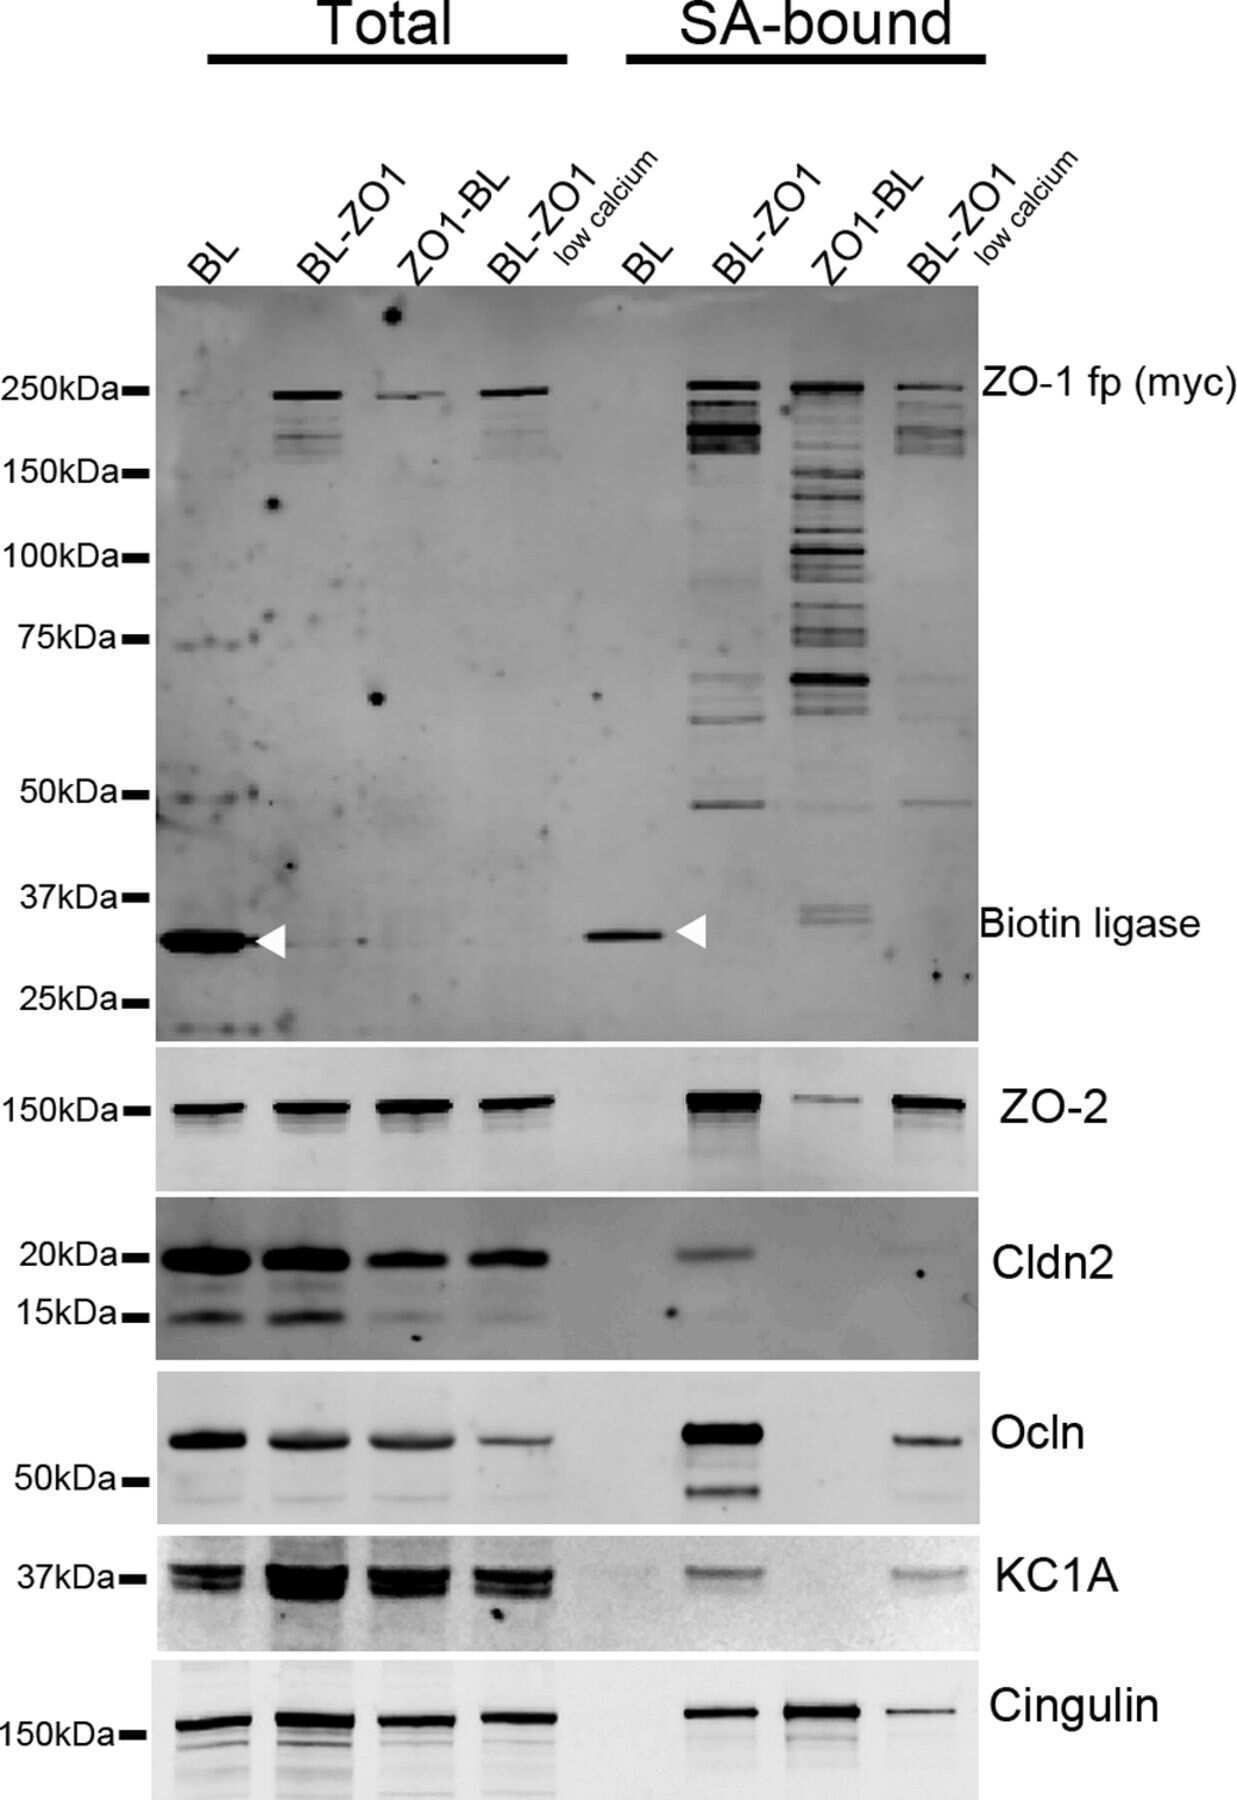
The N and C termini of ZO-1 are surrounded by distinct proteins and functional protein networks.
Zonula occludens-1 and -2 regulate apical cell structure and the zonula adherens cytoskeleton in polarized epithelia.
CD44 regulates tight-junction assembly and barrier function.
An immunochemical marker for goldfish Mauthner cells.
Yang Y, Fan X, Ji Y, Li J, Dai Z, Wu Z
Animal nutrition (Zhongguo xu mu shou yi xue hui) 2022 Mar;8(1):1-9
Animal nutrition (Zhongguo xu mu shou yi xue hui) 2022 Mar;8(1):1-9
Angulin-1 seals tricellular contacts independently of tricellulin and claudins.
Sugawara T, Furuse K, Otani T, Wakayama T, Furuse M
The Journal of cell biology 2021 Sep 6;220(9)
The Journal of cell biology 2021 Sep 6;220(9)
Quercetin Alleviates Oxidative Damage by Activating Nuclear Factor Erythroid 2-Related Factor 2 Signaling in Porcine Enterocytes.
Jia H, Zhang Y, Si X, Jin Y, Jiang D, Dai Z, Wu Z
Nutrients 2021 Jan 26;13(2)
Nutrients 2021 Jan 26;13(2)
Exosome-Mediated Crosstalk between Keratinocytes and Macrophages in Cutaneous Wound Healing.
Zhou X, Brown BA, Siegel AP, El Masry MS, Zeng X, Song W, Das A, Khandelwal P, Clark A, Singh K, Guda PR, Gorain M, Timsina L, Xuan Y, Jacobson SC, Novotny MV, Roy S, Agarwal M, Lee RJ, Sen CK, Clemmer DE, Ghatak S
ACS nano 2020 Oct 27;14(10):12732-12748
ACS nano 2020 Oct 27;14(10):12732-12748
The effect of endurance training and testosterone supplementation on the expression of blood spinal cord barrier proteins in rats.
Nierwińska K, Nowacka-Chmielewska M, Bernacki J, Jagsz S, Chalimoniuk M, Langfort J, Małecki A
PloS one 2019;14(2):e0211818
PloS one 2019;14(2):e0211818
Claudins and JAM-A coordinately regulate tight junction formation and epithelial polarity.
Otani T, Nguyen TP, Tokuda S, Sugihara K, Sugawara T, Furuse K, Miura T, Ebnet K, Furuse M
The Journal of cell biology 2019 Oct 7;218(10):3372-3396
The Journal of cell biology 2019 Oct 7;218(10):3372-3396
MARCKS-related protein regulates cytoskeletal organization at cell-cell and cell-substrate contacts in epithelial cells.
Van Itallie CM, Tietgens AJ, Aponte A, Gucek M, Cartagena-Rivera AX, Chadwick RS, Anderson JM
Journal of cell science 2018 Feb 2;131(3)
Journal of cell science 2018 Feb 2;131(3)
Apical surface supracellular mechanical properties in polarized epithelium using noninvasive acoustic force spectroscopy.
Cartagena-Rivera AX, Van Itallie CM, Anderson JM, Chadwick RS
Nature communications 2017 Oct 18;8(1):1030
Nature communications 2017 Oct 18;8(1):1030
Epidermal E-Cadherin Dependent β-Catenin Pathway Is Phytochemical Inducible and Accelerates Anagen Hair Cycling.
Ahmed NS, Ghatak S, El Masry MS, Gnyawali SC, Roy S, Amer M, Everts H, Sen CK, Khanna S
Molecular therapy : the journal of the American Society of Gene Therapy 2017 Nov 1;25(11):2502-2512
Molecular therapy : the journal of the American Society of Gene Therapy 2017 Nov 1;25(11):2502-2512
Knockdown of long non-coding RNA XIST increases blood-tumor barrier permeability and inhibits glioma angiogenesis by targeting miR-137.
Yu H, Xue Y, Wang P, Liu X, Ma J, Zheng J, Li Z, Li Z, Cai H, Liu Y
Oncogenesis 2017 Mar 13;6(3):e303
Oncogenesis 2017 Mar 13;6(3):e303
Visualizing the dynamic coupling of claudin strands to the actin cytoskeleton through ZO-1.
Van Itallie CM, Tietgens AJ, Anderson JM
Molecular biology of the cell 2017 Feb 15;28(4):524-534
Molecular biology of the cell 2017 Feb 15;28(4):524-534
Claudin-2 knockout by TALEN-mediated gene targeting in MDCK cells: claudin-2 independently determines the leaky property of tight junctions in MDCK cells.
Tokuda S, Furuse M
PloS one 2015;10(3):e0119869
PloS one 2015;10(3):e0119869
A complex of ZO-1 and the BAR-domain protein TOCA-1 regulates actin assembly at the tight junction.
Van Itallie CM, Tietgens AJ, Krystofiak E, Kachar B, Anderson JM
Molecular biology of the cell 2015 Aug 1;26(15):2769-87
Molecular biology of the cell 2015 Aug 1;26(15):2769-87
ZO-1 knockout by TALEN-mediated gene targeting in MDCK cells: involvement of ZO-1 in the regulation of cytoskeleton and cell shape.
Tokuda S, Higashi T, Furuse M
PloS one 2014;9(8):e104994
PloS one 2014;9(8):e104994
Lipopolysaccharide precipitates hepatic encephalopathy and increases blood-brain barrier permeability in mice with acute liver failure.
Chastre A, Bélanger M, Nguyen BN, Butterworth RF
Liver international : official journal of the International Association for the Study of the Liver 2014 Mar;34(3):353-61
Liver international : official journal of the International Association for the Study of the Liver 2014 Mar;34(3):353-61
Biotin ligase tagging identifies proteins proximal to E-cadherin, including lipoma preferred partner, a regulator of epithelial cell-cell and cell-substrate adhesion.
Van Itallie CM, Tietgens AJ, Aponte A, Fredriksson K, Fanning AS, Gucek M, Anderson JM
Journal of cell science 2014 Feb 15;127(Pt 4):885-95
Journal of cell science 2014 Feb 15;127(Pt 4):885-95
The N and C termini of ZO-1 are surrounded by distinct proteins and functional protein networks.
Van Itallie CM, Aponte A, Tietgens AJ, Gucek M, Fredriksson K, Anderson JM
The Journal of biological chemistry 2013 May 10;288(19):13775-88
The Journal of biological chemistry 2013 May 10;288(19):13775-88
Zonula occludens-1 and -2 regulate apical cell structure and the zonula adherens cytoskeleton in polarized epithelia.
Fanning AS, Van Itallie CM, Anderson JM
Molecular biology of the cell 2012 Feb;23(4):577-90
Molecular biology of the cell 2012 Feb;23(4):577-90
CD44 regulates tight-junction assembly and barrier function.
Kirschner N, Haftek M, Niessen CM, Behne MJ, Furuse M, Moll I, Brandner JM
The Journal of investigative dermatology 2011 Apr;131(4):932-43
The Journal of investigative dermatology 2011 Apr;131(4):932-43
An immunochemical marker for goldfish Mauthner cells.
Flores CE, Ene S, Pereda AE
Journal of neuroscience methods 2008 Oct 30;175(1):64-9
Journal of neuroscience methods 2008 Oct 30;175(1):64-9
No comments: Submit comment
Supportive validation
- Submitted by
- Invitrogen Antibodies (provider)
- Main image
- Experimental details
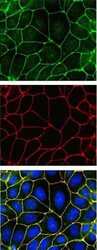
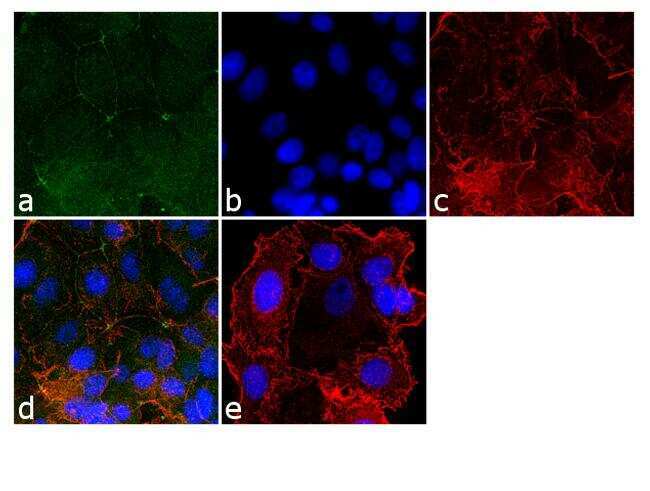
- Indirect immunofluorescence staining of MDCK II cells demonstrating co-localization (bottom, in yellow) of ZO-2 (top, in green) and ZO-1 (middle, in red) using Zymed (R) Rb anti-ZO-2 (C-term) (Product # 38-9100). Nuclei are stained with DAPI (blue). Image courtesy of Jacey Bennis and Dr. James Anderson, University of North Carolina at Chapel Hill, NC.
- Submitted by
- Invitrogen Antibodies (provider)
- Main image
- Experimental details
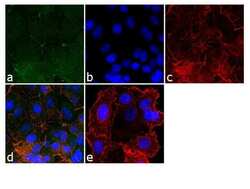
- Immunofluorescence analysis of ZO-2/TJP2 was done on 90% confluent log phase MCF-7 cells. The cells were fixed with 4% paraformaldehyde for 10 minutes, permeabilized with 0.1% Triton™ X-100 for 10 minutes, and blocked with 1% BSA for 1 hour at room temperature. The cells were labeled with ZO-2/TJP2 Rabbit Polyclonal Antibody (Product # 38-9100) at 2 µg/mL in 0.1% BSA and incubated for 3 hours at room temperature and then labeled with Goat anti-Rabbit IgG (H+L) Superclonal™ Secondary Antibody, Alexa Fluor® 488 conjugate (Product # A27034) at a dilution of 1:2000 for 45 minutes at room temperature (Panel a: green). Nuclei (Panel b: blue) were stained with SlowFade® Gold Antifade Mountant with DAPI (Product # S36938). F-actin (Panel c: red) was stained with Alexa Fluor® 555 Rhodamine Phalloidin (Product # R415, 1:300). Panel d is a merged image showing cell junction localization. Panel e is a no primary antibody control. The images were captured at 60X magnification.
- Submitted by
- Invitrogen Antibodies (provider)
- Main image

- Experimental details
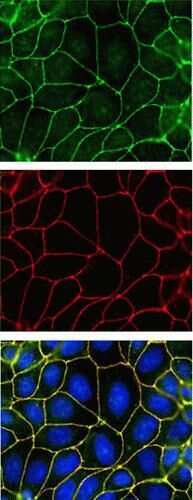
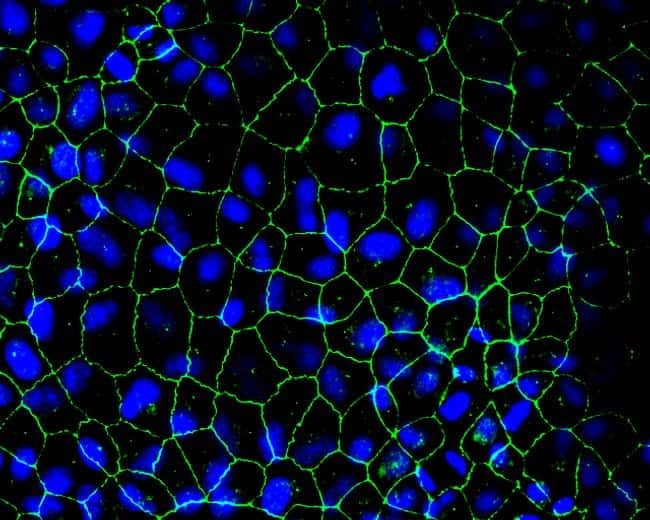
- Immunofluorescent detection of Zo-2 in MDCK cells. Confluent monolayers were fixed in 50%methanol/50%Acetone, blocked for at least 30 minutes in 1% BSA then incubated 2 hours with a Zo-2 rabbit polyclonal antibody (Product # 38-9100) at 2.5 µg/mL, washed, then incubated 1 hour with Alexa Fluor 488 conjugated Donkey anti-Rabbit secondary antibody (Product # A-21206) at 1:2000 dilution. Cells were counterstained with DAPI (blue). Coverslips were mounted with Prolong Gold Antifade reagent (Product # P36930) and imaged at 40X. Images generated by Joell Solan in Paul Lampe Lab at the Fred Hutchinson cancer Research Center.
Supportive validation
- Submitted by
- Invitrogen Antibodies (provider)
- Main image
- Experimental details
- NULL
- Submitted by
- Invitrogen Antibodies (provider)
- Main image
- Experimental details
- NULL
- Submitted by
- Invitrogen Antibodies (provider)
- Main image
- Experimental details
- NULL
- Submitted by
- Invitrogen Antibodies (provider)
- Main image

- Experimental details
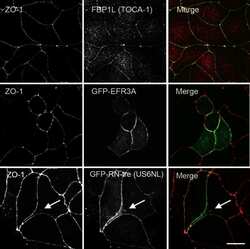
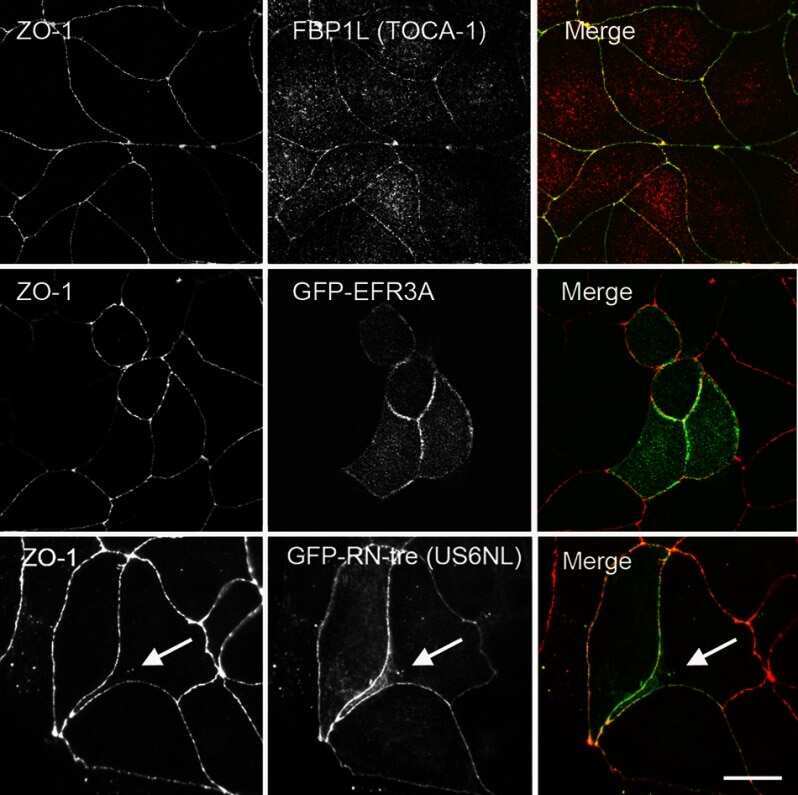
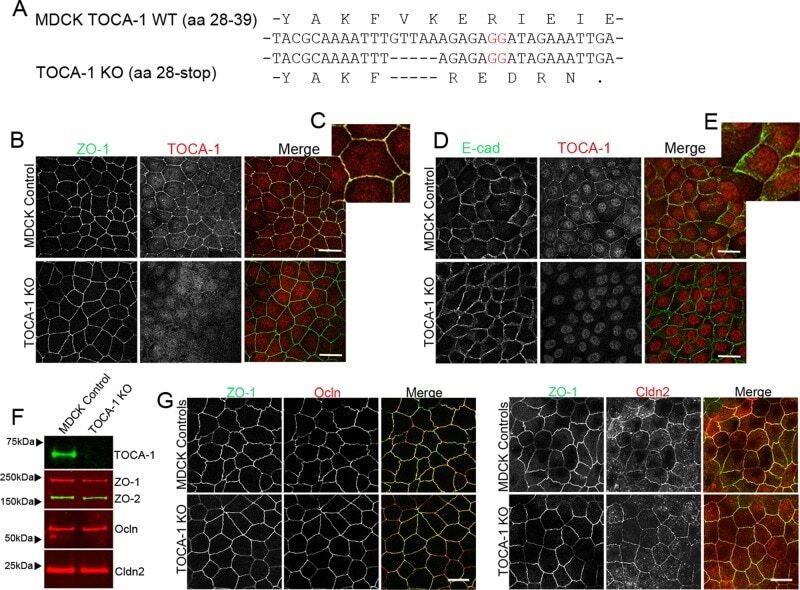
- FIGURE 3: CRISPR-mediated knockout of TOCA-1 does not alter levels or localization of tight or adherens junction proteins. (A) Sequencing of PCR products amplified from genomic MDCK cell DNA in a region around the site of the putative CRISPR-mediated showed knockout cells had a 5-base pair deletion upstream of the PAM site (red GG) relative to wild-type DNA, resulting in a frameshift in the coding sequence and a premature stop codon at amino acid 36. (B) Comparison of expression by immunofluorescence analysis demonstrates that ZO-1 signal is identical in control and knockout cells (left and right). Junctional TOCA-1 staining is evident only in control cells, although the polyclonal TOCA-1 antibody generates some background signal in knockout cells (middle). (C) Enlargement of control ZO-1 and TOCA-1 staining reveals strong junctional colocalization (yellow signal). (D) E-cadherin (Ecad) localization is similar in control (top) and knockout cell lines (bottom). (E) In contrast to clear colocalization of TOCA-1 with ZO-1, enlargement of merge image between E-cadherin and TOCA-1 reveals that most E-cadherin is distributed along the lateral membrane, with little of the yellow signal suggestive of colocalization that is evident in C. Immunoblot (F) and immunofluorescence (G) analyses used to compare expression and localization of TOCA-1 and tight junction proteins in control and TOCA-1-knockout cell lines. Cldn2, claudin-2; Ocln, occludin. Bar, 15 mum.
- Submitted by
- Invitrogen Antibodies (provider)
- Main image
- Experimental details
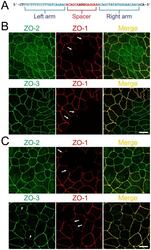
- Figure 1 Construction of TALENs and ZO-1 gene knockout in MDCK I and II cells. (A) TALEN binding sites in the ZO-1 gene. The left and right arms of TALEN targeting sites are indicated in blue and the spacer region is indicated in red. The initiation codon within the spacer region is highlighted. (B) Immunofluorescence microscopic analysis of ZO-1, ZO-2 and ZO-3 in MDCK II cells transfected with TALEN constructs for ZO-1 gene knockout. After transfection, cells were subcultured on filter inserts for 4 d before analysis. At the boundary of control and ZO-1 knockout cells, characteristic convex curves of cell-cell junctions are observed ( arrows ). (C) Immunofluorescence microscopic analysis of ZO-1, ZO-2 and ZO-3 in MDCK I cells transfected with TALEN constructs for ZO-1 gene knockout. Similar morphological changes of cell-cell junctions at the boundary of control and ZO-1 knockout cells were observed in MDCK I cells. Staining of ZO-3 was reduced in ZO-1 knockout cells ( arrowheads ). Scale bars, 10 um.
- Submitted by
- Invitrogen Antibodies (provider)
- Main image
- Experimental details
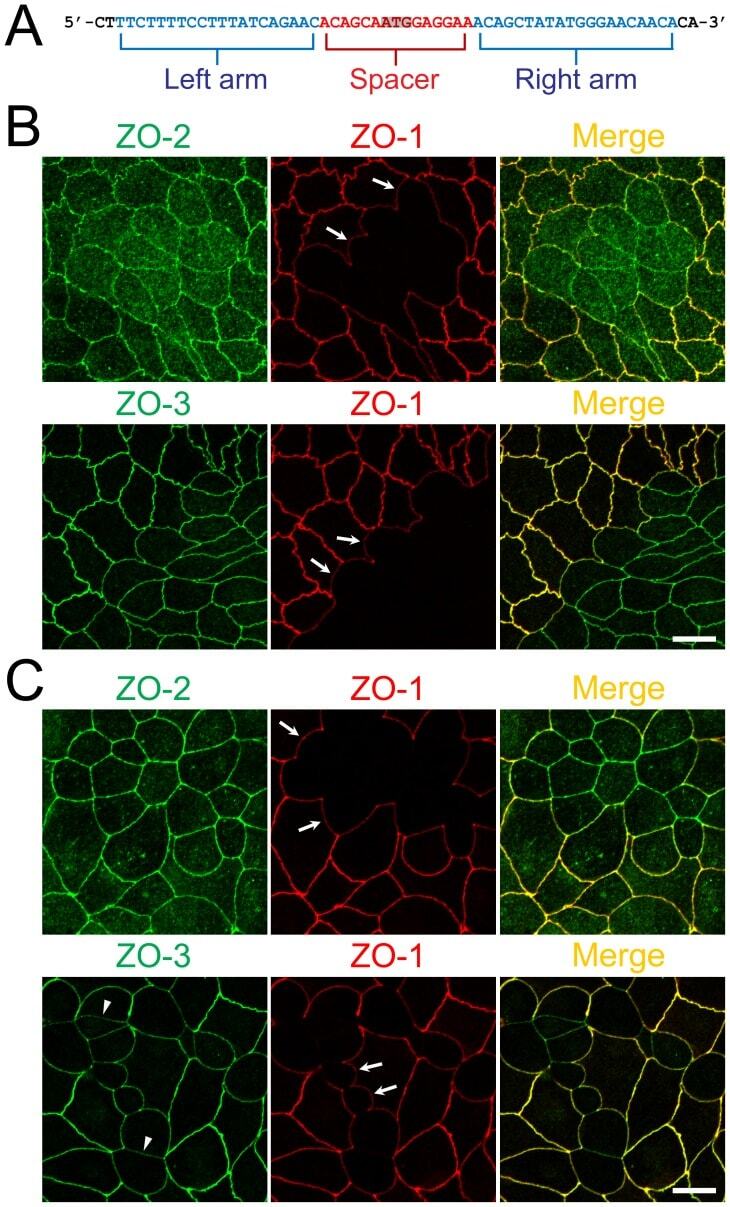
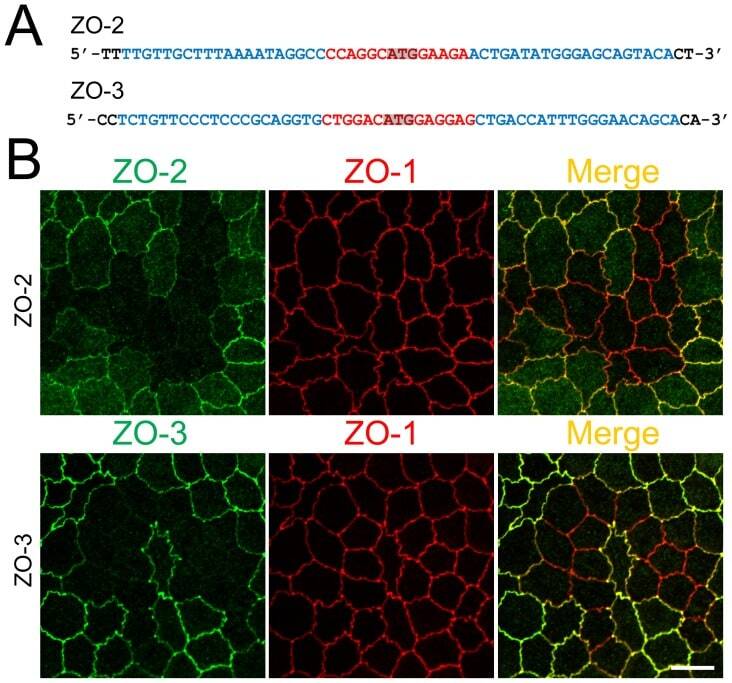
- Figure 3 Knockout of ZO-2 or ZO-3 in MDCK II cells. (A) TALEN binding sites in ZO-2 and ZO-3 genes. The left and right arms of TALEN targeting sites are indicated in blue and the spacer region is indicated in red. The initiation codon within the spacer region is highlighted. (B) Immunofluorescence microscopic analysis of ZO proteins in MDCK II cells transfected with TALEN constructs for ZO-2 or ZO-3 gene knockout. The shape of cell-cell junctions was unchanged by ZO-2 knockout (upper panels) and ZO-3 knockout (lower panels). Scale bar, 10 um.
- Submitted by
- Invitrogen Antibodies (provider)
- Main image
- Experimental details
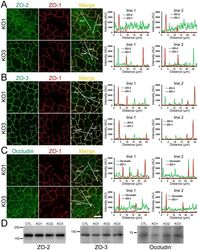
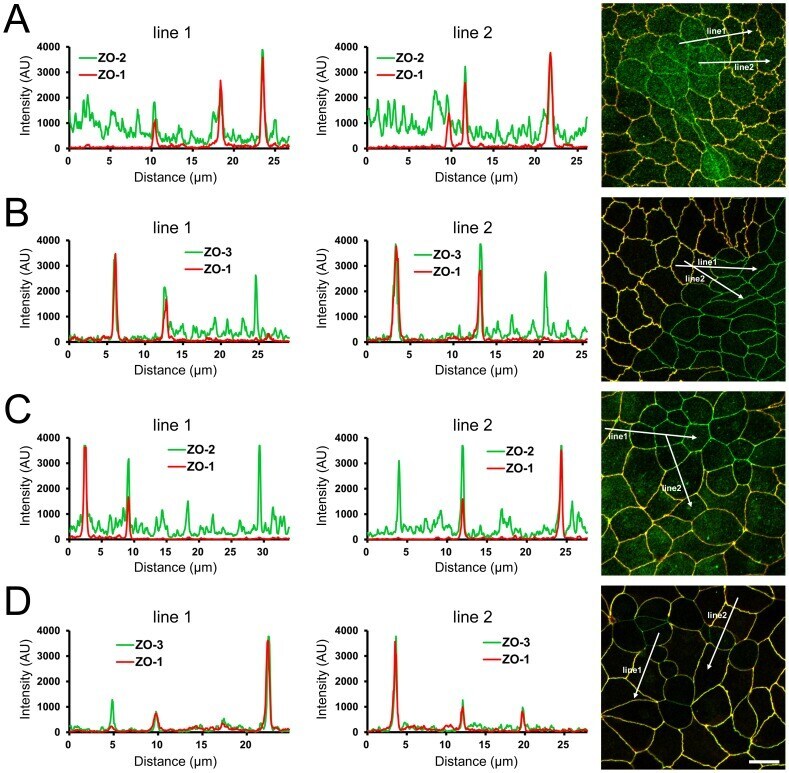
- Figure 6 Effects of ZO-1 knockout on the localization of ZO-2, ZO-3 and occludin in the stable ZO-1 knockout clones. (A) Immunofluorescence microscopic analysis and line scanning of ZO-1 and ZO-2 in ZO-1 knockout clones 1 (KO 1) and 3 (KO 3) co-cultured with control cells. ZO-2 fluorescent signal at TJs was reduced in KO 1 but was slightly increased in KO 3. (B) Immunofluorescence microscopic analysis and line scanning of ZO-1 and ZO-3. ZO-3 signal at TJs was reduced but was increased in the cytoplasm in both of ZO-1 knockout clones compared to co-cultured control cells. (C) Immunofluorescence microscopic analysis and line scanning of ZO-1 and occludin. Occludin signal at TJs was reduced in both of ZO-1 knockout clones compared to co-cultured control cells. Scale bar, 10 um. (D) Immunoblots of ZO-2, ZO-3 and occludin in control MDCK II cells and ZO-1 knockout clones. Similar expression levels of ZO-2, ZO-3 and occludin were observed in control cells and knockout clones.
- Submitted by
- Invitrogen Antibodies (provider)
- Main image
- Experimental details
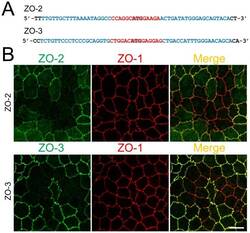
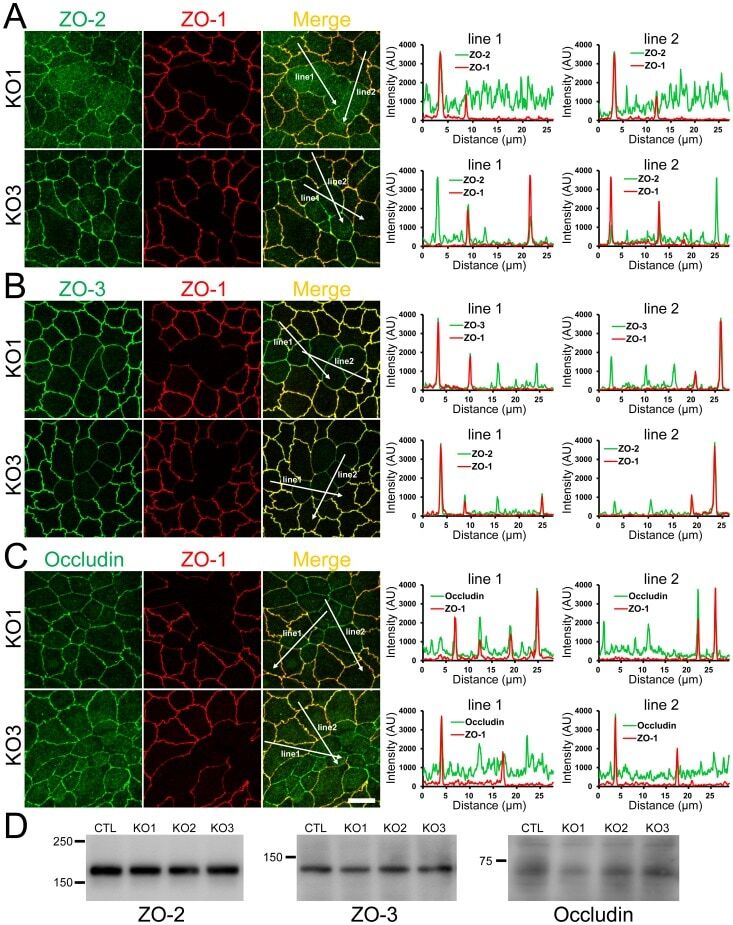
- Figure 2 Effects of ZO-1 knockout on the localization of ZO-2 and ZO-3. (A) Effects of ZO-1 knockout on the localization of ZO-2 in MDCK II cells. The images in Figure 1 were used for the analysis. Signal intensity of ZO-2 and ZO-1 on lines shown in confocal microscopic image ( arrows ) were analyzed. ZO-2 fluorescent signal at TJs was reduced but was increased in the cytoplasm of ZO-1 knockout cells. (B) Effects of ZO-1 knockout on the localization of ZO-3 in MDCK II cells. ZO-3 fluorescent signal at TJs was slightly reduced but was increased in the cytoplasm of ZO-1 knockout cells. (C) Effects of ZO-1 knockout on the localization of ZO-2 in MDCK I cells. ZO-2 fluorescent signal was not altered in ZO-1 knockout MDCK I cells. (D) Effects of ZO-1 knockout on the localization of ZO-3 in MDCK I cells. ZO-3 fluorescent signal at TJs was markedly reduced in ZO-1 knockout MDCK I cells. Scale bar, 10 um.
- Submitted by
- Invitrogen Antibodies (provider)
- Main image
- Experimental details
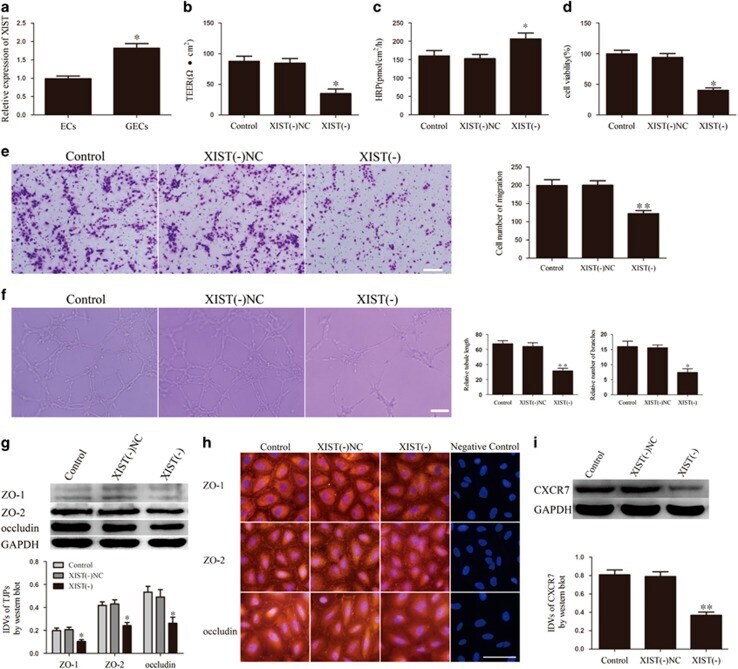
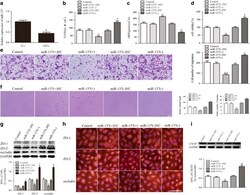
- Figure 1 XIST expression in GECs and XIST regulated BTB permeability, glioma angiogenesis, tight junction-related proteins and CXCR7 expression. ( a ) Relative XIST expression in ECs and GECs by real-time qPCR. Data represent mean+-s.d. ( n =5, each). * P
- Submitted by
- Invitrogen Antibodies (provider)
- Main image

- Experimental details
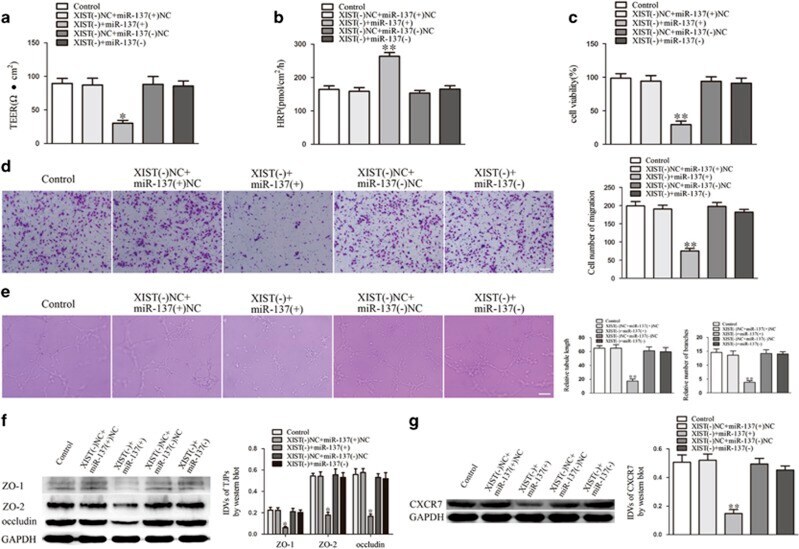
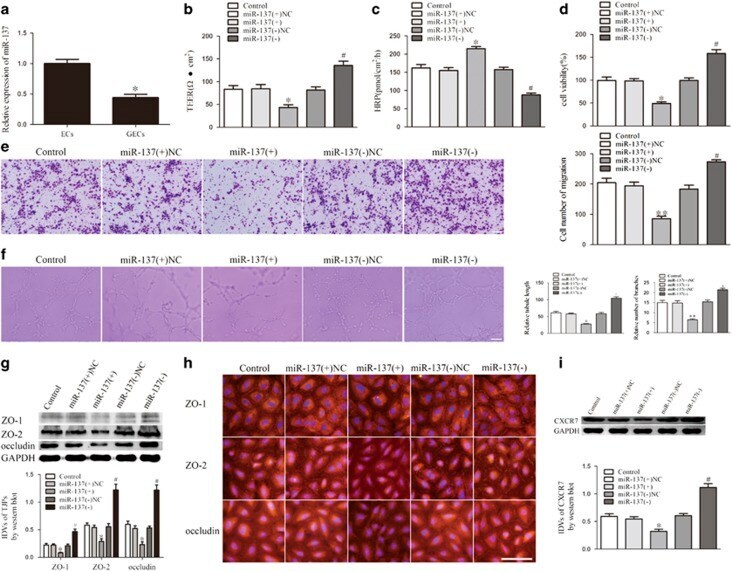
- Figure 3 miR-137 mediated the effects of XIST knockdown on GECs. ( a ) TEER assay to evaluate the effect of XIST and miR-137 on BTB integrity. ( b ) HRP flux assay to evaluate the effect of XIST and miR-137 on BTB permeability. ( c ) Cell Counting Kit-8 (CCK-8) assay to evaluate the effect of XIST and miR-137 on GECs proliferation. ( d ) Transwell assay to evaluate the effect of XIST and miR-137 on GECs migration. ( e ) Matrigel tube formation assay to evaluate the effect of XIST and miR-137 on GECs tube formation. ( f ) Western blot assay to evaluate the effect of XIST and miR-137 on tight junction-related proteins. ( g ) Western blot assay to evaluate the effect of XIST and miR-137 on CXCR7. Data represent mean+-s.d. ( n =5, each). * P
- Submitted by
- Invitrogen Antibodies (provider)
- Main image
- Experimental details
- Figure 4 miR-137 expression in GECs and miR-137 regulated BTB permeability, glioma angiogenesis, tight junction-related proteins and CXCR7 expression. ( a ) Relative miR-137 expression in ECs and GECs by real-time quantitative PCR. Data represent mean+-s.d. ( n =5, each). * P
- Submitted by
- Invitrogen Antibodies (provider)
- Main image
- Experimental details
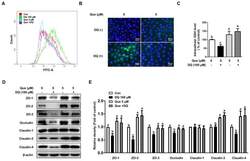
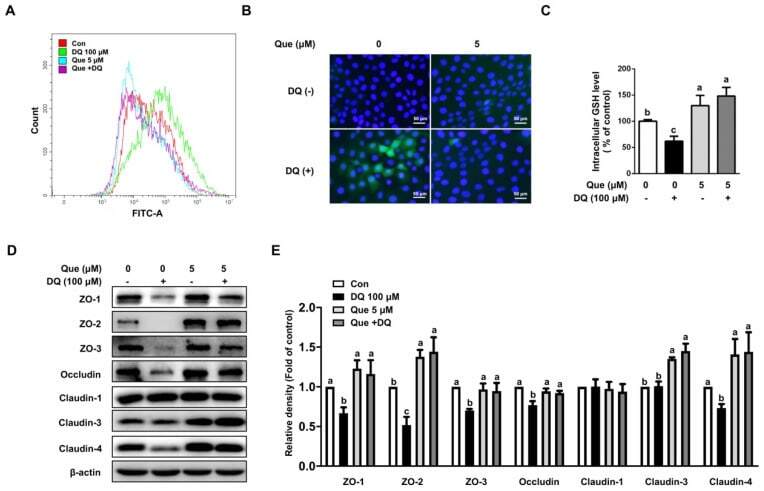
- Figure 3 Quercetin attenuated diquat-induced ROS accumulation and reduced protein abundance of tight junction proteins in IPEC-1 cells. IPEC-1 cells were treated as described in Figure 2 . ( A ) DCFH-DA-positive populations were detected by flow cytometry analysis. ( B ) Intracellular ROS levels were determined by fluorescence microscope (magnification x200). ( C ) Intracellular GSH levels were measured. ( D , E ) Protein abundance for ZO-1, ZO-2, ZO-3, occludin, claudin-1, claudin-3, and claudin-4 were determined and analyzed by the Western blot assay. beta-actin was used as the loading control. Representative experimental results were repeated in three independent experiments and values are means +- SEMs, n = 3. Means without a common letter are considered as a significant difference, p < 0.05.
- Submitted by
- Invitrogen Antibodies (provider)
- Main image
- Experimental details
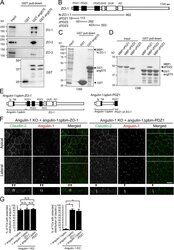
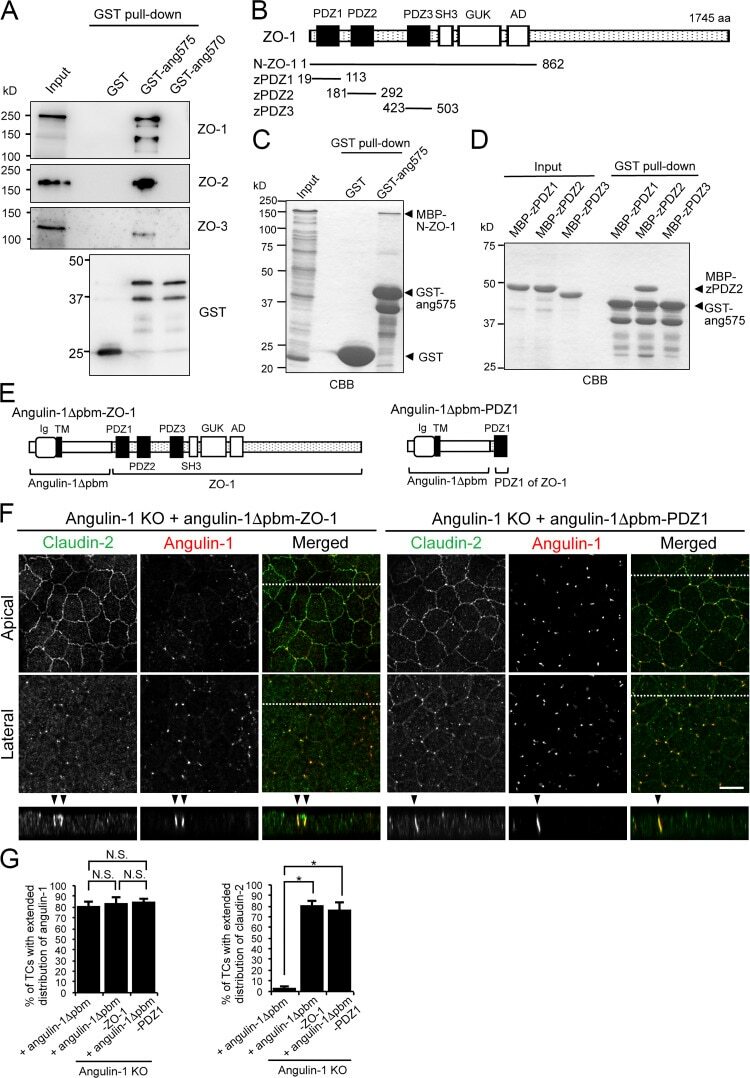
- Figure 7. Direct binding of the angulin-1 pbm to ZO-1 and its role in tTJ formation. (A) Lysates of angulin-1-KO cells were incubated with GST and GST fusion proteins of aa 409-575 and aa 409-570 of angulin-1 (GST-ang575 and GST-ang570, respectively) and subjected to GST pull-down assays. The lysates (input) and precipitates with GST, GST-ang575, and GST-ang570 were analyzed by Western blotting with anti-ZO-1 mAb, anti-ZO-2 pAb, and anti-ZO-3 pAb. The precipitates were also immunoblotted with anti-GST pAb. (B) Schematic diagram of the domain structure of mouse ZO-1 protein with 1,745 amino acids. ZO-1 contains three PDZ domains, an SH3 domain, a guanylate kinase domain (GUK), and an acidic domain (AD) in its N-terminal half. Four distinct portions of ZO-1 indicated as solid lines with amino acid numbers were produced as recombinant fusion proteins with MBP. (C) GST pull-down assays of MBP-N-ZO-1 fusion protein with GST-ang575. Input: crude lysate of Escherichia coli expressing MBP-N-ZO-1. (D) GST pull-down assays of MBP fusion proteins of PDZ1, PDZ2, and PDZ3 of ZO-1 (MBP-zPDZ1, MBP-zPDZ2, and MBP-zPDZ3, respectively) with GST-ang575. Input: each MBP fusion protein. In C and D, the samples were subjected to SDS-PAGE followed by Coomassie Brilliant Blue (CBB) staining. (E) Schematic diagram of a chimeric protein of angulin-1Deltapbm with full-length ZO-1 (angulin-1Deltapbm-ZO-1) and a chimeric protein of angulin-1Deltapbm with PDZ1 domain of ZO-1 (angulin-1Deltapbm-PDZ1). (F)
- Submitted by
- Invitrogen Antibodies (provider)
- Main image
- Experimental details
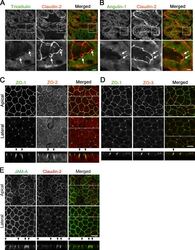
- Figure S1. Localization of TJ and tTJ proteins at TCs. (A and B) Double-immunofluorescence staining of frozen mouse kidney sections containing proximal tubules with anti-tricellulin mAb and anti-claudin-2 pAb (A) and anti-angulin-1 mAb and anti-claudin-2 pAb (B). Tricellulin and angulin-1 showed dotlike staining at TCs with claudin-2 staining (arrows). (C-E) Double-immunofluorescence staining of MDCK II cells with anti-ZO-1 mAb and anti-ZO-2 pAb (C), anti-ZO-1 mAb and anti-ZO-3 pAb (D), and anti-JAM-A pAb and anti-claudin-2 mAb (E). Confocal sections in the apical region, including TJ markers and the lateral region, together with the corresponding Z-stack images along the white dotted lines are shown. Arrowheads indicate TCs. Bars: 10 um (top of A and B and C-E), 5 um (bottom of A and B).

- Submitted by
- Invitrogen Antibodies (provider)
- Main image
- Experimental details
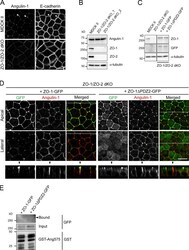
- Figure S4. Characterization of ZO-1/ZO-2-dKO cells expressing ZO-1 and its mutant. (A) Double-immunofluorescence staining of MDCK II cells and ZO-1/ZO-2-dKO cells with anti-angulin-1 pAb and anti-E-cadherin mAb. Arrowheads indicate TCs. Bar: 10 um. (B) Western blotting of lysates of MDCK II cells and two ZO-1/ZO-2-dKO clones with anti-angulin-1 pAb, anti-ZO-1 mAb, anti-ZO-2 pAb, or anti-alpha-tubulin mAb. (C) Western blotting of lysates of MDCK II cells, ZO-1/ZO-2-dKO cells, and ZO-1/ZO-2-dKO cells expressing ZO-1-GFP or a ZO-1-GFP mutant lacking PDZ2 domain (ZO-1DeltaPDZ2-GFP) with anti-ZO-1 mAb, anti-GFP pAb, or anti-alpha-tubulin mAb. (D) Double-immunofluorescence staining of ZO-1/ZO-2-dKO cells expressing ZO-1-GFP or ZO-1DeltaPDZ2-GFP with anti-GFP pAb and anti-angulin-1 pAb. Confocal sections in the apical region, including ZO-1 constructs and the lateral region, together with the corresponding Z-stack images along the white dotted lines are shown. Arrowheads indicate TCs. Bar: 10 um. (E) Pull-down assays of lysates of ZO-1/ZO-2-dKO cells expressing ZO-1-GFP or ZO-1DeltaPDZ2-GFP with GST-ang575. Bound proteins, input of lysates, and GST-ang575 used in the assay were analyzed by Western blotting with anti-GFP pAb and anti-GST pAb.

- Submitted by
- Invitrogen Antibodies (provider)
- Main image
- Experimental details
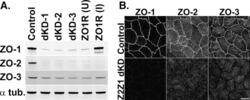
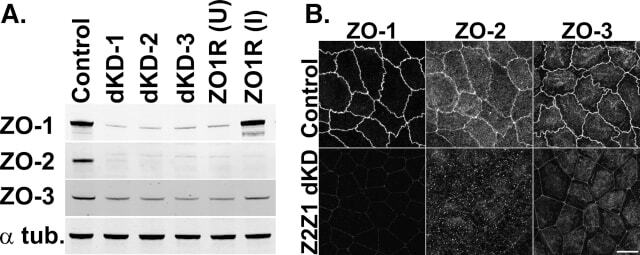
- FIGURE 1: ZO-1 and -2 are effectively depleted in stable MDCK II Tet-Off cell lines. (A) Western blot of ZO-1, -2, and -3 polypeptides in control, dKD (lines 1-3), and in dKD cells expressing a Tet-inducible full-length ZO-1 rescue transgene (ZO1R). ZO-1 expression in dKD lines is ~2-3% of that observed in control cells, while ZO-2 expression is almost undetectable. Note that ZO-3, while not directly targeted in dKD cells, is also reduced by up to 50%. In ZO1R cell lines, induction of ZO1R (I) restores ZO-1 and ZO-3 expression to levels equivalent to those in control cells, while ZO-2 expression remains suppressed. U, uninduced; I, induced. (B) Immunocytochemistry of ZO-1, -2, and -3 in the control and dKD-3 cell line. There is a dramatic reduction in the staining of all three peptides at the AJC, and the outline of the AJC is much more trapezoidal in dKD cells relative to control cells. All images are 1-mum-thick, maximum-density projections of the AJC. Scale bar: 10 mum.
- Submitted by
- Invitrogen Antibodies (provider)
- Main image
- Experimental details
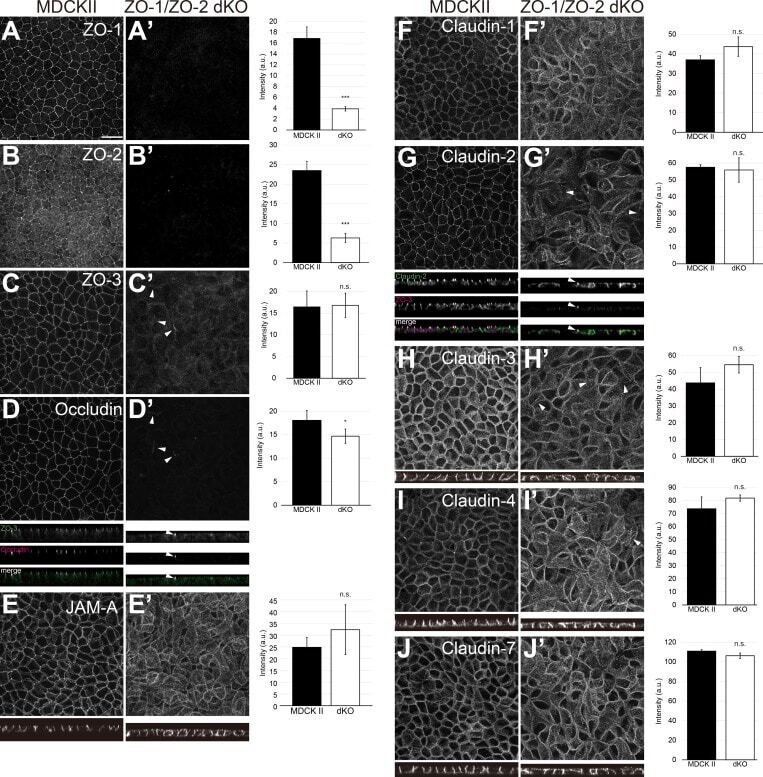
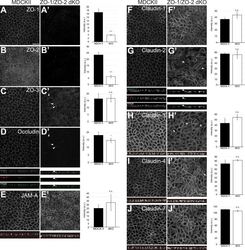
- Figure 1. ZO-1/ZO-2 are required for apical junction localization of TJ proteins. (A-J) Immunofluorescence analyses of parental MDCK II cells (A-J) and ZO-1/ZO-2 dKO cells (A'-J'). (A and B) ZO-1 (A) and ZO-2 (B) expression was abolished in ZO-1/ZO-2 dKO cells. (C-J) TJ markers including ZO-3 (C), occludin (D), JAM-A (E), claudin-1 (F), claudin-2 (G), claudin-3 (H), claudin-4 (I), and claudin-7 (J) were not concentrated to the apical junctions in ZO-1/ZO-2 dKO cells, and JAM-A (E) and claudins (F-J) were diffusely localized along the lateral and apical plasma membrane. Occasional apical junction accumulation of occludin and claudins, but not JAM-A was observed (arrowheads), colocalizing with ZO-3 (z-sections in D and G). Graphs are quantitation of the fluorescence intensity and represent mean +- SD ( n = 2-9). *, P < 0.05; ***, P < 0.0005, compared by t test. Scale bar: 20 um. n.s., not significant.