 Explore
 Validate
 Learn
Learn Western blot
 Immunocytochemistry
Antibody data
- Antibody Data
- Antigen structure
- References [5]
- Comments [0]
- Validations
- Immunocytochemistry [8]
- Immunoprecipitation [1]
- Immunohistochemistry [4]
- Flow cytometry [1]
- Other assay [1]
Submit
Validation data
Reference
Comment
Report error
- Product number
- MA1-106 - Provider product page

- Provider
- Invitrogen Antibodies
- Product name
- SOD2 Monoclonal Antibody (1H6)
- Antibody type
- Monoclonal
- Antigen
- Recombinant full-length protein
- Description
- MA1-106 has been successfully used in Western blot, immunofluorescence, immunocytochemistry, immunohistochemistry and immunoprecipitation applications with human samples. This antibody is not suitable for mouse liver tissue in IHC applications and is not suitable for PC12 cells in IF applications. The MA1-106 immunogen is full length recombinant protein of human SOD2.
- Reactivity
- Human
- Host
- Mouse
- Isotype
- IgG
- Antibody clone number
- 1H6
- Vial size
- 100 μg
- Concentration
- 1 mg/mL
- Storage
- -20°C
Submitted references Impaired flickering of the permeability transition pore causes SPG7 spastic paraplegia.
Chloramphenicol Mitigates Oxidative Stress by Inhibiting Translation of Mitochondrial Complex I in Dopaminergic Neurons of Toxin-Induced Parkinson's Disease Model.
EAE-induced upregulation of mitochondrial MnSOD is associated with increases of mitochondrial SGK1 and Tom20 protein in the mouse kidney cortex.
GATA-1 isoforms differently contribute to the production and compartmentation of reactive oxygen species in the myeloid leukemia cell line K562.
JAK2V617F mediates resistance to DNA damage-induced apoptosis by modulating FOXO3A localization and Bcl-xL deamidation.
Sambri I, Massa F, Gullo F, Meneghini S, Cassina L, Carraro M, Dina G, Quattrini A, Patanella L, Carissimo A, Iuliano A, Santorelli F, Codazzi F, Grohovaz F, Bernardi P, Becchetti A, Casari G
EBioMedicine 2020 Nov;61:103050
EBioMedicine 2020 Nov;61:103050
Chloramphenicol Mitigates Oxidative Stress by Inhibiting Translation of Mitochondrial Complex I in Dopaminergic Neurons of Toxin-Induced Parkinson's Disease Model.
Han J, Kim SJ, Ryu MJ, Jang Y, Lee MJ, Ju X, Lee YL, Cui J, Shong M, Heo JY, Kweon GR
Oxidative medicine and cellular longevity 2019;2019:4174803
Oxidative medicine and cellular longevity 2019;2019:4174803
EAE-induced upregulation of mitochondrial MnSOD is associated with increases of mitochondrial SGK1 and Tom20 protein in the mouse kidney cortex.
Hira S, Packialakshmi B, Zhou X
The journal of physiological sciences : JPS 2019 Sep;69(5):723-732
The journal of physiological sciences : JPS 2019 Sep;69(5):723-732
GATA-1 isoforms differently contribute to the production and compartmentation of reactive oxygen species in the myeloid leukemia cell line K562.
Riccio P, Sessa R, de Nicola S, Petruzziello F, Trombetti S, Menna G, Pepe G, Maddalena P, Izzo P, Grosso M
Journal of cellular physiology 2019 Nov;234(11):20829-20846
Journal of cellular physiology 2019 Nov;234(11):20829-20846
JAK2V617F mediates resistance to DNA damage-induced apoptosis by modulating FOXO3A localization and Bcl-xL deamidation.
Ahn JS, Li J, Chen E, Kent DG, Park HJ, Green AR
Oncogene 2016 Apr 28;35(17):2235-46
Oncogene 2016 Apr 28;35(17):2235-46
No comments: Submit comment
Supportive validation
- Submitted by
- Invitrogen Antibodies (provider)
- Main image
- Experimental details
- Immunofluorescent analysis of SOD2 (green) showing positive staining in the mitochondrion matrix of Hela cells (right) compared with a negative control in the absence of primary antibody (left). Formalin-fixed cells were permeabilized with 0.1% Triton X-100 in TBS for 5-10 minutes, blocked with 3% BSA-PBS for 30 minutes at room temperature and probed with a SOD2 monoclonal antibody (Product # MA1-106) in 3% BSA-PBS at a dilution of 1:200 and incubated overnight at 4 °C in a humidified chamber. Cells were washed with PBST and incubated with a DyLight 488-conjugated goat-anti-mouse IgG (H+L) secondary antibody in PBS at room temperature in the dark. F-actin (red) was stained with a fluorescent red phalloidin and nuclei (blue) were stained with DAPI for 5-10 minutes in the dark. Images were taken at a magnification of 60x.
- Submitted by
- Invitrogen Antibodies (provider)
- Main image
- Experimental details
- Immunofluorescent analysis of SOD2 (green) showing positive staining in the mitochondrion matrix of HUVEC cells (right) compared with a negative control in the absence of primary antibody (left). Formalin-fixed cells were permeabilized with 0.1% Triton X-100 in TBS for 5-10 minutes, blocked with 3% BSA-PBS for 30 minutes at room temperature and probed with a SOD2 monoclonal antibody (Product # MA1-106) in 3% BSA-PBS at a dilution of 1:200 and incubated overnight at 4 °C in a humidified chamber. Cells were washed with PBST and incubated with a DyLight 488-conjugated goat-anti-mouse IgG (H+L) secondary antibody in PBS at room temperature in the dark. F-actin (red) was stained with a fluorescent red phalloidin and nuclei (blue) were stained with DAPI for 5-10 minutes in the dark. Images were taken at a magnification of 60x.
- Submitted by
- Invitrogen Antibodies (provider)
- Main image
- Experimental details
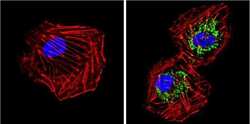
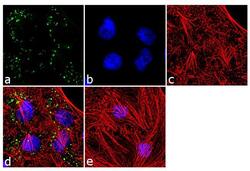
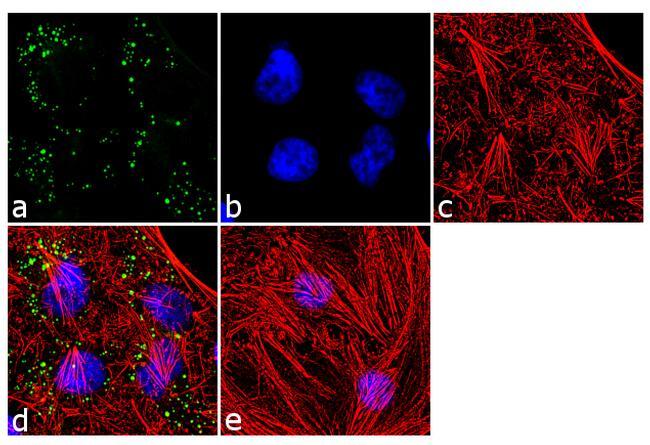
- Immunofluorescence analysis of SOD2 was performed using 70% confluent log phase HeLa cells. The cells were fixed with 4% paraformaldehyde for 10 minutes, permeabilized with 0.1% Triton™ X-100 for 10 minutes, and blocked with 2% BSA for 1 hour at room temperature. The cells were labeled with SOD2 (1H6) Mouse Monoclonal Antibody (Product # MA1-106) at 2 µg/mL in 0.1% BSA and incubated for 3 hours at room temperature and then labeled with Goat anti-Mouse IgG (H+L) Superclonal™ Secondary Antibody, Alexa Fluor® 488 conjugate (Product # A28175) a dilution of 1:2000 for 45 minutes at room temperature (Panel a: green). Nuclei (Panel b: blue) were stained with SlowFade® Gold Antifade Mountant with DAPI (Product # S36938). F-actin (Panel c: red) was stained with Alexa Fluor® 555 Rhodamine Phalloidin (Product # R415, 1:300). Panel d represents the merged image showing punctated cytoplasmic localization. Panel e shows the no primary antibody control. The images were captured at 60X magnification.

- Submitted by
- Invitrogen Antibodies (provider)
- Main image

- Experimental details
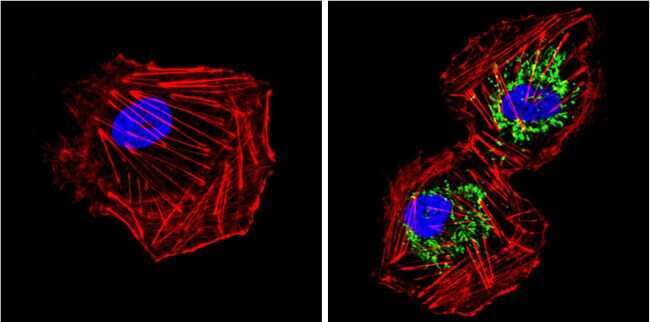
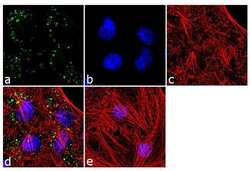
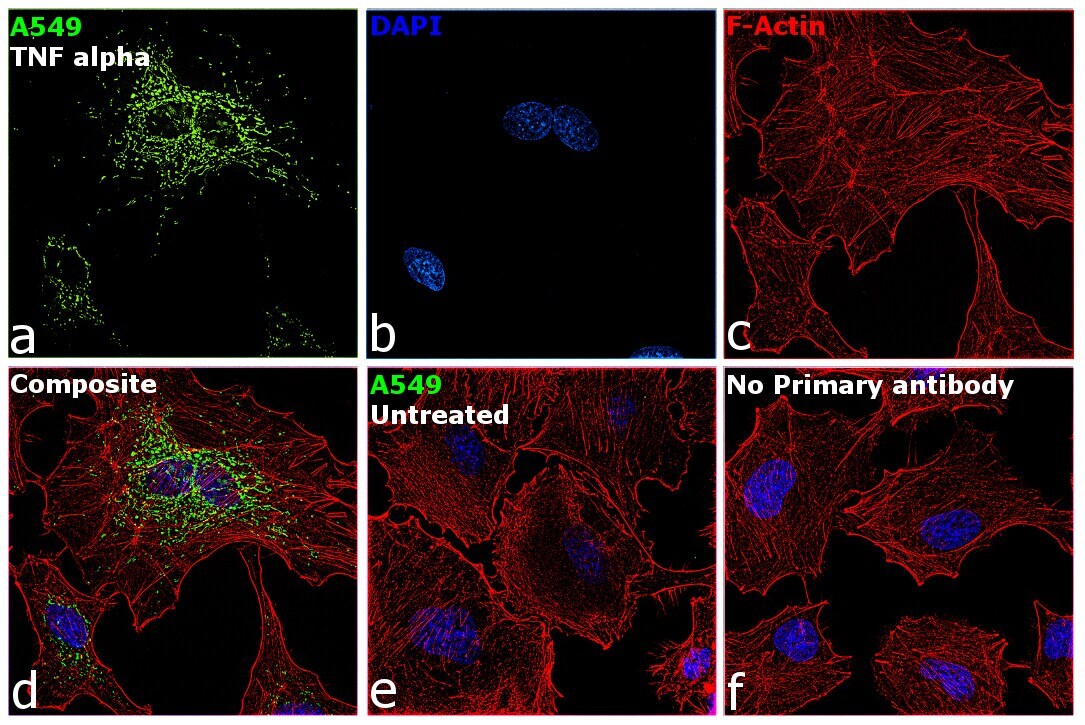
- Immunofluorescence analysis of SOD2 was performed using 70% confluent log phase A549 cells treated with TNF alpha (20 ng/mL for 72h). The cells were fixed with 4% paraformaldehyde for 10 minutes, permeabilized with 0.1% Triton™ X-100 for 15 minutes, and blocked with 2% BSA for 1 hour at room temperature. The cells were labeled with SOD2 Polyclonal Antibody (Product # MA1-106) at 2 µg/mL in 0.1% BSA, incubated at 4 degree Celsius overnight and then labeled with Donkey anti-Mouse IgG (H+L) Highly Cross-Adsorbed Secondary Antibody, Alexa Fluor Plus 488 (Product # A32766) at a dilution of 1:2000 for 45 minutes at room temperature (Panel a: green). Nuclei (Panel b: blue) were stained with SlowFade® Gold Antifade Mountant with DAPI (Product # S36938). F-actin (Panel c: red) was stained with Rhodamine Phalloidin (Product # R415, 1:300). Panel d represents the merged image showing increased SOD2 expression and localization to the mitochondria. Panel e shows untreated cells with lower expression of SOD2. Panel f represents control cells with no primary antibody to assess background. The images were captured at 60X magnification.
- Submitted by
- Invitrogen Antibodies (provider)
- Main image
- Experimental details
- Immunofluorescence analysis of SOD2 was performed using 70% confluent log phase A549 cells treated with TNF alpha (20 ng/mL for 72h). The cells were fixed with 4% paraformaldehyde for 10 minutes, permeabilized with 0.1% Triton™ X-100 for 15 minutes, and blocked with 2% BSA for 1 hour at room temperature. The cells were labeled with SOD2 Polyclonal Antibody (Product # MA1-106) at 2 µg/mL in 0.1% BSA, incubated at 4 degree Celsius overnight and then labeled with Donkey anti-Mouse IgG (H+L) Highly Cross-Adsorbed Secondary Antibody, Alexa Fluor Plus 488 (Product # A32766) at a dilution of 1:2000 for 45 minutes at room temperature (Panel a: green). Nuclei (Panel b: blue) were stained with SlowFade® Gold Antifade Mountant with DAPI (Product # S36938). F-actin (Panel c: red) was stained with Rhodamine Phalloidin (Product # R415, 1:300). Panel d represents the merged image showing increased SOD2 expression and localization to the mitochondria. Panel e shows untreated cells with lower expression of SOD2. Panel f represents control cells with no primary antibody to assess background. The images were captured at 60X magnification.

- Submitted by
- Invitrogen Antibodies (provider)
- Main image
- Experimental details
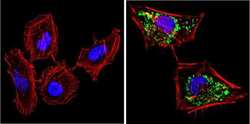
- Immunofluorescent analysis of SOD2 (green) showing positive staining in the mitochondrion matrix of Hela cells (right) compared with a negative control in the absence of primary antibody (left). Formalin-fixed cells were permeabilized with 0.1% Triton X-100 in TBS for 5-10 minutes, blocked with 3% BSA-PBS for 30 minutes at room temperature and probed with a SOD2 monoclonal antibody (Product # MA1-106) in 3% BSA-PBS at a dilution of 1:200 and incubated overnight at 4 °C in a humidified chamber. Cells were washed with PBST and incubated with a DyLight 488-conjugated goat-anti-mouse IgG (H+L) secondary antibody in PBS at room temperature in the dark. F-actin (red) was stained with a fluorescent red phalloidin and nuclei (blue) were stained with DAPI for 5-10 minutes in the dark. Images were taken at a magnification of 60x.

- Submitted by
- Invitrogen Antibodies (provider)
- Main image

- Experimental details
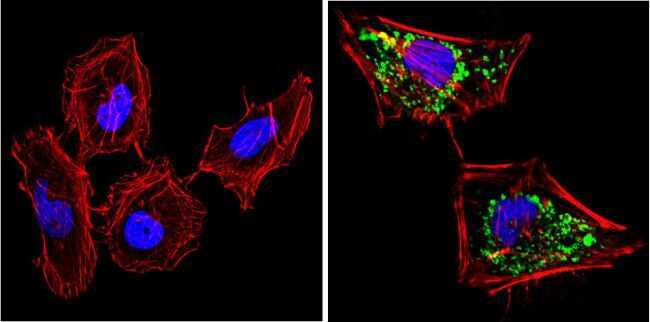
- Immunofluorescent analysis of SOD2 (green) showing positive staining in the mitochondrion matrix of HUVEC cells (right) compared with a negative control in the absence of primary antibody (left). Formalin-fixed cells were permeabilized with 0.1% Triton X-100 in TBS for 5-10 minutes, blocked with 3% BSA-PBS for 30 minutes at room temperature and probed with a SOD2 monoclonal antibody (Product # MA1-106) in 3% BSA-PBS at a dilution of 1:200 and incubated overnight at 4 °C in a humidified chamber. Cells were washed with PBST and incubated with a DyLight 488-conjugated goat-anti-mouse IgG (H+L) secondary antibody in PBS at room temperature in the dark. F-actin (red) was stained with a fluorescent red phalloidin and nuclei (blue) were stained with DAPI for 5-10 minutes in the dark. Images were taken at a magnification of 60x.

- Submitted by
- Invitrogen Antibodies (provider)
- Main image
- Experimental details
- Immunofluorescence analysis of SOD2 was performed using 70% confluent log phase HeLa cells. The cells were fixed with 4% paraformaldehyde for 10 minutes, permeabilized with 0.1% Triton™ X-100 for 10 minutes, and blocked with 2% BSA for 1 hour at room temperature. The cells were labeled with SOD2 (1H6) Mouse Monoclonal Antibody (Product # MA1-106) at 2 µg/mL in 0.1% BSA and incubated for 3 hours at room temperature and then labeled with Goat anti-Mouse IgG (H+L) Superclonal™ Secondary Antibody, Alexa Fluor® 488 conjugate (Product # A28175) a dilution of 1:2000 for 45 minutes at room temperature (Panel a: green). Nuclei (Panel b: blue) were stained with SlowFade® Gold Antifade Mountant with DAPI (Product # S36938). F-actin (Panel c: red) was stained with Alexa Fluor® 555 Rhodamine Phalloidin (Product # R415, 1:300). Panel d represents the merged image showing punctated cytoplasmic localization. Panel e shows the no primary antibody control. The images were captured at 60X magnification.
Supportive validation
- Submitted by
- Invitrogen Antibodies (provider)
- Main image

- Experimental details
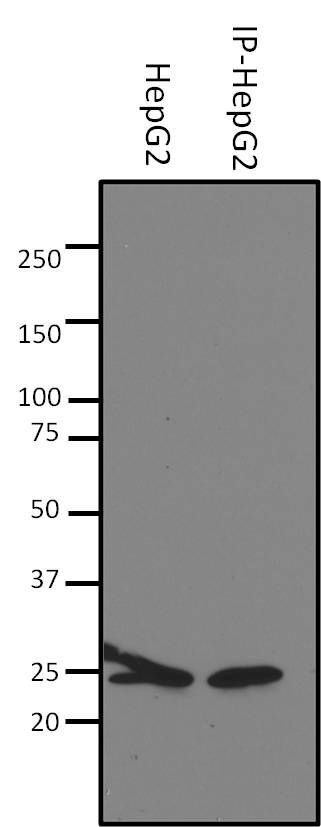
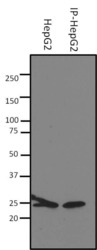
- Immunoprecipitation of SOD2 Clone 1H6 was performed on HepG2 cells. The antigen:antibody complex was formed by binding 500 µg whole cell lysate with 2 µg of mouse monoclonal antibody recognizing SOD2 (Product # MA1-106) overnight on a rocking platform at 4°C. The immune-complex was then captured on 50 µL Protein A/G Plus Agarose. Captured immune-complexes were then washed extensively and proteins eluted with 5X Reducing Sample Loading Dye (Product # 39000). Samples were then resolved on a 4-20% Tris-HCl polyacrylamide gel. Proteins were transferred to PVDF membrane and blocked with 5% BSA/TBS-0.1%Tween for at least 1 hour. Membranes were then probed with a mouse monoclonal antibody recognizing SOD2 (Product # MA1-106) at a dilution of 1:500 overnight rotating at 4°C. Membranes were then washed in TBST and probed with Clean-blot IP detection reagent (Product # 21230) at a dilution of 1:2, 500 for at least one hour. Membranes were washed and chemiluminescent detection was performed using SuperSignal West Dura (Product # 34075).
Supportive validation
- Submitted by
- Invitrogen Antibodies (provider)
- Main image
- Experimental details
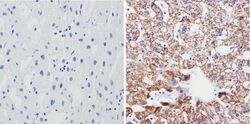
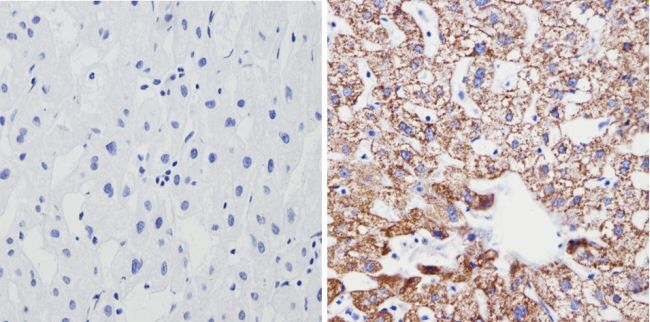
- Immunohistochemistry analysis of SOD2 showing positive staining in the mitochondrion matrix of paraffin-treated Human liver tissue (right) compared with a negative control in the absence of primary antibody (left). To expose target proteins, antigen retrieval method was performed using 10mM sodium citrate (pH 6.0), microwaved for 8-15 min. Following antigen retrieval, tissues were blocked in 3% H2O2-methanol for 15 min at room temperature, washed with ddH2O and PBS, and then probed with a SOD2 monoclonal antibody (Product # MA1-106) diluted by 3% BSA-PBS at a dilution of 1:200 overnight at 4°C in a humidified chamber. Tissues were washed extensively PBST and detection was performed using an HRP-conjugated secondary antibody followed by colorimetric detection using a DAB kit. Tissues were counterstained with hematoxylin and dehydrated with ethanol and xylene to prep for mounting.
- Submitted by
- Invitrogen Antibodies (provider)
- Main image
- Experimental details
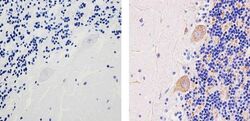
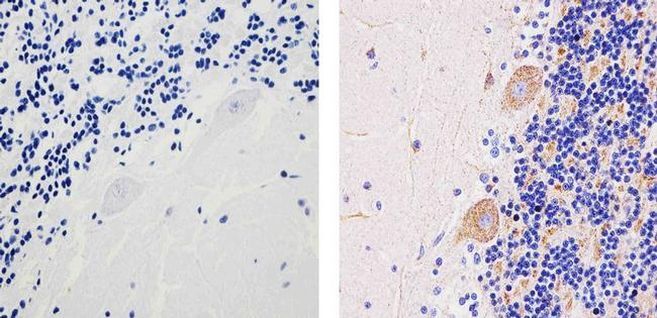
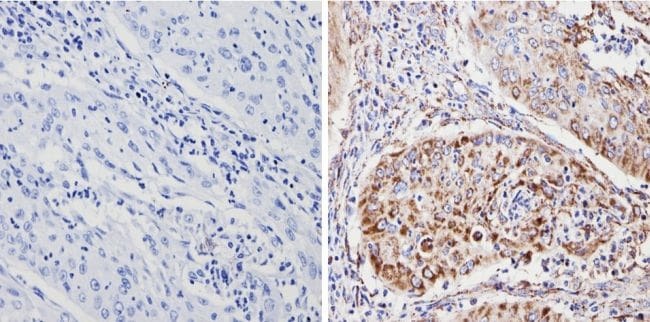
- Immunohistochemistry analysis of SOD2 (1H6) showing staining in the cytoplasm of paraffin-embedded human cerebellum tissue (right) compared to a negative control without primary antibody (left). To expose target proteins, antigen retrieval was performed using 10mM sodium citrate (pH 6.0), microwaved for 8-15 min. Following antigen retrieval, tissues were blocked in 3% H2O2-methanol for 15 min at room temperature, washed with ddH2O and PBS, and then probed with a SOD2 (1H6) Mouse Monoclonal Antibody (Product # MA1-106) diluted in 3% BSA-PBS at a dilution of 1:100 for 1 hour at 37ºC in a humidified chamber. Tissues were washed extensively in PBST and detection was performed using an HRP-conjugated secondary antibody followed by colorimetric detection using a DAB kit. Tissues were counterstained with hematoxylin and dehydrated with ethanol and xylene to prep for mounting.
- Submitted by
- Invitrogen Antibodies (provider)
- Main image
- Experimental details
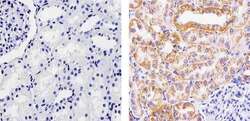
- Immunohistochemistry analysis of SOD2 (1H6) showing staining in the cytoplasm of paraffin-embedded human kidney tissue (right) compared to a negative control without primary antibody (left). To expose target proteins, antigen retrieval was performed using 10mM sodium citrate (pH 6.0), microwaved for 8-15 min. Following antigen retrieval, tissues were blocked in 3% H2O2-methanol for 15 min at room temperature, washed with ddH2O and PBS, and then probed with a SOD2 (1H6) Mouse Monoclonal Antibody (Product # MA1-106) diluted in 3% BSA-PBS at a dilution of 1:100 for 1 hour at 37ºC in a humidified chamber. Tissues were washed extensively in PBST and detection was performed using an HRP-conjugated secondary antibody followed by colorimetric detection using a DAB kit. Tissues were counterstained with hematoxylin and dehydrated with ethanol and xylene to prep for mounting.

- Submitted by
- Invitrogen Antibodies (provider)
- Main image
- Experimental details
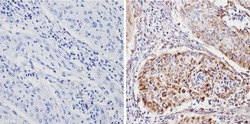
- Immunohistochemistry analysis of SOD2 showing positive staining in the mitochondrion matrix of paraffin-treated Human cervical carcinoma (right) compared with a negative control in the absence of primary antibody (left). To expose target proteins, antigen retrieval method was performed using 10mM sodium citrate (pH 6.0), microwaved for 8-15 min. Following antigen retrieval, tissues were blocked in 3% H2O2-methanol for 15 min at room temperature, washed with ddH2O and PBS, and then probed with a SOD2 monoclonal antibody (Product # MA1-106) diluted by 3% BSA-PBS at a dilution of 1:200 overnight at 4°C in a humidified chamber. Tissues were washed extensively PBST and detection was performed using an HRP-conjugated secondary antibody followed by colorimetric detection using a DAB kit. Tissues were counterstained with hematoxylin and dehydrated with ethanol and xylene to prep for mounting.
Supportive validation
- Submitted by
- Invitrogen Antibodies (provider)
- Main image
- Experimental details
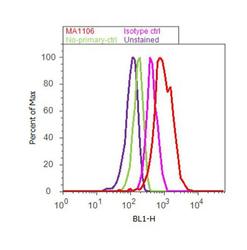
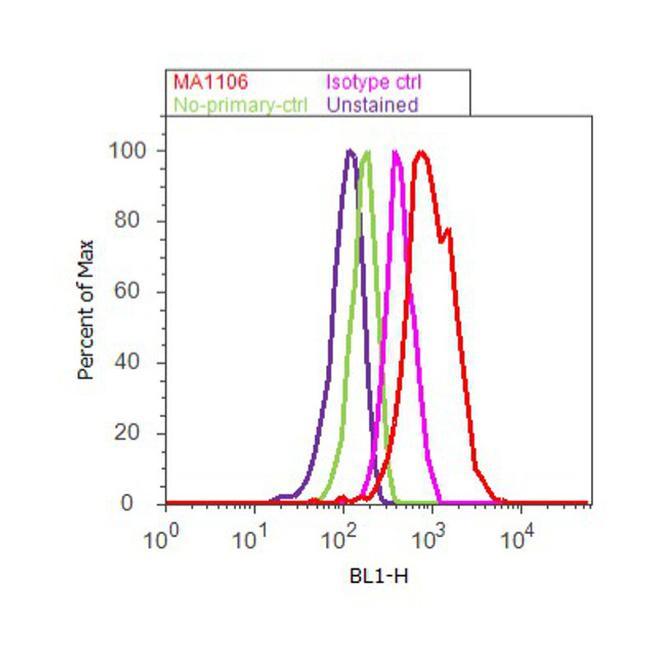
- Flow cytometry analysis of SOD2 was done on HeLa cells. Cells were fixed with 70% ethanol for 10 minutes, permeabilized with 0.25% Triton™ X-100 for 20 minutes, and blocked with 5% BSA for 30 minutes at room temperature. Cells were labeled with SOD2 Mouse Monoclonal Antibody (MA1106, red histogram) or with mouse isotype control (pink histogram) at 3-5 ug/million cells in 2.5% BSA. After incubation at room temperature for 2 hours, the cells were labeled with Alexa Fluor® 488 Rabbit Anti-Mouse Secondary Antibody (A11059) at a dilution of 1:400 for 30 minutes at room temperature. The representative 10,000 cells were acquired and analyzed for each sample using an Attune® Acoustic Focusing Cytometer. The purple histogram represents unstained control cells and the green histogram represents no-primary-antibody control..
Supportive validation
- Submitted by
- Invitrogen Antibodies (provider)
- Main image
- Experimental details
- Immunoprecipitation of SOD2 Clone 1H6 was performed on HepG2 cells. The antigen:antibody complex was formed by binding 500 µg whole cell lysate with 2 µg of mouse monoclonal antibody recognizing SOD2 (Product # MA1-106) overnight on a rocking platform at 4øC. The immune-complex was then captured on 50 µL Protein A/G Plus Agarose. Captured immune-complexes were then washed extensively and proteins eluted with 5X Reducing Sample Loading Dye (Product # 39000). Samples were then resolved on a 4-20% Tris-HCl polyacrylamide gel. Proteins were transferred to PVDF membrane and blocked with 5% BSA/TBS-0.1%Tween for at least 1 hour. Membranes were then probed with a mouse monoclonal antibody recognizing SOD2 (Product # MA1-106) at a dilution of 1:500 overnight rotating at 4øC. Membranes were then washed in TBST and probed with Clean-blot IP detection reagent (Product # 21230) at a dilution of 1:2, 500 for at least one hour. Membranes were washed and chemiluminescent detection was performed using SuperSignal West Dura (Product # 34075).
