Explore
 Validate
 Learn
Learn Western blot
 Immunocytochemistry
Antibody data
- Antibody Data
- Antigen structure
- References [8]
- Comments [0]
- Validations
- Immunocytochemistry [8]
- Immunohistochemistry [5]
- Other assay [4]
Submit
Validation data
Reference
Comment
Report error
- Product number
- MA1-105 - Provider product page

- Provider
- Invitrogen Antibodies
- Product name
- SOD1 Monoclonal Antibody (8B10)
- Antibody type
- Monoclonal
- Antigen
- Recombinant full-length protein
- Description
- MA1-105 detects SOD1 in human and mouse samples and has been successfully used in Western blot, immunohistochemistry, immunocytochemistry and immunofluorescence applications.
- Reactivity
- Human, Mouse
- Host
- Mouse
- Isotype
- IgG
- Antibody clone number
- 8B10
- Vial size
- 100 μg
- Concentration
- 1 mg/mL
- Storage
- -20°C
Submitted references Antioxidant effect of grape seed extract corrects experimental autoimmune encephalomyelitis behavioral dysfunctions, demyelination, and glial activation.
N-Acetylcysteine Enhances the Recovery of Ischemic Limb in Type-2 Diabetic Mice.
Combination of Antioxidant Enzyme Overexpression and N-Acetylcysteine Treatment Enhances the Survival of Bone Marrow Mesenchymal Stromal Cells in Ischemic Limb in Mice With Type 2 Diabetes.
The copper chaperone CCS facilitates copper binding to MEK1/2 to promote kinase activation.
Fine tuning of the unfolded protein response by ISRIB improves neuronal survival in a model of amyotrophic lateral sclerosis.
Mitochondrial superoxide disrupts the metabolic and epigenetic landscape of CD4(+) and CD8(+) T-lymphocytes.
Protective Effects of Kuding Tea (Ilex kudingcha C. J. Tseng) Polyphenols on UVB-Induced Skin Aging in SKH1 Hairless Mice.
Concomitant overexpression of triple antioxidant enzymes selectively increases circulating endothelial progenitor cells in mice with limb ischaemia.
Mabrouk M, El Ayed M, Démosthènes A, Aissouni Y, Aouani E, Daulhac-Terrail L, Mokni M, Bégou M
Frontiers in immunology 2022;13:960355
Frontiers in immunology 2022;13:960355
N-Acetylcysteine Enhances the Recovery of Ischemic Limb in Type-2 Diabetic Mice.
Zhu Q, Liu X, Zhu Q, Liu Z, Yang C, Wu H, Zhang L, Xia X, Wang M, Hao H, Cui Y, Zhang G, Hill MA, Flaker GC, Zhou S, Liu Z
Antioxidants (Basel, Switzerland) 2022 May 31;11(6)
Antioxidants (Basel, Switzerland) 2022 May 31;11(6)
Combination of Antioxidant Enzyme Overexpression and N-Acetylcysteine Treatment Enhances the Survival of Bone Marrow Mesenchymal Stromal Cells in Ischemic Limb in Mice With Type 2 Diabetes.
Zhu Q, Hao H, Xu H, Fichman Y, Cui Y, Yang C, Wang M, Mittler R, Hill MA, Cowan PJ, Zhang G, He X, Zhou S, Liu Z
Journal of the American Heart Association 2021 Oct 5;10(19):e023491
Journal of the American Heart Association 2021 Oct 5;10(19):e023491
The copper chaperone CCS facilitates copper binding to MEK1/2 to promote kinase activation.
Grasso M, Bond GJ, Kim YJ, Boyd S, Matson Dzebo M, Valenzuela S, Tsang T, Schibrowsky NA, Alwan KB, Blackburn NJ, Burslem GM, Wittung-Stafshede P, Winkler DD, Marmorstein R, Brady DC
The Journal of biological chemistry 2021 Dec;297(6):101314
The Journal of biological chemistry 2021 Dec;297(6):101314
Fine tuning of the unfolded protein response by ISRIB improves neuronal survival in a model of amyotrophic lateral sclerosis.
Bugallo R, Marlin E, Baltanás A, Toledo E, Ferrero R, Vinueza-Gavilanes R, Larrea L, Arrasate M, Aragón T
Cell death & disease 2020 May 26;11(5):397
Cell death & disease 2020 May 26;11(5):397
Mitochondrial superoxide disrupts the metabolic and epigenetic landscape of CD4(+) and CD8(+) T-lymphocytes.
Moshfegh CM, Collins CW, Gunda V, Vasanthakumar A, Cao JZ, Singh PK, Godley LA, Case AJ
Redox biology 2019 Oct;27:101141
Redox biology 2019 Oct;27:101141
Protective Effects of Kuding Tea (Ilex kudingcha C. J. Tseng) Polyphenols on UVB-Induced Skin Aging in SKH1 Hairless Mice.
Yi R, Zhang J, Sun P, Qian Y, Zhao X
Molecules (Basel, Switzerland) 2019 Mar 13;24(6)
Molecules (Basel, Switzerland) 2019 Mar 13;24(6)
Concomitant overexpression of triple antioxidant enzymes selectively increases circulating endothelial progenitor cells in mice with limb ischaemia.
Liu L, Cui Y, Li X, Que X, Xiao Y, Yang C, Zhang J, Xie X, Cowan PJ, Tian J, Hao H, Liu Z
Journal of cellular and molecular medicine 2019 Jun;23(6):4019-4029
Journal of cellular and molecular medicine 2019 Jun;23(6):4019-4029
No comments: Submit comment
Supportive validation
- Submitted by
- Invitrogen Antibodies (provider)
- Main image
- Experimental details
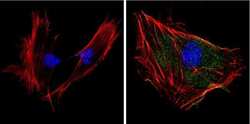
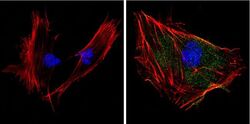
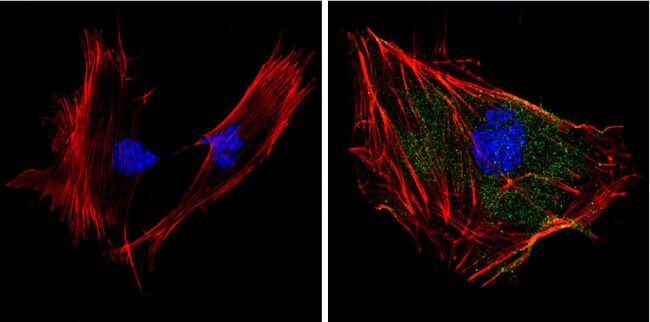
- Immunofluorescent analysis of Superoxide dismutase-1 (green) showing positive staining in the cytoplasm and nucleus of 3T3-L1 cells (right) compared with a negative control in the absence of primary antibody (left). Formalin-fixed cells were permeabilized with 0.1% Triton X-100 in TBS for 5-10 minutes, blocked with 3% BSA-PBS for 30 minutes at room temperature and probed with a Superoxide dismutase-1 monoclonal antibody (Product # MA1-105) in 3% BSA-PBS at a dilution of 1:100 and incubated overnight at 4 °C in a humidified chamber. Cells were washed with PBST and incubated with a DyLight 488-conjugated goat-anti-mouse IgG (H+L) secondary antibody in PBS at room temperature in the dark. F-actin (red) was stained with a fluorescent red phalloidin and nuclei (blue) were stained with DAPI for 5-10 minutes in the dark. Images were taken at a magnification of 60x.

- Submitted by
- Invitrogen Antibodies (provider)
- Main image
- Experimental details
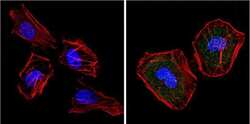
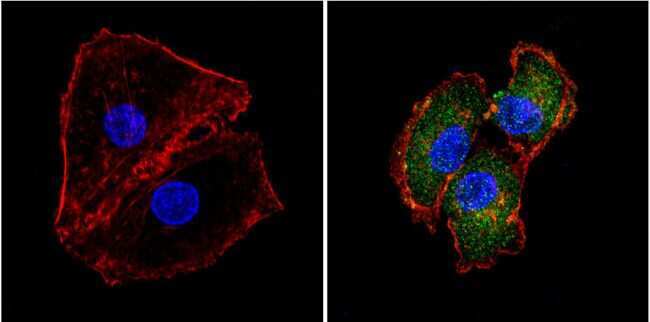
- Immunofluorescent analysis of Superoxide dismutase-1 (green) showing positive staining in the cytoplasm and nucleus of Hela cells (right) compared with a negative control in the absence of primary antibody (left). Formalin-fixed cells were permeabilized with 0.1% Triton X-100 in TBS for 5-10 minutes, blocked with 3% BSA-PBS for 30 minutes at room temperature and probed with a Superoxide dismutase-1 monoclonal antibody (Product # MA1-105) in 3% BSA-PBS at a dilution of 1:20 and incubated overnight at 4 °C in a humidified chamber. Cells were washed with PBST and incubated with a DyLight 488-conjugated goat-anti-mouse IgG (H+L) secondary antibody in PBS at room temperature in the dark. F-actin (red) was stained with a fluorescent red phalloidin and nuclei (blue) were stained with DAPI for 5-10 minutes in the dark. Images were taken at a magnification of 60x.

- Submitted by
- Invitrogen Antibodies (provider)
- Main image
- Experimental details
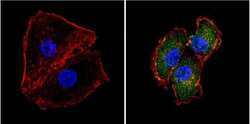
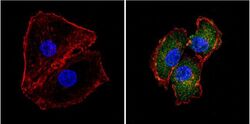
- Immunofluorescent analysis of Superoxide dismutase-1 (green) showing positive staining in the cytoplasm and nucleus of HepG2 cells (right) compared with a negative control in the absence of primary antibody (left). Formalin-fixed cells were permeabilized with 0.1% Triton X-100 in TBS for 5-10 minutes, blocked with 3% BSA-PBS for 30 minutes at room temperature and probed with a Superoxide dismutase-1 monoclonal antibody (Product # MA1-105) in 3% BSA-PBS at a dilution of 1:100 and incubated overnight at 4 °C in a humidified chamber. Cells were washed with PBST and incubated with a DyLight 488-conjugated goat-anti-mouse IgG (H+L) secondary antibody in PBS at room temperature in the dark. F-actin (red) was stained with a fluorescent red phalloidin and nuclei (blue) were stained with DAPI for 5-10 minutes in the dark. Images were taken at a magnification of 60x.
- Submitted by
- Invitrogen Antibodies (provider)
- Main image
- Experimental details
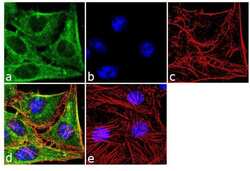
- Immunofluorescence analysis of SOD1 was performed using 70% confluent log phase HeLa cells. The cells were fixed with 4% paraformaldehyde for 10 minutes, permeabilized with 0.1% Triton™ X-100 for 10 minutes, and blocked with 2% BSA for 1 hour at room temperature. The cells were labeled with SOD1 (8B10) Mouse Monoclonal Antibody (Product # MA1-105) at 2 µg/mL in 0.1% BSA and incubated for 3 hours at room temperature and then labeled with Goat anti-Mouse IgG (H+L) Superclonal™ Secondary Antibody, Alexa Fluor® 488 conjugate (Product # A28175) a dilution of 1:2000 for 45 minutes at room temperature (Panel a: green). Nuclei (Panel b: blue) were stained with SlowFade® Gold Antifade Mountant with DAPI (Product # S36938). F-actin (Panel c: red) was stained with Alexa Fluor® 555 Rhodamine Phalloidin (Product # R415, 1:300). Panel d represents the merged image showing cytoplasmic localization. Panel e shows the no primary antibody control. The images were captured at 60X magnification.

- Submitted by
- Invitrogen Antibodies (provider)
- Main image

- Experimental details
- Immunofluorescent analysis of Superoxide dismutase-1 (green) showing positive staining in the cytoplasm and nucleus of Hela cells (right) compared with a negative control in the absence of primary antibody (left). Formalin-fixed cells were permeabilized with 0.1% Triton X-100 in TBS for 5-10 minutes, blocked with 3% BSA-PBS for 30 minutes at room temperature and probed with a Superoxide dismutase-1 monoclonal antibody (Product # MA1-105) in 3% BSA-PBS at a dilution of 1:20 and incubated overnight at 4 °C in a humidified chamber. Cells were washed with PBST and incubated with a DyLight 488-conjugated goat-anti-mouse IgG (H+L) secondary antibody in PBS at room temperature in the dark. F-actin (red) was stained with a fluorescent red phalloidin and nuclei (blue) were stained with DAPI for 5-10 minutes in the dark. Images were taken at a magnification of 60x.

- Submitted by
- Invitrogen Antibodies (provider)
- Main image
- Experimental details
- Immunofluorescent analysis of Superoxide dismutase-1 (green) showing positive staining in the cytoplasm and nucleus of HepG2 cells (right) compared with a negative control in the absence of primary antibody (left). Formalin-fixed cells were permeabilized with 0.1% Triton X-100 in TBS for 5-10 minutes, blocked with 3% BSA-PBS for 30 minutes at room temperature and probed with a Superoxide dismutase-1 monoclonal antibody (Product # MA1-105) in 3% BSA-PBS at a dilution of 1:100 and incubated overnight at 4 °C in a humidified chamber. Cells were washed with PBST and incubated with a DyLight 488-conjugated goat-anti-mouse IgG (H+L) secondary antibody in PBS at room temperature in the dark. F-actin (red) was stained with a fluorescent red phalloidin and nuclei (blue) were stained with DAPI for 5-10 minutes in the dark. Images were taken at a magnification of 60x.

- Submitted by
- Invitrogen Antibodies (provider)
- Main image
- Experimental details
- Immunofluorescent analysis of Superoxide dismutase-1 (green) showing positive staining in the cytoplasm and nucleus of 3T3-L1 cells (right) compared with a negative control in the absence of primary antibody (left). Formalin-fixed cells were permeabilized with 0.1% Triton X-100 in TBS for 5-10 minutes, blocked with 3% BSA-PBS for 30 minutes at room temperature and probed with a Superoxide dismutase-1 monoclonal antibody (Product # MA1-105) in 3% BSA-PBS at a dilution of 1:100 and incubated overnight at 4 °C in a humidified chamber. Cells were washed with PBST and incubated with a DyLight 488-conjugated goat-anti-mouse IgG (H+L) secondary antibody in PBS at room temperature in the dark. F-actin (red) was stained with a fluorescent red phalloidin and nuclei (blue) were stained with DAPI for 5-10 minutes in the dark. Images were taken at a magnification of 60x.
Supportive validation
- Submitted by
- Invitrogen Antibodies (provider)
- Main image
- Experimental details
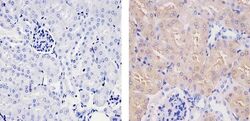
- Immunohistochemistry analysis of SOD1 showing staining in the cytoplasm and nucleus of paraffin-embedded mouse kidney tissue (right) compared to a negative control without primary antibody (left). To expose target proteins, antigen retrieval was performed using 10mM sodium citrate (pH 6.0), microwaved for 8-15 min. Following antigen retrieval, tissues were blocked in 3% H2O2-methanol for 15 min at room temperature, washed with ddH2O and PBS, and then probed with a SOD1 (8B10) Mouse Monoclonal Antibody (Product # MA1-105) diluted in 3% BSA-PBS at a dilution of 1:20 for 1 hour at 37ºC in a humidified chamber. Tissues were washed extensively in PBST and detection was performed using an HRP-conjugated secondary antibody followed by colorimetric detection using a DAB kit. Tissues were counterstained with hematoxylin and dehydrated with ethanol and xylene to prep for mounting.
- Submitted by
- Invitrogen Antibodies (provider)
- Main image
- Experimental details
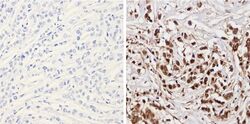
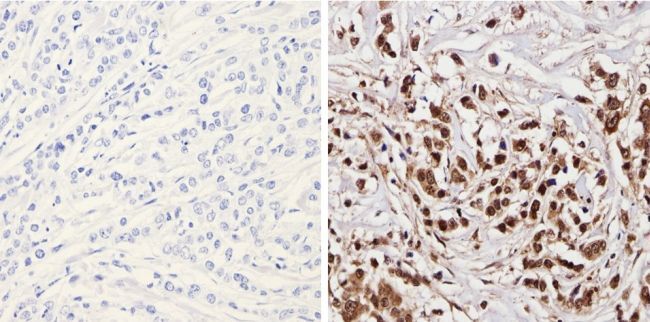
- Immunohistochemistry analysis of Superoxide dismutase-1 showing positive staining in the nucleus and cytoplasm of paraffin-treated Human breast carcinoma (right) compared with a negative control in the absence of primary antibody (left). To expose target proteins, antigen retrieval method was performed using 10mM sodium citrate (pH 6.0), microwaved for 8-15 min. Following antigen retrieval, tissues were blocked in 3% H2O2-methanol for 15 min at room temperature, washed with ddH2O and PBS, and then probed with a Superoxide dismutase-1 monoclonal antibody (Product # MA1-105) diluted by 3% BSA-PBS at a dilution of 1:200 overnight at 4°C in a humidified chamber. Tissues were washed extensively PBST and detection was performed using an HRP-conjugated secondary antibody followed by colorimetric detection using a DAB kit. Tissues were counterstained with hematoxylin and dehydrated with ethanol and xylene to prep for mounting.
- Submitted by
- Invitrogen Antibodies (provider)
- Main image
- Experimental details
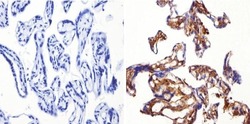
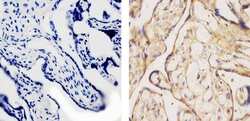
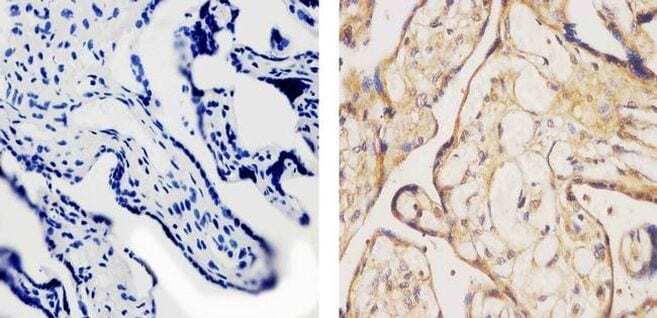
- Immunohistochemistry analysis of Superoxide dismutase-1 showing positive staining in the cytoplasm of paraffin-treated Human placenta tissue (right) compared with a negative control in the absence of primary antibody (left). To expose target proteins, antigen retrieval method was performed using 10mM sodium citrate (pH 6.0), microwaved for 8-15 min. Following antigen retrieval, tissues were blocked in 3% H2O2-methanol for 15 min at room temperature, washed with ddH2O and PBS, and then probed with a Superoxide dismutase-1 monoclonal antibody (Product # MA1-105) diluted by 3% BSA-PBS at a dilution of 1:200 overnight at 4°C in a humidified chamber. Tissues were washed extensively PBST and detection was performed using an HRP-conjugated secondary antibody followed by colorimetric detection using a DAB kit. Tissues were counterstained with hematoxylin and dehydrated with ethanol and xylene to prep for mounting.
- Submitted by
- Invitrogen Antibodies (provider)
- Main image
- Experimental details
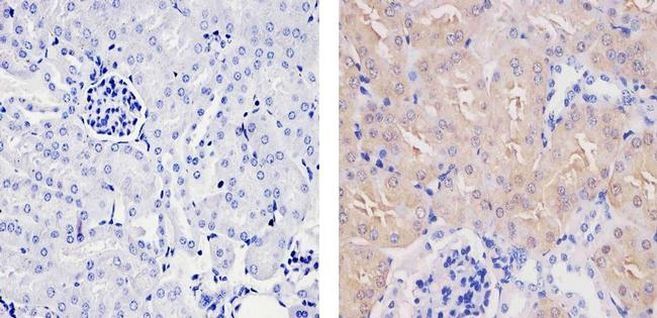
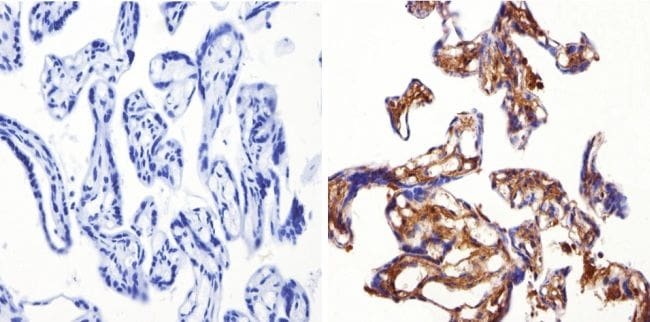
- Immunohistochemistry analysis of SOD1 showing staining in the cytoplasm and nucleus of paraffin-embedded human placenta tissue (right) compared to a negative control without primary antibody (left). To expose target proteins, antigen retrieval was performed using 10mM sodium citrate (pH 6.0), microwaved for 8-15 min. Following antigen retrieval, tissues were blocked in 3% H2O2-methanol for 15 min at room temperature, washed with ddH2O and PBS, and then probed with a SOD1 (8B10) Mouse Monoclonal Antibody (Product # MA1-105) diluted in 3% BSA-PBS at a dilution of 1:20 for 1 hour at 37ºC in a humidified chamber. Tissues were washed extensively in PBST and detection was performed using an HRP-conjugated secondary antibody followed by colorimetric detection using a DAB kit. Tissues were counterstained with hematoxylin and dehydrated with ethanol and xylene to prep for mounting.
- Submitted by
- Invitrogen Antibodies (provider)
- Main image
- Experimental details
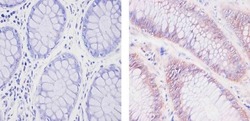
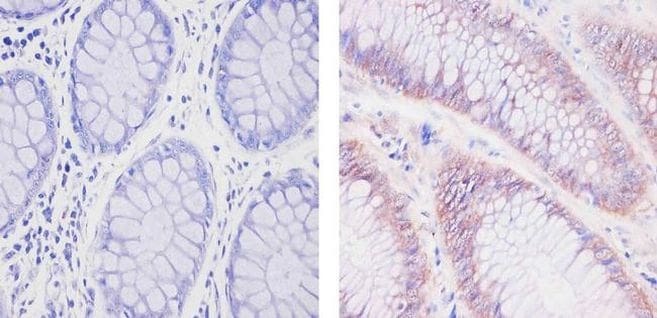
- Immunohistochemistry analysis of SOD1 showing staining in the cytoplasm and nucleus of paraffin-embedded human colon carcinoma (right) compared to a negative control without primary antibody (left). To expose target proteins, antigen retrieval was performed using 10mM sodium citrate (pH 6.0), microwaved for 8-15 min. Following antigen retrieval, tissues were blocked in 3% H2O2-methanol for 15 min at room temperature, washed with ddH2O and PBS, and then probed with a SOD1 (8B10) Mouse Monoclonal Antibody (Product # MA1-105) diluted in 3% BSA-PBS at a dilution of 1:20 for 1 hour at 37ºC in a humidified chamber. Tissues were washed extensively in PBST and detection was performed using an HRP-conjugated secondary antibody followed by colorimetric detection using a DAB kit. Tissues were counterstained with hematoxylin and dehydrated with ethanol and xylene to prep for mounting.
Supportive validation
- Submitted by
- Invitrogen Antibodies (provider)
- Main image
- Experimental details
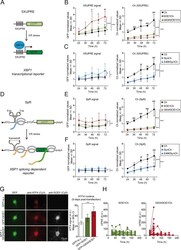
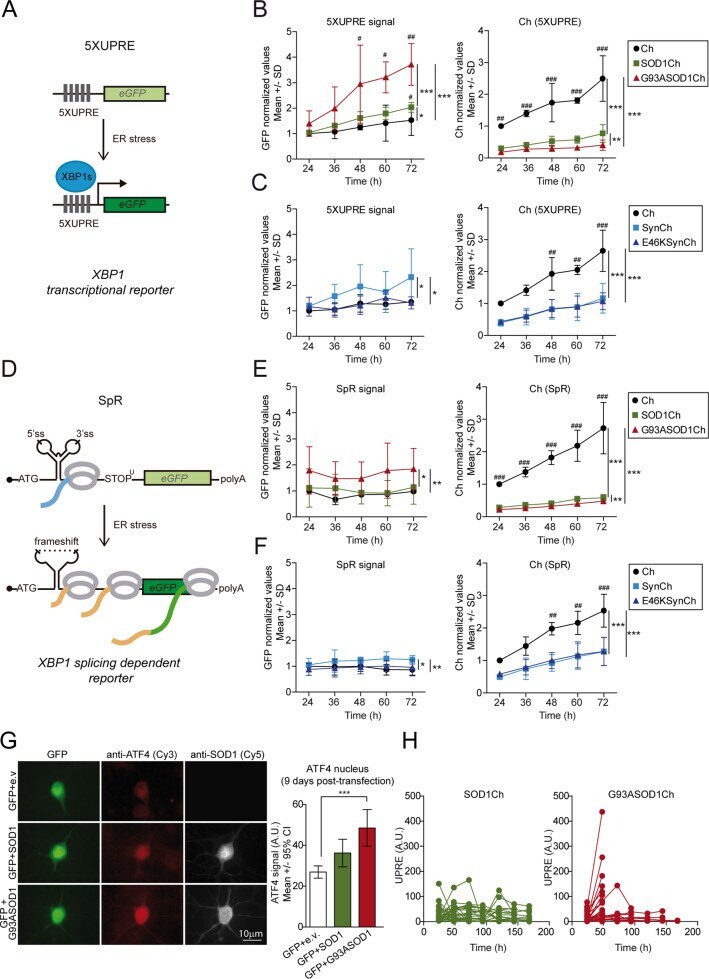
- Fig. 2 UPR signaling is activated in G93A SOD1-expressing neurons. a Scheme of the GFP-based transcriptional reporter 5XUPRE. Upon ER stress the XBP1 spliced transcription factor (XBP1s) binds five tandem repeats of the UPR element (5XUPRE), thereby enabling GFP transcription. b Left graph: GFP levels quantification over time measured in individual neurons expressing Ch or Ch-tagged versions (SOD1Ch, G93ASOD1Ch) and the transcriptional reporter 5XUPRE. GFP levels were normalized against control condition (Ch, 24 h post transfection). Two-way ANOVA and Bonferroni pairwise comparisons; 5XUPRE levels change significantly among Ch-tagged versions ( F 2,30 = 22.3, p < 0.001) and with time ( F 4,30 = 6.6, p < 0.001). Right graph: Ch fluorescence levels quantification (surrogate of protein levels) from neurons analyzed on the left graph. Protein levels change significantly among Ch-tagged versions ( F 2,30 = 119.8, p < 0.001) and with time ( F 4,30 = 9.3, p < 0.001). There is significant interaction in the treatments with time ( F 8,30 = 2.7, p int < 0.05). c Left graph: GFP levels quantification over time measured in individual neurons expressing Ch or Ch-tagged versions (SynCh, E46KSynCh) and the transcriptional reporter 5XUPRE. GFP levels were normalized against control condition (Ch, 24 h post transfection). Two-way ANOVA and Bonferroni pairwise comparisons; 5XUPRE levels change significantly among Ch-tagged versions ( F 2,30 = 6.1, p < 0.01). Right graph: Ch fluorescence levels
- Submitted by
- Invitrogen Antibodies (provider)
- Main image
- Experimental details
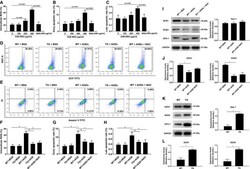
- Advanced glycation end products (AGEs) impaired the viability of bone marrow mesenchymal stromal cells (bMSCs) through increased reactive oxygen species (ROS) production attributable to selective reduction of superoxide dismutase (SOD)-1 and SOD-3 expression. A through C , Culture of bMSCs with AGE-BSA (with concentration from 100 to 400 mug/mL with BSA as control) significantly increased intracellular ROS ( A ) and early ( B ) and late apoptosis ( C ) in a dose-dependent manner. n=6/group. * P

- Submitted by
- Invitrogen Antibodies (provider)
- Main image
- Experimental details
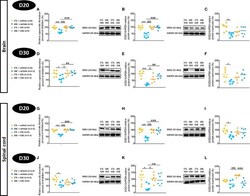
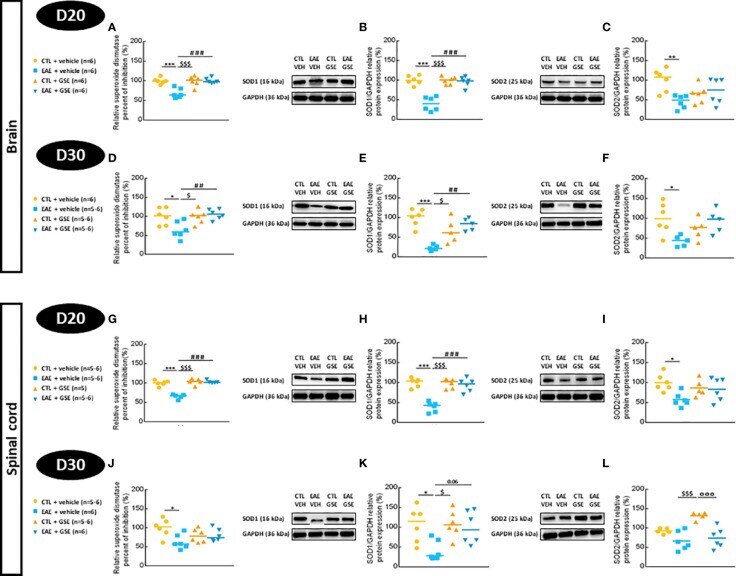
- Evaluation of superoxide dismutase activity and protein expressions in the brain and spinal cord of experimental autoimmune encephalomyelitis mice (EAE) and their controls (CTL) after curative treatment with grape seed extract (GSE) or vehicle. Superoxide dismutase activity was expressed as the relative percent of inhibition (%) compared to CTL + vehicle group, in the brain (A, D) and the spinal cord (G, J) at D20 (A, G) or D30 (D, J) post-induction. SOD1/GAPDH protein expression was expressed as the relative protein expression (%) compared to CTL + vehicle group, in the brain (B, E) and the spinal cord (H, K) at D20 (B, H) or D30 (E, K) post-induction. SOD2/GAPDH protein expression was expressed as the relative protein expression (%) compared to CTL + vehicle group, in the brain (C, F) and the spinal cord (I, L) at D20 (C, I) or D30 (F, L) post-induction. For each protein level quantification, a representative Western blotting image of the target protein and loading control is proposed. Statistical analysis was performed using one-way ANOVA followed by Tukey's multiple comparison test: *p < 0.05, **p < 0.01, ***p < 0.001 EAE + vehicle vs CTL + vehicle; ##p < 0.01, ###p < 0.001 EAE + GSE vs EAE + vehicle, $p < 0.05, $$$p < 0.001 EAE + vehicle vs CTL + GSE and degdegdegp < 0.001 EAE + GSE vs CTL + GSE.
- Submitted by
- Invitrogen Antibodies (provider)
- Main image

- Experimental details
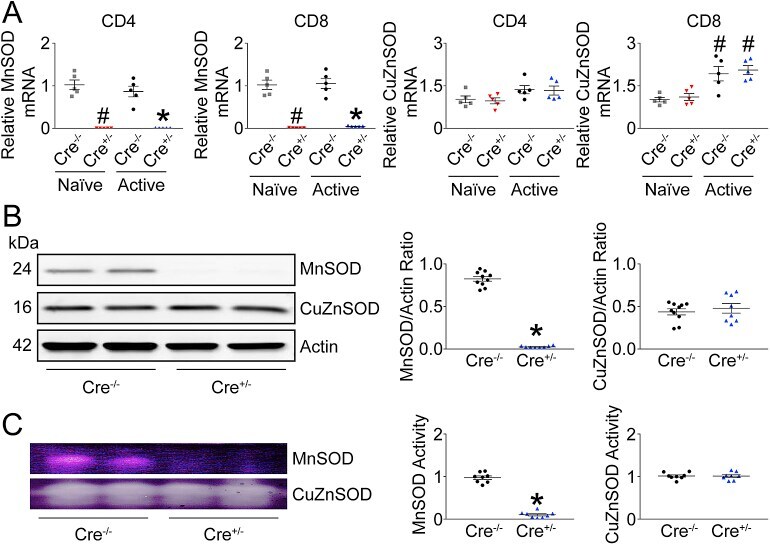
- Fig. 1 MnSOD in T-lymphocytes is efficiently removed using an inducible knock-out strategy . Tamoxifen was administered to MnSOD knock-out (Cre +/- ) and control (Cre -/- ) mice for five consecutive days followed by two weeks to allow full recombination and loss of MnSOD. Splenic T-lymphocytes were isolated from mice and analyzed in either their naive or activated (cultured with anti-CD3 and anti-CD28 beads for 96 h) states. A . Left , MnSOD gene and right , CuZnSOD gene mRNA levels assessed by quantitative real-time RT-PCR. B . Left , representative western blot of MnSOD and CuZnSOD. Right , quantification of respective proteins. C . Left , representative activity gel of MnSOD and CuZnSOD. Right , quantification of respective proteins. #p < 0.01 versus naive Cre -/- ; *p < 0.01 versus activated Cre -/- by parametric Student's t-test or nonparametric Mann-Whitney U test where appropriate. Fig. 1