 Explore
 Validate
 Learn
Learn Western blot
Antibody data
- Antibody Data
- Antigen structure
- References [7]
- Comments [0]
- Validations
- Western blot [6]
- Immunocytochemistry [1]
- Other assay [4]
Submit
Validation data
Reference
Comment
Report error
- Product number
- PA5-27240 - Provider product page

- Provider
- Invitrogen Antibodies
- Product name
- SOD1 Polyclonal Antibody
- Antibody type
- Polyclonal
- Antigen
- Synthetic peptide
- Description
- Recommended positive controls: 293T, A431, HeLa, HepG2, NT2D1, PC-3, SK-N-SH, Rat brain, U87-MG.
- Concentration
- 0.21 mg/mL
Submitted references Preventive Effect of Limosilactobacillus fermentum SCHY34 on Lead Acetate-Induced Neurological Damage in SD Rats.
Expression of antioxidant enzymes in lesions of multiple sclerosis and its models.
The Transcriptional Complex Sp1/KMT2A by Up-Regulating Restrictive Element 1 Silencing Transcription Factor Accelerates Methylmercury-Induced Cell Death in Motor Neuron-Like NSC34 Cells Overexpressing SOD1-G93A.
Oxidative stress and mitochondrial uncoupling protein 2 expression in hepatic steatosis induced by exposure to xenobiotic DDE and high fat diet in male Wistar rats.
Resveratrol treatment reduces the vulnerability of SH-SY5Y cells and cortical neurons overexpressing SOD1-G93A to Thimerosal toxicity through SIRT1/DREAM/PDYN pathway.
Methylmercury alters proliferation, migration, and antioxidant capacity in human HTR8/SV-neo trophoblast cells.
In vivo genome editing improves motor function and extends survival in a mouse model of ALS.
Long X, Wu H, Zhou Y, Wan Y, Kan X, Gong J, Zhao X
Frontiers in nutrition 2022;9:852012
Frontiers in nutrition 2022;9:852012
Expression of antioxidant enzymes in lesions of multiple sclerosis and its models.
Moezzi D, Dong Y, Jain RW, Lozinski BM, Ghorbani S, D'Mello C, Wee Yong V
Scientific reports 2022 Jul 26;12(1):12761
Scientific reports 2022 Jul 26;12(1):12761
The Transcriptional Complex Sp1/KMT2A by Up-Regulating Restrictive Element 1 Silencing Transcription Factor Accelerates Methylmercury-Induced Cell Death in Motor Neuron-Like NSC34 Cells Overexpressing SOD1-G93A.
Guida N, Sanguigno L, Mascolo L, Calabrese L, Serani A, Molinaro P, Lau CG, Annunziato L, Formisano L
Frontiers in neuroscience 2021;15:771580
Frontiers in neuroscience 2021;15:771580
Oxidative stress and mitochondrial uncoupling protein 2 expression in hepatic steatosis induced by exposure to xenobiotic DDE and high fat diet in male Wistar rats.
Migliaccio V, Scudiero R, Sica R, Lionetti L, Putti R
PloS one 2019;14(4):e0215955
PloS one 2019;14(4):e0215955
Resveratrol treatment reduces the vulnerability of SH-SY5Y cells and cortical neurons overexpressing SOD1-G93A to Thimerosal toxicity through SIRT1/DREAM/PDYN pathway.
Laudati G, Mascolo L, Guida N, Sirabella R, Pizzorusso V, Bruzzaniti S, Serani A, Di Renzo G, Canzoniero LMT, Formisano L
Neurotoxicology 2019 Mar;71:6-15
Neurotoxicology 2019 Mar;71:6-15
Methylmercury alters proliferation, migration, and antioxidant capacity in human HTR8/SV-neo trophoblast cells.
Tucker EK, Nowak RA
Reproductive toxicology (Elmsford, N.Y.) 2018 Jun;78:60-68
Reproductive toxicology (Elmsford, N.Y.) 2018 Jun;78:60-68
In vivo genome editing improves motor function and extends survival in a mouse model of ALS.
Gaj T, Ojala DS, Ekman FK, Byrne LC, Limsirichai P, Schaffer DV
Science advances 2017 Dec;3(12):eaar3952
Science advances 2017 Dec;3(12):eaar3952
No comments: Submit comment
Supportive validation
- Submitted by
- Invitrogen Antibodies (provider)
- Main image
- Experimental details
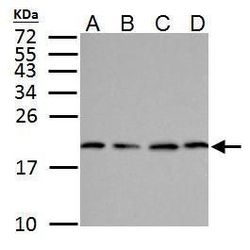
- Western blot analysis of SOD1 using A.30 µg NT2D1 whole cell lysate (B) 30 µg PC-3 whole cell lysate (C) 30 µg U87-MG whole cell lysate and D) 30 µg SK-N-SH whole cell lysate. Samples were loaded onto a 15% SDS-PAGE gel and probed with a SOD1 polyclonal antibody (Product # PA5-27240) at a dilution of 1:500.
- Submitted by
- Invitrogen Antibodies (provider)
- Main image
- Experimental details
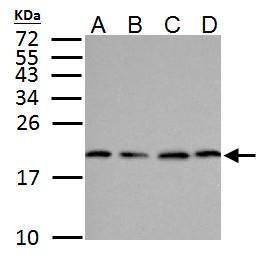
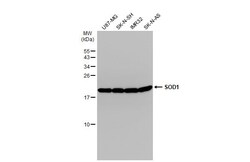
- Western Blot analysis of SOD1 was performed by separating 30 µg of various whole cell extracts by 15% SDS-PAGE. Proteins were transferred to a membrane and probed with a SOD1 Polyclonal Antibody (Product # PA5-27240) at a dilution of 1:1000 and a HRP-conjugated anti-rabbit IgG secondary antibody.
- Submitted by
- Invitrogen Antibodies (provider)
- Main image

- Experimental details
- Western Blot using SOD1 Polyclonal Antibody (Product # PA5-27240). Sample (50 µg of whole cell lysate). Lane A: Rat brain. 15% SDS PAGE. SOD1 Polyclonal Antibody (Product # PA5-27240) diluted at 1:1,000. The HRP-conjugated anti-rabbit IgG antibody was used to detect the primary antibody.

- Submitted by
- Invitrogen Antibodies (provider)
- Main image
- Experimental details
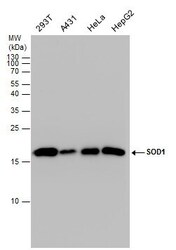
- Western Blot using SOD1 Polyclonal Antibody (Product # PA5-27240). Various whole cell extracts (30 µg) were separated by 15% SDS-PAGE, and the membrane was blotted with SOD1 Polyclonal Antibody (Product # PA5-27240) diluted at 1:1,000. The HRP-conjugated anti-rabbit IgG antibody was used to detect the primary antibody.

- Submitted by
- Invitrogen Antibodies (provider)
- Main image
- Experimental details
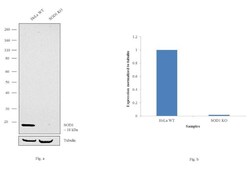
- Western blot analysis of SOD1 was performed by loading 30 µg of HeLa (Lane 1), HeLa - SOD1 knockout (Lane 2) whole cell lysate. The blot was probed with Anti-SOD1 Polyclonal Antibody (Product # PA5-27240, 1:1000 dilution) and Goat anti-Rabbit IgG (H+L) Superclonal™ Secondary Antibody, HRP conjugate (Product # A27036, 0.25 µg/mL, 1:4000 dilution). Loss of signal upon CRISPR mediated knockout (KO) confirms that antibody is specific to SOD1.

- Submitted by
- Invitrogen Antibodies (provider)
- Main image

- Experimental details
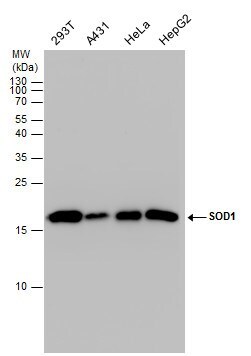
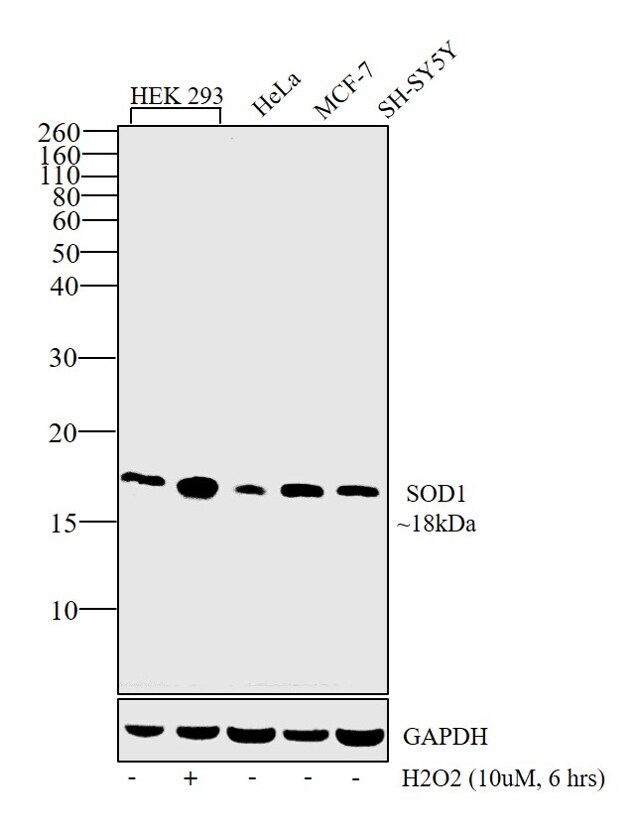
- Western blot analysis was performed on whole cell extracts of HEK-293 (Lane 1), HEK-293 treated with H2O2 (10uM, 6hrs) (Lane 2), HeLa (Lane 3), MCF-7 (Lane 4), and SH-SY5Y (Lane 5). The blot was probed with SOD1 Polyclonal Antibody (Product # PA5-27240, 1:1000 dilution) and detected by chemiluminescence using Goat anti-Rabbit IgG (H+L) Superclonal™ Secondary Antibody, HRP conjugate (Product # A27036, 0.25 µg/mL, 1:4000 dilution). A 18kDa band corresponding to SOD1 was observed across the panel and was upregulated upon H2O2 treatment in HEK-293 cells.
Supportive validation
- Submitted by
- Invitrogen Antibodies (provider)
- Main image
- Experimental details
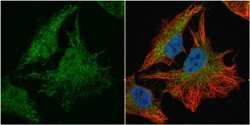
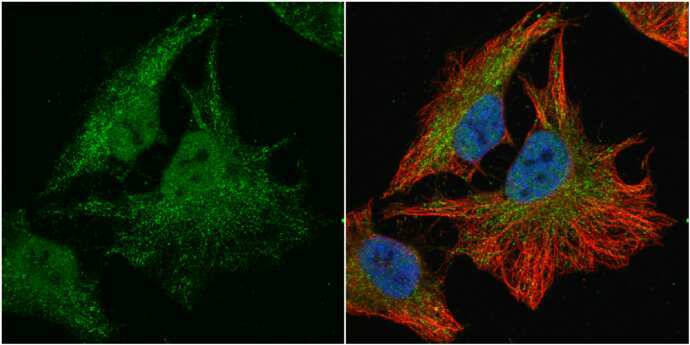
- Immunocytochemistry-Immunofluorescence analysis of SOD1 was performed in HeLa cells fixed in 4% paraformaldehyde at RT for 15 min. Green: SOD1 Polyclonal Antibody (Product # PA5-27240) diluted at 1:100. Red: alpha Tubulin, a cytoskeleton marker. Blue: Hoechst 33342 staining.
Supportive validation
- Submitted by
- Invitrogen Antibodies (provider)
- Main image
- Experimental details
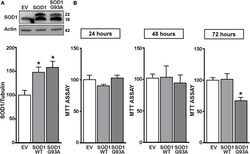
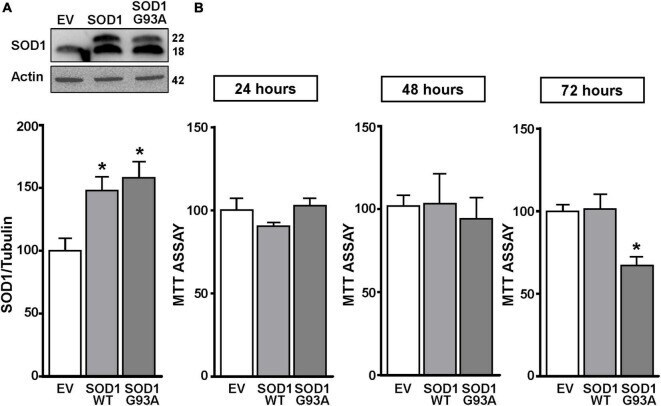
- FIGURE 1 SOD1 protein levels and cell viability in motor neuron like NSC34 cells transiently transfected with the empty vector, SOD1-WT and SOD1-G93A constructs. (A) Western Blot of SOD1 in NSC34 transiently transfected with the followed vectors: (1) empty vector (EV), (2) wild type human SOD1 (SOD1-WT) and (3) human SOD1 containing the G93A mutation (SOD1-G93A). Graphs show quantification of ratio of SOD1 and Actin. Bars represent mean +- SD ( n = 3); * p
- Submitted by
- Invitrogen Antibodies (provider)
- Main image
- Experimental details
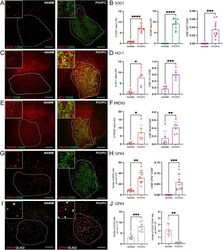
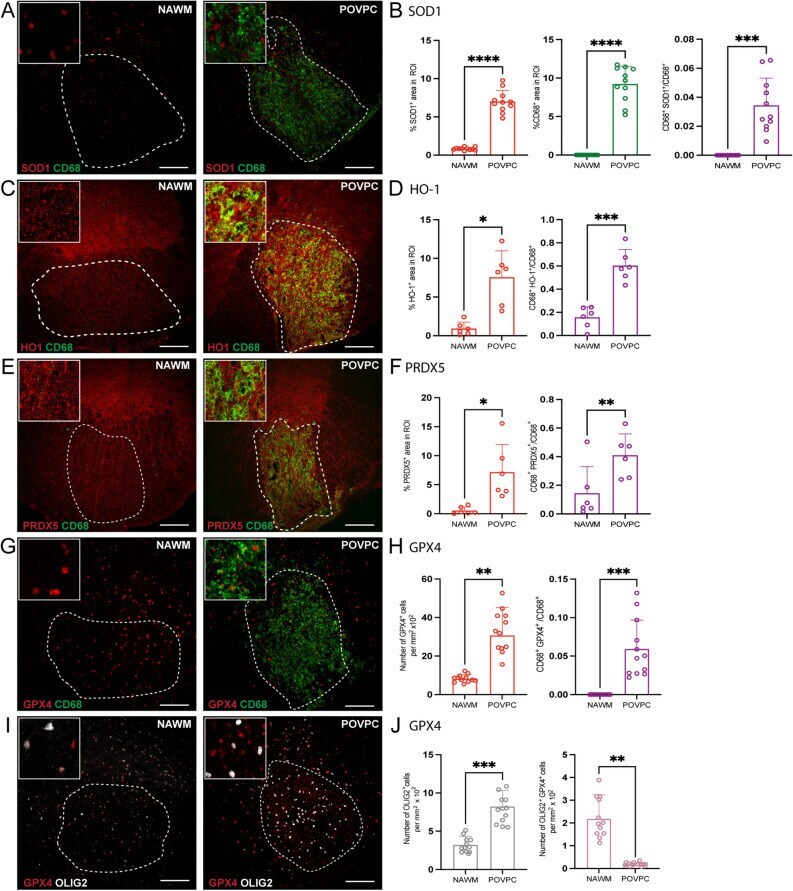
- Expression of antioxidant enzymes is upregulated in POVPC-induced spinal cord lesions. ( A , C , E , G , I ) Representative confocal images of NAWM or POVPC injected spinal cord labeled with CD68 for microglia/macrophage (green), antioxidant enzyme of interest (red), and OLIG2 for oligodendrocyte lineage cells (white). Dotted line indicates the NAWM or lesion region of interest (ROI) selected for image analysis. ( B , D , F ) Bar graphs comparing the percent of ROI that is CD68 + , antioxidant enzyme of interest, and CD68 + antioxidant enzyme + . ( H ) Bar graph comparing the number of GPX4 + cells per mm 2 x 10 2 of ROI and percent of ROI that is CD68 + GPX4 + ( J ) Bar graph representing number of OLIG2 + cells per mm 2 x 10 2 of ROI and percent of ROI that is OLIG2 + GPX4 + . Scale bar = 100 um. Data are shown as mean +- S.D, n = 6-12 mice. Significance indicated as * p < 0.05, ** p < 0.01, *** p < 0.001, **** p < 0.0001, two-tailed, paired student's t-test.
- Submitted by
- Invitrogen Antibodies (provider)
- Main image
- Experimental details
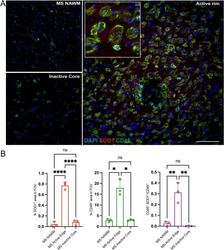
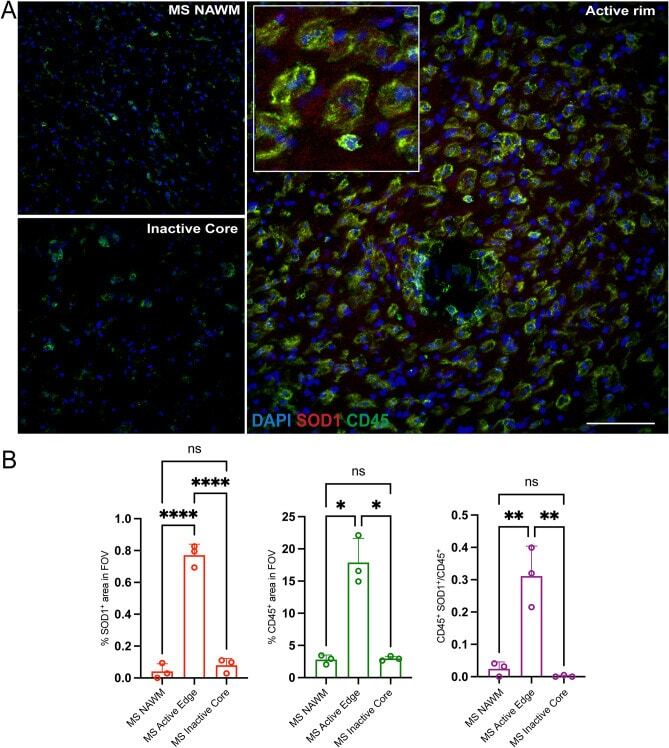
- Expression of SOD1 antioxidant enzyme is elevated in the chronic active rim of MS lesions. ( A ) Representative confocal images of NAWM, inactive Core, and active rim of an MS lesion labeled with CD45 for immune cells (green), SOD1 (red) and DAPI (blue). ( B ) Bar graphs comparing the percent of field of view (FOV) that is CD45 + , SOD1 + , and CD45 + SOD1 + . Scale bar = 100 um. Data are shown as mean +- S.D, n = 3 MS patients. Significance indicated as * p < 0.05, ** p < 0.01, *** p < 0.001, **** p < 0.0001, One-way ANOVA with Tukey's post-hoc test.
- Submitted by
- Invitrogen Antibodies (provider)
- Main image
- Experimental details
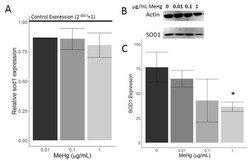
- Figure 5 Effect of MeHg on SOD1 expression. HTR8/SV-neo cells were treated with 0, 0.01, 0.1, or 1 mug/mL MeHg for 24 hours (N=3 replicates x 2 duplicates). Expression of sod1 mRNA was quantified by RT-PCR (A). All three doses led to a decrease in sod1 expression relative to control expression (horizontal line), though none of the decreases were statistically significant. Western blot images for SOD1 and the loading control are shown in (B), and the associated quantification (C) revealed an overall dose-dependent decrease in SOD1 protein levels. 1 mug/mL MeHg treatment caused a significant decrease in SOD1 levels relative to 0 mug/mL MeHg (* denotes p
