Explore
 Validate
 Learn
Learn Western blot
 Immunocytochemistry
Antibody data
- Antibody Data
- Antigen structure
- References [2]
- Comments [0]
- Validations
- Immunocytochemistry [7]
- Immunohistochemistry [1]
- Other assay [2]
Submit
Validation data
Reference
Comment
Report error
- Product number
- PA1-100 - Provider product page

- Provider
- Invitrogen Antibodies
- Product name
- GATA2 Polyclonal Antibody
- Antibody type
- Polyclonal
- Antigen
- Recombinant full-length protein
- Description
- PA1-100 specifically detects GATA2 and does not cross-react with GATA1 or GATA3.
- Reactivity
- Human, Mouse
- Host
- Rabbit
- Isotype
- IgG
- Vial size
- 100 μg
- Concentration
- 1 mg/mL
- Storage
- -20°C
Submitted references Single-cell RNA-Seq resolves cellular complexity in sensory organs from the neonatal inner ear.
Repression of arterial genes in hemogenic endothelium is sufficient for haematopoietic fate acquisition.
Burns JC, Kelly MC, Hoa M, Morell RJ, Kelley MW
Nature communications 2015 Oct 15;6:8557
Nature communications 2015 Oct 15;6:8557
Repression of arterial genes in hemogenic endothelium is sufficient for haematopoietic fate acquisition.
Lizama CO, Hawkins JS, Schmitt CE, Bos FL, Zape JP, Cautivo KM, Borges Pinto H, Rhyner AM, Yu H, Donohoe ME, Wythe JD, Zovein AC
Nature communications 2015 Jul 23;6:7739
Nature communications 2015 Jul 23;6:7739
No comments: Submit comment
Supportive validation
- Submitted by
- Invitrogen Antibodies (provider)
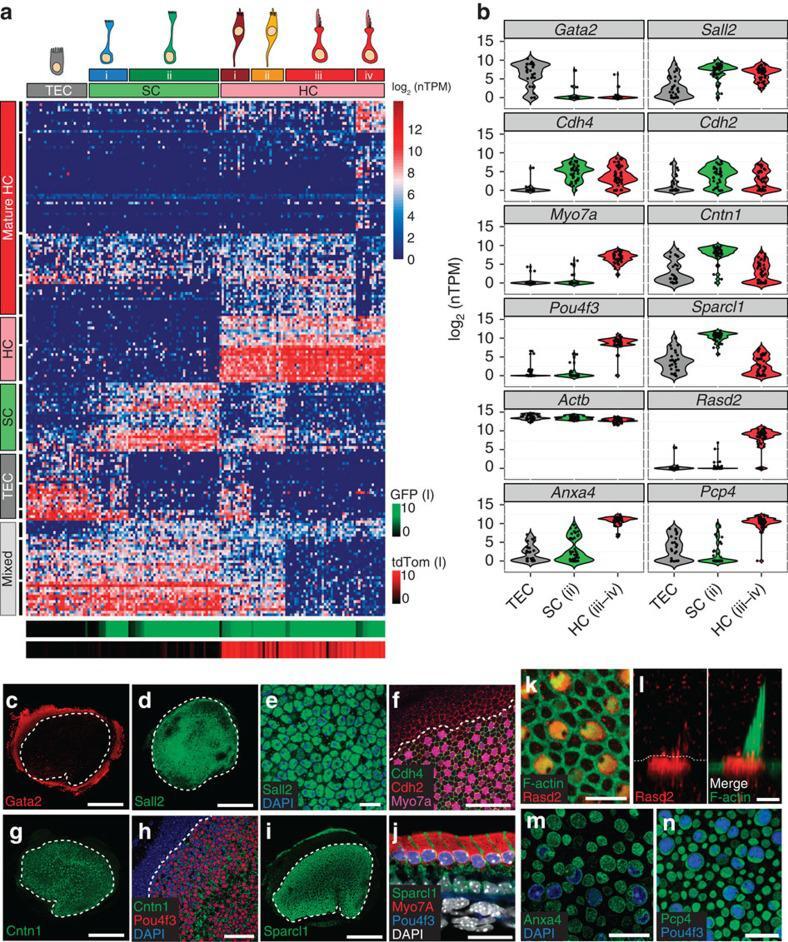
- Main image
- Experimental details
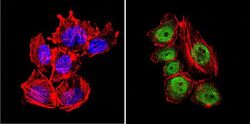
- Immunofluorescent analysis of GATA2 (green) in Hela cells. Formalin-fixed cells were permeabilized with 0.1% Triton X-100 in TBS for 5-10 minutes at room temperature and blocked with 3% BSA-PBS for 30 minutes at room temperature. Cells were probed with a GATA2 polyclonal antibody (Product # PA1-100) at a dilution of 1:200 and incubated overnight in a humidified chamber. Cells were washed with PBST and incubated with a DyLight-conjugated secondary antibody for 45 minutes at room temperature in the dark. F-actin (red) was stained with a fluorescent phalloidin and nuclei (blue) were stained with DAPI. Images were taken at a 60X magnification.

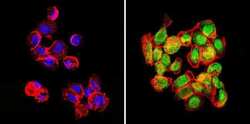
- Submitted by
- Invitrogen Antibodies (provider)
- Main image

- Experimental details
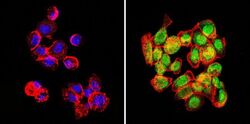
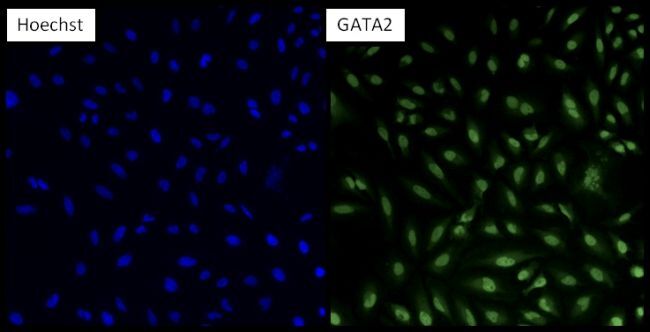
- Immunofluorescent analysis of GATA2 (green) in U251 cells. Formalin-fixed cells were permeabilized with 0.1% Triton X-100 in TBS for 5-10 minutes at room temperature and blocked with 3% BSA-PBS for 30 minutes at room temperature. Cells were probed with a GATA2 polyclonal antibody (Product # PA1-100) at a dilution of 1:20 and incubated overnight in a humidified chamber. Cells were washed with PBST and incubated with a DyLight-conjugated secondary antibody for 45 minutes at room temperature in the dark. F-actin (red) was stained with a fluorescent phalloidin and nuclei (blue) were stained with DAPI. Images were taken at a 60X magnification.

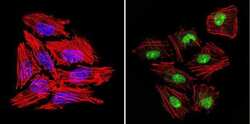
- Submitted by
- Invitrogen Antibodies (provider)
- Main image
- Experimental details
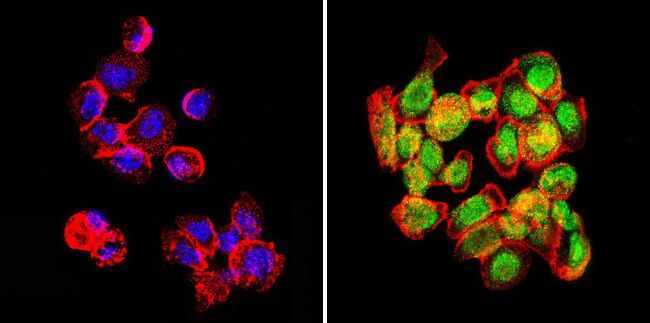
- Immunofluorescent analysis of GATA2 (green) in human cells. Formalin-fixed cells were permeabilized with 0.1% Triton X-100 in TBS for 5-10 minutes at room temperature and blocked with 3% BSA-PBS for 30 minutes at room temperature. Cells were probed with a GATA2 polyclonal antibody (Product # PA1-100) at a dilution of 1:100 and incubated overnight in a humidified chamber. Cells were washed with PBST and incubated with a DyLight-conjugated secondary antibody for 45 minutes at room temperature in the dark. F-actin (red) was stained with a fluorescent phalloidin and nuclei (blue) were stained with DAPI. Images were taken at a 60X magnification.
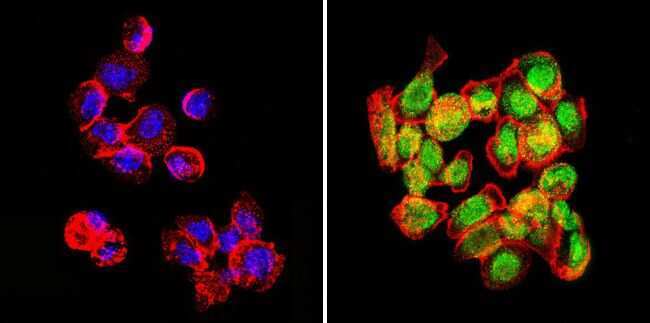
- Submitted by
- Invitrogen Antibodies (provider)
- Main image
- Experimental details
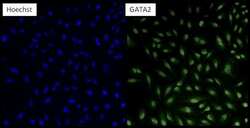
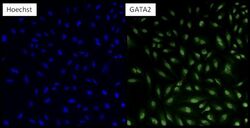
- Immunofluorescent analysis of GATA2 (green) in HeLa cells. Formalin fixed cells were permeabilized with 0.1% Triton X-100 in TBS for 10 minutes at room temperature. Cells were then blocked with 5% normal goat serum (Product # 31873) for 15 minutes at room temperature. Cells were then probed with a rabbit polyclonal antibody recognizing GATA2 (Product # PA1-100) at a dilution of 1:200 for at least 1 hour at 37°C. Cells were then washed with PBS and incubated with DyLight 488 goat-anti-rabbit secondary antibody at a dilution of 1:200 for 30 minutes at room temperature. Nuclei (blue) were stained with Hoechst 33342 dye (Product # 62249). Images were taken on a Thermo Scientific ArrayScan at 10X magnification.

- Submitted by
- Invitrogen Antibodies (provider)
- Main image
- Experimental details
- Immunofluorescent analysis of GATA2 (green) in U251 cells. Formalin-fixed cells were permeabilized with 0.1% Triton X-100 in TBS for 5-10 minutes at room temperature and blocked with 3% BSA-PBS for 30 minutes at room temperature. Cells were probed with a GATA2 polyclonal antibody (Product # PA1-100) at a dilution of 1:20 and incubated overnight in a humidified chamber. Cells were washed with PBST and incubated with a DyLight-conjugated secondary antibody for 45 minutes at room temperature in the dark. F-actin (red) was stained with a fluorescent phalloidin and nuclei (blue) were stained with DAPI. Images were taken at a 60X magnification.

- Submitted by
- Invitrogen Antibodies (provider)
- Main image
- Experimental details
- Immunofluorescent analysis of GATA2 (green) in human cells. Formalin-fixed cells were permeabilized with 0.1% Triton X-100 in TBS for 5-10 minutes at room temperature and blocked with 3% BSA-PBS for 30 minutes at room temperature. Cells were probed with a GATA2 polyclonal antibody (Product # PA1-100) at a dilution of 1:100 and incubated overnight in a humidified chamber. Cells were washed with PBST and incubated with a DyLight-conjugated secondary antibody for 45 minutes at room temperature in the dark. F-actin (red) was stained with a fluorescent phalloidin and nuclei (blue) were stained with DAPI. Images were taken at a 60X magnification.
- Submitted by
- Invitrogen Antibodies (provider)
- Main image
- Experimental details
- Immunofluorescent analysis of GATA2 (green) in HeLa cells. Formalin fixed cells were permeabilized with 0.1% Triton X-100 in TBS for 10 minutes at room temperature. Cells were then blocked with 5% normal goat serum (Product # 31873) for 15 minutes at room temperature. Cells were then probed with a rabbit polyclonal antibody recognizing GATA2 (Product # PA1-100) at a dilution of 1:200 for at least 1 hour at 37°C. Cells were then washed with PBS and incubated with DyLight 488 goat-anti-rabbit secondary antibody at a dilution of 1:200 for 30 minutes at room temperature. Nuclei (blue) were stained with Hoechst 33342 dye (Product # 62249). Images were taken on a Thermo Scientific ArrayScan at 10X magnification.
Supportive validation
- Submitted by
- Invitrogen Antibodies (provider)
- Main image
- Experimental details
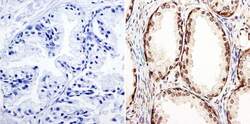
- Immunohistochemistry was performed on human prostate tissue. To expose target protein, antigen was retreived using 10mM sodium citrate followed by microwave treatment for 8-15 minutes. Endogenous peroxidases were blocked in 3% H202-methanol for 15 minutes and tissues were blocked in 3% BSA-PBS for 30 minutes at room temperature. Cells were probed with a GATA2 Rabbit polyclonal antibody (Product # PA1-100) at a dilution of 1:100 overnight in a humidified chamber. Tissues were washed in PBST and detection was performed using a secondary antibody conjugated to HRP. DAB staining buffer was applied and tissues were counterstained with hematoxylin and prepped for mounting. Images were taken at 40X magnification.
Supportive validation
- Submitted by
- Invitrogen Antibodies (provider)
- Main image
- Experimental details
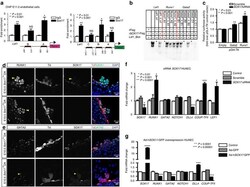
- Figure 3 SOX17 directly binds Runx1 and Gata2 for repression of haematopoietic fate. ( a ) SOX17 chromatin immunoprecipitation (ChIP) qRT-PCR of E11.0 sorted endothelial cells. Letters denote regions with SOX17-binding site consensus sequences upstream of Runx1 and Gata2 promoters, and Lef1 as a positive control. Error bars indicate s.e.m. IgG control set to one for comparisons of fold change, n =3 litters, embryos pooled, P values as indicated. ( b ) Electrophoretic mobility shift assay (EMSA) of putative SOX17-binding sites within ChIP sequences designated by letters in a . Each lane represents biotin-labelled duplexed oligonucleotides containing the Lef1 promoter SOX17-binding site (Lef1_Biot). Addition of rSOX17-Flag produces a specific shift, indicating protein-DNA complex (lane 2), which is competed away by unlabelled Lef1 (Lef1_s1), while mutant probe does not compete (Lef1_Delta_s1). Similar designations are used for putative binding sites (and mutants) in Runx1 and Gata2 sequences. Asterisks denote competitive binding. ( c ) Bar graph depicts luciferase activity of Gata2 and Runx1 promoters after Sox17 siRNA versus control (scramble). P values as indicated. Error bars represent s.e.m. ( d ) Immunofluorescence of haematopoietic cell clusters (arrowhead) in E10.5 dorsal aorta (DA) of Sox17 f/f and Sox17 f/+ mutants (after tamoxifen mediated Cre induction at E9.5). Traced cells labelled in red (Td + ), SOX17 in grey and RUNX1 in green. DAPI in blue. Scale bar, 10 mum. S
- Submitted by
- Invitrogen Antibodies (provider)
- Main image
- Experimental details
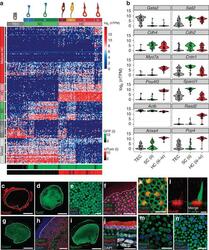
- Figure 2 Single-cell RNA-Seq identifies unique cell types and novel markers in the newborn mouse utricle. ( a ) K -means clustering of 158 P1 utricle cells ( x axis) using the top 195 genes ( y axis) identified with PCA. The gap statistic, an unbiased estimate of the total number of clusters, identified seven distinct clusters. On the basis of expression of known marker genes and fluorescence state (bottom x -axis bars and right legends, displayed on log 2 scale), each cluster was assigned to one of the three known cell types (top x -axis bars): TECs (grey), SCs (light green) and HCs (light red). TECs comprise one cluster, whereas SCs and HCs comprise two (SC.i-ii) and four (HC.i-iv) clusters, respectively. Genes were also divided by k -means (black bars indicate 15 clusters identified by gap statistic) and pooled based on cell type, HC maturity or variation across multiple cell types (Mixed). The Mixed group consists of two gene clusters expressed in non-HCs and one small cluster restricted to SCs and HCs. ( b ) Violin plots for representative genes identified as differentially expressed (FDR