 Explore
 Validate
 Learn
Learn Flow cytometry
Antibody data
- Antibody Data
- Antigen structure
- References [14]
- Comments [0]
- Validations
- Flow cytometry [1]
- Other assay [14]
Submit
Validation data
Reference
Comment
Report error
- Product number
- 16-0549-82 - Provider product page

- Provider
- Invitrogen Antibodies
- Product name
- CD54 (ICAM-1) Monoclonal Antibody (HA58), Functional Grade, eBioscience™
- Antibody type
- Monoclonal
- Antigen
- Other
- Description
- Description: The HA58 monoclonal antibody reacts with human CD54 (InterCellular Adhesion Molecule-1, ICAM-1), a 90-110 kDa transmembrane glycoprotein expressed by monocytes, lymphocytes and endothelial cells. Expression of CD54 is upregulated on activated lymphocytes. Interaction of CD54 with its ligand CD11a is important in the inflammatory response.
- Antibody clone number
- HA58
- Concentration
- 1 mg/mL
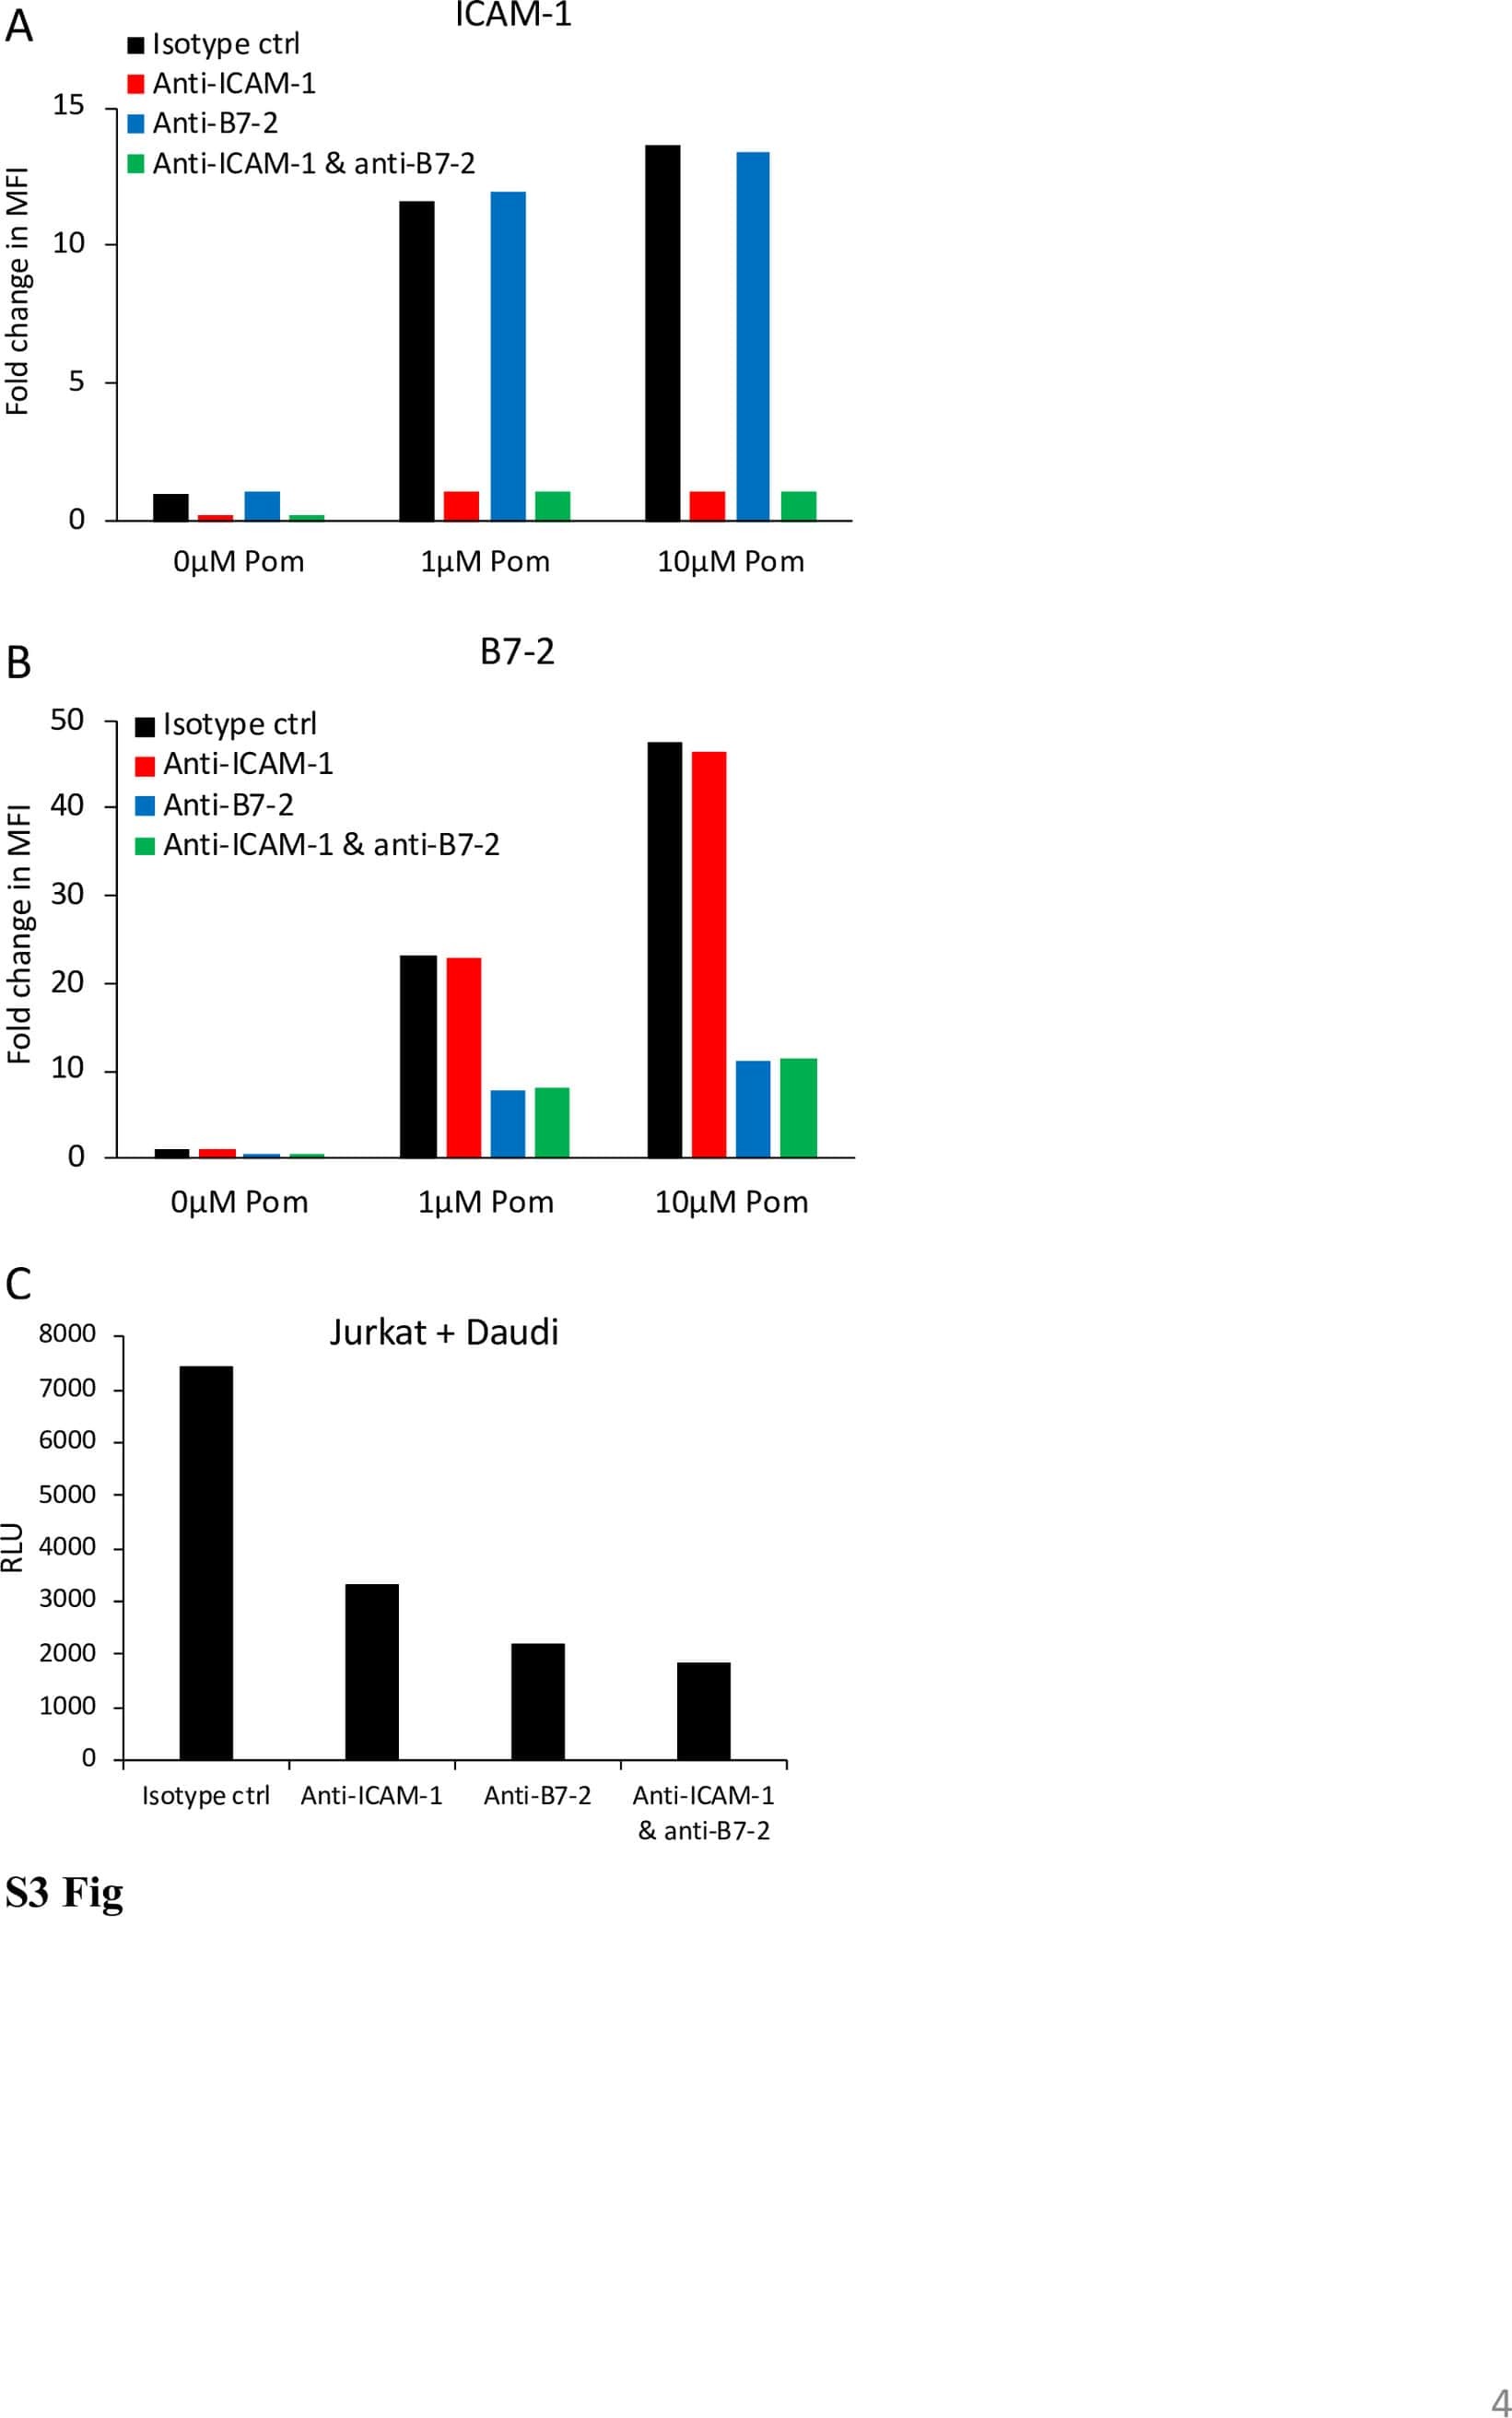
Submitted references Pomalidomide restores immune recognition of primary effusion lymphoma through upregulation of ICAM-1 and B7-2.
Preservation of microvascular barrier function requires CD31 receptor-induced metabolic reprogramming.
EWS-FLI1 low Ewing sarcoma cells demonstrate decreased susceptibility to T-cell-mediated tumor cell apoptosis.
CD54-NOTCH1 axis controls tumor initiation and cancer stem cell functions in human prostate cancer.
The critical role of SENP1-mediated GATA2 deSUMOylation in promoting endothelial activation in graft arteriosclerosis.
Effect of nicotine and porphyromonas gingivalis lipopolysaccharide on endothelial cells in vitro.
Quantitative modeling assesses the contribution of bond strengthening, rebinding and force sharing to the avidity of biomolecule interactions.
Neuroprotective effects of mesenchymal stem cells derived from human embryonic stem cells in transient focal cerebral ischemia in rats.
Mycobacterium tuberculosis-induced gamma interferon production by natural killer cells requires cross talk with antigen-presenting cells involving Toll-like receptors 2 and 4 and the mannose receptor in tuberculous pleurisy.
Requirements for ICAM-1 immunogene therapy of lymphoma.
PR-39 and PR-11 peptides inhibit ischemia-reperfusion injury by blocking proteasome-mediated I kappa B alpha degradation.
PR-39 and PR-11 peptides inhibit ischemia-reperfusion injury by blocking proteasome-mediated I kappa B alpha degradation.
The human natural killer cell immune synapse.
The human natural killer cell immune synapse.
Shrestha P, Davis DA, Jaeger HK, Stream A, Aisabor AI, Yarchoan R
PLoS pathogens 2021 Jan;17(1):e1009091
PLoS pathogens 2021 Jan;17(1):e1009091
Preservation of microvascular barrier function requires CD31 receptor-induced metabolic reprogramming.
Cheung KCP, Fanti S, Mauro C, Wang G, Nair AS, Fu H, Angeletti S, Spoto S, Fogolari M, Romano F, Aksentijevic D, Liu W, Li B, Cheng L, Jiang L, Vuononvirta J, Poobalasingam TR, Smith DM, Ciccozzi M, Solito E, Marelli-Berg FM
Nature communications 2020 Jul 17;11(1):3595
Nature communications 2020 Jul 17;11(1):3595
EWS-FLI1 low Ewing sarcoma cells demonstrate decreased susceptibility to T-cell-mediated tumor cell apoptosis.
Bailey KM, Julian CM, Klinghoffer AN, Bernard H, Lucas PC, McAllister-Lucas LM
Oncotarget 2019 May 21;10(36):3385-3399
Oncotarget 2019 May 21;10(36):3385-3399
CD54-NOTCH1 axis controls tumor initiation and cancer stem cell functions in human prostate cancer.
Li C, Liu S, Yan R, Han N, Wong KK, Li L
Theranostics 2017;7(1):67-80
Theranostics 2017;7(1):67-80
The critical role of SENP1-mediated GATA2 deSUMOylation in promoting endothelial activation in graft arteriosclerosis.
Qiu C, Wang Y, Zhao H, Qin L, Shi Y, Zhu X, Song L, Zhou X, Chen J, Zhou H, Zhang H, Tellides G, Min W, Yu L
Nature communications 2017 Jun 1;8:15426
Nature communications 2017 Jun 1;8:15426
Effect of nicotine and porphyromonas gingivalis lipopolysaccharide on endothelial cells in vitro.
An N, Andrukhov O, Tang Y, Falkensammer F, Bantleon HP, Ouyang X, Rausch-Fan X
PloS one 2014;9(5):e96942
PloS one 2014;9(5):e96942
Quantitative modeling assesses the contribution of bond strengthening, rebinding and force sharing to the avidity of biomolecule interactions.
Lo Schiavo V, Robert P, Limozin L, Bongrand P
PloS one 2012;7(9):e44070
PloS one 2012;7(9):e44070
Neuroprotective effects of mesenchymal stem cells derived from human embryonic stem cells in transient focal cerebral ischemia in rats.
Liu YP, Seçkin H, Izci Y, Du ZW, Yan YP, Başkaya MK
Journal of cerebral blood flow and metabolism : official journal of the International Society of Cerebral Blood Flow and Metabolism 2009 Apr;29(4):780-91
Journal of cerebral blood flow and metabolism : official journal of the International Society of Cerebral Blood Flow and Metabolism 2009 Apr;29(4):780-91
Mycobacterium tuberculosis-induced gamma interferon production by natural killer cells requires cross talk with antigen-presenting cells involving Toll-like receptors 2 and 4 and the mannose receptor in tuberculous pleurisy.
Schierloh P, Yokobori N, Alemán M, Landoni V, Geffner L, Musella RM, Castagnino J, Baldini M, Abbate E, de la Barrera SS, Sasiain MC
Infection and immunity 2007 Nov;75(11):5325-37
Infection and immunity 2007 Nov;75(11):5325-37
Requirements for ICAM-1 immunogene therapy of lymphoma.
Kanwar JR, Berg RW, Yang Y, Kanwar RK, Ching LM, Sun X, Krissansen GW
Cancer gene therapy 2003 Jun;10(6):468-76
Cancer gene therapy 2003 Jun;10(6):468-76
PR-39 and PR-11 peptides inhibit ischemia-reperfusion injury by blocking proteasome-mediated I kappa B alpha degradation.
Bao J, Sato K, Li M, Gao Y, Abid R, Aird W, Simons M, Post MJ
American journal of physiology. Heart and circulatory physiology 2001 Dec;281(6):H2612-8
American journal of physiology. Heart and circulatory physiology 2001 Dec;281(6):H2612-8
The human natural killer cell immune synapse.
Davis DM, Chiu I, Fassett M, Cohen GB, Mandelboim O, Strominger JL
Proceedings of the National Academy of Sciences of the United States of America 1999 Dec 21;96(26):15062-7
Proceedings of the National Academy of Sciences of the United States of America 1999 Dec 21;96(26):15062-7
No comments: Submit comment
Supportive validation
- Submitted by
- Invitrogen Antibodies (provider)
- Main image
- Experimental details
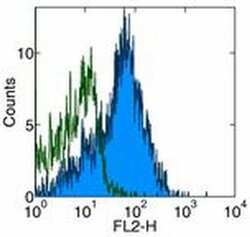
- Staining of normal human peripheral blood cells with Anti-Human CD54 (ICAM-1) PE. Appropriate isotype controls were used (open histogram). Cells in the lymphocyte population were used for analysis.

Supportive validation
- Submitted by
- Invitrogen Antibodies (provider)
- Main image

- Experimental details
- NULL
- Submitted by
- Invitrogen Antibodies (provider)
- Main image
- Experimental details
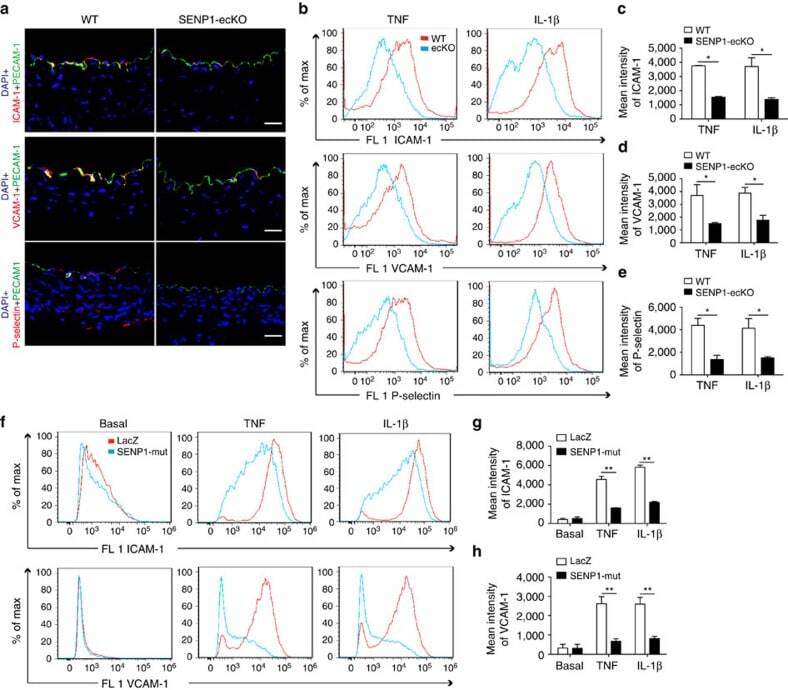
- Figure 3 Loss of endothelial SENP1 inhibits EC activation. ( a ) Grafts from WT or SENP1-ecKO mice were harvested 3 days post-transplantation. The induction of endothelial adhesion molecules was demonstrated by immunofluorescence staining of ICAM-1, VCAM-1, or P-selectin and PECAM-1 with DAPI labelling of the nuclei. Bar represents 50 mum. ( b - e ) Attenuated induction of adhesion molecules in SENP1-ecKO MAECs. Flow cytometry analysis of ICAM-1, VCAM-1 and P-selectin in MAECs isolated from WT or SENP1-ecKO mice after TNF or IL-1beta treatment. Representative histograms are shown in ( b ) with the quantification of mean intensity in ( c - e ). ( f - h ) Overexpression of the catalytically inactive form of SENP1 (SENP1-Mut) inhibits the induction of adhesion molecules in HUVECs. HUVECs were infected by Ad-SENP1-Mut or vector control (Ad-LacZ) for 24 h, treated with pro-inflammatory cytokines and analysed by flow cytometry in the same way as MAECs. Representative histograms of ICAM-1 and VCAM-1 are shown in ( f ) with the quantification of mean intensity in ( g , h ). Data are presented as the mean+-s.e.m. from at least three independent experiments. * P
- Submitted by
- Invitrogen Antibodies (provider)
- Main image

- Experimental details
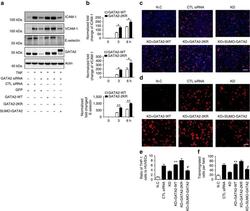
- Figure 8 GATA2 SUMOylation inhibits its DNA binding activity. ( a ) SUMO conjugation reduces GATA2 DNA binding activity. GATA2-WT, GATA2-2KR, SUMO-GATA2 or control constructs were transfected into 293 T cells, and nuclear extracts were processed with EMSA using a GATA2-specific oligonucleotide probe (top). Input of GATA2 was detected by western blotting with anti-Flag antibody (bottom). ( b ) Overexpression of catalytic inactive form of SENP1 (SENP1-Mut) inhibits recruitment of GATA2 to the promoter of ICAM-1, VCAM-1 and E-selectin. HUVECs were infected by Ad-SENP1-Mut or Ad-LacZ and then treated with TNF. Nuclear extracts were then subjected to ChIP assay with the anti-GATA2 antibody followed by quantitative real-time PCR for the promoter sequences of ICAM-1, VCAM-1 and E-selectin containing a GATA2 binding site. Quantitative results are shown as the ratio of ChIP to input values. Data are presented as the mean+-s.e.m. from three independent experiments. * P

- Submitted by
- Invitrogen Antibodies (provider)
- Main image
- Experimental details
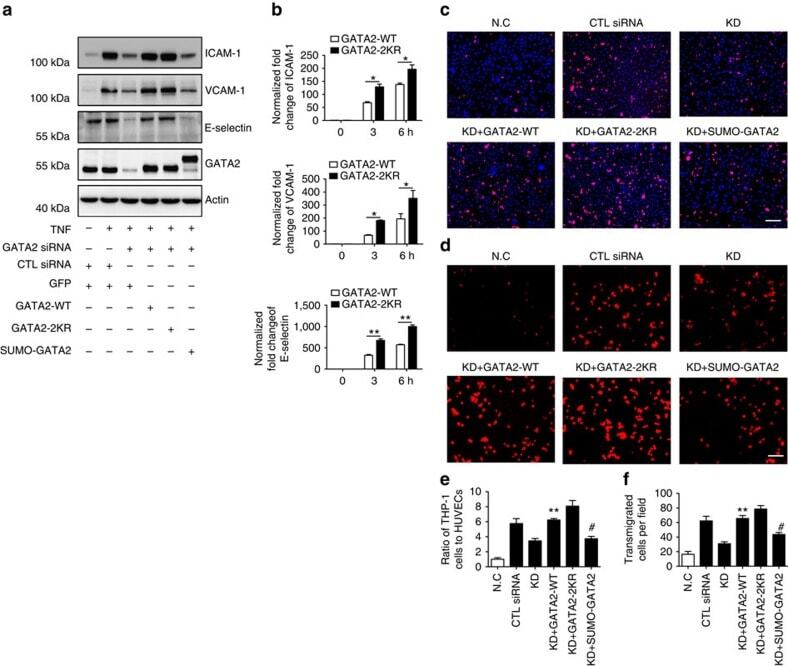
- Figure 9 The critical role of GATA2 SUMOylation in EC activation. ( a ) GATA2 SUMOylation regulates the expression of endothelial adhesion molecules. HUVECs were transfected by GATA2 siRNA or control siRNA for 48 h followed by infection with Ad-GATA2-WT, Ad-GATA2-KR, Ad-SUMO-GATA2 or their vector control (GFP) as indicated. HUVECs were treated with TNF or vehicle control for 24 h, and the cell lysates were then subjected to western blotting with anti-ICAM-1, anti-VCAM-1, anti-E-selectin or anti-GATA2 antibodies. Actin was used as a loading control. ( b ) GATA2 SUMOylation site mutation increases endothelial adhesion molecule induction by TNF at the early phase. The expression of endothelial adhesion molecules was determined by quantitative real-time PCR in HUVECs with GATA2-WT or GATA2-2KR reconstitution as described in ( a ). Data are presented as the mean+-s.e.m. from at least three independent experiments. * P
- Submitted by
- Invitrogen Antibodies (provider)
- Main image

- Experimental details
- Figure 1 EWS-FLI1 and ICAM-1 expression are inversely correlated under basal conditions in our model system. ( A ) Ewing sarcoma cell lines A673 and CHLA-10 were labeled using an APC-conjugated ICAM-1 antibody and near-IR live/dead stain. Gates were generated to analyze live cell singlets with ICAM-1 staining. % denotes the frequency of ICAM-1+ cells upon analysis of a minimum of 10,000 total events. ( B ) A673 and CHLA10 cells were treated with control or EWS-FLI1 siRNA for 72 hours. Generated cDNA was analyzed for EWS-FLI1 and RPLP0 (control) expression using RT-PCR. Relative expression normalized to control siRNA is graphed. Cells treated with control or EWS-FLI1 siRNA were also either ( C ) lysed and subjected to western blot analysis for FLI1 and a vinculin loading control or ( D ) stained and analyzed by flow cytometry for ICAM-1 surface expression ( n = 3 per cell line). Error bars reflect SD. Circles on bar graphs in B and D indicate values for individual replicates. Control versus EWS-FLI1 siRNA treated cells were compared using an unpaired t -test. * p < 0.05, *** p < 0.001.

- Submitted by
- Invitrogen Antibodies (provider)
- Main image

- Experimental details
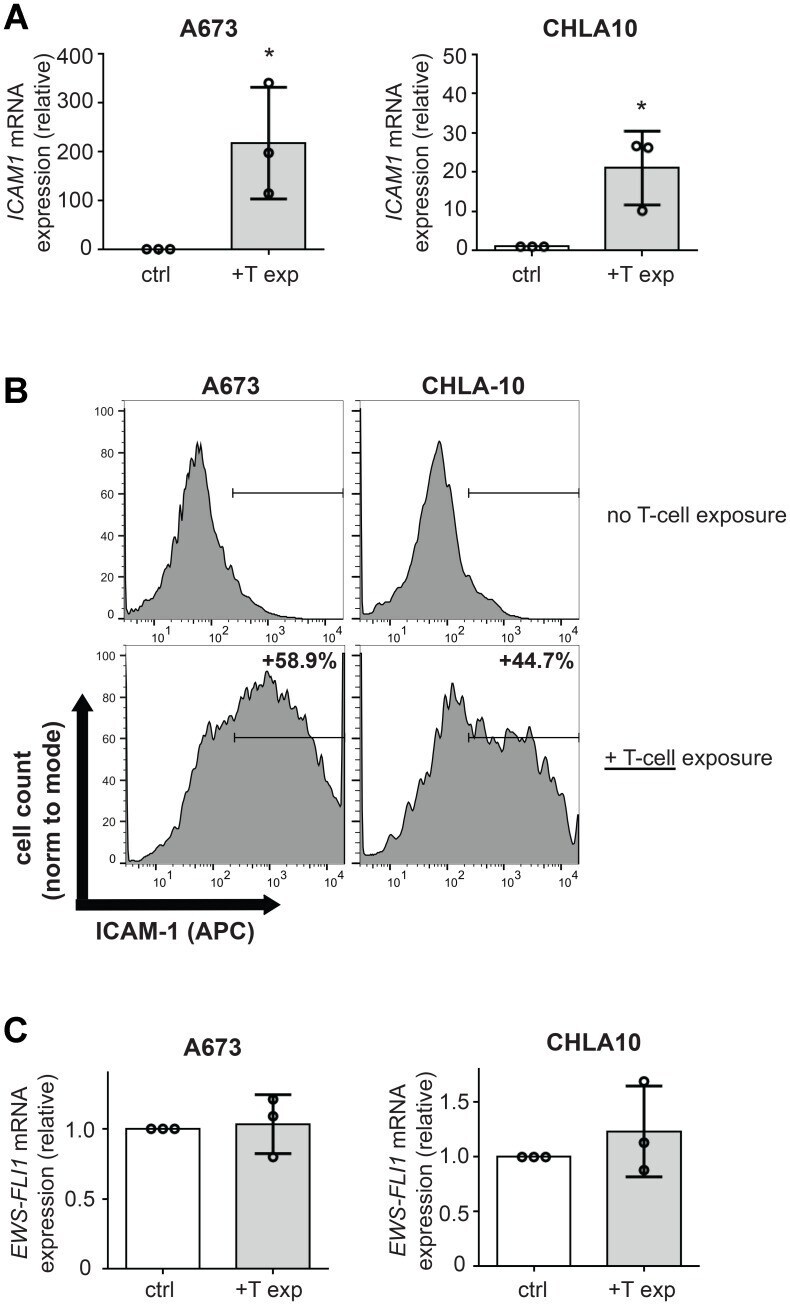
- Figure 2 T-cell exposure leads to increased Ewing tumor cell ICAM-1 expression without changing EWS-FLI1 level. A673 or CHLA-10 Ewing tumor cells were co-cultured +- activated T-cells at a ratio of 1 T-cell per 50 tumor cells for 24 hours versus controls (ctrl=no T-cells). Following incubation, T-cells were washed away and tumor cells were analyzed for ( A ) changes in ICAM1 mRNA expression using RT-PCR ( n = 3) and ( B ) ICAM-1 surface expression using flow cytometry analysis. Graphs in (B) demonstrate live singlet cell populations. % denotes the frequency of ICAM-1+ cells upon analysis of a minimum of 10,000 total events. ( C ) RNA/cDNA from tumor cells in (A) was also analyzed for changes in EWS-FLI1 expression using RT-PCR ( n = 3). Error bars represent SD. * p < 0.05. Circles on bar graphs in A and C indicate values for individual replicates.
- Submitted by
- Invitrogen Antibodies (provider)
- Main image

- Experimental details
- Figure 3 IFN-gamma mediated increases in Ewing tumor cell ICAM-1 expression can occur in the absence of changes in EWS-FLI1 expression. ( A ) IFN-gamma ELISA was performed on conditioned media from A673 cells alone, T-cells +- activation alone, or co-cultures of unactivated or activated T-cells with A673 Ewing tumor cells. Unactivated/activated T-cell groups were compared using an unpaired t -test. * p < 0.05, *** p < 0.001. ( B ) A673 (top panels) and CHLA-10 (bottom panels) Ewing tumor cells were treated with IgG control (left panels) or IFN-gamma (right panels) in the absence (blue) or presence (orange) of activated T-cells for 5 hours. T-cells were washed away and tumor cells were analyzed for surface ICAM-1 expression by flow cytometry. ( C , D ) A673 and CHLA-10 cells were treated with 500 U/mL IFN-gamma (+IFN) or vehicle control (ct) for 48 hours followed by RNA isolation and analysis for ICAM1 expression by RT-PCR ( n = 4) ( C ) or analysis for surface ICAM-1 by flow cytometry (D). ( E ) RNA/generated cDNA from samples in (C) were also analyzed for changes in EWS-FLI1 expression by RT-PCR. Expression is graphed relative to control (normalized to 1). ( F ) A673 and CHLA-10 cells were treated with vehicle control or IFN-gamma for 12 hours. Lysates were analyzed for FLI1 protein expression via western blot. Graphs in B and D demonstrate live, singlet cell populations and % denotes the frequency of ICAM-1+ cells upon analysis of a minimum of 10,000 total events. Circles o

- Submitted by
- Invitrogen Antibodies (provider)
- Main image
- Experimental details
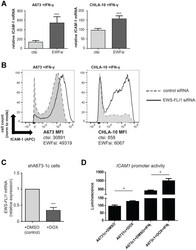
- Figure 4 IFN-gamma induced ICAM-1 expression is significantly enhanced in EWS-FLI1 ''low'' Ewing cells. ( A ) A673 ( n = 4) and CHLA-10 ( n = 4) cells were treated with control or EWS-FLI1 siRNA for 48 hours, followed by treatment with 500 U/mL IFN-gamma for a subsequent 24 hours. Ewing cells were analyzed by RT-PCR analysis for ICAM-1 and RPLP0 (control) expression. Graphs represent relative increase in ICAM1 mRNA expression (values normalized to untreated control). Bars represent SD. Differences in IFN-gamma treatment response between ctsi and EWFsi groups for each cell line was compared using an unpaired t -test. *** p < 0.001. ( B ) Cells were treated with IFN-gamma as in (A) followed by analysis of ICAM-1 surface expression by flow cytometry. MFI (median fluorescence intensity) values for both control (ct) and EWS-FLI1 (EWF) siRNA treatment conditions in both the A673 and CHLA10 cell lines are listed. ( C ) shA673-1c cells (harboring shRNA mediated tet-repressible EWS-FLI1 vector) were treated with DMSO vehicle control or 1 microgram/mL doxycycline for 48 hours ( n = 3). RT-PCR analysis of EWS-FLI1 and RPLP0 (control) expression was performed. *** p < 0.001. ( D ) An ICAM1 LightSwitch promoter reporter assay was used to examine differences in promoter activity between shA673-1c cells + DOX (doxycycline) or DMSO control cells in the absence or presence of IFN-gamma. In this system, +Dox= EWS-FLI1 ''low'' expression. Differences in promoter activity between conditions were

- Submitted by
- Invitrogen Antibodies (provider)
- Main image

- Experimental details
- Fig. 1 CD31 interactions promote the recovery of endothelial integrity following endothelial contraction induced by MHC molecule triggering. a - d Following MHC or ICAM-1 and/or CD31 antibody-mediated co-ligation for 30 min, EC were fixed and stained with rhodamine-phalloidin. Images taken on EC monolayers seeded at identical density are shown in ( a , b ). The average F-actin intensity per cell of three independent experiments is shown in ( c , d ). Scale bar, 20 mum. ( n = 3 biologically independent samples, N = 3 independent experiments, data are mean +- SD). One-way Anova with Tuckey post-hoc test. MHC vs all **** p < 0.0001, MHC + CD31 vs Isc **** p < 0.0001, MHC + CD31 vs all ****p < 0.0001. e Western blot (WB) analysis of Erk activation by WT and cd31 -/- EC 30 min after MHC stimulation. The bar graph shows relative protein expression +- SEM. N = 3 independent experiments (data are mean +- SD). One-way Anova with Tuckey post-hoc test. cd31 -/- MHC vs cd31 -/- IsC *** p = 0.0002, cd31 -/- MHC vs all **** p < 0.0001. f Western blot (WB) analysis of RhoA activation by WT and cd31 -/- EC 30 min after MHC stimulation. The bar graph shows relative protein expression +- SEM. N = 3 independent experiments (data are mean +- SD). One-way Anova with Tuckey post-hoc test. cd31 -/- 15' vs all *** p = 0.0003, cd31 -/- 30' vs all **** p < 0.0001. g Immunoprecipitation of CD31 molecules from WT EC exposed to MHC/ICAM-1 stimulation for 30 min followed by immunoblotting with an anti-pho

- Submitted by
- Invitrogen Antibodies (provider)
- Main image
- Experimental details
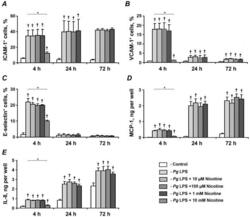
- Figure 5 Effect of nicotine on the P. gingivalis LPS-induced protein expression of pro-inflammatory mediators in HUVECs. HUVECs were stimulated by P. gingivalis LPS in the presence or absence of nicotine (10 uM-10 mM) for 4, 24, and 72 h. After stimulation, the surface expression levels of ICAM-1 (A), VCAM-1 (B), and E-selectin (C) were measured by flow cytometry, and the quantity of MCP-1 (D) and IL-8 (E) in conditioned media was measured by ELISA. Each value represents mean +-SD of three independent assays. Non-stimulated HUVECs were used as a control. The protein expression levels of pro-inflammatory mediators were not analyzed after stimulation with 10-mM nicotine for 24 and 72 h because the cells were not viable. * - significantly different between groups, p

- Submitted by
- Invitrogen Antibodies (provider)
- Main image

- Experimental details
- Figure 1 Differential Analysis of Gene Expression in Prostate Cancer Cells from Chemoresistant Xenografts in Mice. ( a , b ) NOD/SCID mice were injected with LNCaP prostate cancer cells. One group (n=12) was treated with 5 mg/kg of cisplatin, while the other group (n=12) was administered PBS as a control. Overall tumor sizes grossly differed between vehicle-treated mice and mice treated with cisplatin as determined via inspection of the whole animal and upon tumor excision after mice were euthanized 30 d following injection. ( c ) Tumor volumes from vehicle-treated mice and mice treated with cisplatin every 5 d after 5x10 6 cell injection during the 30 d interval. ( d ) Approximately 10 4 cells from DDP-treated tumors and vehicle-treated tumors were labeled with luciferase and transplanted into secondary NOD/SCID mice. Tumor formation was monitored with an in vivo imaging system. Pseudo-color scales indicate the photon counts of imaged mice. ( e ) Microarray analysis of gene expression from RNA extracted from combined vehicle-treated or cisplatin-treated tumors from each group. ( f ) Expression levels of selected genes after cisplatin treatment compared to expression levels in vehicle-treated cells. ( g ) Real-time PCR measurement of relative CD54 mRNA expression in vehicle-treated tumor cells and in tumor cells treated with cisplatin (DDP), gemcitabine (GEM), or docetaxel (DOC). ( h ) Immunohistochemical staining of CD54 expression in representative tumor tissues from vehicl

- Submitted by
- Invitrogen Antibodies (provider)
- Main image
- Experimental details
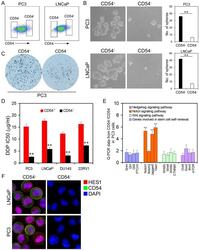
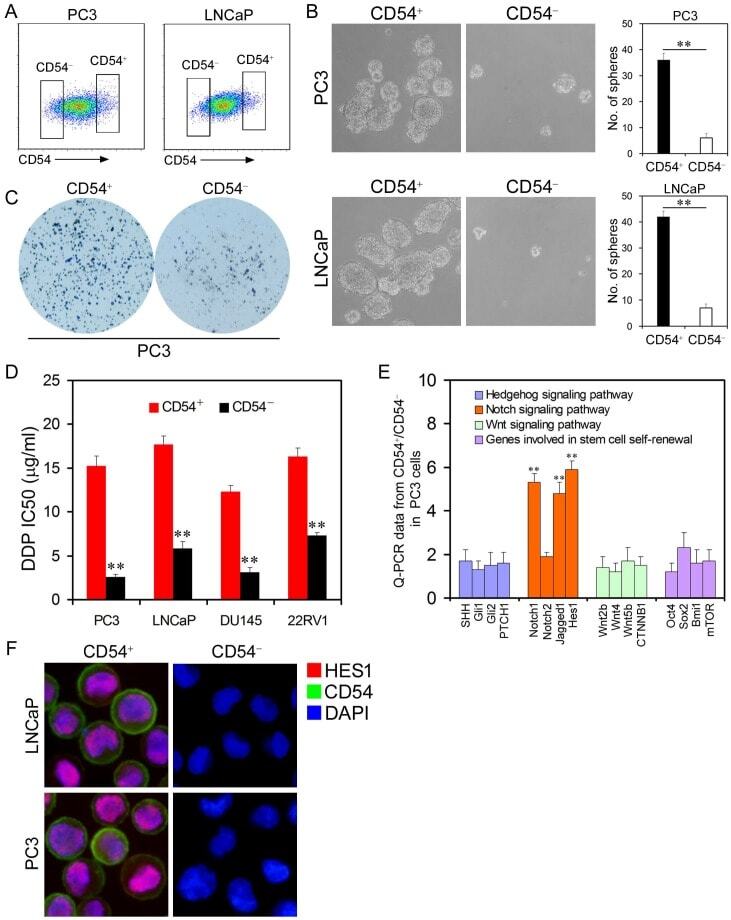
- Figure 2 Cancer Stem Cell Traits of Differential Populations of CD54 + and CD54 - Cells. ( a ) FACS histograms show separate gating for the isolation of CD54 + and CD54 - PC3 and LNCaP cells. ( b ) Representative light micrograph fields and comparative quantification of the sphere-forming capacity of CD54 + and CD54 - LNCaP and PC3 cells. ( c ) Representative microscope fields from colony formation assays for CD54 + and CD54 - PC3 cells. ( d ) The cisplatin (DDP) IC 50 of CD54 + and CD54 - cells from the PC3, LNCaP, DU145, and 22RV1 prostate cancer cell lines. ( e ) q-PCR analysis of the expression of Hedgehog, Notch, and Wnt signaling pathway genes as well as genes involved in stem cell self-renewal in CD54 + and CD54 - PC3 cells. ( f ) Representative micrographs of in situ protein expression of the key signaling pathway components HES1 and CD54 in DAPI-stained LNCaP and PC3 cells. ** P < 0.01.
- Submitted by
- Invitrogen Antibodies (provider)
- Main image
- Experimental details
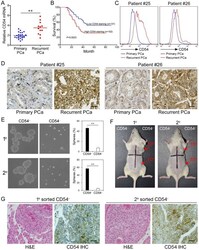
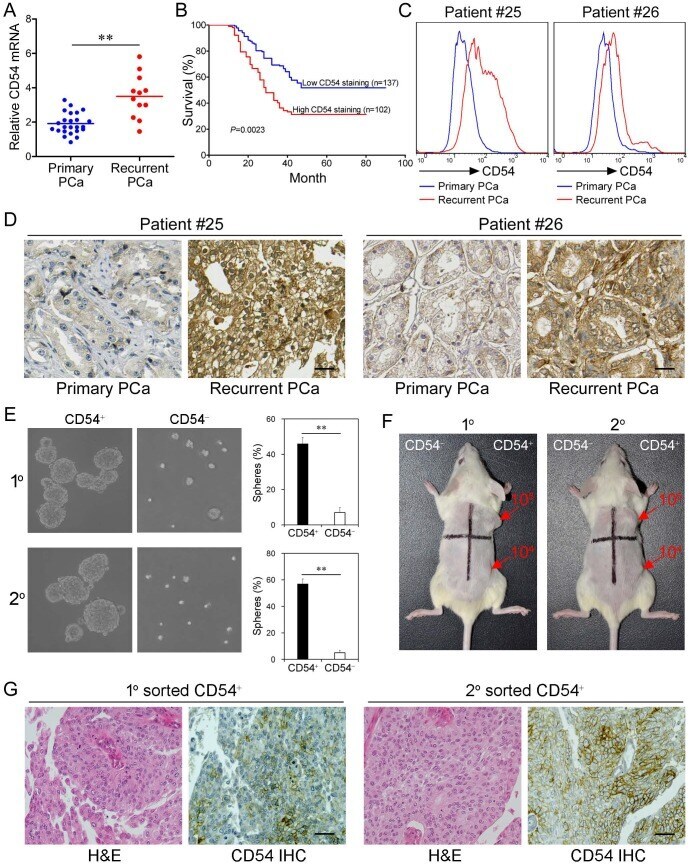
- Figure 3 Clinical Relevance of CD54 Expression. ( a ) Relative CD54 mRNA expression in primary (n=24) and recurrent tumors (n=12) from prostate cancer patients. ( b ) Relative CD54 mRNA expression correlated with mortality of patients with prostate cancer by Kaplan-Meier survival analysis. ( c ) CD54 expression in primary and recurrent tumors from two prostate cancer patients. ( d ) Immunohistochemical analysis of in situ CD54 expression in primary and recurrent tumors from two prostate cancer patients. ( e ) Representative light micrograph of the sphere-forming capacity of CD54 + and CD54 - sorted cells isolated from primary and secondary xenograft tumors of prostate cancer patients and quantification of the results. ( f ) Tumor-initiating capacity of differing numbers of different quadrants of CD54 + and CD54 - tumor cells isolated from primary and secondary prostate cancer patient xenograft tumors of NOD/SCID mice 6 weeks after injection. Red numbers indicate number of cells injected, and red arrows indicate tumor formation. ( g ) Immunohistochemical analysis of in situ CD54 expression in both primary and secondary tumor samples collected from xenografted CD54 + tumors. H&E stained tissues are shown as a reference (scale bar=50 mum). ** P < 0.01.
- Submitted by
- Invitrogen Antibodies (provider)
- Main image

- Experimental details
- Figure 4 Effects of CD54 Knockdown on Prostate Cancer Stem Cells. ( a ) Real-time PCR analysis of relative CD54 mRNA expression in LNCaP and PC3 cells after transfection with control shRNA (shCtrl) or shRNAs targeting CD54 (shCD54-1, shCD54-2, and shCD54-3). ( b ) FACS analysis of CD54 expression in PC3 and LNCaP cells transfected with shCtrl or shCD54-1. ( c ) Representative light microscope fields and comparative quantification of the colony formation capacity of PC3 cells after transfection with shCtrl, shCD54-1, shCD54-2, or shCD54-3. ( d ) Representative light microscope fields and comparative quantification of the sphere-forming capacity of LNCaP and PC3 cells after transfection with shCtrl, shCD54-1, shCD54-2, or shCD54-3. ( e ) Tumor volume measurements, measured every 5 d, in NOD/SCID mice injected with LNCaP or PC3 cells transfected with shCtrl, shCD54-1, or shCD54-1 with reconstitution of endogenous CD54 expression. ( f ) Final weight of tumors from NOD/SCID mice injected with LNCaP or PC3 cells transfected with shCtrl, shCD54-1, or shCD54-1 with reconstitution of endogenous CD54 expression. ( g ) Frequency of CSCs in LNCaP or PC3 cells injected into NOD/SCID mice. ( h ) Relative fold difference of the expression of various signaling pathway components in LNCaP and PC3 cells transfected with shCtrl, shCD54-1, or shCD54-1 with reconstitution of endogenous CD54 expression. * P < 0.05; ** P < 0.01.
