 Explore
 Validate
 Learn
LearnMA5407
antibody from Invitrogen Antibodies
Targeting: ICAM1
BB2, CD54
 Western blot
 Immunocytochemistry Immunohistochemistry Flow cytometry
 Blocking/Neutralizing Other assay
Antibody data
- Antibody Data
- Antigen structure
- References [23]
- Comments [0]
- Validations
- Immunocytochemistry [2]
- Immunohistochemistry [3]
- Flow cytometry [7]
- Other assay [17]
Submit
Validation data
Reference
Comment
Report error
- Product number
- MA5407 - Provider product page

- Provider
- Invitrogen Antibodies
- Product name
- ICAM-1 Monoclonal Antibody (1A29)
- Antibody type
- Monoclonal
- Antigen
- Other
- Description
- MA5407 targets CD54 in FACS, IHC, and Neu applications and shows reactivity with Rat, Human and Mouse samples. The MA5407 immunogen is rat lymph node stroma. MA5407 detects CD54 which has a predicted molecular weight of approximately 56 kDa. This product has been tested for endotoxins by limulus amoebocyte lysate (LAL) assay and contains an endotoxin concentration of less than or equal to 10 endotoxin units per milligram (EU/mg).
- Reactivity
- Human, Mouse, Rat
- Host
- Mouse
- Isotype
- IgG
- Antibody clone number
- 1A29
- Vial size
- 500 μg
- Concentration
- 1.0 mg/mL
- Storage
- -20°C
Submitted references Extracellular Inflammasome Particles Are Released After Marathon Running and Induce Proinflammatory Effects in Endothelial Cells.
Short-term exposure to JUUL electronic cigarettes can worsen ischemic stroke outcome.
Neuroprotective effects of Alda-1 mitigate spinal cord injury in mice: involvement of Alda-1-induced ALDH2 activation-mediated suppression of reactive aldehyde mechanisms.
Murine Beta-Amyloid (1-42) Oligomers Disrupt Endothelial Barrier Integrity and VEGFR Signaling via Activating Astrocytes to Release Deleterious Soluble Factors.
Blood-brain barrier dysfunction in L-ornithine induced acute pancreatitis in rats and the direct effect of L-ornithine on cultured brain endothelial cells.
Exosomal miR-125b-5p deriving from mesenchymal stem cells promotes tubular repair by suppression of p53 in ischemic acute kidney injury.
AIM2 deletion enhances blood-brain barrier integrity in experimental ischemic stroke.
Intercellular Adhesion Molecule-1-Induced Posttraumatic Brain Injury Neuropathology in the Prefrontal Cortex and Hippocampus Leads to Sensorimotor Function Deficits and Psychological Stress.
TRPV4 channel activation induces the transition of venous and arterial endothelial cells toward a pro-inflammatory phenotype.
The cancer glycocalyx mediates intravascular adhesion and extravasation during metastatic dissemination.
Porphyromonas gingivalis W83 traffics via ICAM1 in microvascular endothelial cells and alters capillary organization in vivo.
Macrophage migration inhibitory factor inhibition as a novel therapeutic approach against triple-negative breast cancer.
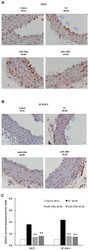
MicroRNA-200a/200b Modulate High Glucose-Induced Endothelial Inflammation by Targeting O-linked N-Acetylglucosamine Transferase Expression.
Notoginsenoside R1 Protects HUVEC Against Oxidized Low Density Lipoprotein (Ox-LDL)-Induced Atherogenic Response via Down-Regulating miR-132.
A novel pathway of LPS uptake through syndecan-1 leading to pyroptotic cell death.
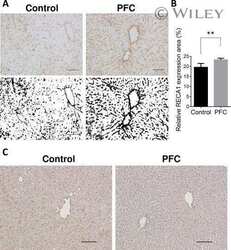
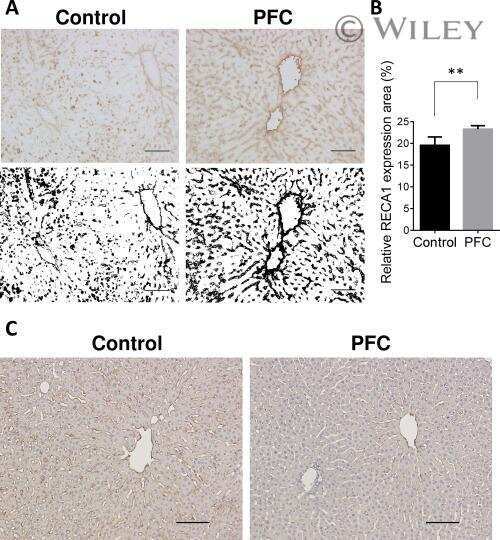
Liver graft preservation using perfluorocarbon improves the outcomes of simulated donation after cardiac death liver transplantation in rats.
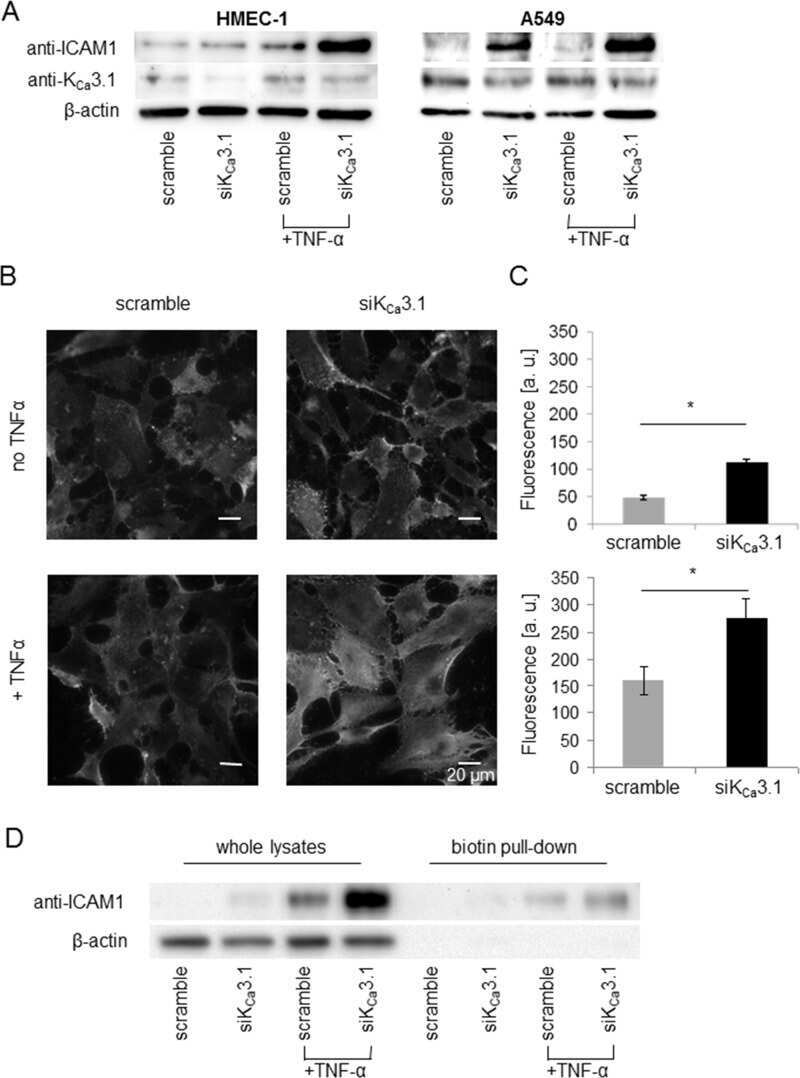
K(Ca)3.1 channel inhibition leads to an ICAM-1 dependent increase of cell-cell adhesion between A549 lung cancer and HMEC-1 endothelial cells.
Thoracic epidural bupivacaine attenuates inflammatory response, intestinal lipid peroxidation, oxidative injury, and mucosal apoptosis induced by mesenteric ischemia/reperfusion.
NAD(P)H oxidase mediates angiotensin II-induced vascular macrophage infiltration and medial hypertrophy.
Adhesion molecule expression in experimental myositis.
Upregulated Expression of Rat Heart Intercellular Adhesion Molecule-1 in Angiotensin II- but Not Phenylephrine- Induced Hypertension.
Expression of intercellular adhesion molecule-1 in rat heart with ischemia/reperfusion and limitation of infarct size by treatment with antibodies against cell adhesion molecules.
Characterization of the rat leukocyte integrin, CD11/CD18, by the use of LFA-1 subunit-specific monoclonal antibodies.
Kogel A, Fikenzer S, Uhlmann L, Opitz L, Kneuer JM, Haeusler KG, Endres M, Kratzsch J, Schwarz V, Werner C, Kalwa H, Gaul S, Laufs U
Frontiers in physiology 2022;13:866938
Frontiers in physiology 2022;13:866938
Short-term exposure to JUUL electronic cigarettes can worsen ischemic stroke outcome.
Sifat AE, Archie SR, Nozohouri S, Villalba H, Zhang Y, Sharma S, Ghanwatkar Y, Vaidya B, Mara D, Cucullo L, Abbruscato TJ
Fluids and barriers of the CNS 2022 Sep 9;19(1):74
Fluids and barriers of the CNS 2022 Sep 9;19(1):74
Neuroprotective effects of Alda-1 mitigate spinal cord injury in mice: involvement of Alda-1-induced ALDH2 activation-mediated suppression of reactive aldehyde mechanisms.
Khan M, Qiao F, Kumar P, Touhidul Islam SM, Singh AK, Won J, Singh I
Neural regeneration research 2022 Jan;17(1):185-193
Neural regeneration research 2022 Jan;17(1):185-193
Murine Beta-Amyloid (1-42) Oligomers Disrupt Endothelial Barrier Integrity and VEGFR Signaling via Activating Astrocytes to Release Deleterious Soluble Factors.
Yue Q, Zhou X, Zhang Z, Hoi MPM
International journal of molecular sciences 2022 Feb 7;23(3)
International journal of molecular sciences 2022 Feb 7;23(3)
Blood-brain barrier dysfunction in L-ornithine induced acute pancreatitis in rats and the direct effect of L-ornithine on cultured brain endothelial cells.
Walter FR, Harazin A, Tóth AE, Veszelka S, Santa-Maria AR, Barna L, Kincses A, Biczó G, Balla Z, Kui B, Maléth J, Cervenak L, Tubak V, Kittel Á, Rakonczay Z Jr, Deli MA
Fluids and barriers of the CNS 2022 Feb 17;19(1):16
Fluids and barriers of the CNS 2022 Feb 17;19(1):16
Exosomal miR-125b-5p deriving from mesenchymal stem cells promotes tubular repair by suppression of p53 in ischemic acute kidney injury.
Cao JY, Wang B, Tang TT, Wen Y, Li ZL, Feng ST, Wu M, Liu D, Yin D, Ma KL, Tang RN, Wu QL, Lan HY, Lv LL, Liu BC
Theranostics 2021;11(11):5248-5266
Theranostics 2021;11(11):5248-5266
AIM2 deletion enhances blood-brain barrier integrity in experimental ischemic stroke.
Xu SY, Bian HJ, Shu S, Xia SN, Gu Y, Zhang MJ, Xu Y, Cao X
CNS neuroscience & therapeutics 2021 Oct;27(10):1224-1237
CNS neuroscience & therapeutics 2021 Oct;27(10):1224-1237
Intercellular Adhesion Molecule-1-Induced Posttraumatic Brain Injury Neuropathology in the Prefrontal Cortex and Hippocampus Leads to Sensorimotor Function Deficits and Psychological Stress.
Bhowmick S, Malat A, Caruso D, Ponery N, D'Mello V, Finn C, Abdul-Muneer PM
eNeuro 2021 Jul-Aug;8(4)
eNeuro 2021 Jul-Aug;8(4)
TRPV4 channel activation induces the transition of venous and arterial endothelial cells toward a pro-inflammatory phenotype.
Beddek K, Raffin F, Borgel D, Saller F, Riccobono D, Bobe R, Boittin FX
Physiological reports 2021 Feb;9(3):e14613
Physiological reports 2021 Feb;9(3):e14613
The cancer glycocalyx mediates intravascular adhesion and extravasation during metastatic dissemination.
Offeddu GS, Hajal C, Foley CR, Wan Z, Ibrahim L, Coughlin MF, Kamm RD
Communications biology 2021 Feb 26;4(1):255
Communications biology 2021 Feb 26;4(1):255
Porphyromonas gingivalis W83 traffics via ICAM1 in microvascular endothelial cells and alters capillary organization in vivo.
Reyes L, Getachew H, Dunn WA, Progulske-Fox A
Journal of oral microbiology 2020;12(1):1742528
Journal of oral microbiology 2020;12(1):1742528
Macrophage migration inhibitory factor inhibition as a novel therapeutic approach against triple-negative breast cancer.
Charan M, Das S, Mishra S, Chatterjee N, Varikuti S, Kaul K, Misri S, Ahirwar DK, Satoskar AR, Ganju RK
Cell death & disease 2020 Sep 17;11(9):774
Cell death & disease 2020 Sep 17;11(9):774
MicroRNA-200a/200b Modulate High Glucose-Induced Endothelial Inflammation by Targeting O-linked N-Acetylglucosamine Transferase Expression.
Lo WY, Yang WK, Peng CT, Pai WY, Wang HJ
Frontiers in physiology 2018;9:355
Frontiers in physiology 2018;9:355
Notoginsenoside R1 Protects HUVEC Against Oxidized Low Density Lipoprotein (Ox-LDL)-Induced Atherogenic Response via Down-Regulating miR-132.
Fu C, Yin D, Nie H, Sun D
Cellular physiology and biochemistry : international journal of experimental cellular physiology, biochemistry, and pharmacology 2018;51(4):1739-1750
Cellular physiology and biochemistry : international journal of experimental cellular physiology, biochemistry, and pharmacology 2018;51(4):1739-1750
A novel pathway of LPS uptake through syndecan-1 leading to pyroptotic cell death.
Yokoyama S, Cai Y, Murata M, Tomita T, Yoneda M, Xu L, Pilon AL, Cachau RE, Kimura S
eLife 2018 Dec 7;7
eLife 2018 Dec 7;7
Liver graft preservation using perfluorocarbon improves the outcomes of simulated donation after cardiac death liver transplantation in rats.
Okumura S, Uemura T, Zhao X, Masano Y, Tsuruyama T, Fujimoto Y, Iida T, Yagi S, Bezinover D, Spiess B, Kaido T, Uemoto S
Liver transplantation : official publication of the American Association for the Study of Liver Diseases and the International Liver Transplantation Society 2017 Sep;23(9):1171-1185
Liver transplantation : official publication of the American Association for the Study of Liver Diseases and the International Liver Transplantation Society 2017 Sep;23(9):1171-1185
K(Ca)3.1 channel inhibition leads to an ICAM-1 dependent increase of cell-cell adhesion between A549 lung cancer and HMEC-1 endothelial cells.
Bulk E, Kramko N, Liashkovich I, Glaser F, Schillers H, Schnittler HJ, Oberleithner H, Schwab A
Oncotarget 2017 Dec 22;8(68):112268-112282
Oncotarget 2017 Dec 22;8(68):112268-112282
Thoracic epidural bupivacaine attenuates inflammatory response, intestinal lipid peroxidation, oxidative injury, and mucosal apoptosis induced by mesenteric ischemia/reperfusion.
Bedirli N, Akyürek N, Kurtipek O, Kavutcu M, Kartal S, Bayraktar AC
Anesthesia and analgesia 2011 Nov;113(5):1226-32
Anesthesia and analgesia 2011 Nov;113(5):1226-32
NAD(P)H oxidase mediates angiotensin II-induced vascular macrophage infiltration and medial hypertrophy.
Liu J, Yang F, Yang XP, Jankowski M, Pagano PJ
Arteriosclerosis, thrombosis, and vascular biology 2003 May 1;23(5):776-82
Arteriosclerosis, thrombosis, and vascular biology 2003 May 1;23(5):776-82
Adhesion molecule expression in experimental myositis.
Ito T, Kumamoto T, Horinouchi H, Yukishige K, Sugihara R, Fujimoto S, Tsuda T
Muscle & nerve 2002 Mar;25(3):409-18
Muscle & nerve 2002 Mar;25(3):409-18
Upregulated Expression of Rat Heart Intercellular Adhesion Molecule-1 in Angiotensin II- but Not Phenylephrine- Induced Hypertension.
Kiarash A, Pagano PJ, Tayeh M, Rhaleb NE, Carretero OA
Hypertension (Dallas, Tex. : 1979) 2001 Jan;37(1):58-65
Hypertension (Dallas, Tex. : 1979) 2001 Jan;37(1):58-65
Expression of intercellular adhesion molecule-1 in rat heart with ischemia/reperfusion and limitation of infarct size by treatment with antibodies against cell adhesion molecules.
Yamazaki T, Seko Y, Tamatani T, Miyasaka M, Yagita H, Okumura K, Nagai R, Yazaki Y
The American journal of pathology 1993 Aug;143(2):410-8
The American journal of pathology 1993 Aug;143(2):410-8
Characterization of the rat leukocyte integrin, CD11/CD18, by the use of LFA-1 subunit-specific monoclonal antibodies.
Tamatani T, Kotani M, Miyasaka M
European journal of immunology 1991 Mar;21(3):627-33
European journal of immunology 1991 Mar;21(3):627-33
No comments: Submit comment
Supportive validation
- Submitted by
- Invitrogen Antibodies (provider)
- Main image
- Experimental details
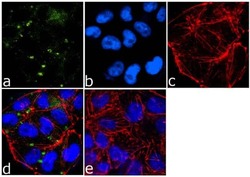
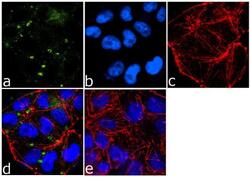
- Immunofluorescence analysis of ICAM-1/CD54 was done on 70% confluent log phase A-375 cells. The cells were fixed with 4% paraformaldehyde for 15 minutes, permeabilized with 0.25% Triton™ X-100 for 10 minutes, and blocked with 5% BSA for 1 hour at room temperature. The cells were labeled with ICAM-1/CD54 (1A29) Mouse Monoclonal Antibody (Product # MA5407) at 1:250 dilution in 1% BSA and incubated for 3 hours at room temperature and then labeled with Goat anti-Mouse IgG (H+L) Superclonal™ Secondary Antibody, Alexa Fluor® 488 conjugate (Product # A28175) at a dilution of 1:2000 for 45 minutes at room temperature (Panel a: green). Nuclei (Panel b: blue) were stained with SlowFade® Gold Antifade Mountant with DAPI (Product # S36938). F-actin (Panel c: red) was stained with Rhodamine Phalloidin (Product # R415, 1:300). Panel d is a merged image showing cell junctional localization. Panel e is a no primary antibody control. The images were captured at 60X magnification.
- Submitted by
- Invitrogen Antibodies (provider)
- Main image
- Experimental details
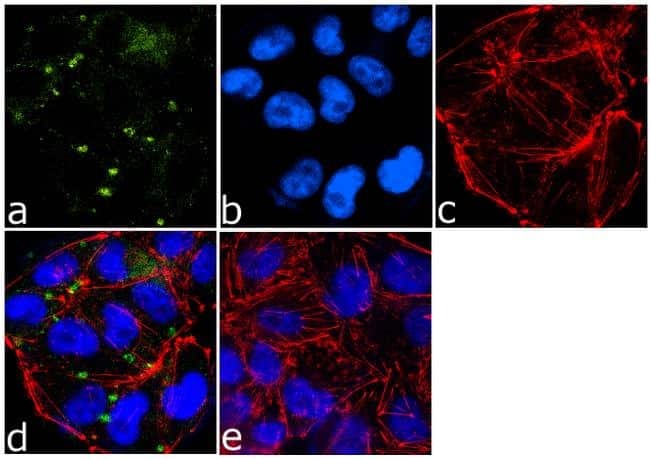
- Immunofluorescence analysis of ICAM-1/CD54 was done on 70% confluent log phase A-375 cells. The cells were fixed with 4% paraformaldehyde for 15 minutes, permeabilized with 0.25% Triton™ X-100 for 10 minutes, and blocked with 5% BSA for 1 hour at room temperature. The cells were labeled with ICAM-1/CD54 (1A29) Mouse Monoclonal Antibody (Product # MA5407) at 1:250 dilution in 1% BSA and incubated for 3 hours at room temperature and then labeled with Goat anti-Mouse IgG (H+L) Superclonal™ Secondary Antibody, Alexa Fluor® 488 conjugate (Product # A28175) at a dilution of 1:2000 for 45 minutes at room temperature (Panel a: green). Nuclei (Panel b: blue) were stained with SlowFade® Gold Antifade Mountant with DAPI (Product # S36938). F-actin (Panel c: red) was stained with Rhodamine Phalloidin (Product # R415, 1:300). Panel d is a merged image showing cell junctional localization. Panel e is a no primary antibody control. The images were captured at 60X magnification.

Supportive validation
- Submitted by
- Invitrogen Antibodies (provider)
- Main image
- Experimental details
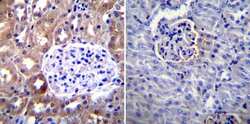
- Immunohistochemistry was performed on normal biopsies of deparaffinized Mouse kidney tissue. To expose target proteins, heat induced antigen retrieval was performed using 10mM sodium citrate (pH6.0) buffer, microwaved for 8-15 minutes. Following antigen retrieval tissues were blocked in 3% BSA-PBS for 30 minutes at room temperature. Tissues were then probed at a dilution of 1:100 with a mouse monoclonal antibody recognizing CD54 (Product # MA5407) or without primary antibody (negative control) overnight at 4°C in a humidified chamber. Tissues were washed extensively with PBST and endogenous peroxidase activity was quenched with a peroxidase suppressor. Detection was performed using a biotin-conjugated secondary antibody and SA-HRP, followed by colorimetric detection using DAB. Tissues were counterstained with hematoxylin and prepped for mounting.

- Submitted by
- Invitrogen Antibodies (provider)
- Main image
- Experimental details
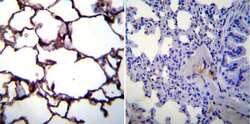
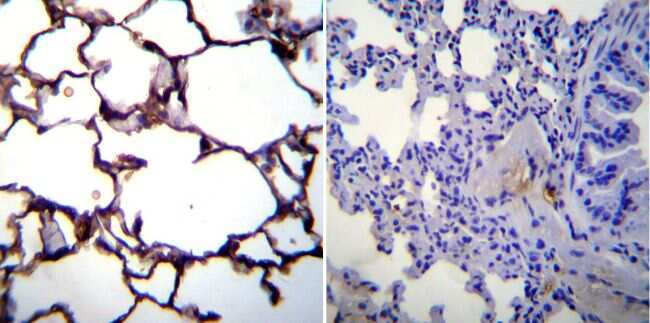
- Immunohistochemistry was performed on normal biopsies of deparaffinized Mouse lung tissue. To expose target proteins, heat induced antigen retrieval was performed using 10mM sodium citrate (pH6.0) buffer, microwaved for 8-15 minutes. Following antigen retrieval tissues were blocked in 3% BSA-PBS for 30 minutes at room temperature. Tissues were then probed at a dilution of 1:100 with a mouse monoclonal antibody recognizing CD54 (Product # MA5407) or without primary antibody (negative control) overnight at 4°C in a humidified chamber. Tissues were washed extensively with PBST and endogenous peroxidase activity was quenched with a peroxidase suppressor. Detection was performed using a biotin-conjugated secondary antibody and SA-HRP, followed by colorimetric detection using DAB. Tissues were counterstained with hematoxylin and prepped for mounting.
- Submitted by
- Invitrogen Antibodies (provider)
- Main image
- Experimental details
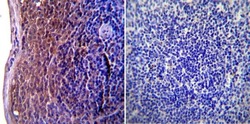
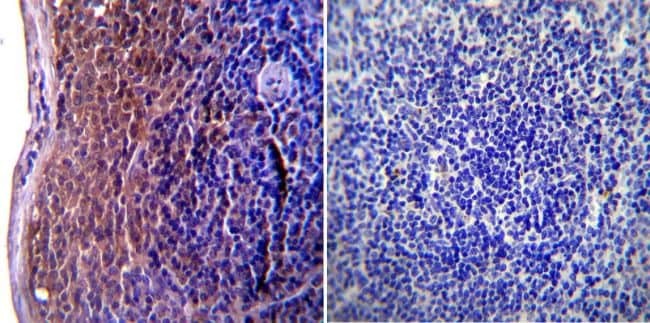
- Immunohistochemistry was performed on normal biopsies of deparaffinized Mouse spleen tissue. To expose target proteins, heat induced antigen retrieval was performed using 10mM sodium citrate (pH6.0) buffer, microwaved for 8-15 minutes. Following antigen retrieval tissues were blocked in 3% BSA-PBS for 30 minutes at room temperature. Tissues were then probed at a dilution of 1:100 with a mouse monoclonal antibody recognizing CD54 (Product # MA5407) or without primary antibody (negative control) overnight at 4°C in a humidified chamber. Tissues were washed extensively with PBST and endogenous peroxidase activity was quenched with a peroxidase suppressor. Detection was performed using a biotin-conjugated secondary antibody and SA-HRP, followed by colorimetric detection using DAB. Tissues were counterstained with hematoxylin and prepped for mounting.
Supportive validation
- Submitted by
- Invitrogen Antibodies (provider)
- Main image
- Experimental details
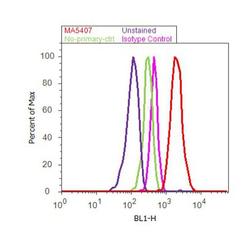
- Flow cytometry analysis of ICAM-1 was done on Raji cells. Cells were fixed with 70% ethanol for 10 minutes, permeabilized with 0.25% Triton™ X-100 for 20 minutes, and blocked with 5% BSA for 30 minutes at room temperature. Cells were labeled with ICAM-1 Mouse Monoclonal Antibody (MA5407, red histogram) or with mouse isotype control (pink histogram) at 3-5 ug/million cells in 2.5% BSA. After incubation at room temperature for 2 hours, the cells were labeled with Alexa Fluor® 488 Rabbit Anti-Mouse Secondary Antibody (A11059) at a dilution of 1:400 for 30 minutes at room temperature. The representative 10,000 cells were acquired and analyzed for each sample using an Attune® Acoustic Focusing Cytometer. The purple histogram represents unstained control cells and the green histogram represents no-primary-antibody control.

- Submitted by
- Invitrogen Antibodies (provider)
- Main image
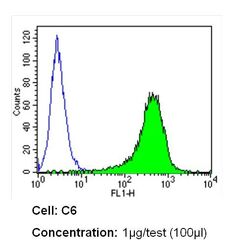
- Experimental details
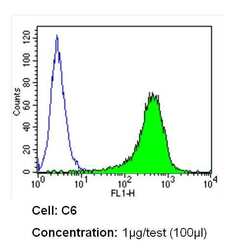
- Flow cytometry analysis of CD54 in C6 cells (green) compared to an isotype control (blue). Cells were harvested, adjusted to a concentration of 1-5x10^6 cells/mL, fixed with 2% paraformaldehyde and washed with PBS. Cells were blocked with a 2% solution of BSA-PBS for 30 min at room temperature and incubated with a CD54 monoclonal antibody (Product # MA5407) at a dilution of 1 µg/test for 60 min at room temperature. Cells were then incubated for 40 min at room temperature in the dark using a Dylight 488-conjugated secondary antibody and re-suspended in PBS for FACS analysis.

- Submitted by
- Invitrogen Antibodies (provider)
- Main image
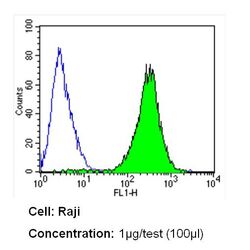
- Experimental details
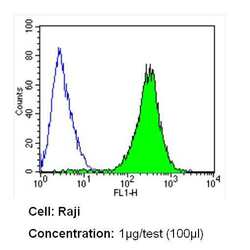
- Flow cytometry analysis of CD54 in Raji cells (green) compared to an isotype control (blue). Cells were harvested, adjusted to a concentration of 1-5x10^6 cells/mL, fixed with 2% paraformaldehyde and washed with PBS. Cells were blocked with a 2% solution of BSA-PBS for 30 min at room temperature and incubated with a CD54 monoclonal antibody (Product # MA5407) at a dilution of 1 µg/test for 60 min at room temperature. Cells were then incubated for 40 min at room temperature in the dark using a Dylight 488-conjugated secondary antibody and re-suspended in PBS for FACS analysis.

- Submitted by
- Invitrogen Antibodies (provider)
- Main image
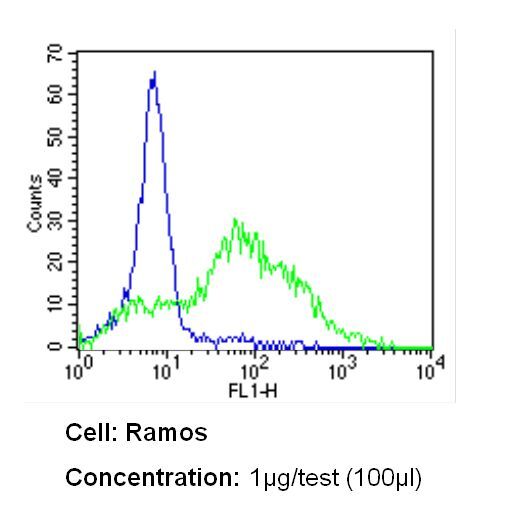
- Experimental details
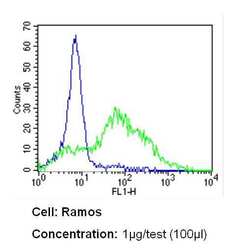
- Flow cytometry analysis of CD54 in Ramos cells (green) compared to an isotype control (blue). Cells were harvested, adjusted to a concentration of 1-5x10^6 cells/mL, fixed with 2% paraformaldehyde and washed with PBS. Cells were blocked with a 2% solution of BSA-PBS for 30 min at room temperature and incubated with a CD54 monoclonal antibody (Product # MA5407) at a dilution of 1 µg/test for 60 min at room temperature. Cells were then incubated for 40 min at room temperature in the dark using a Dylight 488-conjugated secondary antibody and re-suspended in PBS for FACS analysis.

- Submitted by
- Invitrogen Antibodies (provider)
- Main image
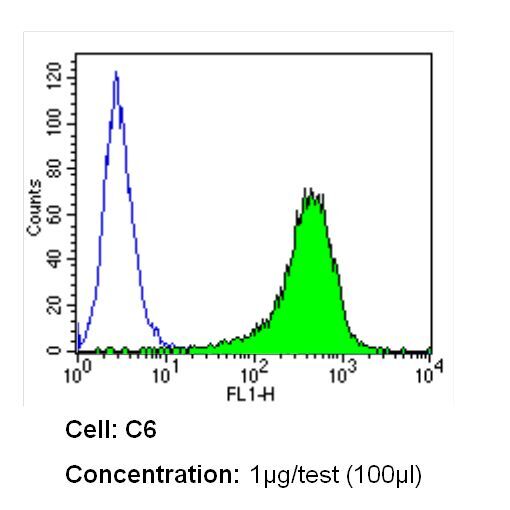
- Experimental details
- Flow cytometry analysis of CD54 in C6 cells (green) compared to an isotype control (blue). Cells were harvested, adjusted to a concentration of 1-5x10^6 cells/mL, fixed with 2% paraformaldehyde and washed with PBS. Cells were blocked with a 2% solution of BSA-PBS for 30 min at room temperature and incubated with a CD54 monoclonal antibody (Product # MA5407) at a dilution of 1 µg/test for 60 min at room temperature. Cells were then incubated for 40 min at room temperature in the dark using a Dylight 488-conjugated secondary antibody and re-suspended in PBS for FACS analysis.
- Submitted by
- Invitrogen Antibodies (provider)
- Main image
- Experimental details
- Flow cytometry analysis of CD54 in Raji cells (green) compared to an isotype control (blue). Cells were harvested, adjusted to a concentration of 1-5x10^6 cells/mL, fixed with 2% paraformaldehyde and washed with PBS. Cells were blocked with a 2% solution of BSA-PBS for 30 min at room temperature and incubated with a CD54 monoclonal antibody (Product # MA5407) at a dilution of 1 µg/test for 60 min at room temperature. Cells were then incubated for 40 min at room temperature in the dark using a Dylight 488-conjugated secondary antibody and re-suspended in PBS for FACS analysis.

- Submitted by
- Invitrogen Antibodies (provider)
- Main image

- Experimental details
- Flow cytometry analysis of CD54 in Ramos cells (green) compared to an isotype control (blue). Cells were harvested, adjusted to a concentration of 1-5x10^6 cells/mL, fixed with 2% paraformaldehyde and washed with PBS. Cells were blocked with a 2% solution of BSA-PBS for 30 min at room temperature and incubated with a CD54 monoclonal antibody (Product # MA5407) at a dilution of 1 µg/test for 60 min at room temperature. Cells were then incubated for 40 min at room temperature in the dark using a Dylight 488-conjugated secondary antibody and re-suspended in PBS for FACS analysis.
Supportive validation
- Submitted by
- Invitrogen Antibodies (provider)
- Main image
- Experimental details
- NULL
- Submitted by
- Invitrogen Antibodies (provider)
- Main image

- Experimental details
- NULL
- Submitted by
- Invitrogen Antibodies (provider)
- Main image
- Experimental details
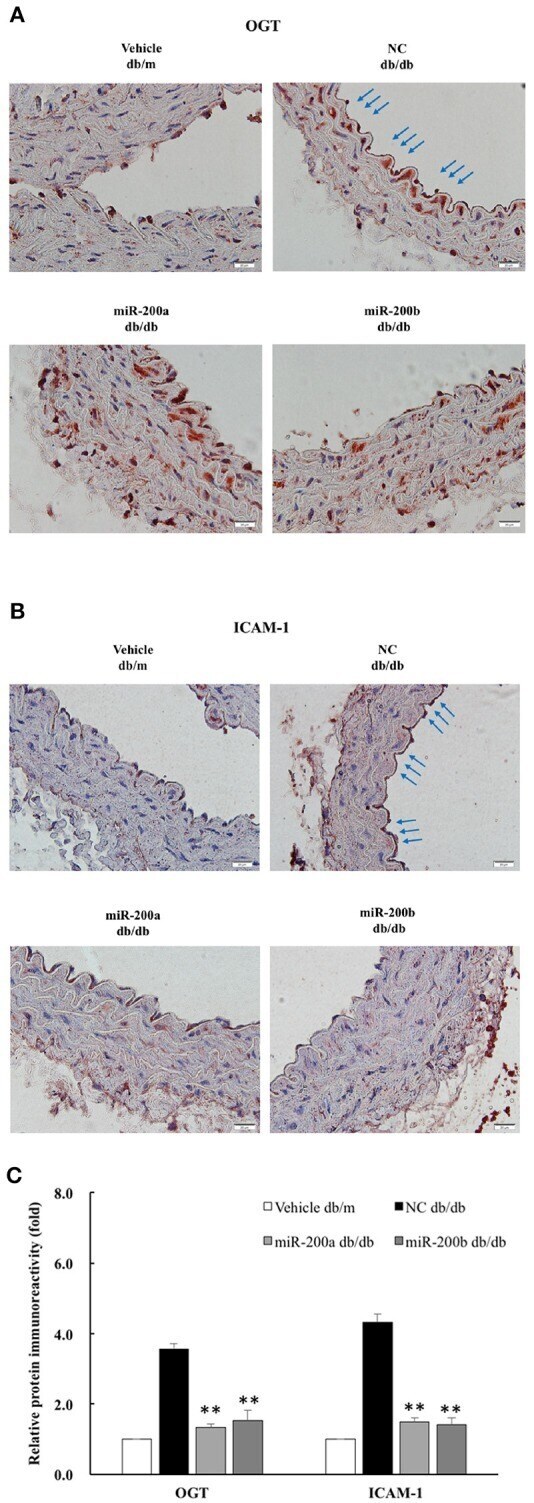
- Figure 5 miR-200a/200b mimic decreased endothelial OGT and ICAM-1 expression in type 2 db/db diabetic mice. Immunohistochemistry staining of (A) OGT and (B) ICAMI-1 in the thoracic aorta tissue. Representative images showing that the immunoreactivities of endothelial OGT and ICAM-1 in the aortic endothelial layers (blue color as arrow) were decreased in the miR-200a/200b mimic-treated db/db mice, as compared with the negative control (NC)-treated db/db mice. db/m mice: non-diabetic control mice. N = 3 per group. Scale bar = 20 mum. (C) Immunoreactivity signals in endothelial layers from four treatment groups were quantified for all immunohistochemistry images. ** p < 0.01 compared to the db/db (NC) group.
- Submitted by
- Invitrogen Antibodies (provider)
- Main image
- Experimental details
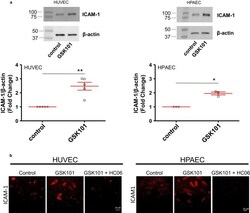
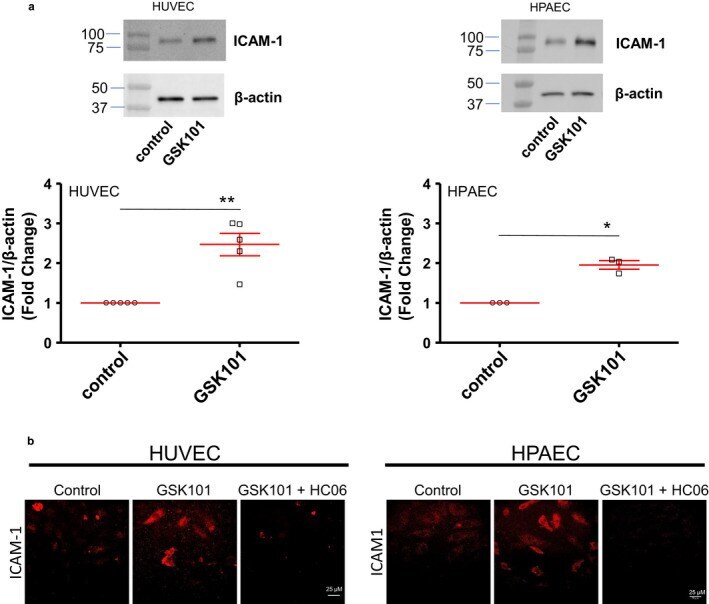
- Figure 6 Effect of the TRPV4 agonist GSK101 on ICAM-1 expression and localization in HUVECs and HPAECs. (a) Western Blot analysis of ICAM-1 in control cells (HUVECs or HPAECs) and in cells stimulated with GSK101 (30 nM) for 24 hr. Graphs represent average values of five and three experiments for HUVECs and HPAECs, respectively (* p < .05, ** p < .01). (b) Immuno-localization of ICAM-1 in HUVEC or HPAEC monolayers in control and after stimulation with GSK101 for 24 hr (with or without pre-treatment with HC06 (1 µM)). Data presented are the representative of four experiments
- Submitted by
- Invitrogen Antibodies (provider)
- Main image

- Experimental details
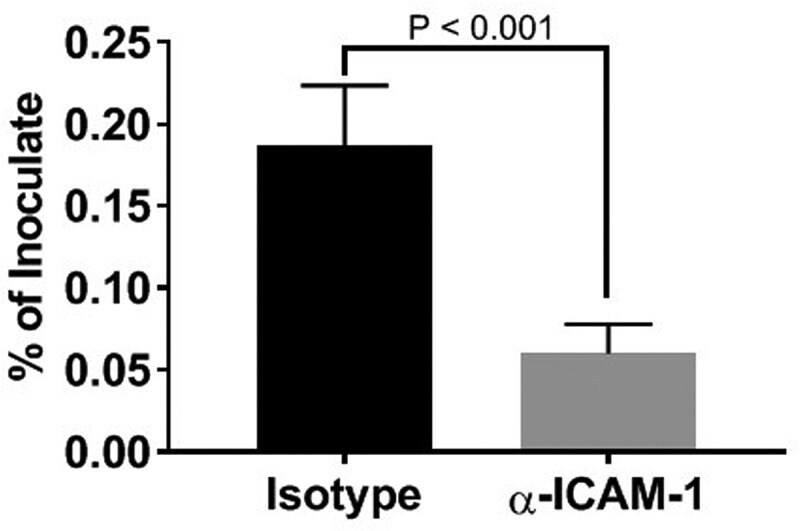
- Figure 5. Inhibition of P. gingivalis invasion into HD-MVEC by anti-ICAM-1 antibody. Values represent the mean +- SD (n = 6) from two separate experiments. Percent values were determined by dividing the CFU of internalized bacteria by the CFU of the corresponding inoculate
- Submitted by
- Invitrogen Antibodies (provider)
- Main image

- Experimental details
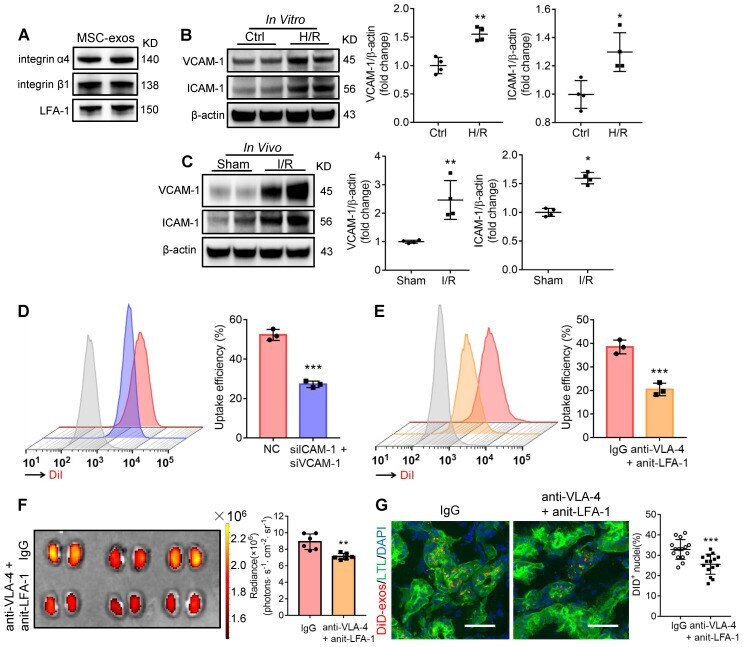
- Figure 2 Integrin VLA-4 and LFA-1 guide the homing of MSC-exos to injured kidney. (A) Western blotting analysis of VLA-4 (integrin alpha4, integrin beta1) and LFA-1 on MSC-exos. (B) Western blotting analysis of VCAM-1 and ICAM-1 in control or cells with H/R injury (n = 4). (C) Western blotting analysis of VCAM-1 and ICAM-1 in sham or I/R injured mice tissues (n = 4). (D) Flow cytometry detected the effect of siICAM-1 and siVCAM-1 transfection on cellular uptake of DiI-labeled MSC-exos in H/R-injured HK-2 cells. The red peak represented NC siRNA treated and the purple one represented siICAM-1 and siVCAM-1 transfected cells. (E) Flow cytometry detected the effect of VLA-4 and LFA-1 blockade on cellular uptake of DiI-labeled MSC-exos in H/R-injured HK-2 cells. The red peak represented isotype control treated MSC-exos and the orange one represented anti-VLA-4 and anti-LFA-1 antibodies treated MSC-exos. (F) Imaging of fluorescence intensity in isotype control or blocking antibodies treated group (n = 6). (G) Fluorescent images showed the accumulation of isotype control or blocking antibodies treated DiD-labeled MSC-exos in I/R mice (n = 6). Scale bars, 25 mum. Data are presented as mean +- SD, * p < 0.05, ** p < 0.01, *** p < 0.001, unpaired two-tailed Student''s t -test.
- Submitted by
- Invitrogen Antibodies (provider)
- Main image

- Experimental details
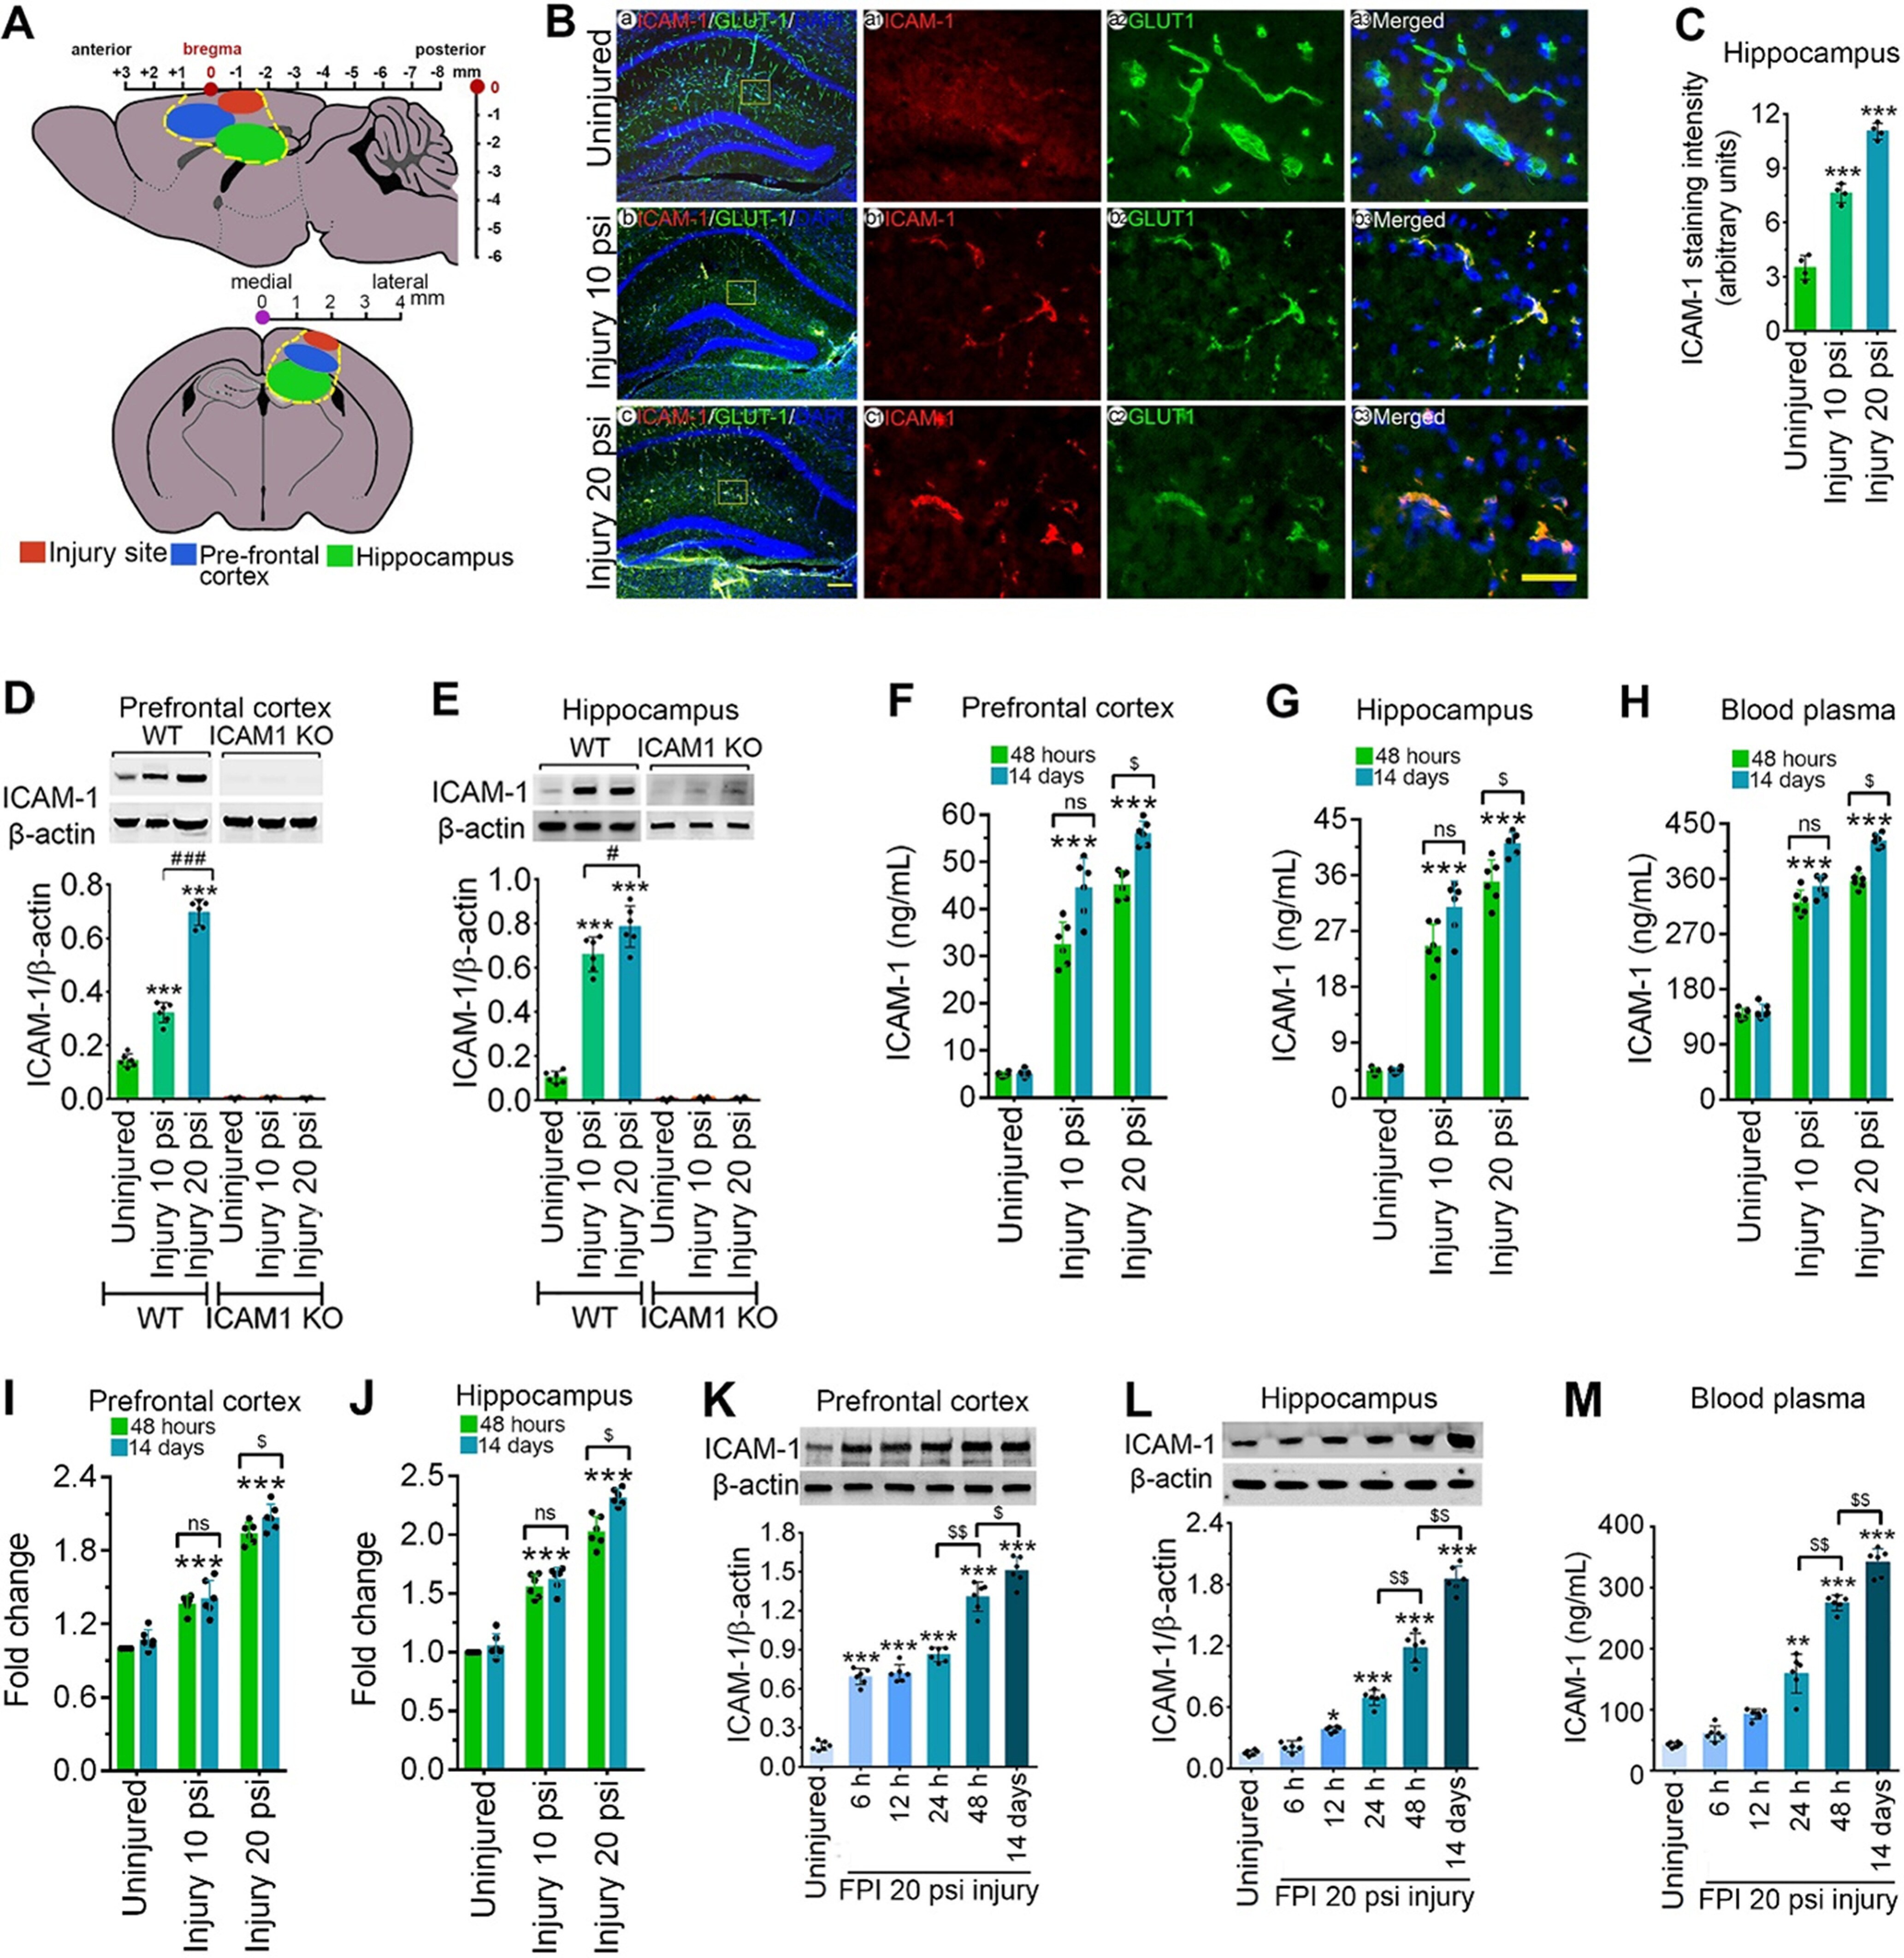
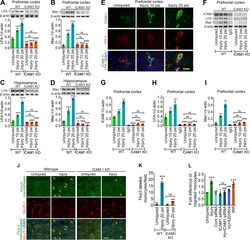
- Figure 1. TBI activates ICAM-1 protein in both mild and moderate injury. A , Representative illustration of injury site and tissue sampling area in the mice brain subjected to FPI. The injury site, PFC, and hippocampus are labeled with red, blue, and green colors, respectively. B , Immunofluorescent staining of ICAM-1 (red) in the hippocampus area and merged with GLUT-1 (green) and DAPI (blue) after 10 and 20 psi FPI. Scale bar: 100 mum (shown in c is for a-c , first column) and 40 mum (shows in c3 is for a1-a3 , b1-b3 , and c1-c3 , columns 2-4). C , Quantification of ICAM-1 staining in the hippocampus area of WT uninjured, 10 and 20 psi FPI mice using ImageJ software ( n = 4/group). D , E , Western blot analysis of ICAM-1 and beta-actin in the tissue lysates from PFC and hippocampus of WT and ICAM-1 -/- mice 48 h after 10 and 20 psi FPI. The bar graph with dot plots shows the quantification of ICAM-1 versus beta-actin ( n = 6/group). F-H , ELISA quantification of ICAM-1 in PFC ( F ), hippocampus ( G ) tissue lysates and blood plasma ( H ) 48 h and 14 d following 10 and 20 psi FPI ( n = 6/group). I , J , mRNA expression level of ICAM-1 using qPCR from PFC and hippocampus of WT and ICAM-1 -/- mice 48 h and 14 d after 10 and 20 psi FPI ( n = 6/group). K , L , Western blot analysis of ICAM-1 and beta-actin expression at different time points (6 h, 12 h, 24 h, 48 h, and 14 d) in the PFC ( K ) and hippocampus ( L ) of WT uninjured and 20 psi FPI. Bar graph represents the densitome
- Submitted by
- Invitrogen Antibodies (provider)
- Main image
- Experimental details
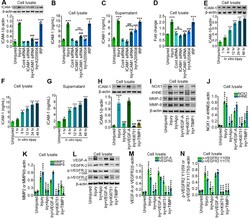
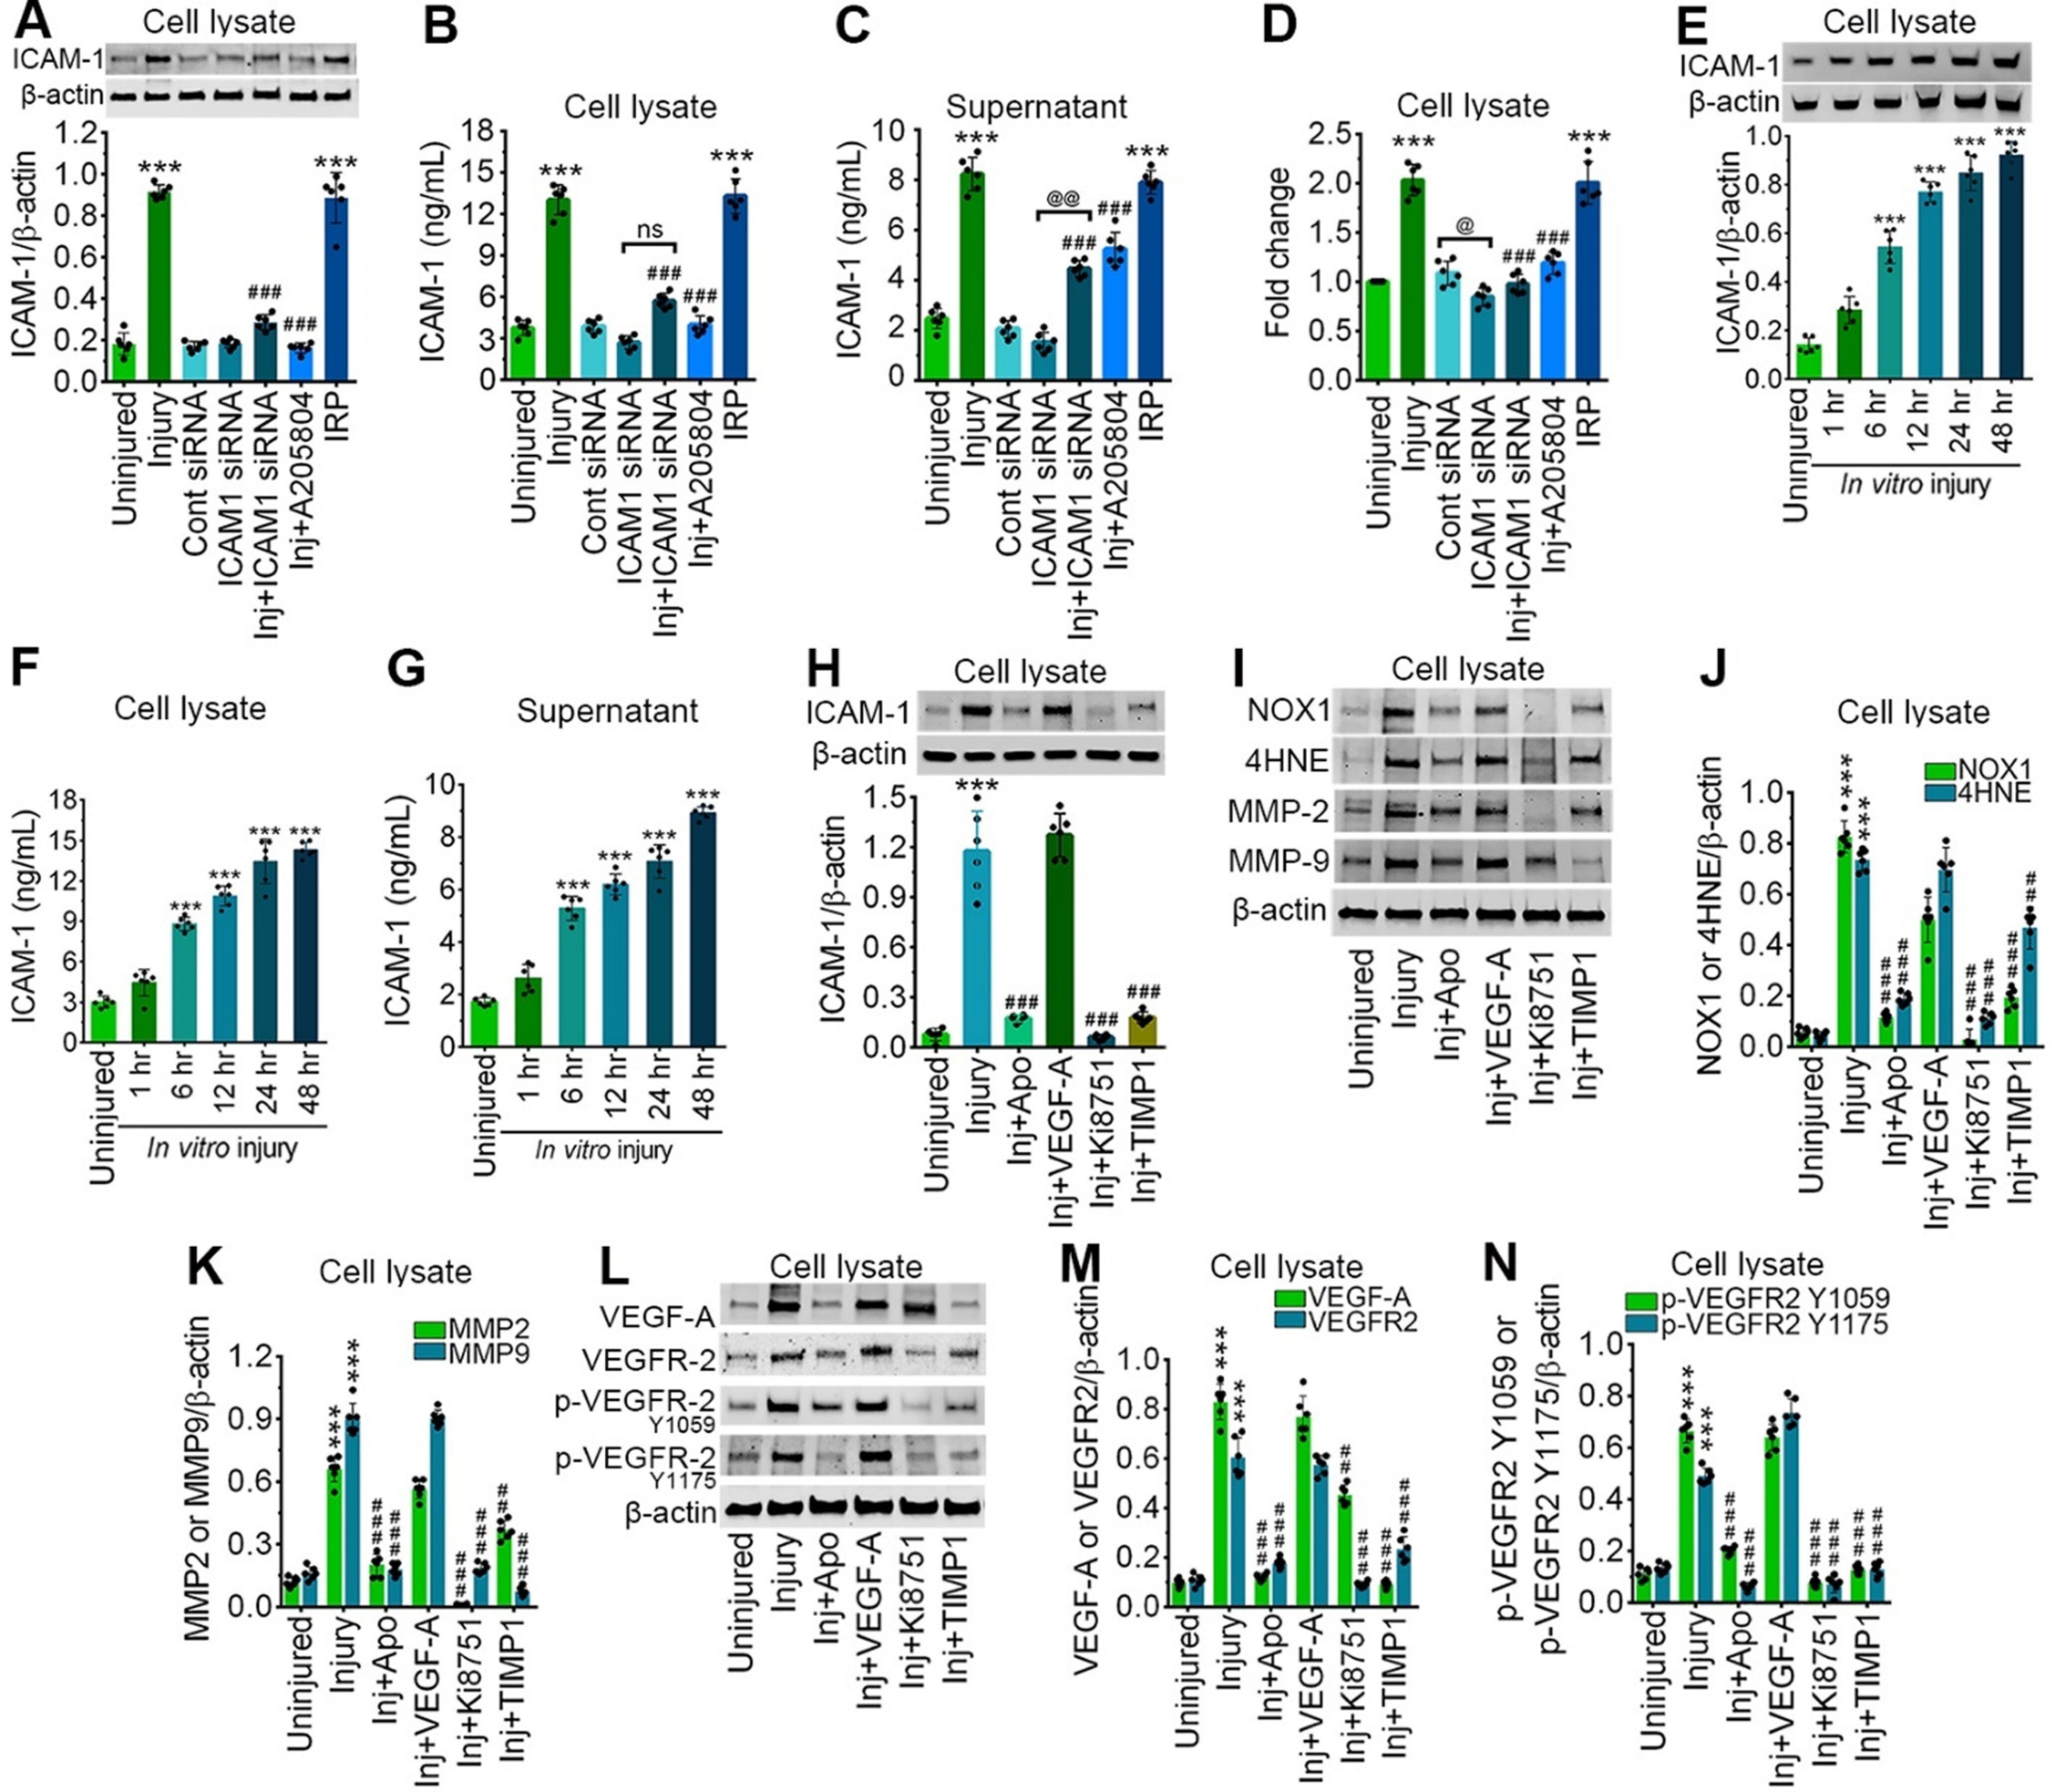
- Figure 2. Stretch injury causes the activation of ICAM-1 in a time-dependent manner and is regulated by oxidative stress, MMPs, and VEGF signaling. A , Western blot analysis of ICAM-1 and beta-actin 24 h after 3.0 psi stretch injury in the cell lysates of hBMVEC treated with control siRNA, ICAM-1 siRNA, A205804, and IRP. Bar graph represents the quantification of ICAM-1 versus beta-actin ( n = 6/group). B , C , ELISA quantification of ICAM-1 in cell lysates ( B ), and cell culture supernatant ( C ) of hBMVEC following 3.0 psi stretch injury treated with control siRNA, ICAM-1 siRNA, A205804, and IRP ( n = 6/group). D , mRNA expression level of ICAM-1 using qPCR from hBMVEC treated with control siRNA, ICAM-1 siRNA, A205804, and IRP ( n = 6/group) 24 h after 3.0 psi stretch injury. E , Western blot analysis of ICAM-1 and beta-actin expression at different time points (1, 6, 12, 24, 48 h) in hBMVEC lysates after 24 h 3.0 psi stretch injury. Bar graph represents the quantification of ICAM-1 versus beta-actin ( n = 6/group). F , G , ELISA quantification of ICAM-1 in cell lysate ( F ), and cell culture supernatant ( G ) of hBMVEC at different time points (1, 6, 12, 24, 48 h) following 3.0 psi stretch injury. H , Western blot analysis of ICAM-1 and beta-actin 24 h after 3.0 psi stretch injury in the cell lysates of hBMVEC treated with apocynin (NADPH oxidase inhibitor), VEGF-A (recombinant human VEGF), Ki8751 (inhibitor of VEGFR phosphorylation), and TIMP1 (MMPs inhibitor). Bar graph
- Submitted by
- Invitrogen Antibodies (provider)
- Main image
- Experimental details
- Figure 3. TBI enhances the activation of LFA-1 or Mac-1 with ICAM-1 and promotes transmigration of leukocytes. A , B , Western blotting of LFA-1 ( A ), Mac-1 ( B ), and beta-actin following 10 and 20 psi FPI in the prefrontal cortical tissue lysates of WT and ICAM-1 -/- mice. Bar graph represents the densitometric ratio of LFA-1 or Mac-1 bands versus beta-actin bands ( n = 6/group). C , D , Western blotting of LFA-1 ( C ), Mac-1 ( D ), and beta-actin in the hippocampal tissue lysates of WT and ICAM-1 -/- mice. Bar graph represents the densitometric ratio of LFA-1 or Mac-1 bands versus beta-actin bands ( n = 6/group). E , Immunofluorescent staining of ICAM-1 (green) merged with LFA-1 (red) and DAPI (blue) in WT mice 48 h after 10 and 20 psi FPI ( n = 4). F , Western blotting of ICAM-1, LFA-1, Mac-1, and beta-actin 48 h after 10 and 20 psi FPI in the tissue lysates immunoprecipitated with ICAM-1 mAb. Anti-IgG antibody was used as a negative control (fourth lane in WT blots). G-I , Bar graphs show the densitometric ratio of ICAM-1 ( G ), LFA-1 ( H ), and Mac-1 ( I ) bands versus beta-actin bands ( n = 6/group). J-L , In vivo and in vitro analysis of transmigration of leukocytes across the BBB. Fluo3-labeled macrophage adhesion/migration in brain capillary after infusion of cells into the common carotid artery ( J ), and the quantification of Fluo3-labeled cells in the brain part ( K ). L , Migration of monocytes across the in vitro model of BBB after treatment of various test co

- Submitted by
- Invitrogen Antibodies (provider)
- Main image
- Experimental details
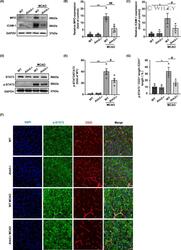
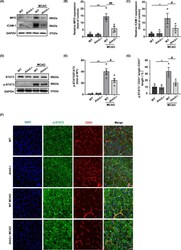
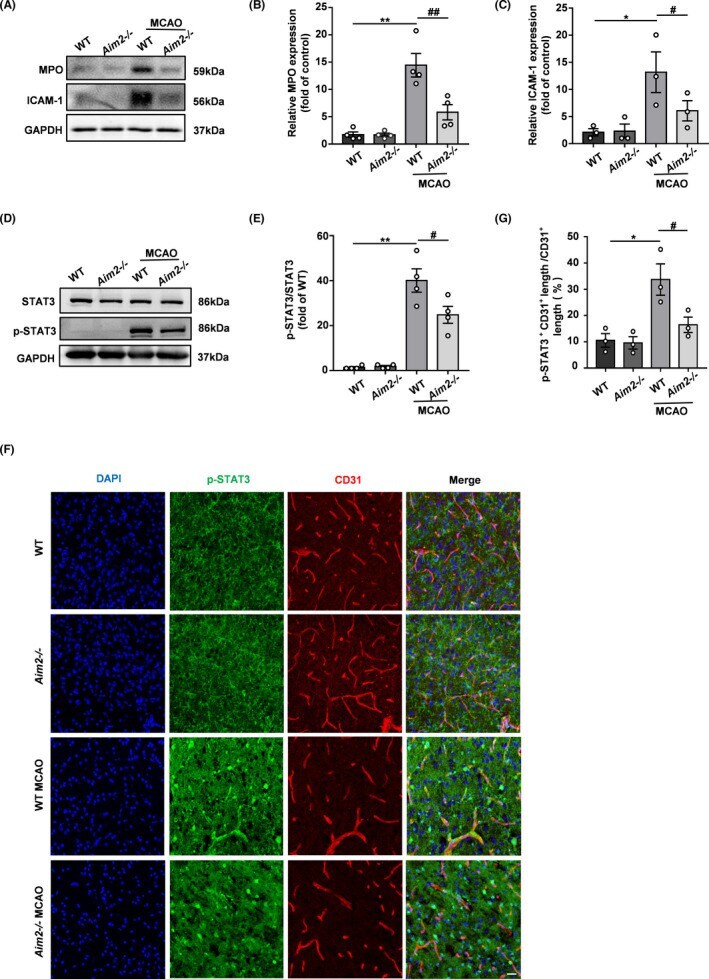
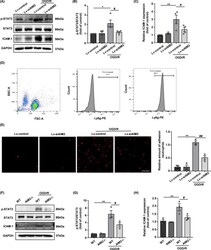
- 5 FIGURE AIM2 knockout decreased neutrophil infiltration and adhesion after ischemic stroke, and these effects were potentially associated with the decreased p-STAT3 expression in endothelial cells. A, The in vivo protein levels of MPO, ICAM-1, and GAPDH on day 1 after MCAO as determined by Western blot. B, C, Quantification of the levels of MPO and ICAM-1 normalized to that of GAPDH. D, The in vivo protein levels of STAT3, p-STAT3, and GAPDH on day 1 after MCAO as determined by Western blot. E, Quantification of p-STAT3. F, Immunofluorescence images of DAPI (blue)/p-STAT3 (green)/CD31 (red) colocalization in the WT, AIM2 -/- , MCAO-WT, and MCAO-AIM2 -/- groups on day 1 after MCAO. Scale bar: 20 mum. G, Percentage of the CD31 + p-STAT3 + vascular length with respect to the total CD31 + vascular length. All data are presented as the mean +-SEM. * p < 0.05 and ** p < 0.01 compared with the WT group. # p < 0.05 and ## p < 0.01 compared with the MCAO-WT group

- Submitted by
- Invitrogen Antibodies (provider)
- Main image
- Experimental details
- FIGURE 5 AIM2 knockout decreased neutrophil infiltration and adhesion after ischemic stroke, and these effects were potentially associated with the decreased p-STAT3 expression in endothelial cells. A, The in vivo protein levels of MPO, ICAM-1, and GAPDH on day 1 after MCAO as determined by Western blot. B, C, Quantification of the levels of MPO and ICAM-1 normalized to that of GAPDH. D, The in vivo protein levels of STAT3, p-STAT3, and GAPDH on day 1 after MCAO as determined by Western blot. E, Quantification of p-STAT3. F, Immunofluorescence images of DAPI (blue)/p-STAT3 (green)/CD31 (red) colocalization in the WT, AIM2 -/- , MCAO-WT, and MCAO-AIM2 -/- groups on day 1 after MCAO. Scale bar: 20 mum. G, Percentage of the CD31 + p-STAT3 + vascular length with respect to the total CD31 + vascular length. All data are presented as the mean +-SEM. * p < 0.05 and ** p < 0.01 compared with the WT group. # p < 0.05 and ## p < 0.01 compared with the MCAO-WT group
- Submitted by
- Invitrogen Antibodies (provider)
- Main image
- Experimental details
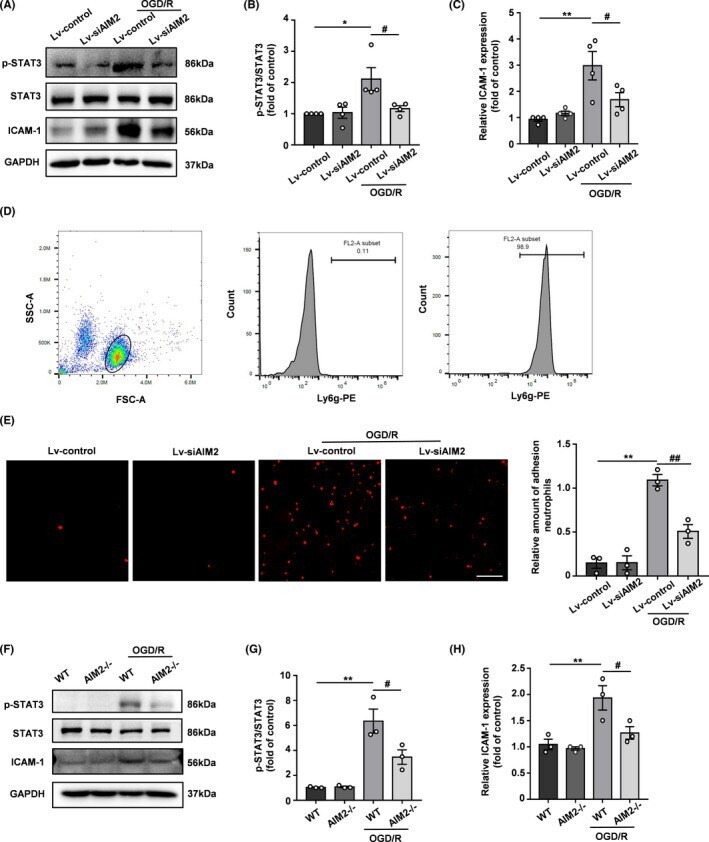
- FIGURE 6 AIM2 knockdown decreased neutrophil adhesion in vitro after OGD/R, and this effect was potentially associated with a decrease in p-STAT3 expression in endothelial cells. A, The protein levels of STAT3, p-STAT3, ICAM-1, and GAPDH in HBMECs after OGD/R as determined by Western blot. B, C, Quantification of the levels of p-STAT3 and ICAM-1 normalized to that of GAPDH. D, The neutrophil purity was examined by flow cytometry. E, Representative images and quantification of neutrophil adhesion to HBMEC monolayers in vitro. Scale bar: 100 mum. F, Western blot images of STAT3, p-STAT3, ICAM-1, and GAPDH expression in PBMECs after OGD/R. G, H, Quantification of the levels of p-STAT3 and ICAM-1 normalized to that of GAPDH. All data are presented as the mean +-SEM. * p < 0.05 and ** p < 0.01 compared with the Lv-control group. # p < 0.05 and ## p < 0.01 compared with the OGD/R-Lv-control group
- Submitted by
- Invitrogen Antibodies (provider)
- Main image

- Experimental details
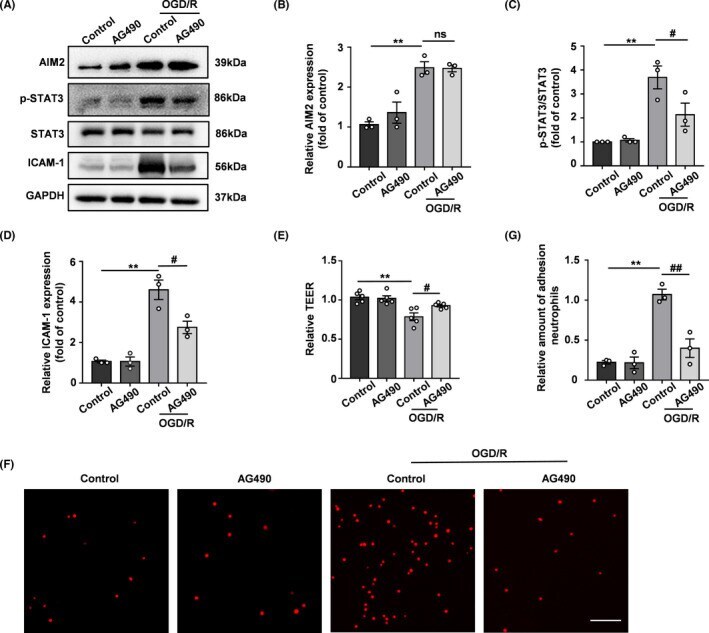
- FIGURE 7 AG490 alleviated OGD/R-induced BBB breakdown. A, Representative Western blot images of AIM2, p-STAT3, STAT3, ICAM-1, and GAPDH expression after OGD/R. B-D, Quantification of the levels of AIM2, p-STAT3, and ICAM-1 normalized to that of GAPDH. E, Quantification of transendothelial permeability as determined by the TEER assay. F, Representative images of neutrophil adhesion to HBMEC monolayers in vitro. Scale bar: 100 mum. G, Quantification of neutrophil adhesion to HBMEC monolayers in vitro. All data are presented as the mean +-SEM. ** p < 0.01 compared with the control group. # p < 0.05 and ## p < 0.01 compared with the OGD/R-control group
- Submitted by
- Invitrogen Antibodies (provider)
- Main image

- Experimental details
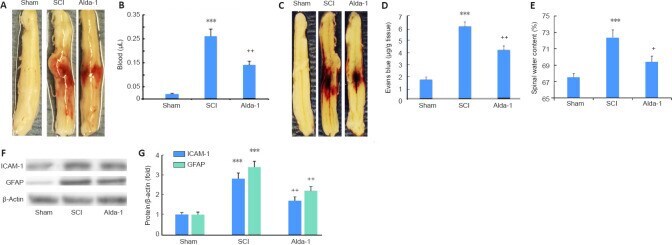
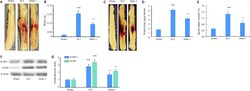
- Figure 3 ALDH2 agonist Alda-1 reduces neurovascular dysfunction and inflammation in the acute phase (72 hours) of SCI in wild type mice. Representative whole spinal cords (A) and spectrophotometric quantification (B) of the amount of blood in homogenates, representative whole spinal cords (C) showing Evans blue dye extravasation into spinal cord and quantification of the Evans blue extravasation (D), levels of edema (spinal water content) (E), Western blot of the expression of ICAM-1 and GFAP (F) and densitometry of ICAM-1 and GFAP (G). Data are presented as the mean +- SD ( n = 7). *** P < 0.001, vs . Sham; + P < 0.05, ++ P < 0.01, vs . SCI (one-way analysis of variance with Tukey's post hoc test). Alda-1: N-(1,3-benzodioxol-5-ylmethyl)-2,6-dichlorobenzamide; ALDH2: aldehyde dehydrogenase 2; GFAP: glial fibrillary acidic protein; ICAM-1: intercellular adhesion molecule 1; SCI: spinal cord injury.
- Submitted by
- Invitrogen Antibodies (provider)
- Main image

- Experimental details
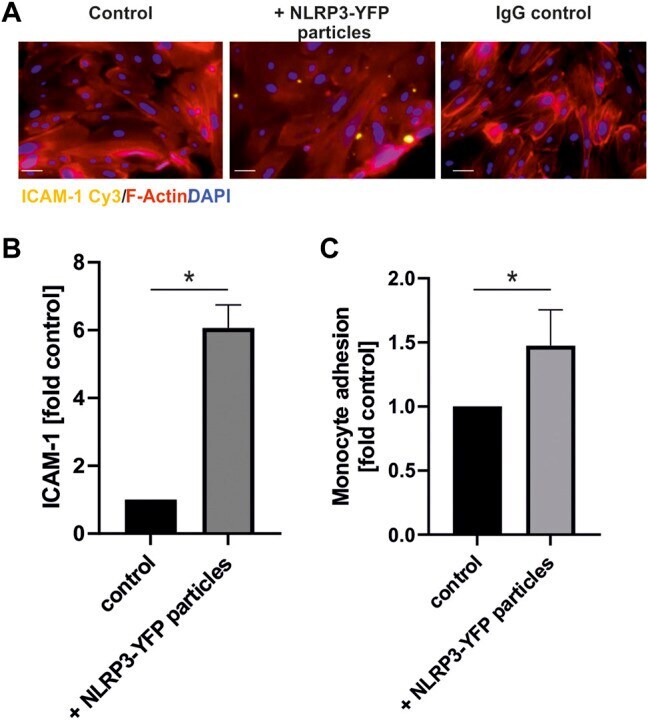
- FIGURE 5 Treatment with extracellular NLRP3 inflammasome particles induces inflammation in endothelial cells. (A) Immunofluorescent analysis of ICAM-1 protein expression on coronary artery endothelial cells after 24 h incubation with NLRP3-YFP particles (3 NLRP3-YFP particles/cell) and stained with anti-ICAM1 Cy3 (scale bar: 50 um). (B) Quantitative analysis of ICAM-1 fluorescence (N = 4). (C) Calcein-stained THP-1 monocyte adhesion on endothelial cells after incubation with NLRP3-YFP particles for 4 h measured by a fluorometric analysis and normalized to untreated cells in the culture medium (control). Two-sided unpaired t -test was used to analyze the data.
- Submitted by
- Invitrogen Antibodies (provider)
- Main image
- Experimental details
- Figure 3 ALDH2 agonist Alda-1 reduces neurovascular dysfunction and inflammation in the acute phase (72 hours) of SCI in wild type mice. Representative whole spinal cords (A) and spectrophotometric quantification (B) of the amount of blood in homogenates, representative whole spinal cords (C) showing Evans blue dye extravasation into spinal cord and quantification of the Evans blue extravasation (D), levels of edema (spinal water content) (E), Western blot of the expression of ICAM-1 and GFAP (F) and densitometry of ICAM-1 and GFAP (G). Data are presented as the mean +- SD ( n = 7). *** P < 0.001, vs . Sham; + P < 0.05, ++ P < 0.01, vs . SCI (one-way analysis of variance with Tukey's post hoc test). Alda-1: N-(1,3-benzodioxol-5-ylmethyl)-2,6-dichlorobenzamide; ALDH2: aldehyde dehydrogenase 2; GFAP: glial fibrillary acidic protein; ICAM-1: intercellular adhesion molecule 1; SCI: spinal cord injury. Figure 3

- Submitted by
- Invitrogen Antibodies (provider)
- Main image
- Experimental details
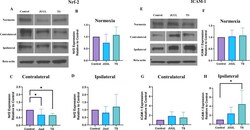
- Brain Nrf2 and ICAM-1 expression in mice after 14 days of JUUL/TS exposure with or without MCAO. A Western blot images of Nrf2 expression in normoxic brain and contralateral & ipsilateral brain hemispheres 24 h after MCAO. B - D Quantification of brain Nrf2 expression normalized to beta-actin and expressed as relative to control (1.0) in normoxic, contralateral, and ipsilateral brain regions. E Western blot images of ICAM-1 expression in normoxic brain and contralateral & ipsilateral brain hemispheres 24 h after MCAO. F - H Quantification of brain ICAM-1 expression normalized to beta-actin and expressed as relative to control (1.0) in normoxic, contralateral, and ipsilateral brain regions. *P < 0.05; n = 9 for each group (B), n = 7, 7, and 6 for control, JUUL, and TS respectively ( C , D ), n = 9 for each group ( F ), n = 6, 5, and 5 for control, JUUL, and TS respectively ( G , H ). Cropped images from blots have been used in some cases to improve the clarity and conciseness of the presentation. The cropped images are delineated with white space; full-length blots developed by X-ray films are presented in Additional file 1 : Fig. S1
