Explore
 Validate
 Learn
Learn Flow cytometry
Antibody data
- Antibody Data
- Antigen structure
- References [48]
- Comments [0]
- Validations
- Flow cytometry [2]
- Other assay [47]
Submit
Validation data
Reference
Comment
Report error
- Product number
- 48-0149-41 - Provider product page

- Provider
- Invitrogen Antibodies
- Product name
- CD14 Monoclonal Antibody (61D3), eFluor™ 450, eBioscience™
- Antibody type
- Monoclonal
- Antigen
- Other
- Description
- Description: The 61D3 monoclonal antibody reacts with human CD14, a 53-55 kDa GPI-linked glycoprotein. CD14 is expressed on monocytes, interfollicular macrophages and some dendritic cells. Complexes of LPS and LBP (LPS-Binding Protein) bind with high affinity to monocytes through the surface CD14. Applications Reported: This 61D3 antibody has been reported for use in flow cytometric analysis. Applications Tested: This 61D3 antibody has been pre-titrated and tested by flow cytometric analysis of normal human peripheral blood cells. This can be used at 5 µL (0.5 µg) per test. A test is defined as the amount (µg) of antibody that will stain a cell sample in a final volume of 100 µL. Cell number should be determined empirically but can range from 10^5 to 10^8 cells/test. eFluor® 450 is an alternative to Pacific Blue®. eFluor® 450 emits at 445 nm and is excited with the Violet laser (405 nm). Please make sure that your instrument is capable of detecting this fluorochrome. Excitation: 405 nm; Emission: 445 nm; Laser: Violet Laser. Filtration: 0.2 µm post-manufacturing filtered.
- Reactivity
- Human
- Host
- Mouse
- Isotype
- IgG
- Antibody clone number
- 61D3
- Vial size
- 25 Tests
- Concentration
- 5 µL/Test
- Storage
- 4°C, store in dark, DO NOT FREEZE!
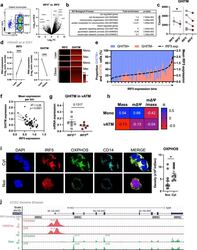
Submitted references Early macrophage response to obesity encompasses Interferon Regulatory Factor 5 regulated mitochondrial architecture remodelling.
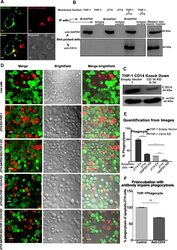
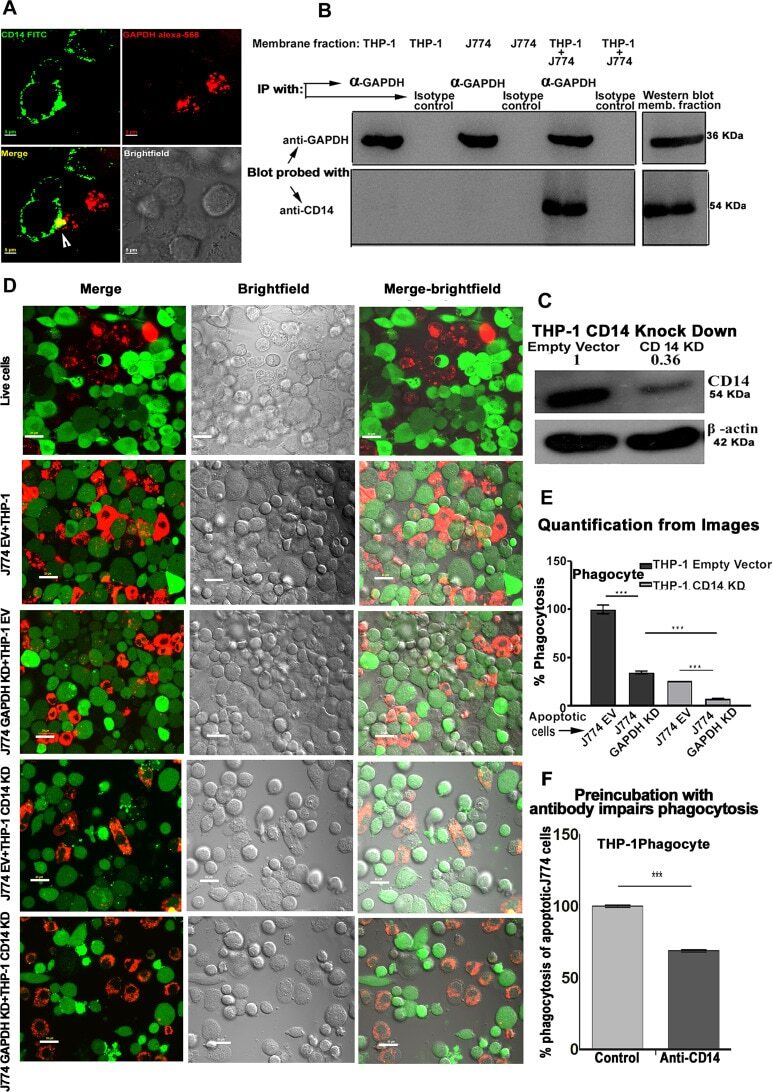
Exposure of a specific pleioform of multifunctional glyceraldehyde 3-phosphate dehydrogenase initiates CD14-dependent clearance of apoptotic cells.
Ex vivo expansion of dysfunctional regulatory T lymphocytes restores suppressive function in Parkinson's disease.
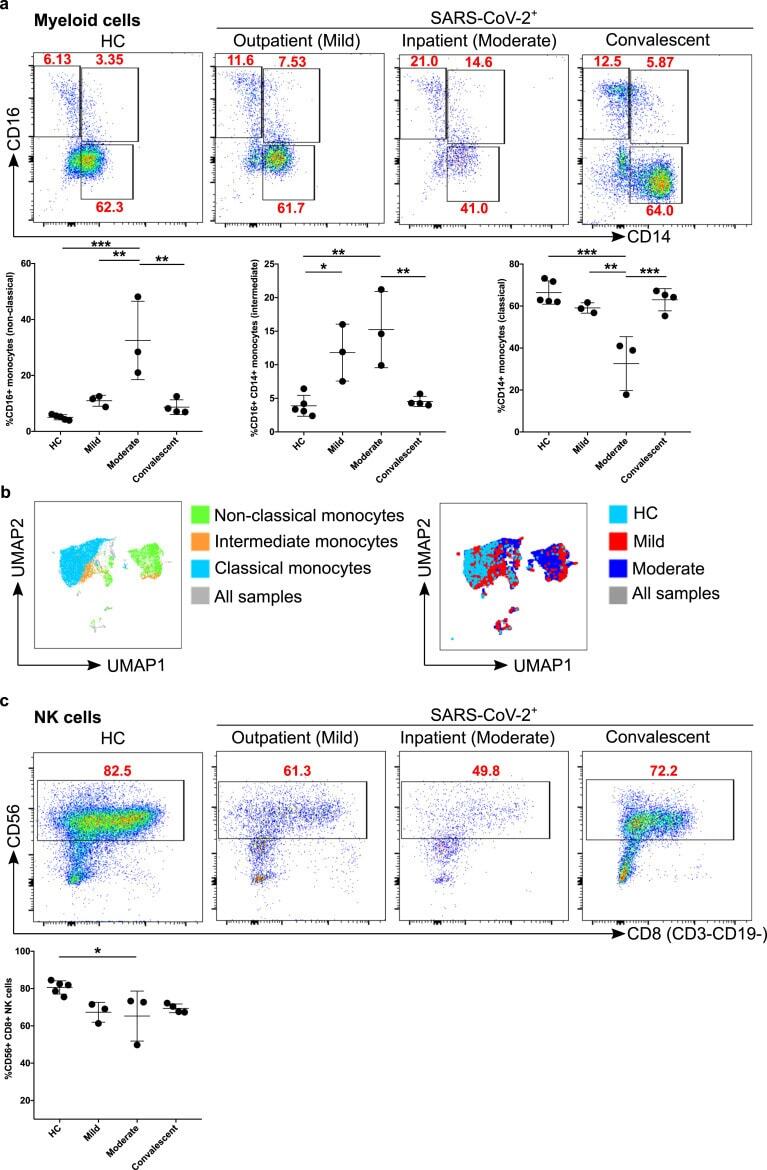
SARS-CoV-2 infection paralyzes cytotoxic and metabolic functions of the immune cells.
Differentiation Potential of Early- and Late-Passage Adipose-Derived Mesenchymal Stem Cells Cultured under Hypoxia and Normoxia.
MiR-103 protects from recurrent spontaneous abortion via inhibiting STAT1 mediated M1 macrophage polarization.
Fragile neutrophils in surgical patients: A phenomenon associated with critical illness.
Chemerin enhances the adhesion and migration of human endothelial progenitor cells and increases lipid accumulation in mice with atherosclerosis.
The long non-coding RNA Cancer Susceptibility 15 (CASC15) is induced by isocitrate dehydrogenase (IDH) mutations and maintains an immature phenotype in adult acute myeloid leukemia.
TLR2 on blood monocytes senses dengue virus infection and its expression correlates with disease pathogenesis.
NKG2C(pos) NK Cells Regulate the Expansion of Cytomegalovirus-Specific CD8 T Cells.
A functional antibody cross-reactive to both human and murine cytotoxic T-lymphocyte-associated protein 4 via binding to an N-glycosylation epitope.
Patient iPSC-Derived Macrophages to Study Inborn Errors of the IFN-γ Responsive Pathway.
Gene expression network analyses during infection with virulent and avirulent Trypanosoma cruzi strains unveil a role for fibroblasts in neutrophil recruitment and activation.
NOX2 mediates quiescent handling of dead cell remnants in phagocytes.
NLRP3 inflammasome expression in peripheral blood monocytes of coronary heart disease patients and its modulation by rosuvastatin.
Characterizing the Role of Monocytes in T Cell Cancer Immunotherapy Using a 3D Microfluidic Model.
Butyrate upregulates the TLR4 expression and the phosphorylation of MAPKs and NK-κB in colon cancer cell in vitro.
Genetic Architecture of Adaptive Immune System Identifies Key Immune Regulators.
Cellular metabolism constrains innate immune responses in early human ontogeny.
AURKA Suppresses Leukemic THP-1 Cell Differentiation through Inhibition of the KDM6B Pathway.
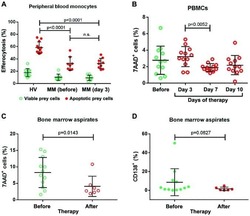
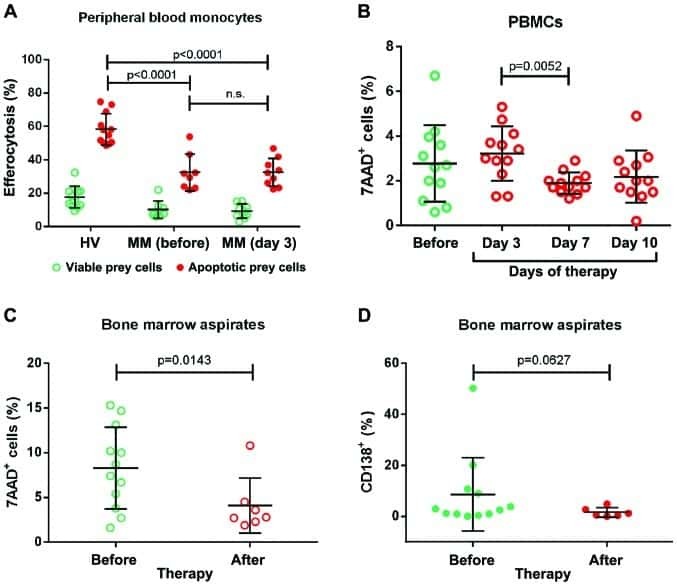
Impaired efferocytosis by monocytes in multiple myeloma.
Activation-induced Markers Detect Vaccine-Specific CD4⁺ T Cell Responses Not Measured by Assays Conventionally Used in Clinical Trials.
Comprehensive characterization of chorionic villi-derived mesenchymal stromal cells from human placenta.
The pro-inflammatory phenotype of the human non-classical monocyte subset is attributed to senescence.
Human umbilical cord-derived mesenchymal stem cells ameliorate the enteropathy of food allergies in mice.
Safety and Immunogenicity of Malaria Vectored Vaccines Given with Routine Expanded Program on Immunization Vaccines in Gambian Infants and Neonates: A Randomized Controlled Trial.
Experimental lupus is aggravated in mouse strains with impaired induction of neutrophil extracellular traps.
Human umbilical cord mesenchymal stem cells improve the reserve function of perimenopausal ovary via a paracrine mechanism.
A therapeutic T cell receptor mimic antibody targets tumor-associated PRAME peptide/HLA-I antigens.
Toll-like receptor 3 activation selectively reverses HIV latency in microglial cells.
Dextran-based therapeutic nanoparticles for hepatic drug delivery.
Pulmonary sarcoidosis is associated with high-level inducible co-stimulator (ICOS) expression on lung regulatory T cells--possible implications for the ICOS/ICOS-ligand axis in disease course and resolution.
Thrombomodulin regulates monocye differentiation via PKCδ and ERK1/2 pathway in vitro and in atherosclerotic artery.
Investigating the causes for decreased levels of glutathione in individuals with type II diabetes.
Liposomal Glutathione Supplementation Restores TH1 Cytokine Response to Mycobacterium tuberculosis Infection in HIV-Infected Individuals.
STK4 regulates TLR pathways and protects against chronic inflammation-related hepatocellular carcinoma.
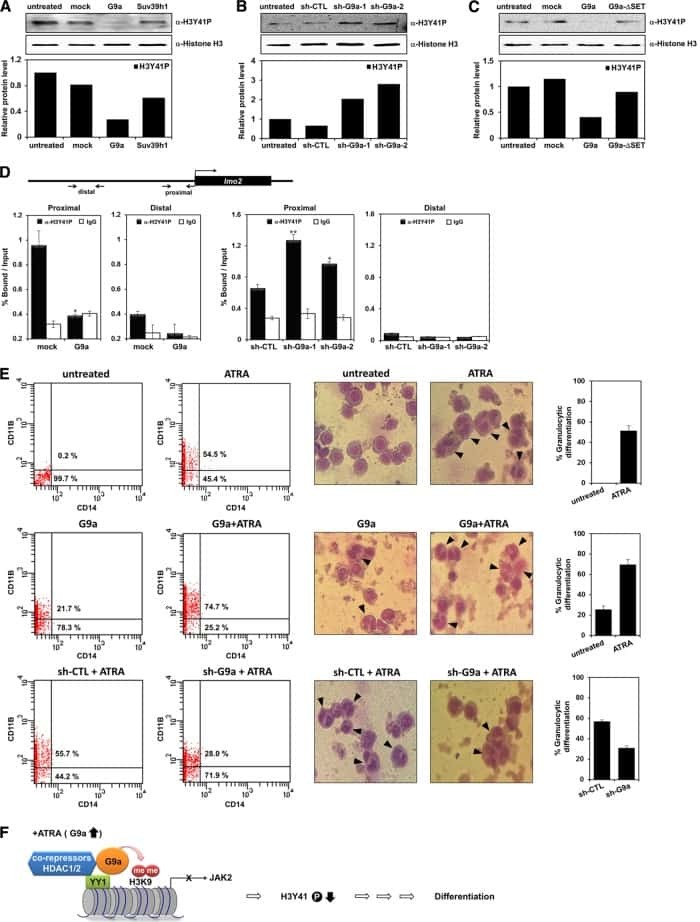
A novel antibody-drug conjugate targeting SAIL for the treatment of hematologic malignancies.
Biologically active polymers from spontaneous carotenoid oxidation: a new frontier in carotenoid activity.
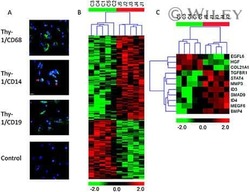
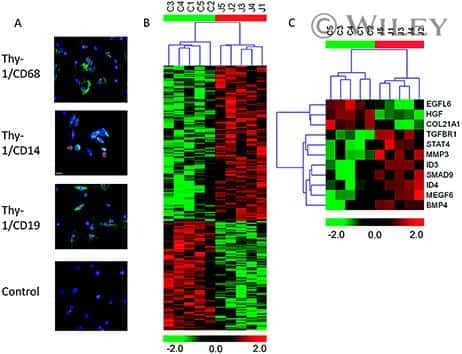
The role of transforming growth factor β signaling in fibroblast-like synoviocytes from patients with oligoarticular juvenile idiopathic arthritis: dysregulation of transforming growth factor β signaling, including overexpression of bone morphogenetic protein 4, may lead to a chondrocyte phenotype and may contribute to bony hypertrophy.
Human mesenchymal stem cells possess different biological characteristics but do not change their therapeutic potential when cultured in serum free medium.
Noncanonical dendritic cell differentiation and survival driven by a bacteremic pathogen.
Ulcerative colitis impairs the acylethanolamide-based anti-inflammatory system reversal by 5-aminosalicylic acid and glucocorticoids.
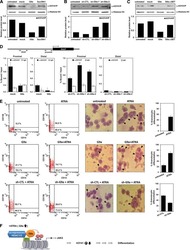
Negative regulation of JAK2 by H3K9 methyltransferase G9a in leukemia.
Induction of autophagy is essential for monocyte-macrophage differentiation.
Upregulation of programmed death-1 on T cells and programmed death ligand-1 on monocytes in septic shock patients.
Ro60-associated single-stranded RNA links inflammation with fetal cardiac fibrosis via ligation of TLRs: a novel pathway to autoimmune-associated heart block.
B cells and monocytes from patients with active multiple sclerosis exhibit increased surface expression of both HERV-H Env and HERV-W Env, accompanied by increased seroreactivity.
Orliaguet L, Ejlalmanesh T, Humbert A, Ballaire R, Diedisheim M, Julla JB, Chokr D, Cuenco J, Michieletto J, Charbit J, Lindén D, Boucher J, Potier C, Hamimi A, Lemoine S, Blugeon C, Legoix P, Lameiras S, Baudrin LG, Baulande S, Soprani A, Castelli FA, Fenaille F, Riveline JP, Dalmas E, Rieusset J, Gautier JF, Venteclef N, Alzaid F
Nature communications 2022 Aug 30;13(1):5089
Nature communications 2022 Aug 30;13(1):5089
Exposure of a specific pleioform of multifunctional glyceraldehyde 3-phosphate dehydrogenase initiates CD14-dependent clearance of apoptotic cells.
Chaudhary S, Patidar A, Dhiman A, Chaubey GK, Dilawari R, Talukdar S, Modanwal R, Raje M
Cell death & disease 2021 Sep 30;12(10):892
Cell death & disease 2021 Sep 30;12(10):892
Ex vivo expansion of dysfunctional regulatory T lymphocytes restores suppressive function in Parkinson's disease.
Thome AD, Atassi F, Wang J, Faridar A, Zhao W, Thonhoff JR, Beers DR, Lai EC, Appel SH
NPJ Parkinson's disease 2021 May 13;7(1):41
NPJ Parkinson's disease 2021 May 13;7(1):41
SARS-CoV-2 infection paralyzes cytotoxic and metabolic functions of the immune cells.
Singh Y, Trautwein C, Fendel R, Krickeberg N, Berezhnoy G, Bissinger R, Ossowski S, Salker MS, Casadei N, Riess O, Deutsche COVID-19 OMICS Initiate (DeCOI)
Heliyon 2021 Jun;7(6):e07147
Heliyon 2021 Jun;7(6):e07147
Differentiation Potential of Early- and Late-Passage Adipose-Derived Mesenchymal Stem Cells Cultured under Hypoxia and Normoxia.
Zhao AG, Shah K, Freitag J, Cromer B, Sumer H
Stem cells international 2020;2020:8898221
Stem cells international 2020;2020:8898221
MiR-103 protects from recurrent spontaneous abortion via inhibiting STAT1 mediated M1 macrophage polarization.
Zhu X, Liu H, Zhang Z, Wei R, Zhou X, Wang Z, Zhao L, Guo Q, Zhang Y, Chu C, Wang L, Li X
International journal of biological sciences 2020;16(12):2248-2264
International journal of biological sciences 2020;16(12):2248-2264
Fragile neutrophils in surgical patients: A phenomenon associated with critical illness.
Hesselink L, Spijkerman R, Hellebrekers P, van Bourgondiën RJ, Blasse E, Haitjema S, Huisman A, van Solinge WW, Van Wessem KJP, Koenderman L, Leenen LPH, Hietbrink F
PloS one 2020;15(8):e0236596
PloS one 2020;15(8):e0236596
Chemerin enhances the adhesion and migration of human endothelial progenitor cells and increases lipid accumulation in mice with atherosclerosis.
Jia J, Yu F, Xiong Y, Wei W, Ma H, Nisi F, Song X, Yang L, Wang D, Yuan G, Zhou H
Lipids in health and disease 2020 Sep 20;19(1):207
Lipids in health and disease 2020 Sep 20;19(1):207
The long non-coding RNA Cancer Susceptibility 15 (CASC15) is induced by isocitrate dehydrogenase (IDH) mutations and maintains an immature phenotype in adult acute myeloid leukemia.
Grasedieck S, Ruess C, Krowiorz K, Lux S, Pochert N, Schwarzer A, Klusmann JH, Jongen-Lavrencic M, Herold T, Bullinger L, Pollack JR, Rouhi A, Kuchenbauer F
Haematologica 2020 Sep 1;105(9):e448-453
Haematologica 2020 Sep 1;105(9):e448-453
TLR2 on blood monocytes senses dengue virus infection and its expression correlates with disease pathogenesis.
Aguilar-Briseño JA, Upasani V, Ellen BMT, Moser J, Pauzuolis M, Ruiz-Silva M, Heng S, Laurent D, Choeung R, Dussart P, Cantaert T, Smit JM, Rodenhuis-Zybert IA
Nature communications 2020 Jun 23;11(1):3177
Nature communications 2020 Jun 23;11(1):3177
NKG2C(pos) NK Cells Regulate the Expansion of Cytomegalovirus-Specific CD8 T Cells.
Grutza R, Moskorz W, Senff T, Bäcker E, Lindemann M, Zimmermann A, Uhrberg M, Lang PA, Timm J, Cosmovici C
Journal of immunology (Baltimore, Md. : 1950) 2020 Jun 1;204(11):2910-2917
Journal of immunology (Baltimore, Md. : 1950) 2020 Jun 1;204(11):2910-2917
A functional antibody cross-reactive to both human and murine cytotoxic T-lymphocyte-associated protein 4 via binding to an N-glycosylation epitope.
Li D, Li J, Chu H, Wang Z
mAbs 2020 Jan-Dec;12(1):1725365
mAbs 2020 Jan-Dec;12(1):1725365
Patient iPSC-Derived Macrophages to Study Inborn Errors of the IFN-γ Responsive Pathway.
Haake K, Neehus AL, Buchegger T, Kühnel MP, Blank P, Philipp F, Oleaga-Quintas C, Schulz A, Grimley M, Goethe R, Jonigk D, Kalinke U, Boisson-Dupuis S, Casanova JL, Bustamante J, Lachmann N
Cells 2020 Feb 19;9(2)
Cells 2020 Feb 19;9(2)
Gene expression network analyses during infection with virulent and avirulent Trypanosoma cruzi strains unveil a role for fibroblasts in neutrophil recruitment and activation.
Oliveira AER, Pereira MCA, Belew AT, Ferreira LRP, Pereira LMN, Neves EGA, Nunes MDCP, Burleigh BA, Dutra WO, El-Sayed NM, Gazzinelli RT, Teixeira SMR
PLoS pathogens 2020 Aug;16(8):e1008781
PLoS pathogens 2020 Aug;16(8):e1008781
NOX2 mediates quiescent handling of dead cell remnants in phagocytes.
Hahn J, Euler M, Kilgus E, Kienhöfer D, Stoof J, Knopf J, Hahn M, Harrer T, Hultqvist M, Olofsson P, Mokhir A, Holmdahl R, Herrmann M, Schett G, Muñoz LE, Hoffmann MH
Redox biology 2019 Sep;26:101279
Redox biology 2019 Sep;26:101279
NLRP3 inflammasome expression in peripheral blood monocytes of coronary heart disease patients and its modulation by rosuvastatin.
Zhu J, Wu S, Hu S, Li H, Li M, Geng X, Wang H
Molecular medicine reports 2019 Aug;20(2):1826-1836
Molecular medicine reports 2019 Aug;20(2):1826-1836
Characterizing the Role of Monocytes in T Cell Cancer Immunotherapy Using a 3D Microfluidic Model.
Lee SWL, Adriani G, Ceccarello E, Pavesi A, Tan AT, Bertoletti A, Kamm RD, Wong SC
Frontiers in immunology 2018;9:416
Frontiers in immunology 2018;9:416
Butyrate upregulates the TLR4 expression and the phosphorylation of MAPKs and NK-κB in colon cancer cell in vitro.
Xiao T, Wu S, Yan C, Zhao C, Jin H, Yan N, Xu J, Wu Y, Li C, Shao Q, Xia S
Oncology letters 2018 Oct;16(4):4439-4447
Oncology letters 2018 Oct;16(4):4439-4447
Genetic Architecture of Adaptive Immune System Identifies Key Immune Regulators.
Lagou V, Garcia-Perez JE, Smets I, Van Horebeek L, Vandebergh M, Chen L, Mallants K, Prezzemolo T, Hilven K, Humblet-Baron S, Moisse M, Van Damme P, Boeckxstaens G, Bowness P, Dubois B, Dooley J, Liston A, Goris A
Cell reports 2018 Oct 16;25(3):798-810.e6
Cell reports 2018 Oct 16;25(3):798-810.e6
Cellular metabolism constrains innate immune responses in early human ontogeny.
Kan B, Michalski C, Fu H, Au HHT, Lee K, Marchant EA, Cheng MF, Anderson-Baucum E, Aharoni-Simon M, Tilley P, Mirmira RG, Ross CJ, Luciani DS, Jan E, Lavoie PM
Nature communications 2018 Nov 16;9(1):4822
Nature communications 2018 Nov 16;9(1):4822
AURKA Suppresses Leukemic THP-1 Cell Differentiation through Inhibition of the KDM6B Pathway.
Park JW, Cho H, Oh H, Kim JY, Seo SB
Molecules and cells 2018 May 31;41(5):444-453
Molecules and cells 2018 May 31;41(5):444-453
Impaired efferocytosis by monocytes in multiple myeloma.
Liang YY, Schwarzinger I, Simonitsch-Klupp I, Agis H, Oehler R
Oncology letters 2018 Jul;16(1):409-416
Oncology letters 2018 Jul;16(1):409-416
Activation-induced Markers Detect Vaccine-Specific CD4⁺ T Cell Responses Not Measured by Assays Conventionally Used in Clinical Trials.
Bowyer G, Rampling T, Powlson J, Morter R, Wright D, Hill AVS, Ewer KJ
Vaccines 2018 Jul 31;6(3)
Vaccines 2018 Jul 31;6(3)
Comprehensive characterization of chorionic villi-derived mesenchymal stromal cells from human placenta.
Ventura Ferreira MS, Bienert M, Müller K, Rath B, Goecke T, Opländer C, Braunschweig T, Mela P, Brümmendorf TH, Beier F, Neuss S
Stem cell research & therapy 2018 Feb 5;9(1):28
Stem cell research & therapy 2018 Feb 5;9(1):28
The pro-inflammatory phenotype of the human non-classical monocyte subset is attributed to senescence.
Ong SM, Hadadi E, Dang TM, Yeap WH, Tan CT, Ng TP, Larbi A, Wong SC
Cell death & disease 2018 Feb 15;9(3):266
Cell death & disease 2018 Feb 15;9(3):266
Human umbilical cord-derived mesenchymal stem cells ameliorate the enteropathy of food allergies in mice.
Yan N, Xu J, Zhao C, Wu Y, Gao F, Li C, Zhou W, Xiao T, Zhou X, Shao Q, Xia S
Experimental and therapeutic medicine 2018 Dec;16(6):4445-4456
Experimental and therapeutic medicine 2018 Dec;16(6):4445-4456
Safety and Immunogenicity of Malaria Vectored Vaccines Given with Routine Expanded Program on Immunization Vaccines in Gambian Infants and Neonates: A Randomized Controlled Trial.
Mensah VA, Roetynck S, Kanteh EK, Bowyer G, Ndaw A, Oko F, Bliss CM, Jagne YJ, Cortese R, Nicosia A, Roberts R, D'Alessio F, Leroy O, Faye B, Kampmann B, Cisse B, Bojang K, Gerry S, Viebig NK, Lawrie AM, Clarke E, Imoukhuede EB, Ewer KJ, Hill AVS, Afolabi MO
Frontiers in immunology 2017;8:1551
Frontiers in immunology 2017;8:1551
Experimental lupus is aggravated in mouse strains with impaired induction of neutrophil extracellular traps.
Kienhöfer D, Hahn J, Stoof J, Csepregi JZ, Reinwald C, Urbonaviciute V, Johnsson C, Maueröder C, Podolska MJ, Biermann MH, Leppkes M, Harrer T, Hultqvist M, Olofsson P, Munoz LE, Mocsai A, Herrmann M, Schett G, Holmdahl R, Hoffmann MH
JCI insight 2017 May 18;2(10)
JCI insight 2017 May 18;2(10)
Human umbilical cord mesenchymal stem cells improve the reserve function of perimenopausal ovary via a paracrine mechanism.
Li J, Mao Q, He J, She H, Zhang Z, Yin C
Stem cell research & therapy 2017 Mar 9;8(1):55
Stem cell research & therapy 2017 Mar 9;8(1):55
A therapeutic T cell receptor mimic antibody targets tumor-associated PRAME peptide/HLA-I antigens.
Chang AY, Dao T, Gejman RS, Jarvis CA, Scott A, Dubrovsky L, Mathias MD, Korontsvit T, Zakhaleva V, Curcio M, Hendrickson RC, Liu C, Scheinberg DA
The Journal of clinical investigation 2017 Jun 30;127(7):2705-2718
The Journal of clinical investigation 2017 Jun 30;127(7):2705-2718
Toll-like receptor 3 activation selectively reverses HIV latency in microglial cells.
Alvarez-Carbonell D, Garcia-Mesa Y, Milne S, Das B, Dobrowolski C, Rojas R, Karn J
Retrovirology 2017 Feb 6;14(1):9
Retrovirology 2017 Feb 6;14(1):9
Dextran-based therapeutic nanoparticles for hepatic drug delivery.
Foerster F, Bamberger D, Schupp J, Weilbächer M, Kaps L, Strobl S, Radi L, Diken M, Strand D, Tuettenberg A, Wich PR, Schuppan D
Nanomedicine (London, England) 2016 Oct;11(20):2663-2677
Nanomedicine (London, England) 2016 Oct;11(20):2663-2677
Pulmonary sarcoidosis is associated with high-level inducible co-stimulator (ICOS) expression on lung regulatory T cells--possible implications for the ICOS/ICOS-ligand axis in disease course and resolution.
Sakthivel P, Grunewald J, Eklund A, Bruder D, Wahlström J
Clinical and experimental immunology 2016 Feb;183(2):294-306
Clinical and experimental immunology 2016 Feb;183(2):294-306
Thrombomodulin regulates monocye differentiation via PKCδ and ERK1/2 pathway in vitro and in atherosclerotic artery.
Tsai CS, Lin YW, Huang CY, Shih CM, Tsai YT, Tsao NW, Lin CS, Shih CC, Jeng H, Lin FY
Scientific reports 2016 Dec 2;6:38421
Scientific reports 2016 Dec 2;6:38421
Investigating the causes for decreased levels of glutathione in individuals with type II diabetes.
Lagman M, Ly J, Saing T, Kaur Singh M, Vera Tudela E, Morris D, Chi PT, Ochoa C, Sathananthan A, Venketaraman V
PloS one 2015;10(3):e0118436
PloS one 2015;10(3):e0118436
Liposomal Glutathione Supplementation Restores TH1 Cytokine Response to Mycobacterium tuberculosis Infection in HIV-Infected Individuals.
Ly J, Lagman M, Saing T, Singh MK, Tudela EV, Morris D, Anderson J, Daliva J, Ochoa C, Patel N, Pearce D, Venketaraman V
Journal of interferon & cytokine research : the official journal of the International Society for Interferon and Cytokine Research 2015 Nov;35(11):875-87
Journal of interferon & cytokine research : the official journal of the International Society for Interferon and Cytokine Research 2015 Nov;35(11):875-87
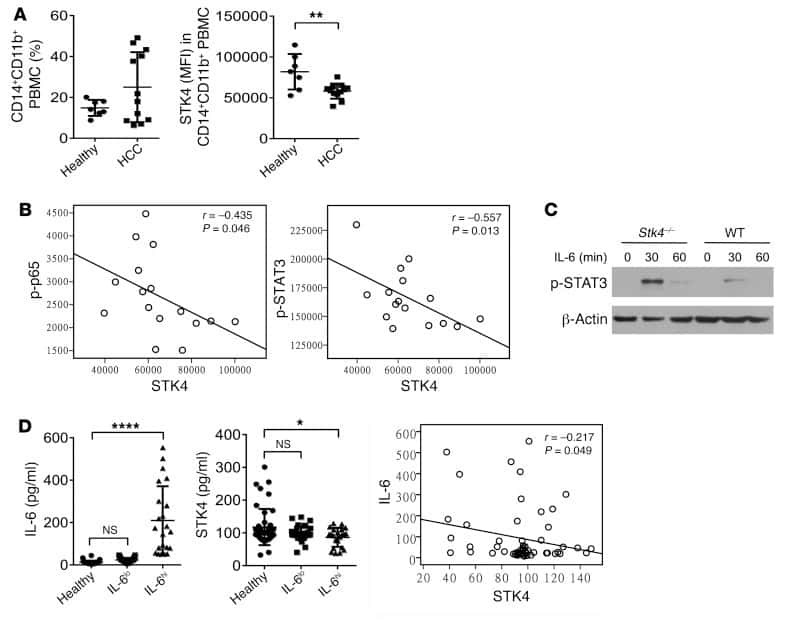
STK4 regulates TLR pathways and protects against chronic inflammation-related hepatocellular carcinoma.
Li W, Xiao J, Zhou X, Xu M, Hu C, Xu X, Lu Y, Liu C, Xue S, Nie L, Zhang H, Li Z, Zhang Y, Ji F, Hui L, Tao W, Wei B, Wang H
The Journal of clinical investigation 2015 Nov 2;125(11):4239-54
The Journal of clinical investigation 2015 Nov 2;125(11):4239-54
A novel antibody-drug conjugate targeting SAIL for the treatment of hematologic malignancies.
Kim SY, Theunissen JW, Balibalos J, Liao-Chan S, Babcock MC, Wong T, Cairns B, Gonzalez D, van der Horst EH, Perez M, Levashova Z, Chinn L, D'Alessio JA, Flory M, Bermudez A, Jackson DY, Ha E, Monteon J, Bruhns MF, Chen G, Migone TS
Blood cancer journal 2015 May 29;5(5):e316
Blood cancer journal 2015 May 29;5(5):e316
Biologically active polymers from spontaneous carotenoid oxidation: a new frontier in carotenoid activity.
Johnston JB, Nickerson JG, Daroszewski J, Mogg TJ, Burton GW
PloS one 2014;9(10):e111346
PloS one 2014;9(10):e111346
The role of transforming growth factor β signaling in fibroblast-like synoviocytes from patients with oligoarticular juvenile idiopathic arthritis: dysregulation of transforming growth factor β signaling, including overexpression of bone morphogenetic protein 4, may lead to a chondrocyte phenotype and may contribute to bony hypertrophy.
Brescia AC, Simonds MM, McCahan SM, Fawcett PT, Rose CD
Arthritis & rheumatology (Hoboken, N.J.) 2014 May;66(5):1352-62
Arthritis & rheumatology (Hoboken, N.J.) 2014 May;66(5):1352-62
Human mesenchymal stem cells possess different biological characteristics but do not change their therapeutic potential when cultured in serum free medium.
Wang Y, Wu H, Yang Z, Chi Y, Meng L, Mao A, Yan S, Hu S, Zhang J, Zhang Y, Yu W, Ma Y, Li T, Cheng Y, Wang Y, Wang S, Liu J, Han J, Li C, Liu L, Xu J, Han ZB, Han ZC
Stem cell research & therapy 2014 Dec 4;5(6):132
Stem cell research & therapy 2014 Dec 4;5(6):132
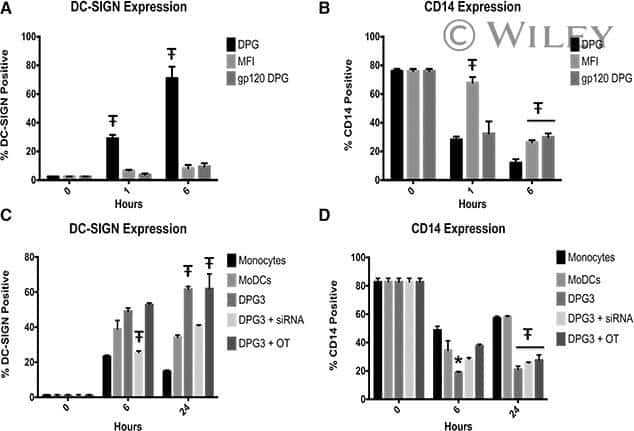
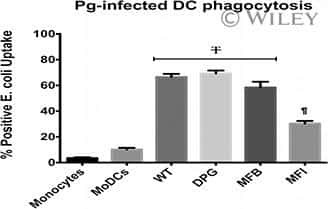
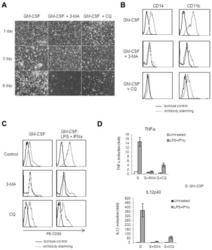
Noncanonical dendritic cell differentiation and survival driven by a bacteremic pathogen.
Miles B, Scisci E, Carrion J, Sabino GJ, Genco CA, Cutler CW
Journal of leukocyte biology 2013 Aug;94(2):281-9
Journal of leukocyte biology 2013 Aug;94(2):281-9
Ulcerative colitis impairs the acylethanolamide-based anti-inflammatory system reversal by 5-aminosalicylic acid and glucocorticoids.
Suárez J, Romero-Zerbo Y, Márquez L, Rivera P, Iglesias M, Bermúdez-Silva FJ, Andreu M, Rodríguez de Fonseca F
PloS one 2012;7(5):e37729
PloS one 2012;7(5):e37729
Negative regulation of JAK2 by H3K9 methyltransferase G9a in leukemia.
Son HJ, Kim JY, Hahn Y, Seo SB
Molecular and cellular biology 2012 Sep;32(18):3681-94
Molecular and cellular biology 2012 Sep;32(18):3681-94
Induction of autophagy is essential for monocyte-macrophage differentiation.
Zhang Y, Morgan MJ, Chen K, Choksi S, Liu ZG
Blood 2012 Mar 22;119(12):2895-905
Blood 2012 Mar 22;119(12):2895-905
Upregulation of programmed death-1 on T cells and programmed death ligand-1 on monocytes in septic shock patients.
Zhang Y, Li J, Lou J, Zhou Y, Bo L, Zhu J, Zhu K, Wan X, Cai Z, Deng X
Critical care (London, England) 2011;15(1):R70
Critical care (London, England) 2011;15(1):R70
Ro60-associated single-stranded RNA links inflammation with fetal cardiac fibrosis via ligation of TLRs: a novel pathway to autoimmune-associated heart block.
Clancy RM, Alvarez D, Komissarova E, Barrat FJ, Swartz J, Buyon JP
Journal of immunology (Baltimore, Md. : 1950) 2010 Feb 15;184(4):2148-55
Journal of immunology (Baltimore, Md. : 1950) 2010 Feb 15;184(4):2148-55
B cells and monocytes from patients with active multiple sclerosis exhibit increased surface expression of both HERV-H Env and HERV-W Env, accompanied by increased seroreactivity.
Brudek T, Christensen T, Aagaard L, Petersen T, Hansen HJ, Møller-Larsen A
Retrovirology 2009 Nov 16;6:104
Retrovirology 2009 Nov 16;6:104
No comments: Submit comment
Supportive validation
- Submitted by
- Invitrogen Antibodies (provider)
- Main image
- Experimental details
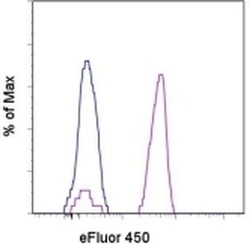
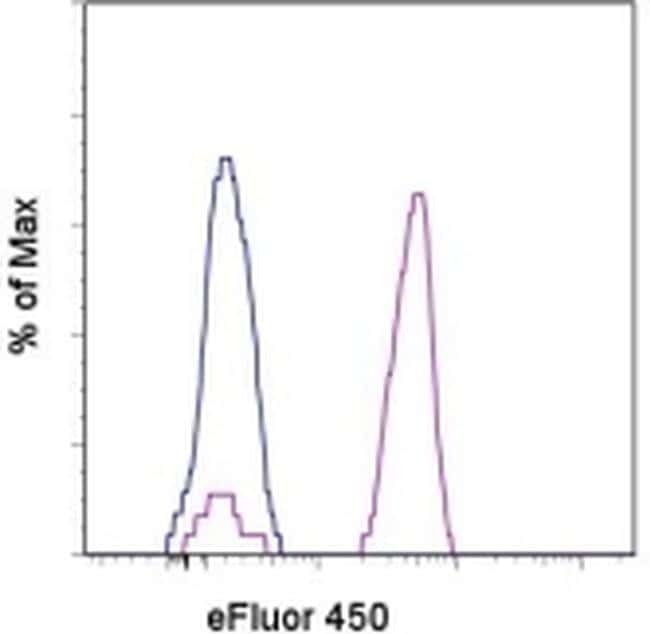
- Staining of normal human peripheral blood cells with Mouse IgG1 K Isotype Control eFluor® 450 (Product # 48-4714-82) (blue histogram) or Anti-Human CD14 eFluor® 450 (purple histogram). Cells in the monocyte gate were used for analysis.
- Submitted by
- Invitrogen Antibodies (provider)
- Main image

- Experimental details
- Staining of normal human peripheral blood cells with Mouse IgG1 K Isotype Control eFluor® 450 (Product # 48-4714-82) (blue histogram) or Anti-Human CD14 eFluor® 450 (purple histogram). Cells in the monocyte gate were used for analysis.

Supportive validation
- Submitted by
- Invitrogen Antibodies (provider)
- Main image
- Experimental details
- NULL
- Submitted by
- Invitrogen Antibodies (provider)
- Main image

- Experimental details
- NULL
- Submitted by
- Invitrogen Antibodies (provider)
- Main image

- Experimental details
- NULL
- Submitted by
- Invitrogen Antibodies (provider)
- Main image
- Experimental details
- NULL

- Submitted by
- Invitrogen Antibodies (provider)
- Main image
- Experimental details
- NULL
- Submitted by
- Invitrogen Antibodies (provider)
- Main image
- Experimental details
- NULL

- Submitted by
- Invitrogen Antibodies (provider)
- Main image
- Experimental details
- NULL
- Submitted by
- Invitrogen Antibodies (provider)
- Main image

- Experimental details
- NULL
- Submitted by
- Invitrogen Antibodies (provider)
- Main image

- Experimental details
- NULL
- Submitted by
- Invitrogen Antibodies (provider)
- Main image
- Experimental details
- NULL

- Submitted by
- Invitrogen Antibodies (provider)
- Main image
- Experimental details
- NULL
- Submitted by
- Invitrogen Antibodies (provider)
- Main image

- Experimental details
- NULL
- Submitted by
- Invitrogen Antibodies (provider)
- Main image
- Experimental details
- NULL
- Submitted by
- Invitrogen Antibodies (provider)
- Main image
- Experimental details
- NULL

- Submitted by
- Invitrogen Antibodies (provider)
- Main image
- Experimental details
- NULL

- Submitted by
- Invitrogen Antibodies (provider)
- Main image
- Experimental details
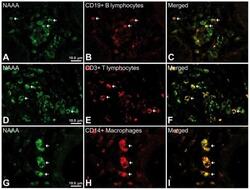
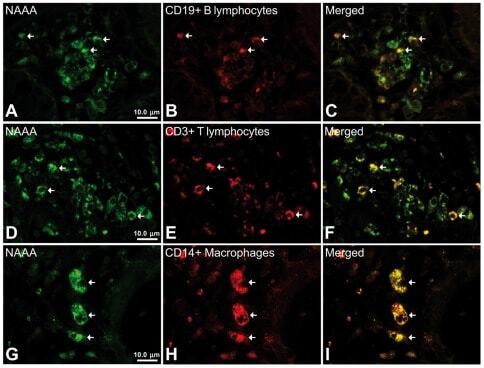
- Figure 6 Representative high-magnification photomicrographs showing double immunofluorescence for NAAA, CD19, CD3 and CD14 in order to characterize the immune cells in the mucosa infiltrate of UC patients. NAAA immunofluorescence was observed in CD19+ B lymphocytes (A-C), CD3+ T lymphocytes (D-F) and CD14+ macrophages (G-I).
- Submitted by
- Invitrogen Antibodies (provider)
- Main image
- Experimental details
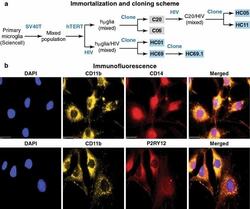
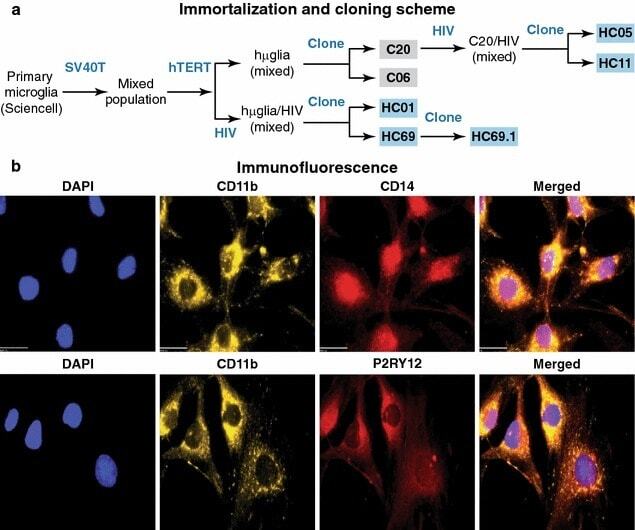
- Fig. 1 Isolation and characterization of huglia/HIV (HC69) cells. a Schematic representation of a typical procedure to develop a microglia/HIV clonal cell population such as huglia/HIV (HC69) cells. Uninfected clonal populations are indicated in grey boxes , and latently-infected clonal populations are indicated in blue boxes . b Immunofluorescence analysis of the human microglial cells huglia/HIV (HC01). Cells were cultured, fixed, and immunostained with either anti-CD11b ( green ), anti-CD14 ( red ) or anti-P2RY12 ( red ) conjugated antibodies. Nuclei were stained with DAPI ( blue ). Merged images of nuclei, CD11b and CD14, or nuclei, CD11b and P2RY12 are indicated
- Submitted by
- Invitrogen Antibodies (provider)
- Main image

- Experimental details
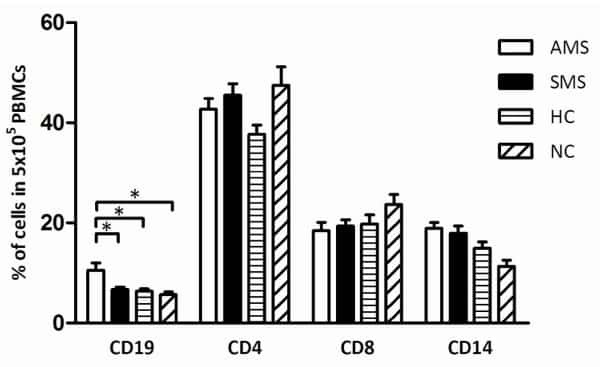
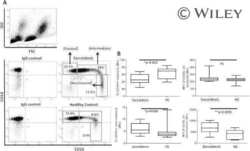
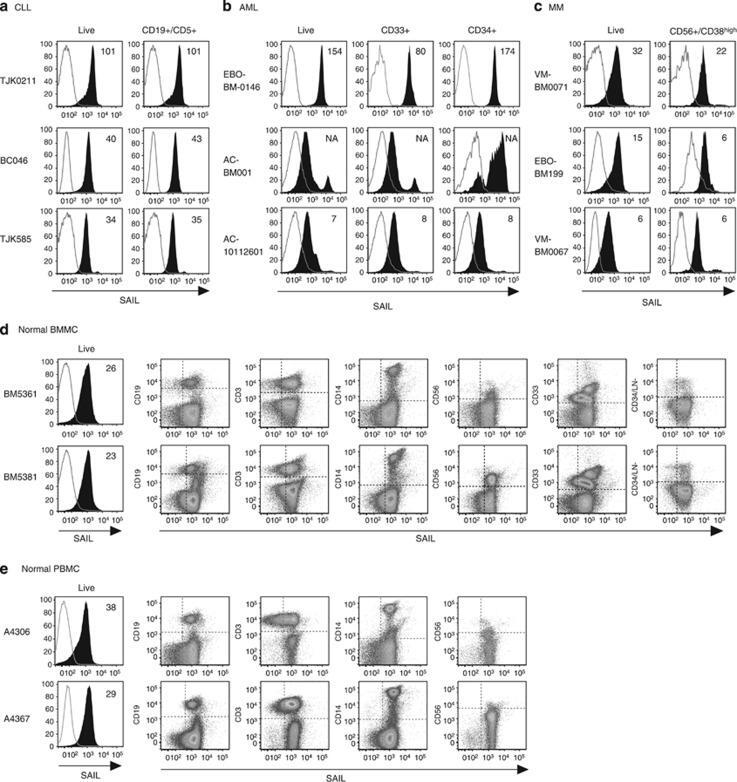
- Figure 2 Cell surface expression of SAIL in CLL, AML and MM patient samples and normal BMMC and PBMC controls. ( a ) Three CLL specimens analyzed by flow cytometry. CLL cells were identified as CD19/CD5 double-positive cells. The histograms present SAIL (filled) and isotype control (open) staining in the live-cell and the CLL population. ( b ) Flow cytometry analysis of three AML specimens. SAIL expression is assessed in live-cells, CD33-positive and CD34-positive cells. ( c ) Flow cytometry analysis of three MM specimens. CD38 high cells with CD56 expression were gated for MM cells. SAIL expression is assessed in the live-cell and the MM population. ( d and e ) Flow cytometry analysis of SAIL expression in BMMC ( d ) and PBMC ( e ) via co-staining with CD19, CD3, CD14, CD56, CD33, CD34 and a cocktail of lineage (LN) markers. Numbers in histograms are median-fluorescence-intensity fold-change values relative to the isotype control. Three and two representative examples are shown for the tumor and normal samples, respectively.
- Submitted by
- Invitrogen Antibodies (provider)
- Main image
- Experimental details
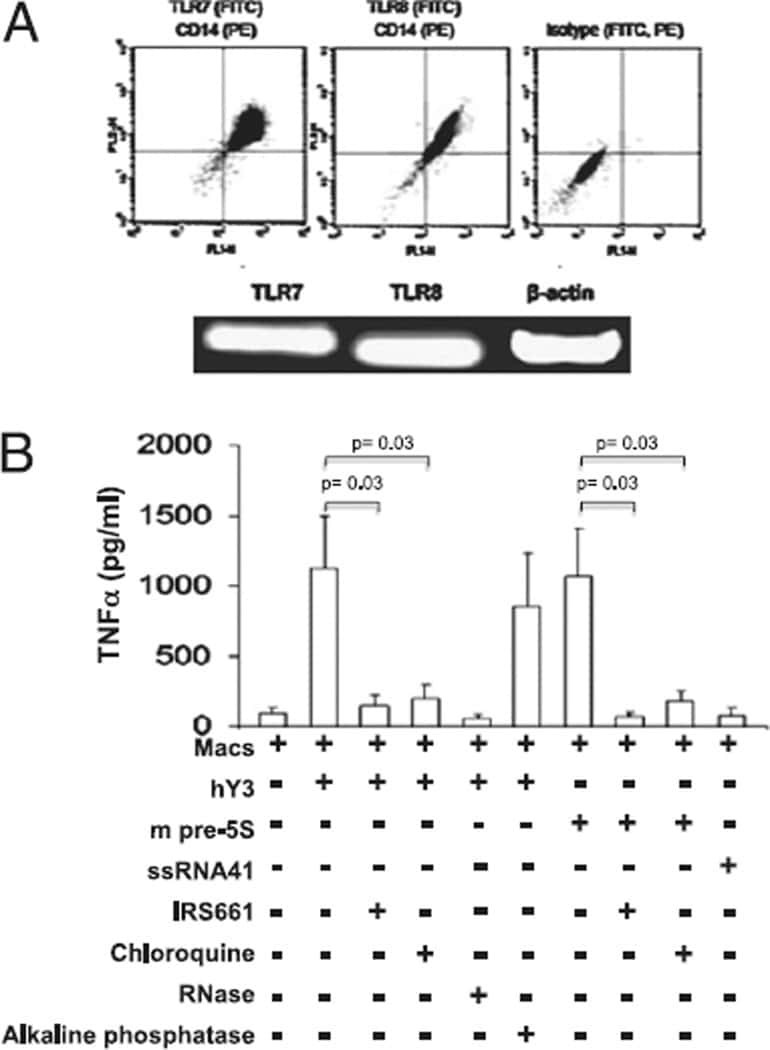
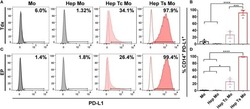
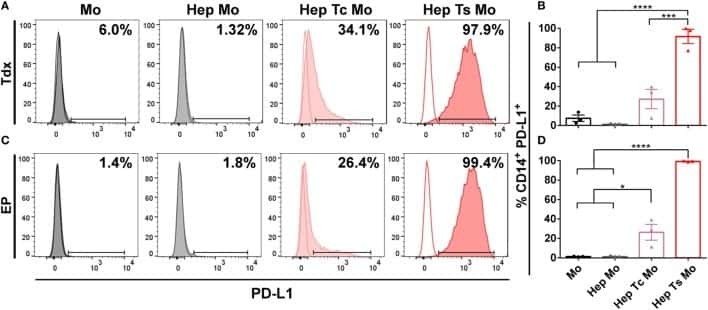
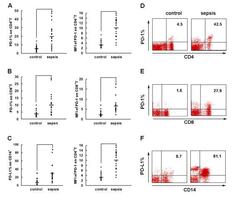
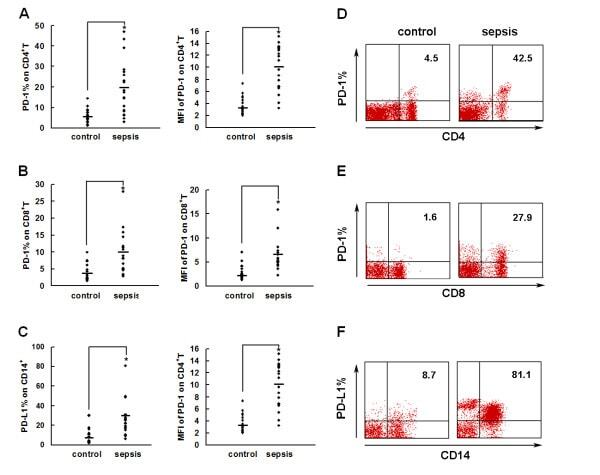
- Figure 2 PD-1 and PD-L1 were upregulated on T cells and monocytes in septic shock patients . Blood samples were obtained from 19 septic shock patients and 22 healthy controls and were stained for programmed death-1 (PD-1) and programmed death ligand-1 (PD-L1) gated on CD4 + T cells, CD8 + T cells, and CD14 + monocytes. (a) to (c) Percentage of PD-1 expression on (a) CD4 + T cells and (b) CD8 + T cells, and (c) percentage of PD-L1 expression on CD14 + monocytes. Each dot represents one individual. Data are mean +- standard error of the mean (SEM) of three independent experiments. ** P < 0.01 compared with healthy controls. (d) to (f) Mean fluorescence intensity (relative fluorescence units) of PD-1 expression on (d) CD4 + T cells, (e) PD-1 expression on CD8 + T cells, and (f) PD-L1 expression on CD14 + monocytes Each dot represents one individual. Data are mean +- SEM of three independent experiments. * P < 0.05 compared with healthy controls. (g) Representative PD-1 expression levels on CD4 + T cells and CD8 + T cells, and PD-L1 expression on CD14 + monocytes. Values in the upper-right quadrant indicate the percentage of cells that express PD-1 or PD-L1.
- Submitted by
- Invitrogen Antibodies (provider)
- Main image

- Experimental details
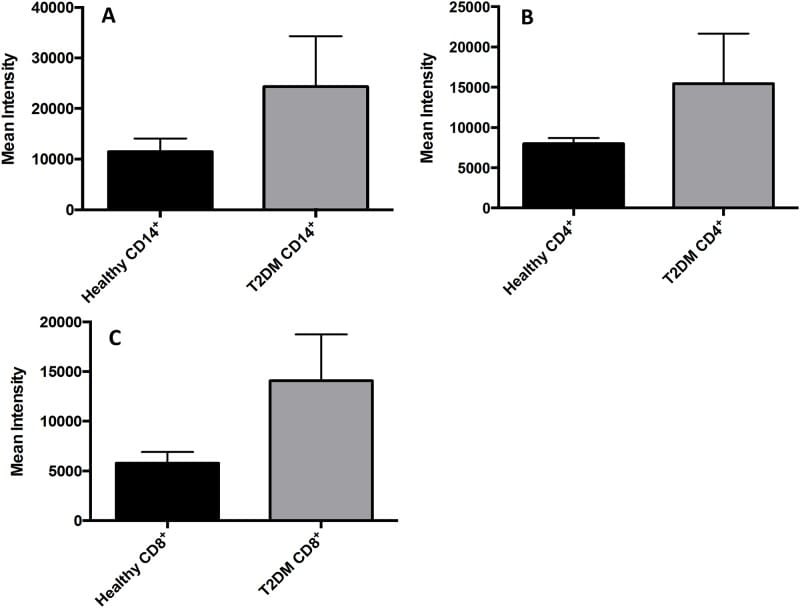
- Fig 7 Measurement of ROS in CD14 + cells, CD4 + T-cells, and CD8 + T-cells by cellROX stain mean intensity in T2DM patients compared to healthy. CD14 + cells were stained with cellROX green reagent, a marker of ROS, and a CD14 cell marker, CD14-PE. CD14 + -ROX + cells' mean intensity was analyzed by FLOW cytometry. There was an observable increase in ROX mean intensity in CD14 + cells isolated from individuals with T2DM compared to healthy volunteers (Fig. 7A). CD4 + cells were also stained with cellROX green reagent and a CD4 cell marker, CD4-Cy5. CD4 + -ROX + cells' mean intensity was analyzed by FLOW cytometry. There was an observable increase in ROX mean intensity in CD4 + T-cells isolated from individuals with T2DM compared to healthy volunteers (Fig. 7B). CD8 + cells were stained with cellROX green reagent and a CD8 cell marker, CD8-Cy5. CD8 + -ROX + cells' mean intensity was analyzed by FLOW cytometry. There was an observable increase in ROX mean intensity in CD8 + T-cells isolated from individuals with T2DM compared to healthy volunteers (Fig. 7C). Data represents mean +-SE from 5 healthy individuals and 5 individuals with T2DM.
- Submitted by
- Invitrogen Antibodies (provider)
- Main image
- Experimental details
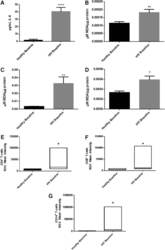
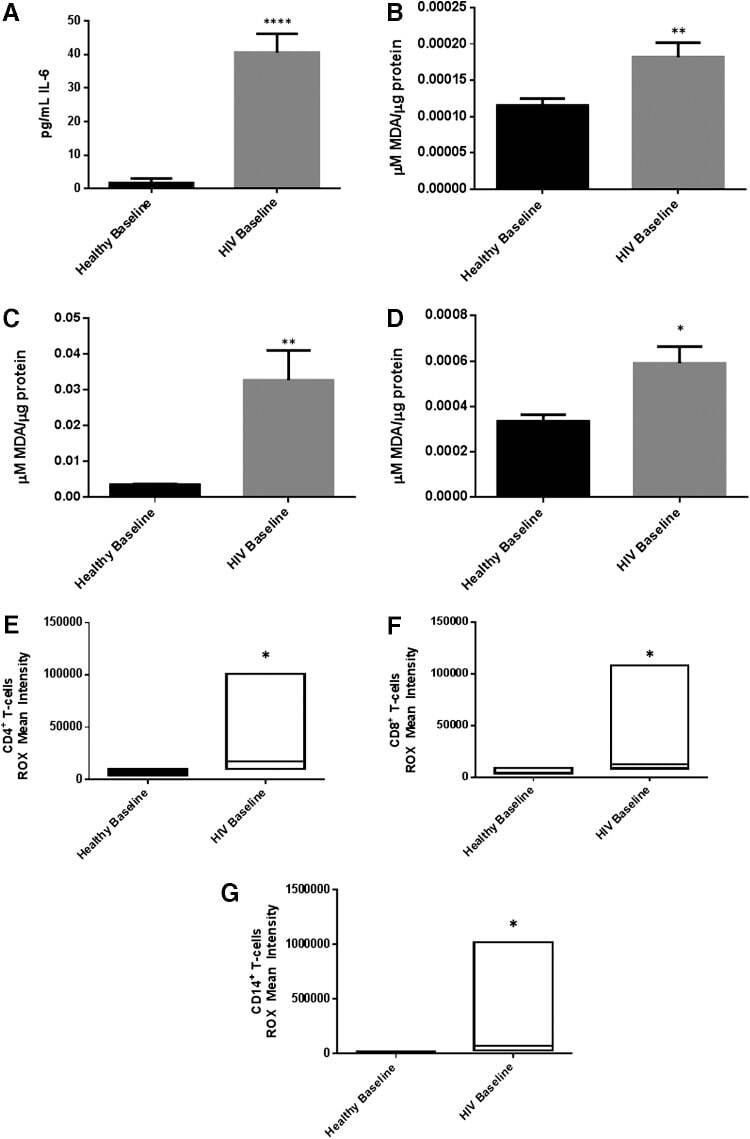
- FIG. 2. Baseline comparison of the interleukin-6 (IL-6) and reactive oxygen species (ROS) markers between healthy volunteers and HIV-positive individuals. We observed a significant increase in the levels of the proinflammatory cytokine, IL-6 in plasma samples collected from individuals with HIV infection compared to healthy individuals (A) . Data represent mean+-SE from comparing baseline levels of 10 healthy volunteers and 15 HIV-positive individuals, **** P
- Submitted by
- Invitrogen Antibodies (provider)
- Main image
- Experimental details
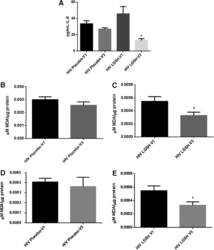
- FIG. 6. Difference in plasma IL-6 levels and ROS markers pre- and post-GSH supplementation. Sandwich ELISA was performed to compare the cytokine levels between pre-supplementation (V1) and post-supplementation (V3). Assay of cytokines showed a significant decrease in the levels of IL-6 in plasma samples collected from the lGSH-treatment group. There was no significant difference between the levels of IL-6 from the placebo group when comparing visit 1 and visit 3 (A) . Data represent mean+-SE, * P

- Submitted by
- Invitrogen Antibodies (provider)
- Main image
- Experimental details
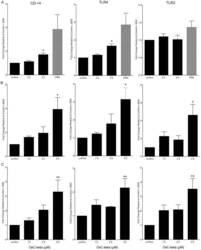
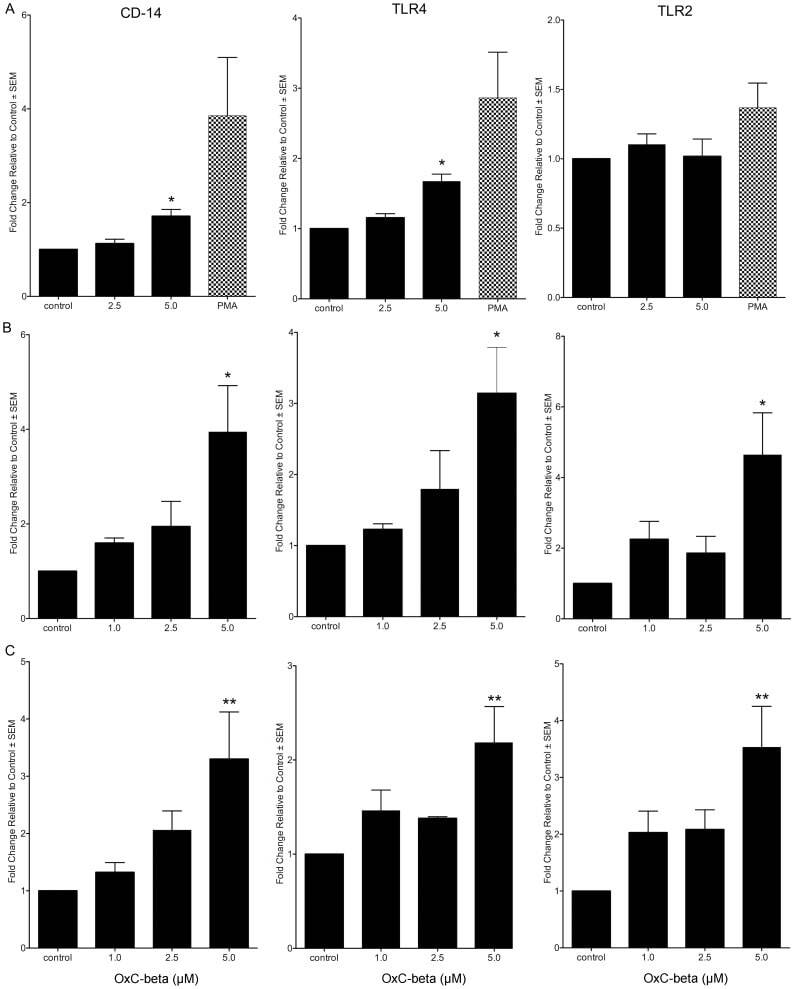
- Figure 1 Effect of OxC-beta on CD14, TLR-4, and TLR-2 levels in vitro . Human THP-1 monocytes (A), fibroblasts (B), and endothelial cells (C), were treated with the indicated concentrations of OxC-beta or vehicle control (DMSO) for 24 hours. Immune receptor content was measured 24 hours post-treatment by FACS analysis. OxC-beta-induced increase in receptor level was assessed relative to untreated control cells using a one-way analysis of variance with Tukey's post test for multiple comparisons. DMSO had no effect on receptor level (result not shown). Phorbol myristate acetate (PMA) was used as a positive control in experiments with THP-1 cells (hatched bars).
- Submitted by
- Invitrogen Antibodies (provider)
- Main image
- Experimental details
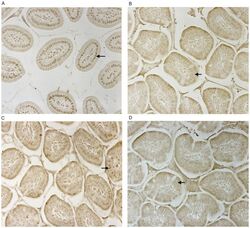
- Figure 2 CD14 and TLR-4 staining in gut epithelial cells. Balb/c mice were not supplemented (control) or supplemented daily by oral gavage with OxC-beta (10 mg/kg). After 4 weeks, intestinal tissues were harvested and CD14 and TLR-4 expression was determined by immunocytochemistry. Increased CD14 (A) and TLR-4 (C) expression is readily apparent in epithelial cells in the OxC-beta-supplemented animals compared to the controls receiving vehicle alone (B and D, respectively). Arrows indicate the location of enterocytes within the cross section of microvilli. Magnification 40x.

- Submitted by
- Invitrogen Antibodies (provider)
- Main image
- Experimental details
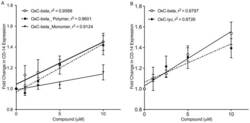
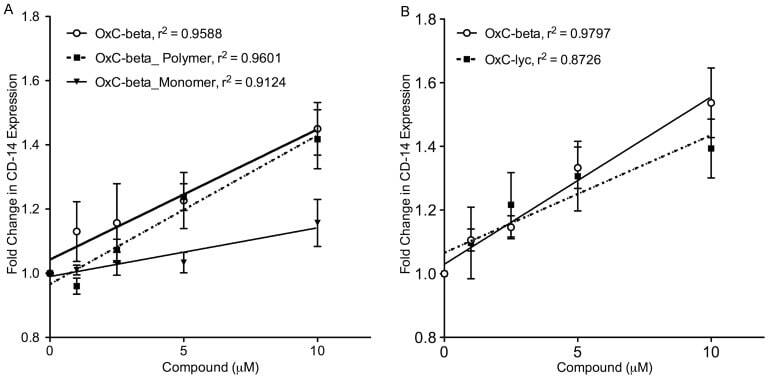
- Figure 5 Determination of activities relative to OxC-beta of (A) OxC-beta polymer and monomer fractions, and (B) oxidized lycopene (OxC-lyc), using a CD14 receptor expression assay. THP-1 cells were treated for 24 hours with the indicated concentrations of compounds. CD14 expression was quantified using FACS analysis. The effect of each compound is shown relative to untreated cells. Points represent the mean and standard error from three separate experiments. (A) Correlation analysis indicates a significant dose effect for each compound on CD14 expression with p-values of 0.0036 for OxC-beta, 0.0034 for the polymer, and 0.0113 for the monomer. Comparison of the relative activity of each compound indicates that the monomer is significantly less active than the polymer (p
- Submitted by
- Invitrogen Antibodies (provider)
- Main image
- Experimental details
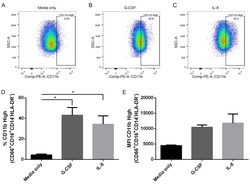
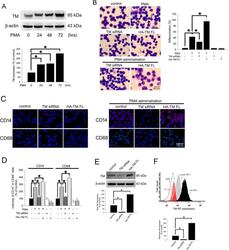
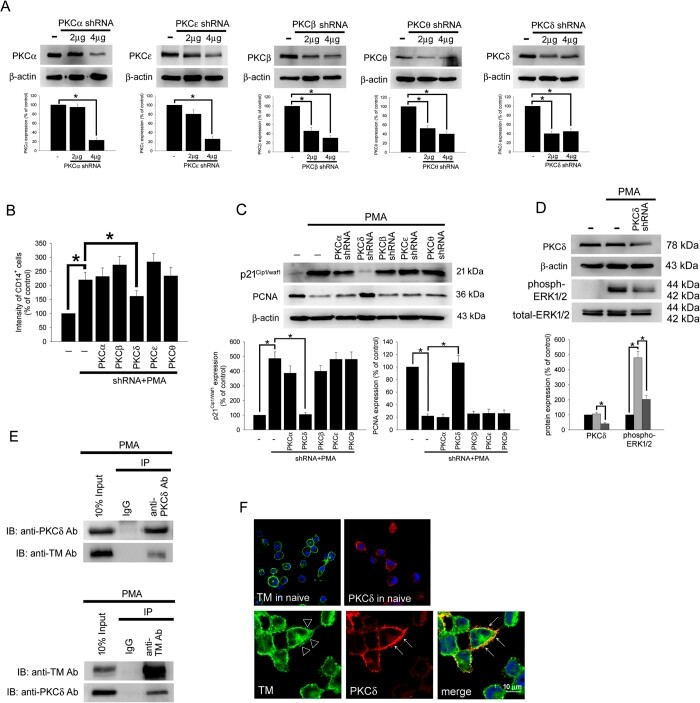
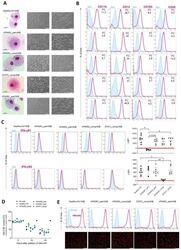
- Figure 1 PMA-induced TM expression mediates morphological changes and differentiation marker expression in THP-1 cells. ( A ) THP-1 cells were treated with 150 nM PMA for 24-72 hours. The total cell lysates were harvested, and the expression of TM was analyzed using western blot analysis. beta-actin was used as a loading control. Five independent experiments have been performed (n = 5) and representative images have been showed. The amount of proteins expression was quantified using densitometry and presented as bar graph. The data are presented as the mean +- SD (n = 5), and * p < 0.05 was considered significant. ( B ) THP-1 cells were transfected with TM siRNA or HA-TM FL plasmid for 24 h followed by PMA stimulation for 72 hours. The morphology of the cells was observed using light microscopy. The adherent differentiated macrophage-like cells are indicated by a white arrowhead. Five independent experiments have been performed (n = 5). The quantification is shown in the right graph. ( C ) The expression of the macrophage cell surface markers CD14 (red) and CD68 (green) was analyzed using immunofluorescence and microscopy. Hoechst staining was used to label the nuclei. The scale bar indicates 100 mum. Five independent experiments have been performed (n = 5), and showed representative images. ( D ) The expression of CD14 and CD68 was analyzed using flow cytometry. Data are expressed as a % of the control, are presented as the mean +- SD and represent the results of three indep

- Submitted by
- Invitrogen Antibodies (provider)
- Main image

- Experimental details
- Figure 4 TM regulates THP-1 cell differentiation via the PKCdelta-ERK1/2 signaling pathway. ( A ) THP-1 cells were transfected with 2 or 4 mug of PKCalpha, PKCbeta, PKCdelta, PKCepsilon, or PKCtheta shRNA for 24 h. Total cell lysates were purified, and knockdown efficiency was assayed using western blot analysis. ( B ) The THP-1 cells were knocked down by PKCalpha, PKCbeta, PKCdelta, PKCepsilon, and PKCtheta shRNAs for 24 h followed by PMA stimulation for 72 hours. The number of CD14 + cells was scored using flow cytometry. Data are expressed as a % of the control, are presented as the mean +- SD and represent the results of five independent experiments (n = 5, * p < 0.05 was considered significant). ( C ) Different sets of THP-1 cells were transfected with 4 mug of each shRNA for 24 h followed by PMA stimulation for 72 hours. The levels of p21 Cip1/WAF1 and PCNA were analyzed using western blot analysis. ( D ) The THP-1 cells were knocked down by PKCdelta shRNA for 24 h followed by PMA stimulation for 72 hours. The level of PKCdelta and total and phosphorylated ERK1/2 was analyzed using western blot analysis. In western blot analysis, beta-actin and total-ERK1/2 were used as loading controls. The density of each band was quantified using densitometry and related protein expression was presented as bar graph. The data are presented as the mean +- SD, and * p < 0.05 was considered significant (n = 5). ( E ) Lysates of THP-1 cells with PMA stimulation were extracted. Left, immu
- Submitted by
- Invitrogen Antibodies (provider)
- Main image

- Experimental details
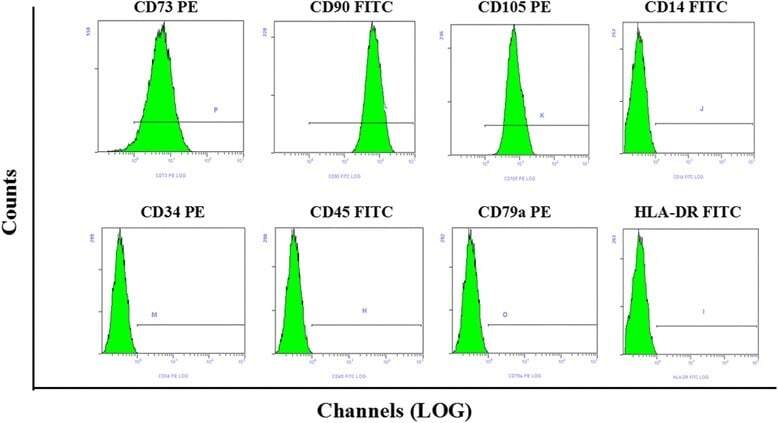
- Fig. 1 Flow cytometry analysis of phenotype characterization of hUCMSCs. Phenotype of CD73, CD90, CD105, CD14, CD34, CD45, CD79a and HLA-DR of hUCMSCs was detected by flow cytometry. Intensity >= 95% represented strong expression while
- Submitted by
- Invitrogen Antibodies (provider)
- Main image
- Experimental details
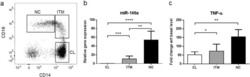
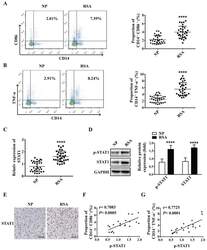
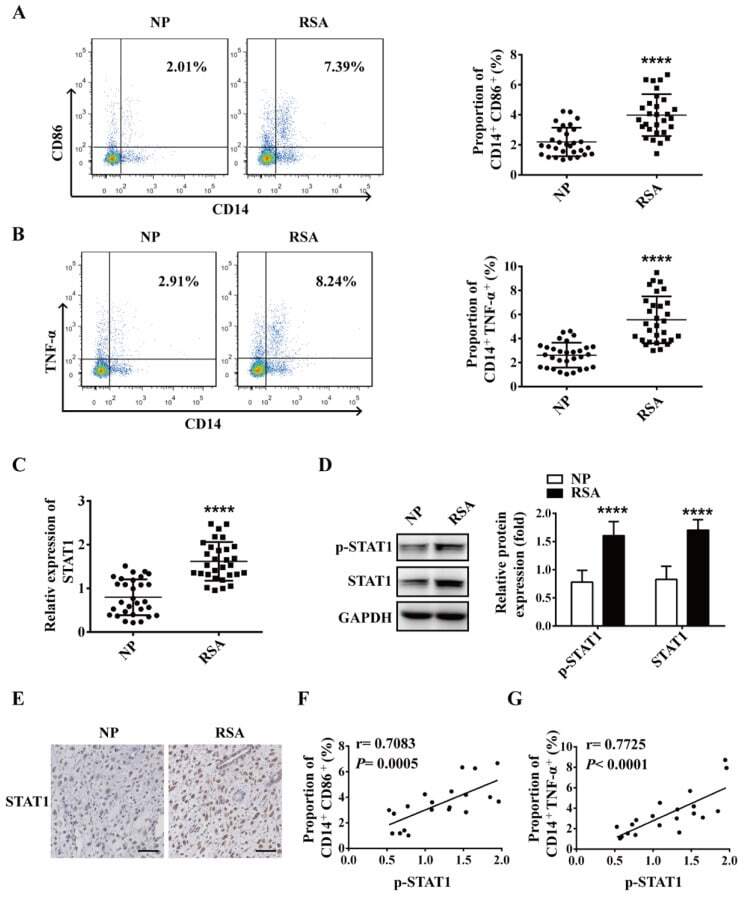
- Figure 1 M1 macrophage and STAT1 were excessive in RSA patients. ( A-B ) The dot plot represents labeling of CD14 + CD86 + and CD14 + TNFalpha + (M1) cells by flow cytometry in decidua of NP subjects (n= 30) and RSA patients (n= 30). ( C ) qRT-PCR analysis of STAT1 expression in the decidua of NP subjects (n= 30) and RSA patients (n= 30). ( D ) STAT1 and p-STAT1 protein levels were measured in decidua of NP subjects (n= 10) and RSA patients (n= 10) by western blot. ( E ) Representative IHC staining images of STAT1 in the decidua of NP and RSA patients (Scale bar, 50 um, 200x). ( F ) Correlation between p-STAT1 and the proportion of CD14 + CD86 + in decidua of NP subjects (n= 10) and RSA patients (n= 10). ( G ) Correlation between p-STAT1 and the proportion of CD14 + TNF-alpha + in decidua of NP subjects (n= 10) and RSA patients (n= 10). Values were listed as the mean+- SEM. **** P < 0.0001.
- Submitted by
- Invitrogen Antibodies (provider)
- Main image
- Experimental details
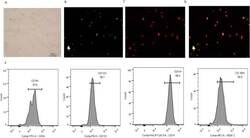
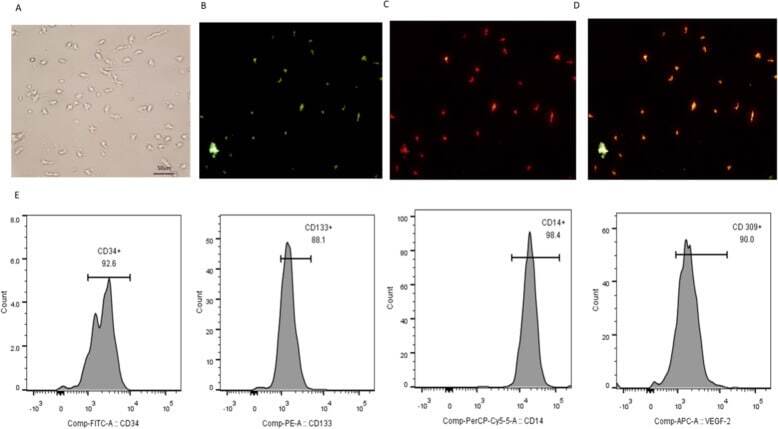
- Fig. 1 Identification of EPCs. a Adherent cells grew in a blood island manner. Fluorescent staining of EPCs. b Adherent cells took up UEA-1-lectin. c Adherent cells took up Dil-Ac-LDL. d Adherent cells took up UEA-1-lectin and Dil-Ac-LDL. E. Surface molecular markers of EPCs. Adherent cells expressed CD34, CD133, CD14 and VEGFR-2. All experiments involving cell culture studies were repeated three times with three replicates per experiment
- Submitted by
- Invitrogen Antibodies (provider)
- Main image
- Experimental details
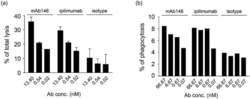
- 10.1080/19420862.2020.1725365-F0003 Figure 3. Antibody-dependent cellular cytotoxicity (ADCC) (a) and antibody-dependent cellular phagocytosis (ADCP) (b) of the antibodies against CTLA-4. (a) Human CTLA4-expressing 293F cells were added to 96-well plates at 1 x 10 4 cells/well, and then the antibodies pre-incubated with 5 x 10 5 PBMCs were added. The plates were kept at 37degC in a 5% CO 2 incubator for 4 h. Lysis of the target cells was determined by the introduction of DELFIA(r) EuTDA Cytotoxicity Reagents. (b) Human macrophage cells were mixed at 1:1 ratio with CFSE-dyed engineered human CTLA-4 expressing 293F cells in 96-well plates, then antibodies were added and incubated with cells at 37degC in a 5% CO 2 incubator for 3 h. After wash, APC-labeled anti-human CD14 antibody was added for flow cytometry detection.

- Submitted by
- Invitrogen Antibodies (provider)
- Main image
- Experimental details
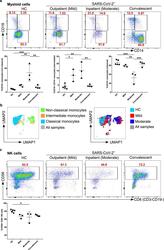
- Figure 2 Comparison of monocytes and NK cell percentage amongst study groups. A. The stained PBMCs were gated on the monocyte population and CD3 + CD19 + cells were excluded. Cell populations are displayed for CD16 and CD14 expression (upper FACS panel). One exemplary dot plot is shown per study group. The bar diagrams (lower panel) show the non-classical (CD16 + CD14 - ), intermediate (CD16 + CD14 + ) and classical (CD16 - CD14 + ) monocytes. *P-value
- Submitted by
- Invitrogen Antibodies (provider)
- Main image
- Experimental details
- Fig. 4 GAPDH exposed on apoptotic cells and phagocyte CD14 mediate efferocytosis. A Co-localization of apoptotic cell surface GAPDH with CD14 on phagocyte. When cells were incubated together the two signals co-localize at points of intercellular contact. Scale bar, 5 mum. B Co-immunoprecipitation (Co-IP) of GAPDH from mixed membrane fractions of apoptotic cells (J774) and phagocytes (THP-1). Right side panels are Western blots of membrane fractions as positive control for both antibodies. C Western blot to confirm the CD14 K/D in THP-1 cells. Cell lysates were prepared from THP-1 empty vector and CD14 knockdown cells and samples were run on 10% SDS-PAGE. Separated proteins were transblotted onto PVDF membrane and probed with mouse anti-CD14 antibody (Abcam) followed by secondary antibody anti-mouse peroxidase (Sigma). D - E Phagocytosis of apoptotic cells is dependent upon both GAPDH on apoptotic cell surface and CD14 on phagocytes. D Representative confocal microscopy images of live and apoptotic J774 cells that were phagocytosed by THP-1 phagocytes. Live cells, apoptotic empty vector, and GAPDH K/D J774 cells are labeled with Vybrant DiD dye (Red). Phagocyte THP-1 cells, empty vector, and CD14 K/D cells are labeled with CFSE (Green). Scale bar, 20 mum. E Bar graph represents phagocytosis as percentage of control (extent of phagocytosis by THP-1 empty vector cells incubated with J774 empty vector cells as 100%), *** P < 0.0001, n = 150 cells, also see Fig. S2C-D . F Disrupti
- Submitted by
- Invitrogen Antibodies (provider)
- Main image
- Experimental details
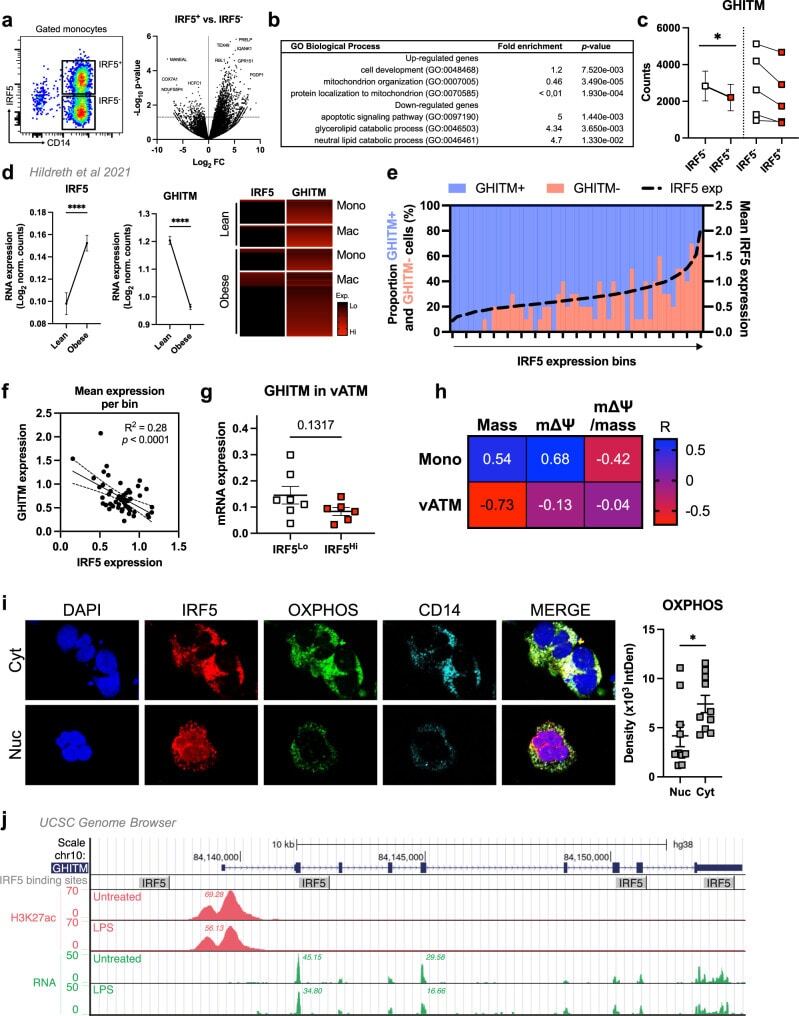
- Fig. 7 IRF5 binds to GHITM and regulates mitochondrial activity in human monocytes and adipose tissue macrophages. a CD14 + Monocytes from patients with type-2 diabetes (T2D; n = 5) were sorted based on expression of IRF5 for RNA-seq. Differential analyses were paired by patient and carried out on IRF5 + versus IRF5 - monocytes ( n = 5, Wald test p -value < 0.05). b Gene ontology (GO) term enrichment from upregulated and downregulated genes in IRF5 + versus IRF5 - monocytes. c Expression of Ghitm in IRF5 - and IRF5 + monocytes ( n = 5, * p = 0.039, two-tailed paired t -test). d Irf5 and Ghitm counts in white adipose tissue (WAT) macrophages and monocytes, from public dataset of scRNA-seq of the stromal vascular fraction (SVF) of patients that are lean or with obesity (two-tailed unpaired t -test, **** p < 0.0001). Heatmap of single-cell expression of Irf5 and Ghitm from monocytes (Mon) and macrophages (Mac), each line represents a single cell. e Proportion of Ghitm + (blue) and Ghitm- (red) cells in 10-cell bins by increasing Irf5 expression. f Correlation of Ghitm and Irf5 mean expression per bin (Pearson's correlation Pearson R 2 = 0.28, two-tailed p < 0.0001). g Ghitm expression in CD14 + human visceral adipose tissue macrophages (vATMs). Samples were stratified based on expression of Irf5 into IRF5 Lo versus IRF5 Hi expressors (IRF5 Lo n = 7 and IRF5 Hi n = 6, two-tailed unpaired t -test, p = 0.13). h Correlation of IRF5 MFI, JC1-Green (mitochondrial mass, Mt Mass), JC1-R
- Submitted by
- Invitrogen Antibodies (provider)
- Main image
- Experimental details
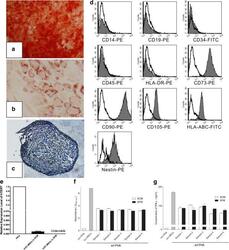
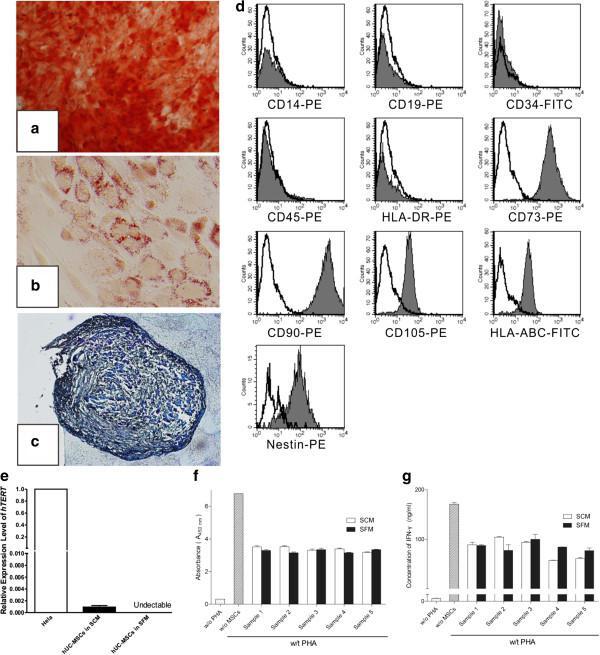
- Figure 2 Induced differentiation, flow cytometric and immunosuppressive ability analysis of human umbilical cord mesenchymal stem cells expanded in serum-free medium. After differentiation induction, (a) osteogenesis was confirmed by Alizarin Red (x40), (b) adipogenesis was stained by Oil Red O (x200) and (c) chondrogenesis was analyzed by Toluidine Blue (x100). (d) Serum-free medium (SFM)-expanded human umbilical cord mesenchymal stem cells (hUC-MSCs) at the 10th passage were labeled with antibodies against human antigens CD14-PE, CD19-PE, CD34-FITC, CD45-PE, CD73-PE, CD90-PE, CD105-PE, HLA-ABC-FITC, HLA-DR-PE and Nestin-PE. (e) Expression of hTERT in hUC-MSCs. Graph shows the level of hTERT transcripts of hUC-MSCs cultured in serum-containing medium (SCM) and SFM ( n = 5). Values presented as ratio of positive control (HeLa cells). Immunosuppressive ability of hUC-MSCs was evaluated by co-culturing with human peripheral blood mononuclear cells (hPBMCs). (f) Proliferation of hPBMCs was quantified based the measurement of BrdU incorporation during DNA synthesis. (g) Level of interferon gamma (IFN-gamma) in the supernatant was determined by ELISA.
- Submitted by
- Invitrogen Antibodies (provider)
- Main image
- Experimental details
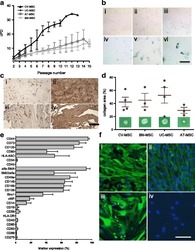
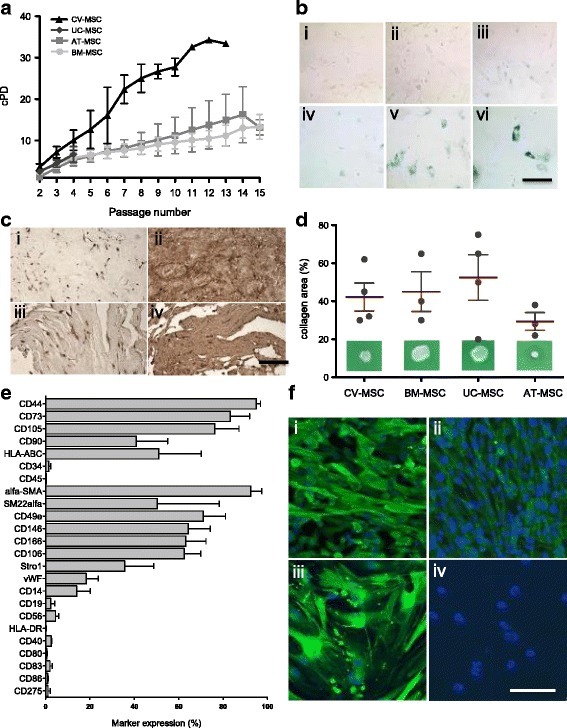
- Fig. 2 a Cumulative population-doubling (cPD) levels versus passage number for the four different sources of MSC. Black represents CV-MSC ( n = 7), dark gray UC-MSC ( n = 4), medium gray AT-MSC ( n = 5), and light gray BM-MSC ( n = 6). b IHC-based senescence-associated beta-galactosidase (SA-beta-gal) staining of CV-MSC in early (i, passage 4) and late (ii, passage 9) passages, AT-MSC in passage 6 (iii), BM-MSC in passage 6 (iv), and UC-MSC in passage 2 (v) and passage 4 (vi). Scale = 200 mum. c IHC of CV-MSC (i, ii) and BM-MSC (iii, iv) stained for osteopontin (i, iii) and fibronectin (ii, iv). Scale = 1 mm. d Collagen area (%) after collagen contraction assay for CV-MSC ( n = 4), BM-MSC ( n = 3), UC-MSC ( n = 4), and AT-MSC ( n = 3). Cells in passage 3 were used. Results expressed as mean +- SD, percentage of the total collagen area of the collagen gels without cells. e Surface marker expression of CV-MSC in early passages ( n = 5). Results expressed as mean +- SD (%). f Representative immunofluorescence of early passaged CV-MSC (i, iii) and BM-MSC (iii, iv) stained for SM22alpha (i, iii) and alpha-SMA (ii, iv). Scale = 50 mum. AT adipose tissue, BM bone marrow, CV chorionic villi, MSC mesenchymal stromal cells, UC umbilical cord
- Submitted by
- Invitrogen Antibodies (provider)
- Main image
- Experimental details
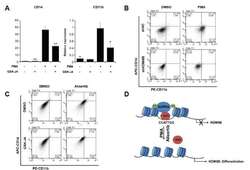
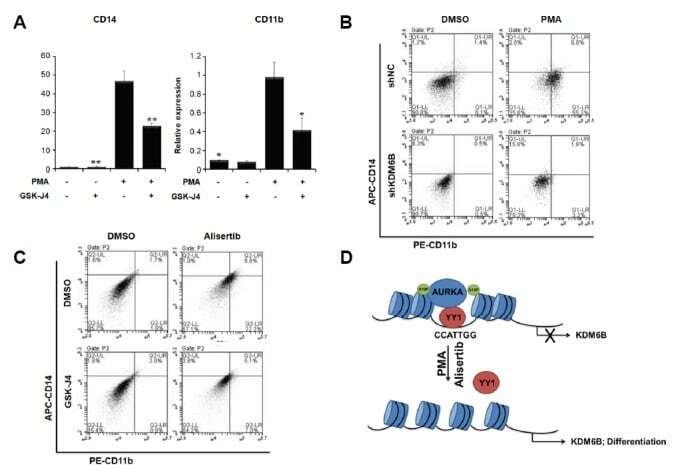
- Fig. 5 KDM6B promotes the differentiation of THP-1 cells (A) THP-1 cells were treated with 100 ng/ml PMA, 2 muM GSK-J4, or DMSO for 48 h. CD14 and CD11b expression levels were confirmed using qRT-PCR and normalized to GAPDH . Results are shown as mean +- SEM, n = 3; *p < 0.05, **p < 0.01. (B) We treated negative control (shNC)- and shKDM6B-transfected THP-1 cells with 100 ng/ml PMA for 48 h. The cells were stained with PE-CD11b and APC-CD14 antibodies. The percentage of cells in each quadrant is indicated in the figure. (C) We treated THP-1 cells with 2 muM GSK-J4 or 0.3 muM alisertib for 48 h. The cells were stained with PE-CD11b and APC-CD14 antibodies. The percentage of cells in each quadrant is indicated in the figure. (D) A model of AURKA regulating KDM6B expression in PMA-mediated THP-1 differentiation.
- Submitted by
- Invitrogen Antibodies (provider)
- Main image
- Experimental details
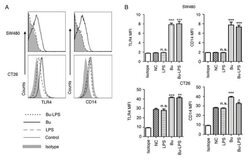
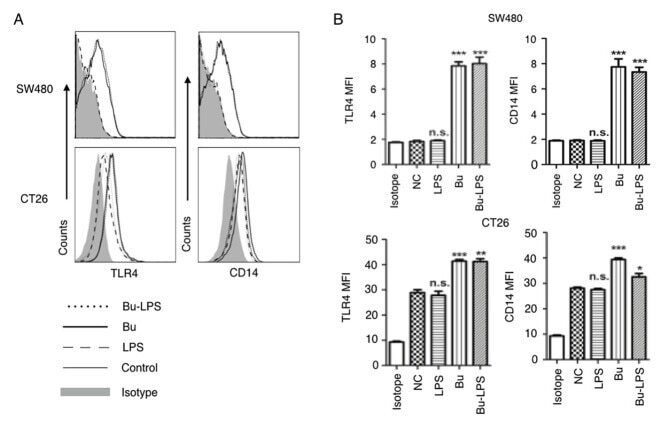
- Figure 4. Butyrate upregulates the levels of TLR4 and CD14 on colon cancer cells. The expression levels of TLR4 and CD14 on the membrane of SW480 cells and CT26 cells treated by butyrate and/or LPS were (A) analyzed using a flow cytometer, and (B) the MFI values of TLR4 and CD14 were quantitative analyzed. These experiments were repeated >=3 times, and representative graphs are presented. Compared with the NC group, *P
- Submitted by
- Invitrogen Antibodies (provider)
- Main image
- Experimental details
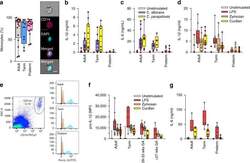
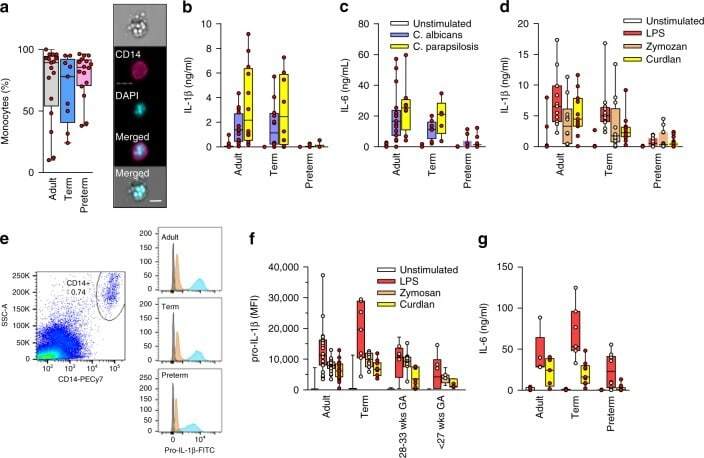
- Fig. 1 Responses to Candida spp . in neonatal immune cells. a Phagocytosis of Candida in monocytes (boxes and whiskers), including a representative flow microscopy diagram (white bar = ~10 um). Data pooled from multiple experiments over 14 months (9 to 17 subjects per age group; see Supplemental Data for clinical information on preterm subjects); b IL-1beta and c IL-6 response (blood mononuclear cells) to C. albicans or C. parapsilosis (24 h stimulation; 10 to 18 subjects per age group; boxes and whiskers); ( d ) IL-1beta (24 h; 11 to 21 subjects per age group; boxes and whiskers) and e representative gating for pro-IL-1beta (5 h LPS stimulation), gated on CD14-expressing cells (black = fluorescent-minus one control; orange = unstimulated; blue = LPS; representative preterm sample is from a 26 weeks' infant); f pro-IL-1beta (5 h) or g IL-6 (24 h) in response to LPS, zymosan or curdlan (mononuclear cells; 11 to 21 subjects per age group; boxes and whiskers); for b and c , data was pooled from multiple experiments assayed in four ELISA batches with similar distribution of samples per age group
- Submitted by
- Invitrogen Antibodies (provider)
- Main image

- Experimental details
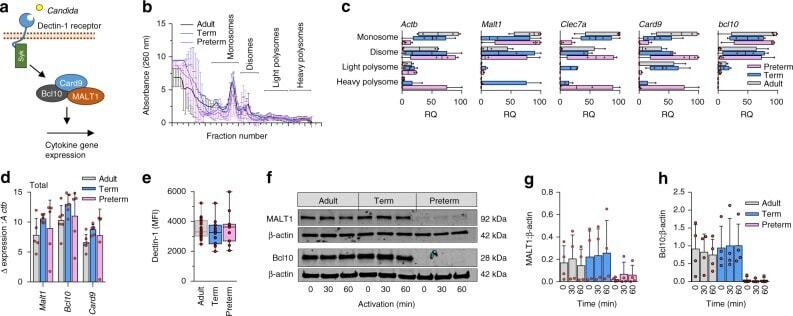
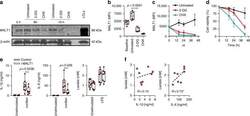
- Fig. 5 Gene expression and translation of dectin-1 signaling proteins. a Illustration of selected signaling molecules downstream of dectin-1; b Polysome profiles and c quantification of signalosome genes (qPCR) in monosome, disome, and light and heavy polysome fractions (monocytes). Data are from 4 subjects per age group (boxes and whiskers; RQ = relative quantification); d Quantification of signalosome genes (qPCR) in total RNA fractions (4 to 5 subjects/age group; mean +- SD); e Surface expression of dectin-1 (flow cytometry, mononuclear cells, gated on CD14-expressing cells; data pooled from 10 to 23 subjects per age group; boxes and whiskers); f Representative (cropped) Western blot of MALT1 and Bcl10 protein expression in monocytes after 0 to 60 min LPS stimulation. Representative blot is from a 29 weeks gestation sample. Images cropped from same blot probes with each antibody; cumulative quantification of 4 independent Western blot experiments for g MALT1 and h Bcl10 (mean +- SD)
- Submitted by
- Invitrogen Antibodies (provider)
- Main image
- Experimental details
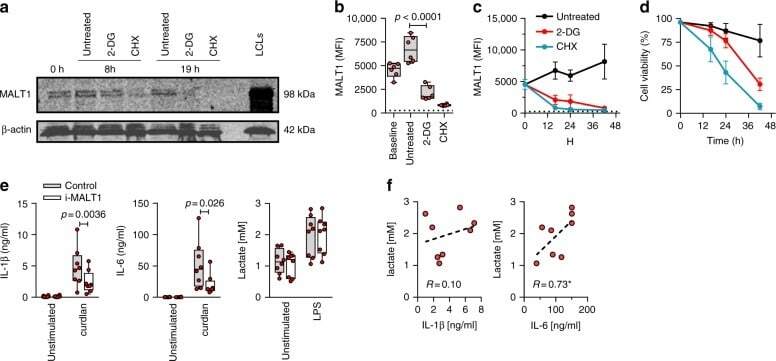
- Fig. 8 Inhibition glycolysis results in loss of MALT1 protein expression. Effect of blocking glycolysis (using 2-DG) or of blocking translation (using cycloheximide, as control) on MALT1 protein expression (monocytes). a MALT1 protein was detected by Western blot (left panel; representative of two experiments; cropped images from same blot probed with each antibody) at 8 h and 19 h. Lymphoblastoid cell line (LCL) lysate used as positive control for MALT1 protein expression; MALT1 protein detection ( b ) at 16 h and ( c ) over time (intracellular staining by flow cytometry, gated on CD14-expressing cells; MFI mean fluorescence intensity; dotted line: signal for fluorescence-minus-one staining control MFI level; boxes and whiskers with a paired 2-sided t -test in b ; mean +- SD in c and d ; d corresponding cell viability over time (mean +- SD); 6 subjects. e Effect of MALT1 inhibition on IL-1beta, IL-6, and lactate production at rest and following LPS (mononuclear cells; boxes and whiskers with 2-sided paired t -tests); f correlation between LPS-induced IL-1beta and IL-6, and lactate production (Spearman' r ; * p < 0.05; with dotted regression line); 8 subjects. All experiments were conducted in adult cells
- Submitted by
- Invitrogen Antibodies (provider)
- Main image
- Experimental details
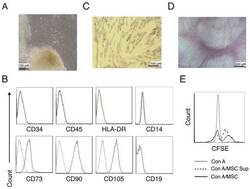
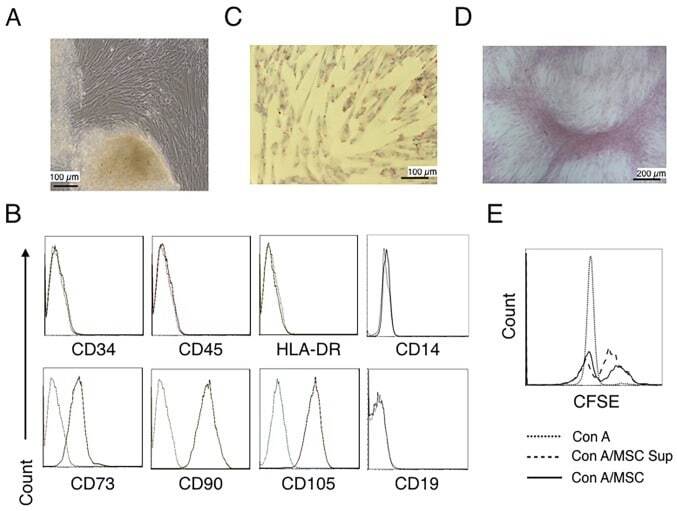
- Figure 1. Characterization of hUC-MSCs. (A) Morphological observations of hUC-MSCs. Umbilical cord tissues were cultured for >15 days and long spindle-shaded fibroblastic cells were observed around the tissue using Zeiss light microscopy (scale bar, 100 um). (B) Phenotyping of hUC-MSCs. hUC-MSCs were stained with a fluorescein-labeled antibodies (CD34, CD45, CD73, CD90, CD105, CD14, CD19 and HLA-DR) and analyzed with a flow cytometer. (C) Adipogenic and (D) osteogenic differentiation of hUC-MSCs. hUC-MSCs were cultured in adipogenic and osteogenic medium, respectively. Lipid droplets in the adipocytes are presented with Oil Red O staining (scale bar, 100 um). hUC-MSCs-derived osteoblasts were detected with Alizarin Red staining (scale bar, 200 um). (E) hUC-MSCs inhibit the proliferation of CFSE-labeled CD4 + T cells, which were activated by Con A stimulation. Experiments were repeated three times and representative graphs and images are presented. hUC-MSC, human umbilical cord-derived mesenchymal stem cell; MSC Sup, culture supernatant of hUC-MSCs; Con A, concanavalin A; CFSE, carboxyfluorescein succinimidyl ester.
- Submitted by
- Invitrogen Antibodies (provider)
- Main image
- Experimental details
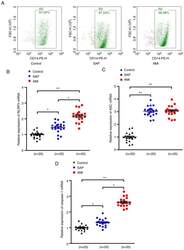
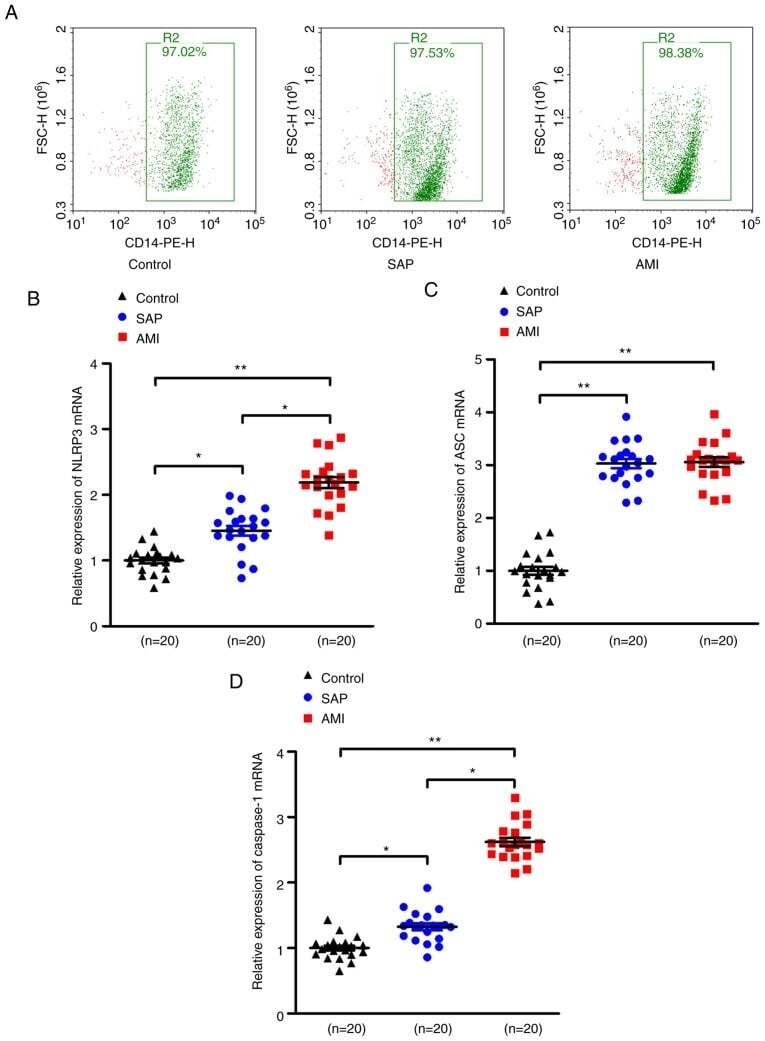
- Figure 1. Upregulation of NLRP3 inflammasome mRNA levels in PBMCs in patients with SAP and AMI, compared with non-CHD controls. (A) PBMCs were isolated from peripheral blood and the positive rate of CD14 was calculated to be >=95% of PBMCs by flow cytometry. RT-PCR assays were performed to quantify the mRNA levels of (B) NLRP3, (C) ASC and (D) caspase-1 in PBMCs of each group. *P
- Submitted by
- Invitrogen Antibodies (provider)
- Main image
- Experimental details
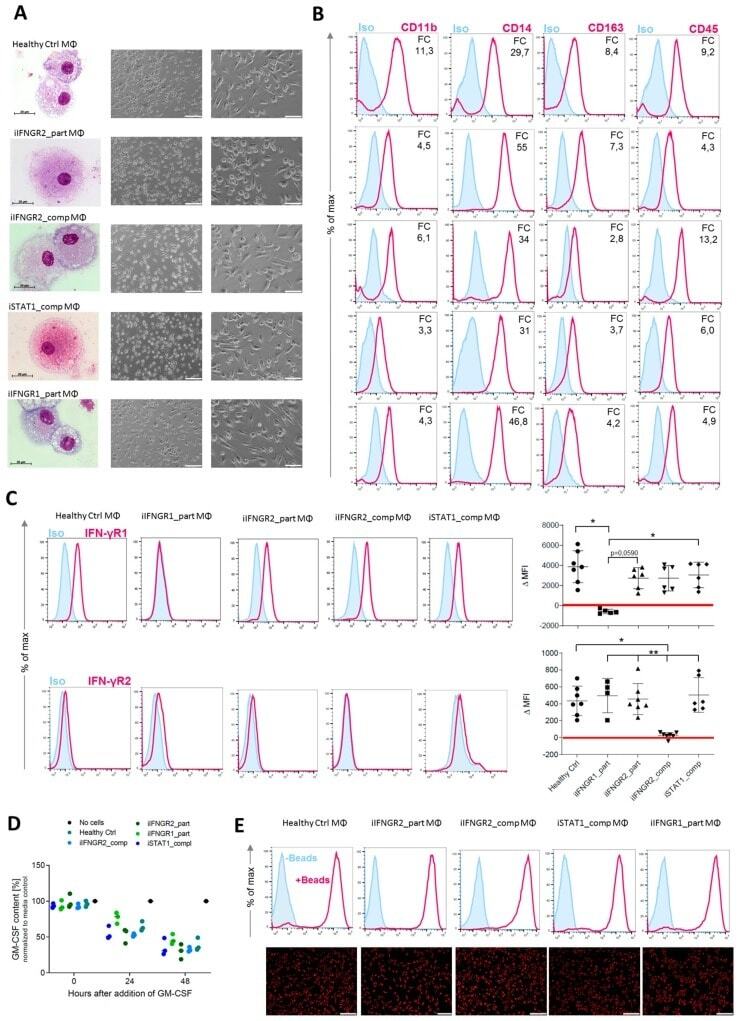
- Figure 3 Generation of patient specific iPSC-derived macrophages. Patient iPSCs have been differentiated into macrophages and compared to macrophages from a healthy iPSC line (hCD34_iPSC16). ( A ) Microscopic analysis of patient iPSCs in cytospin images after Pappenheim staining (left, scale bar = 20 um) or in brightfield images (middle scale bar 200 um, right scale bar = 100 um). ( B ) Representative flow cytometric analysis of CD11b, CD14, CD163 and CD45 expression on patient iPSCs and healthy macrophages of two independent experiments. Blue: Isotype. Pink: Surface marker. FC = fold change of the median fluorescent intensity. ( C ) Flow cytometric analysis of IFN-gammaR1 (top) and IFN-gammaR2 (bottom) expression on healthy and patient iPSC-derived macrophages. Blue: Isotype. Pink: Surface marker. Expression has been quantified by plotting the difference of the median fluorescent intensity (DeltaMFI). Each dot represents macrophages from an independent harvest and from at least three independent differentiations ( n = 4-7, mean +- SD, Kruskal-Wallis with Dunn''s multiple comparison). Red line shows DeltaMFI of 0. ( D ) GM-CSF clearance of healthy and patient iPSC-derived macrophages over a time of 48 h. Concentrations have been normalized to control well containing no cells (media only) ( n = 3, mean +- SD; each dot represents macrophages from an independent harvest and from at least three independent differentiations). ( E ) Representative flow cytometric (top) and microsco
- Submitted by
- Invitrogen Antibodies (provider)
- Main image
- Experimental details
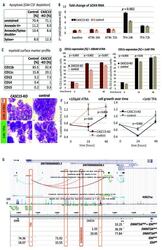
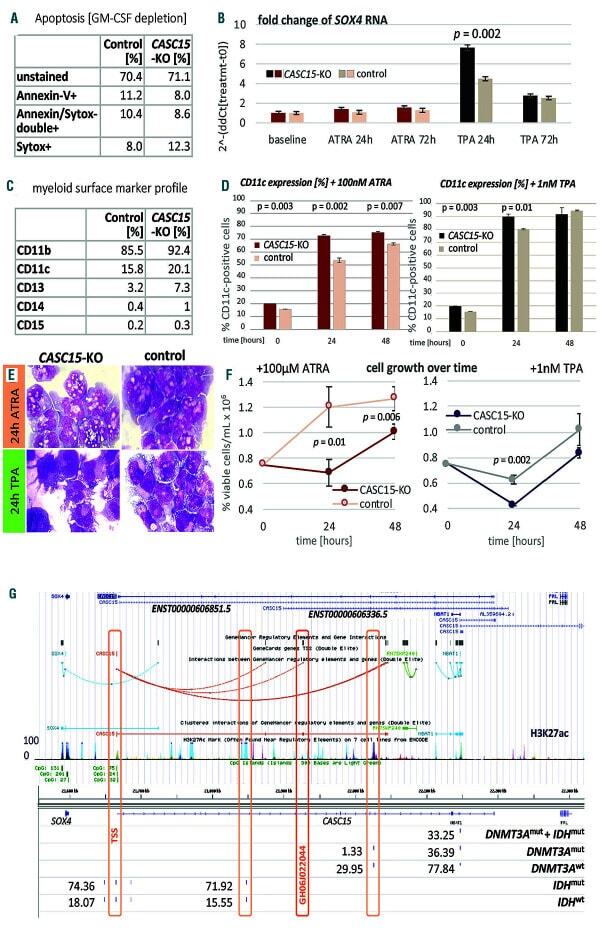
- Figure 1. CASC15 -KO promotes the differentiation of acute myeloid leukemia cells. (A) Apoptosis in CASC15 -KO and empty vector-transduced (control) OCI-AML5 cell lines after 24 h of depletion of granulocyte-macrophage colony-stimulating factor (annexin-FITC/Sytox blue flow cytometry). (B) Expression of SOX4 during in vitro differentiation of CASC15 -KO and control OCI-AML5 cell lines. All cells were treated with 0.1 mM all- trans retinoic acid (ATRA) and 1 nM 12-O-tetradecanoylphorbol-13-acetate (TPA) over 72 h in three independent experiments. Total RNA was extracted before, after 24 h and after 72 h of treatment, DNase-digested and transcribed to cDNA. A quantitative real-time polymerase chain reaction (qRT-PCR) was performed using SYBR green chemistry with subsequent melting curve analysis in technical triplicates. The 2-ddCt was calculated relative to the pre-determined housekeeping gene encoding succinate dehydrogenase complex subunit C ( SDHC ). (C) Baseline expression of the monocyte/macrophage markers CD11b (integrin subunit alpha M, ITGAM), CD11c (integrin subunit alpha X, ITGAX), and CD14, the granulocyte marker CD15 (fucosyltransferase 4, FUT4), and the general myeloid marker CD13 (aminopeptidase N, APN) in CASC15 -KO and control cells. The percentages of positive cells, quantified by flow cytometry after 72 h, are shown. (D-F) Growth rate and CD11c myeloid cell surface marker expression of CASC15 and control cell lines during drug-induced in vitro differentiation
- Submitted by
- Invitrogen Antibodies (provider)
- Main image
- Experimental details
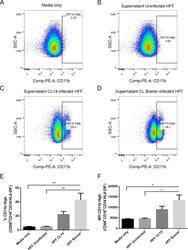
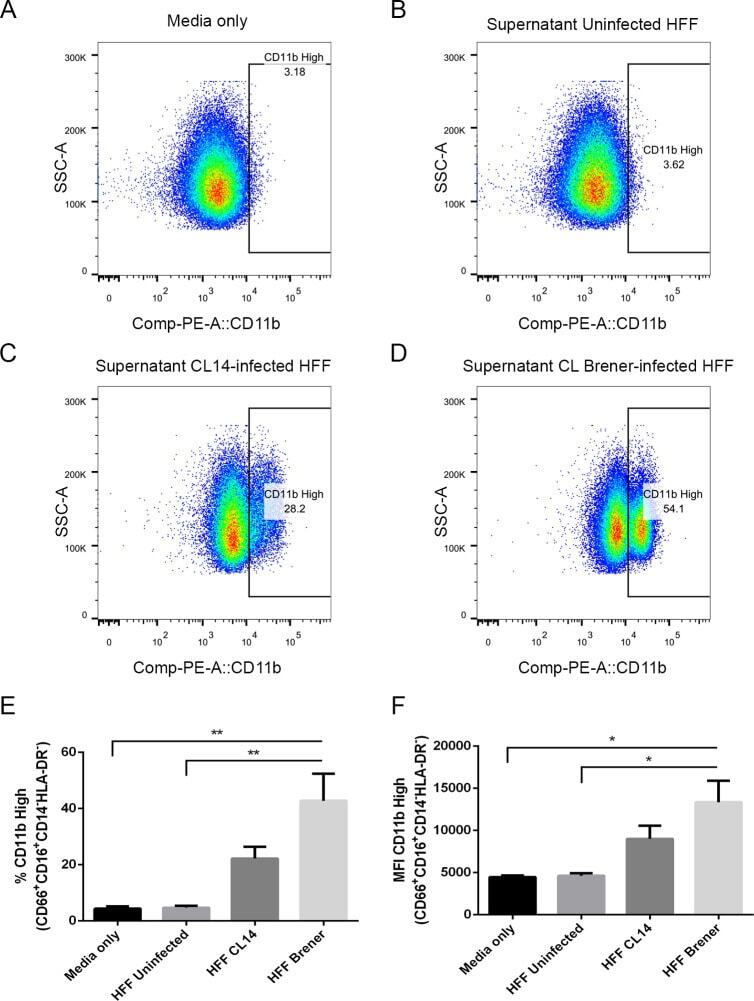
- Fig 6 Human neutrophils incubated with supernatants from T . cruzi -infected HFF cells have enhanced expression of CD11b. Flow cytometry analysis of live neutrophils (CD16 + CD66b + CD14 - HLA-DR - ) incubated for 16 hours with media only (A), supernatants from uninfected HFF cells (B), or supernatants of HFF cells infected for 4 days with T . cruzi CL-14 (C) or CL Brener (D). Percentage of cells expressing high levels of the activation marker CD11b (E) and mean fluorescent intensity (MFI) of CD11b (F). * p < 0.05, ** p < 0.01 (one-way ANOVA with Tukey''s post-test comparing the indicated treatments). (A-D) Images are representative of three independent experiments. (E-F) Data from three independent experiments (mean and s.e.m. ).
- Submitted by
- Invitrogen Antibodies (provider)
- Main image
- Experimental details
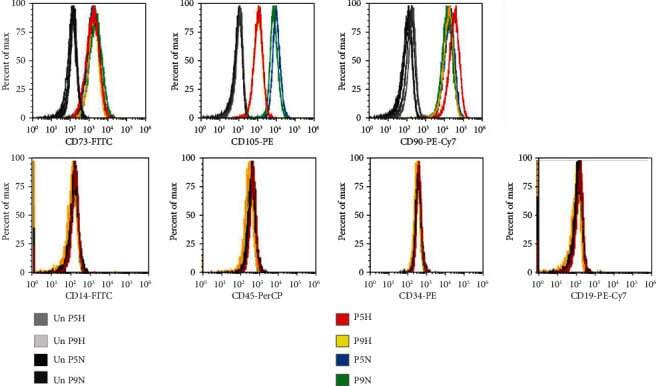
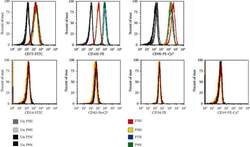
- Figure 2 Flow cytometry of CD cell surface markers for cells cultured under hypoxia and normoxia. The positive CD markers for MSCs as detected by the fluorescent antibodies anti-CD73 FITC, anti-CD105 PE, and anti-CD90 PE Cy7. The negative markers of MSCs were detected using anti-CD14 FITC, anti-CD45 PerCP, anti-CD34-R-PE, and anti-CD19 PE-Cy7 antibodies. Unstained cell for each condition was used as negative controls.