Explore
 Validate
 Learn
Learn13-0441-82
antibody from Invitrogen Antibodies
Targeting: CD44
CD44R, CSPG8, HCELL, IN, MC56, MDU2, MDU3, MIC4, Pgp1
 Flow cytometry
Antibody data
- Antibody Data
- Antigen structure
- References [195]
- Comments [0]
- Validations
- Flow cytometry [2]
- Other assay [220]
Submit
Validation data
Reference
Comment
Report error
- Product number
- 13-0441-82 - Provider product page

- Provider
- Invitrogen Antibodies
- Product name
- CD44 Monoclonal Antibody (IM7), Biotin, eBioscience™
- Antibody type
- Monoclonal
- Antigen
- Other
- Description
- Description: The IM7 monoclonal antibody reacts with all isoforms of mouse CD44 (Pgp-1). CD44 is expressed by hematopoietic and non-hematopoietic cells. Bone marrow myeloid cells and memory T cells highly express this antigen and peripheral B and T cells can upregulate the expression of CD44. CD44 functions as an adhesion molecule through its binding to hyaluronate, an extracellular matrix component. Applications Reported: The IM7 antibody has been reported for use in flow cytometric analysis. Applications Tested: The IM7 antibody has been tested by flow cytometric analysis of mouse bone marrow cells and splenocytes. This can be used at less than or equal to 0.125 µg per test. A test is defined as the amount (µg) of antibody that will stain a cell sample in a final volume of 100 µL. Cell number should be determined empirically but can range from 10^5 to 10^8 cells/test. It is recommended that the antibody be carefully titrated for optimal performance in the assay of interest. Filtration: 0.2 µm post-manufacturing filtered.
- Reactivity
- Human, Mouse
- Host
- Rat
- Conjugate
- Biotin
- Isotype
- IgG
- Antibody clone number
- IM7
- Vial size
- 100 μg
- Concentration
- 0.5 mg/mL
- Storage
- 4°C, store in dark, DO NOT FREEZE!
Submitted references TRAF6 controls T cell homeostasis by maintaining the equilibrium of MALT1 scaffolding and protease functions.
Platelet factors attenuate inflammation and rescue cognition in ageing.
A platinum@polymer-catechol nanobraker enables radio-immunotherapy for crippling melanoma tumorigenesis, angiogenesis, and radioresistance.
FUS-DDIT3 Fusion Oncoprotein Expression Affects JAK-STAT Signaling in Myxoid Liposarcoma.
RNF4~RGMb~BMP6 axis required for osteogenic differentiation and cancer cell survival.
CD44 Promotes Breast Cancer Metastasis through AKT-Mediated Downregulation of Nuclear FOXA2.
CXCR4, CXCR5 and CD44 May Be Involved in Homing of Lymphoma Cells into the Eye in a Patient Derived Xenograft Homing Mouse Model for Primary Vitreoretinal Lymphoma.
Amphiphile-CpG vaccination induces potent lymph node activation and COVID-19 immunity in mice and non-human primates.
LncRNA ANRIL-mediated miR-181b-5p/S1PR1 axis is involved in the progression of uremic cardiomyopathy through activating T cells.
Smad4 and p53 synergize in suppressing autochthonous intestinal cancer.
Mitochondrial RNA modifications shape metabolic plasticity in metastasis.
CD153/CD30 signaling promotes age-dependent tertiary lymphoid tissue expansion and kidney injury.
Isolation and characterization mesenchymal stem cells from red panda (Ailurus fulgens styani) endometrium.
Lin28B-high breast cancer cells promote immune suppression in the lung pre-metastatic niche via exosomes and support cancer progression.
Circ_RNF13 Regulates the Stemness and Chemosensitivity of Colorectal Cancer by Transcriptional Regulation of DDX27 Mediated by TRIM24 Stabilization.
Multivalent state transitions shape the intratumoral composition of small cell lung carcinoma.
High-Contrast Stimulation Potentiates the Neurotrophic Properties of Müller Cells and Suppresses Their Pro-Inflammatory Phenotype.
WDR82-binding long noncoding RNA lncEry controls mouse erythroid differentiation and maturation.
Trichinella spiralis Paramyosin Induces Colonic Regulatory T Cells to Mitigate Inflammatory Bowel Disease.
Senescent T Cell Induces Brown Adipose Tissue "Whitening" Via Secreting IFN-γ.
Prophylactic efficacy against Mycobacterium tuberculosis using ID93 and lipid-based adjuvant formulations in the mouse model.
Graded RhoA GTPase Expression in Treg Cells Distinguishes Tumor Immunity From Autoimmunity.
Neuroimmune Consequences of eIF4E Phosphorylation on Chemotherapy-Induced Peripheral Neuropathy.
Downregulation of SLC27A6 by DNA Hypermethylation Promotes Proliferation but Suppresses Metastasis of Nasopharyngeal Carcinoma Through Modulating Lipid Metabolism.
MiR-125b-5p Is Involved in Sorafenib Resistance through Ataxin-1-Mediated Epithelial-Mesenchymal Transition in Hepatocellular Carcinoma.
A nanounit strategy reverses immune suppression of exosomal PD-L1 and is associated with enhanced ferroptosis.
Serglycin induces osteoclastogenesis and promotes tumor growth in giant cell tumor of bone.
A CD10-OGP Membrane Peptolytic Signaling Axis in Fibroblasts Regulates Lipid Metabolism of Cancer Stem Cells via SCD1.
Type 2 diabetic mice enter a state of spontaneous hibernation-like suspended animation following accumulation of uric acid.
Attenuation of apoptotic cell detection triggers thymic regeneration after damage.
c-FOS drives reversible basal to squamous cell carcinoma transition.
Differential activation of Ca(2+) influx channels modulate stem cell potency, their proliferation/viability and tissue regeneration.
PI3Kδ coordinates transcriptional, chromatin, and metabolic changes to promote effector CD8(+) T cells at the expense of central memory.
CD95/Fas protects triple negative breast cancer from anti-tumor activity of NK cells.
A TLR7 antagonist restricts interferon-dependent and -independent immunopathology in a mouse model of severe influenza.
Near-infrared photoimmunotherapy targeting human-EGFR in a mouse tumor model simulating current and future clinical trials.
Immuno-Electron and Confocal Laser Scanning Microscopy of the Glycocalyx.
Simvastatin Enhances the Chondrogenesis But Not the Osteogenesis of Adipose-Derived Stem Cells in a Hyaluronan Microenvironment.
miR-34a mimic or pre-mir-34a, which is the better option for cancer therapy? KatoIII as a model to study miRNA action in human gastric cancer cells.
Analysis of T cells in mouse lymphoid tissue and blood with flow cytometry.
Synchronous effects of targeted mitochondrial complex I inhibitors on tumor and immune cells abrogate melanoma progression.
3-hydroxyanthranic acid increases the sensitivity of hepatocellular carcinoma to sorafenib by decreasing tumor cell stemness.
Valproic acid stimulates myogenesis in pluripotent stem cell-derived mesodermal progenitors in a NOTCH-dependent manner.
Thrombospondin-2 spatiotemporal expression in skeletal fractures.
NF-κB-inducing kinase maintains T cell metabolic fitness in antitumor immunity.
In Vitro Anti-cancer Activity of Adipose-Derived Mesenchymal Stem Cells Increased after Infection with Oncolytic Reovirus.
Therapeutic Potential of Mesenchymal Stem Cells in a Pre-Clinical Model of Diabetic Kidney Disease and Obesity.
Theranostic near-infrared-IIb emitting nanoprobes for promoting immunogenic radiotherapy and abscopal effects against cancer metastasis.
Protocols for isolation and characterization of mouse placental hemogenic endothelial cells.
GPR120 induces regulatory dendritic cells by inhibiting HK2-dependent glycolysis to alleviate fulminant hepatic failure.
Chronic T cell proliferation in brains after stroke could interfere with the efficacy of immunotherapies.
Stage-specific action of Runx1 and GATA3 controls silencing of PU.1 expression in mouse pro-T cells.
Disruption of the MSL complex inhibits tumour maintenance by exacerbating chromosomal instability.
Low immunogenicity of malaria pre-erythrocytic stages can be overcome by vaccination.
The white matter is a pro-differentiative niche for glioblastoma.
Down-Regulated Exosomal MicroRNA-221 - 3p Derived From Senescent Mesenchymal Stem Cells Impairs Heart Repair.
Graphene-based 2D constructs for enhanced fibroblast support.
Utility Evaluation of Porcine Enteroids as PDCoV Infection Model in vitro.
Extracellular HMGB-1 activates inflammatory signaling in tendon cells and tissues.
Phosphatase SHP1 impedes mesenchymal stromal cell immunosuppressive capacity modulated by JAK1/STAT3 and P38 signals.
Dexamethasone inhibits stemness maintenance and enhances chemosensitivity of hepatocellular carcinoma stem cells by inducing deSUMOylation of HIF‑1α and Oct4.
Cancer cells educate natural killer cells to a metastasis-promoting cell state.
Diacerein treatment prevents colitis-associated cancer in mice.
Critical role of WNK1 in MYC-dependent early mouse thymocyte development.
Resveratrol rescues TNF‑α‑induced inhibition of osteogenesis in human periodontal ligament stem cells via the ERK1/2 pathway.
Effect of Combining Low Temperature Plasma, Negative Pressure Wound Therapy, and Bone Marrow Mesenchymal Stem Cells on an Acute Skin Wound Healing Mouse Model.
Tumor Cell Associated Hyaluronan-CD44 Signaling Promotes Pro-Tumor Inflammation in Breast Cancer.
Localized cocktail chemoimmunotherapy after in situ gelation to trigger robust systemic antitumor immune responses.
miR‑210 enhances mesenchymal stem cell‑modulated neural precursor cell migration.
Chronic expression of p16(INK4a) in the epidermis induces Wnt-mediated hyperplasia and promotes tumor initiation.
Identification, characterization and microRNA expression profiling of side population cells in human oral squamous cell carcinoma Tca8113 cell lines.
Requirements for the differentiation of innate T-bet(high) memory-phenotype CD4(+) T lymphocytes under steady state.
Mucosal-associated invariant T cells promote inflammation and intestinal dysbiosis leading to metabolic dysfunction during obesity.
Head and Neck Cancer Stem Cell-Enriched Spheroid Model for Anticancer Compound Screening.
Distinct roles of PIK3CA in the enrichment and maintenance of cancer stem cells in head and neck squamous cell carcinoma.
Chemotherapeutic Stress Influences Epithelial-Mesenchymal Transition and Stemness in Cancer Stem Cells of Triple-Negative Breast Cancer.
Pharmacological Activation of Pyruvate Kinase M2 Inhibits CD4(+) T Cell Pathogenicity and Suppresses Autoimmunity.
Efficacy of atovaquone on EpCAM(+)CD44(+) HCT-116 human colon cancer stem cells under hypoxia.
Targeted expression profiling reveals distinct stages of early canine fibroblast reprogramming are regulated by 2-oxoglutarate hydroxylases.
Antagonistic Inflammatory Phenotypes Dictate Tumor Fate and Response to Immune Checkpoint Blockade.
Profiling and Targeting of Energy and Redox Metabolism in Grade 2 Bladder Cancer Cells with Different Invasiveness Properties.
Inhibition of EZH2 ameliorates bacteria-induced liver injury by repressing RUNX1 in dendritic cells.
Transfer of metastatic traits via miR-200c in extracellular vesicles derived from colorectal cancer stem cells is inhibited by atractylenolide I.
CCL5 derived from tumor-associated macrophages promotes prostate cancer stem cells and metastasis via activating β-catenin/STAT3 signaling.
Obesity-Altered Adipose Stem Cells Promote Radiation Resistance of Estrogen Receptor Positive Breast Cancer through Paracrine Signaling.
Therapeutic Effects of Human Urine-Derived Stem Cells in a Rat Model of Cisplatin-Induced Acute Kidney Injury In Vivo and In Vitro.
BMX-ARHGAP fusion protein maintains the tumorigenicity of gastric cancer stem cells by activating the JAK/STAT3 signaling pathway.
HMGB3 silence inhibits breast cancer cell proliferation and tumor growth by interacting with hypoxia-inducible factor 1α.
TGF‑β induces periodontal ligament stem cell senescence through increase of ROS production.
The ROP16III-dependent early immune response determines the subacute CNS immune response and type III Toxoplasma gondii survival.
The deubiquitinating enzyme PSMD14 facilitates tumor growth and chemoresistance through stabilizing the ALK2 receptor in the initiation of BMP6 signaling pathway.
Effects of demographic factors on adipogenic and chondrogenic differentiation in bone marrow-derived stem cells.
Hypoxia changes chemotaxis behaviour of mesenchymal stem cells via HIF-1α signalling.
Better therapeutic potential of bone marrow-derived mesenchymal stem cells compared with chorionic villi-derived mesenchymal stem cells in airway injury model.
Human Pluripotent Stem Cell-Derived Multipotent Vascular Progenitors of the Mesothelium Lineage Have Utility in Tissue Engineering and Repair.
Growth Factor Screening in Dystrophic Muscles Reveals PDGFB/PDGFRB-Mediated Migration of Interstitial Stem Cells.
ER stress-induced mediator C/EBP homologous protein thwarts effector T cell activity in tumors through T-bet repression.
BRCA1 regulates the cancer stem cell fate of breast cancer cells in the context of hypoxia and histone deacetylase inhibitors.
Conserved regulation of RNA processing in somatic cell reprogramming.
Sex Differences in Mouse Popliteal Lymph Nodes.
Overexpression of Aiolos promotes epithelial-mesenchymal transition and cancer stem cell-like properties in lung cancer cells.
A Novel Form of 4-1BBL Prevents Cancer Development via Nonspecific Activation of CD4(+) T and Natural Killer Cells.
Anisomycin inhibits angiogenesis in ovarian cancer by attenuating the molecular sponge effect of the lncRNA‑Meg3/miR‑421/PDGFRA axis.
Clonal copy-number mosaicism in autoreactive T lymphocytes in diabetic NOD mice.
A20 in Myeloid Cells Protects Against Hypertension by Inhibiting Dendritic Cell-Mediated T-Cell Activation.
Visfatin Mediates Malignant Behaviors through Adipose-Derived Stem Cells Intermediary in Breast Cancer.
LGR5, a novel functional glioma stem cell marker, promotes EMT by activating the Wnt/β-catenin pathway and predicts poor survival of glioma patients.
Modifying the cancer-immune set point using vaccinia virus expressing re-designed interleukin-2.
Inhibition of Fas associated phosphatase 1 (Fap1) facilitates apoptosis of colon cancer stem cells and enhances the effects of oxaliplatin.
Mutant p53 gain of function underlies high expression levels of colorectal cancer stem cells markers.
The hypoxic tumor microenvironment in vivo selects the cancer stem cell fate of breast cancer cells.
Oncofetal gene SALL4 reactivation by hepatitis B virus counteracts miR-200c in PD-L1-induced T cell exhaustion.
RhoA, Rac1, and Cdc42 differentially regulate αSMA and collagen I expression in mesenchymal stem cells.
An alternative splicing switch in FLNB promotes the mesenchymal cell state in human breast cancer.
mTOR Modulates CD8+ T Cell Differentiation in Mice with Invasive Pulmonary Aspergillosis.
Tanshinone IIA and Astragaloside IV promote the angiogenesis of mesenchymal stem cell-derived endothelial cell-like cells via upregulation of Cx37, Cx40 and Cx43.
Polymethoxylated Flavones from Orange Peels Inhibit Cell Proliferation in a 3D Cell Model of Human Colorectal Cancer.
SUV420H2 is an epigenetic regulator of epithelial/mesenchymal states in pancreatic cancer.
Bryostatin-1 alleviates experimental multiple sclerosis.
Foxp3 expression in induced regulatory T cells is stabilized by C/EBP in inflammatory environments.
Selective Export into Extracellular Vesicles and Function of tRNA Fragments during T Cell Activation.
Glutamic Pyruvate Transaminase GPT2 Promotes Tumorigenesis of Breast Cancer Cells by Activating Sonic Hedgehog Signaling.
Zoledronate suppressed angiogenesis and osteogenesis by inhibiting osteoclasts formation and secretion of PDGF-BB.
Targeted genome editing restores T cell differentiation in a humanized X-SCID pluripotent stem cell disease model.
Extrafollicular CD4(+) T-B interactions are sufficient for inducing autoimmune-like chronic graft-versus-host disease.
Tristetraprolin inhibits macrophage IL-27-induced activation of antitumour cytotoxic T cell responses.
IL-7-dependent STAT1 activation limits homeostatic CD4+ T cell expansion.
Role of Triggering Receptor Expressed on Myeloid Cell-1 Expression in Mammalian Target of Rapamycin Modulation of CD8(+) T-cell Differentiation during the Immune Response to Invasive Pulmonary Aspergillosis.
SOCS3 treatment prevents the development of alopecia areata by inhibiting CD8+ T cell-mediated autoimmune destruction.
A high-yield isolation and enrichment strategy for human lung microvascular endothelial cells.
Integrin-β4 identifies cancer stem cell-enriched populations of partially mesenchymal carcinoma cells.
Egr2 and 3 control adaptive immune responses by temporally uncoupling expansion from T cell differentiation.
Excessive expression of miR-27 impairs Treg-mediated immunological tolerance.
Constitutively Active SMAD2/3 Are Broad-Scope Potentiators of Transcription-Factor-Mediated Cellular Reprogramming.
ST6GALNAC1 plays important roles in enhancing cancer stem phenotypes of colorectal cancer via the Akt pathway.
Antibody Tumor Targeting Is Enhanced by CD27 Agonists through Myeloid Recruitment.
The Ox40/Ox40 Ligand Pathway Promotes Pathogenic Th Cell Responses, Plasmablast Accumulation, and Lupus Nephritis in NZB/W F1 Mice.
Androgen receptor in cancer-associated fibroblasts influences stemness in cancer cells.
Comparison of Four Protocols to Generate Chondrocyte-Like Cells from Human Induced Pluripotent Stem Cells (hiPSCs).
Llgl1 prevents metaplastic survival driven by epidermal growth factor dependent migration.
Comparable roles of CD44v8-10 and CD44s in the development of bone metastases in a mouse model.
Sertoli cell condition medium can induce germ like cells from bone marrow derived mesenchymal stem cells.
SOX2 and PI3K Cooperate to Induce and Stabilize a Squamous-Committed Stem Cell Injury State during Lung Squamous Cell Carcinoma Pathogenesis.
Stem Cells Antigen-1 Enriches for a Cancer Stem Cell-Like Subpopulation in Mouse Gastric Cancer.
PRDM14 promotes RAG-dependent Notch1 driver mutations in mouse T-ALL.
Cryptotanshinone targets tumor-initiating cells through down-regulation of stemness genes expression.
Treg engage lymphotoxin beta receptor for afferent lymphatic transendothelial migration.
The Z-cad dual fluorescent sensor detects dynamic changes between the epithelial and mesenchymal cellular states.
Oligodendrocyte death results in immune-mediated CNS demyelination.
Effects of nerve growth factor and basic fibroblast growth factor dual gene modification on rat bone marrow mesenchymal stem cell differentiation into neuron-like cells in vitro.
Equine-Induced Pluripotent Stem Cells Retain Lineage Commitment Toward Myogenic and Chondrogenic Fates.
Breast cancer stem cells expressing different stem cell markers exhibit distinct biological characteristics.
A cell-autonomous tumour suppressor role of RAF1 in hepatocarcinogenesis.
Resident T Cells Are Unable To Control Herpes Simplex Virus-1 Activity in the Brain Ependymal Region during Latency.
Identification and validation of multiple cell surface markers of clinical-grade adipose-derived mesenchymal stromal cells as novel release criteria for good manufacturing practice-compliant production.
Multi-lineage differentiation of human umbilical cord Wharton's Jelly Mesenchymal Stromal Cells mediates changes in the expression profile of stemness markers.
Reprogramming Roadblocks Are System Dependent.
Anisotropic stress orients remodelling of mammalian limb bud ectoderm.
Special AT-rich sequence-binding protein-1 participates in the maintenance of breast cancer stem cells through regulation of the Notch signaling pathway and expression of Snail1 and Twist1.
Human adipose-derived stem cells partially rescue the stroke syndromes by promoting spatial learning and memory in mouse middle cerebral artery occlusion model.
Manic fringe promotes a claudin-low breast cancer phenotype through notch-mediated PIK3CG induction.
Enrichment of Human Stem-Like Prostate Cells with s-SHIP Promoter Activity Uncovers a Role in Stemness for the Long Noncoding RNA H19.
Multi-Drug Resistance ABC Transporter Inhibition Enhances Murine Ventral Prostate Stem/Progenitor Cell Differentiation.
Mesodermal iPSC-derived progenitor cells functionally regenerate cardiac and skeletal muscle.
Amniotic fluid stem cells prevent follicle atresia and rescue fertility of mice with premature ovarian failure induced by chemotherapy.
Oncogene ablation-resistant pancreatic cancer cells depend on mitochondrial function.
FOXF1 mediates mesenchymal stem cell fusion-induced reprogramming of lung cancer cells.
Validation of the effects of TGF-β1 on tumor recurrence and prognosis through tumor retrieval and cell mechanical properties.
Tumor-suppressive activity of Lunatic Fringe in prostate through differential modulation of Notch receptor activation.
Serum- and growth-factor-free three-dimensional culture system supports cartilage tissue formation by promoting collagen synthesis via Sox9-Col2a1 interaction.
Microvesicles derived from human umbilical cord Wharton's jelly mesenchymal stem cells attenuate bladder tumor cell growth in vitro and in vivo.
Evidence for a multipotent mammary progenitor with pregnancy-specific activity.
miR-126 and miR-126* repress recruitment of mesenchymal stem cells and inflammatory monocytes to inhibit breast cancer metastasis.
Increased invasion and tumorigenicity capacity of CD44+/CD24- breast cancer MCF7 cells in vitro and in nude mice.
High-resolution analysis with novel cell-surface markers identifies routes to iPS cells.
Minor cell-death defects but reduced tumor latency in mice lacking the BH3-only proteins Bad and Bmf.
Inhibiting interactions of lysine demethylase LSD1 with snail/slug blocks cancer cell invasion.
GATA3 suppresses metastasis and modulates the tumour microenvironment by regulating microRNA-29b expression.
Distinct fibroblast lineages determine dermal architecture in skin development and repair.
Phenotypic CD8+ T cell diversification occurs before, during, and after the first T cell division.
Estrogen and progesterone together expand murine endometrial epithelial progenitor cells.
The CD44+ ALDH+ population of human keratinocytes is enriched for epidermal stem cells with long-term repopulating ability.
Phenotypic conversions of "protoplasmic" to "reactive" astrocytes in Alexander disease.
Stem-like epithelial cells are concentrated in the distal end of the fallopian tube: a site for injury and serous cancer initiation.
Increased protection from vaccinia virus infection in mice genetically prone to lymphoproliferative disorders.
Arthritogenic self-reactive CD4+ T cells acquire an FR4hiCD73hi anergic state in the presence of Foxp3+ regulatory T cells.
The high and low molecular weight forms of hyaluronan have distinct effects on CD44 clustering.
GLI1 confers profound phenotypic changes upon LNCaP prostate cancer cells that include the acquisition of a hormone independent state.
High levels of the adhesion molecule CD44 on leukemic cells generate acute myeloid leukemia relapse after withdrawal of the initial transforming event.
PTEN loss accelerates KrasG12D-induced pancreatic cancer development.
CD44 expression is developmentally regulated in the mouse lens and increases in the lens epithelium after injury.
Two host factors regulate persistence of H7-specific T cells injected in tumor-bearing mice.
Effects of Culturing on the Stability of the Putative Murine Adipose Derived Stem Cells Markers.
Modulation of naive CD4+ T-cell responses to an airway antigen during pulmonary mycobacterial infection.
Msx2-interacting nuclear target protein (Mint) deficiency reveals negative regulation of early thymocyte differentiation by Notch/RBP-J signaling.
O'Neill TJ, Gewies A, Seeholzer T, Krappmann D
Frontiers in immunology 2023;14:1111398
Frontiers in immunology 2023;14:1111398
Platelet factors attenuate inflammation and rescue cognition in ageing.
Schroer AB, Ventura PB, Sucharov J, Misra R, Chui MKK, Bieri G, Horowitz AM, Smith LK, Encabo K, Tenggara I, Couthouis J, Gross JD, Chan JM, Luke A, Villeda SA
Nature 2023 Aug;620(7976):1071-1079
Nature 2023 Aug;620(7976):1071-1079
A platinum@polymer-catechol nanobraker enables radio-immunotherapy for crippling melanoma tumorigenesis, angiogenesis, and radioresistance.
Li W, Yan J, Tian H, Li B, Wang G, Sang W, Zhang Z, Zhang X, Dai Y
Bioactive materials 2023 Apr;22:34-46
Bioactive materials 2023 Apr;22:34-46
FUS-DDIT3 Fusion Oncoprotein Expression Affects JAK-STAT Signaling in Myxoid Liposarcoma.
Dolatabadi S, Jonasson E, Andersson L, Luna Santamaría M, Lindén M, Österlund T, Åman P, Ståhlberg A
Frontiers in oncology 2022;12:816894
Frontiers in oncology 2022;12:816894
RNF4~RGMb~BMP6 axis required for osteogenic differentiation and cancer cell survival.
Novak R, Ahmad YA, Timaner M, Bitman-Lotan E, Oknin-Vaisman A, Horwitz R, Hartmann O, Reissland M, Buck V, Rosenfeldt M, Nikomarov D, Diefenbacher ME, Shaked Y, Orian A
Cell death & disease 2022 Sep 24;13(9):820
Cell death & disease 2022 Sep 24;13(9):820
CD44 Promotes Breast Cancer Metastasis through AKT-Mediated Downregulation of Nuclear FOXA2.
Vadhan A, Hou MF, Vijayaraghavan P, Wu YC, Hu SC, Wang YM, Cheng TL, Wang YY, Yuan SF
Biomedicines 2022 Oct 5;10(10)
Biomedicines 2022 Oct 5;10(10)
CXCR4, CXCR5 and CD44 May Be Involved in Homing of Lymphoma Cells into the Eye in a Patient Derived Xenograft Homing Mouse Model for Primary Vitreoretinal Lymphoma.
Babst N, Isbell LK, Rommel F, Tura A, Ranjbar M, Grisanti S, Tschuch C, Schueler J, Doostkam S, Reinacher PC, Duyster J, Kakkassery V, von Bubnoff N
International journal of molecular sciences 2022 Oct 4;23(19)
International journal of molecular sciences 2022 Oct 4;23(19)
Amphiphile-CpG vaccination induces potent lymph node activation and COVID-19 immunity in mice and non-human primates.
Seenappa LM, Jakubowski A, Steinbuck MP, Palmer E, Haqq CM, Carter C, Fontenot J, Villinger F, McNeil LK, DeMuth PC
NPJ vaccines 2022 Oct 28;7(1):128
NPJ vaccines 2022 Oct 28;7(1):128
LncRNA ANRIL-mediated miR-181b-5p/S1PR1 axis is involved in the progression of uremic cardiomyopathy through activating T cells.
Xu Y, Cao L, Ji S, Shen W
Scientific reports 2022 Oct 27;12(1):18027
Scientific reports 2022 Oct 27;12(1):18027
Smad4 and p53 synergize in suppressing autochthonous intestinal cancer.
Park JW, Seo MJ, Cho KS, Kook MC, Jeong JM, Roh SG, Cho SY, Cheon JH, Kim HK
Cancer medicine 2022 May;11(9):1925-1936
Cancer medicine 2022 May;11(9):1925-1936
Mitochondrial RNA modifications shape metabolic plasticity in metastasis.
Delaunay S, Pascual G, Feng B, Klann K, Behm M, Hotz-Wagenblatt A, Richter K, Zaoui K, Herpel E, Münch C, Dietmann S, Hess J, Benitah SA, Frye M
Nature 2022 Jul;607(7919):593-603
Nature 2022 Jul;607(7919):593-603
CD153/CD30 signaling promotes age-dependent tertiary lymphoid tissue expansion and kidney injury.
Sato Y, Oguchi A, Fukushima Y, Masuda K, Toriu N, Taniguchi K, Yoshikawa T, Cui X, Kondo M, Hosoi T, Komidori S, Shimizu Y, Fujita H, Jiang L, Kong Y, Yamanashi T, Seita J, Yamamoto T, Toyokuni S, Hamazaki Y, Hattori M, Yoshikai Y, Boor P, Floege J, Kawamoto H, Murakawa Y, Minato N, Yanagita M
The Journal of clinical investigation 2022 Jan 18;132(2)
The Journal of clinical investigation 2022 Jan 18;132(2)
Isolation and characterization mesenchymal stem cells from red panda (Ailurus fulgens styani) endometrium.
Wang DH, Wu XM, Chen JS, Cai ZG, An JH, Zhang MY, Li Y, Li FP, Hou R, Liu YL
Conservation physiology 2022 Jan 1;10(1):coac004
Conservation physiology 2022 Jan 1;10(1):coac004
Lin28B-high breast cancer cells promote immune suppression in the lung pre-metastatic niche via exosomes and support cancer progression.
Qi M, Xia Y, Wu Y, Zhang Z, Wang X, Lu L, Dai C, Song Y, Xu K, Ji W, Zhan L
Nature communications 2022 Feb 16;13(1):897
Nature communications 2022 Feb 16;13(1):897
Circ_RNF13 Regulates the Stemness and Chemosensitivity of Colorectal Cancer by Transcriptional Regulation of DDX27 Mediated by TRIM24 Stabilization.
Guo Y, Hu G, Tian B, Ma M, Long F, Chen M
Cancers 2022 Dec 16;14(24)
Cancers 2022 Dec 16;14(24)
Multivalent state transitions shape the intratumoral composition of small cell lung carcinoma.
Gopal P, Petty A, Rogacki K, Bera T, Bareja R, Peacock CD, Abazeed ME
Science advances 2022 Dec 14;8(50):eabp8674
Science advances 2022 Dec 14;8(50):eabp8674
High-Contrast Stimulation Potentiates the Neurotrophic Properties of Müller Cells and Suppresses Their Pro-Inflammatory Phenotype.
Zloh M, Kutilek P, Stofkova A
International journal of molecular sciences 2022 Aug 3;23(15)
International journal of molecular sciences 2022 Aug 3;23(15)
WDR82-binding long noncoding RNA lncEry controls mouse erythroid differentiation and maturation.
Yang S, Sun G, Wu P, Chen C, Kuang Y, Liu L, Zheng Z, He Y, Gu Q, Lu T, Zhu C, Wang F, Gou F, Yang Z, Zhao X, Yuan S, Yang L, Lu S, Li Y, Lv X, Dong F, Ma Y, Yu J, Ng LG, Shi L, Liu J, Shi L, Cheng T, Cheng H
The Journal of experimental medicine 2022 Apr 4;219(4)
The Journal of experimental medicine 2022 Apr 4;219(4)
Trichinella spiralis Paramyosin Induces Colonic Regulatory T Cells to Mitigate Inflammatory Bowel Disease.
Hao C, Wang W, Zhan B, Wang Z, Huang J, Sun X, Zhu X
Frontiers in cell and developmental biology 2021;9:695015
Frontiers in cell and developmental biology 2021;9:695015
Senescent T Cell Induces Brown Adipose Tissue "Whitening" Via Secreting IFN-γ.
Pan XX, Yao KL, Yang YF, Ge Q, Zhang R, Gao PJ, Ruan CC, Wu F
Frontiers in cell and developmental biology 2021;9:637424
Frontiers in cell and developmental biology 2021;9:637424
Prophylactic efficacy against Mycobacterium tuberculosis using ID93 and lipid-based adjuvant formulations in the mouse model.
Baldwin SL, Reese VA, Larsen SE, Beebe E, Guderian J, Orr MT, Fox CB, Reed SG, Coler RN
PloS one 2021;16(3):e0247990
PloS one 2021;16(3):e0247990
Graded RhoA GTPase Expression in Treg Cells Distinguishes Tumor Immunity From Autoimmunity.
Kalim KW, Yang JQ, Modur V, Nguyen P, Li Y, Zheng Y, Guo F
Frontiers in immunology 2021;12:726393
Frontiers in immunology 2021;12:726393
Neuroimmune Consequences of eIF4E Phosphorylation on Chemotherapy-Induced Peripheral Neuropathy.
Agalave NM, Mody PH, Szabo-Pardi TA, Jeong HS, Burton MD
Frontiers in immunology 2021;12:642420
Frontiers in immunology 2021;12:642420
Downregulation of SLC27A6 by DNA Hypermethylation Promotes Proliferation but Suppresses Metastasis of Nasopharyngeal Carcinoma Through Modulating Lipid Metabolism.
Zhong X, Yang Y, Li B, Liang P, Huang Y, Zheng Q, Wang Y, Xiao X, Mo Y, Zhang Z, Zhou X, Huang G, Zhao W
Frontiers in oncology 2021;11:780410
Frontiers in oncology 2021;11:780410
MiR-125b-5p Is Involved in Sorafenib Resistance through Ataxin-1-Mediated Epithelial-Mesenchymal Transition in Hepatocellular Carcinoma.
Hirao A, Sato Y, Tanaka H, Nishida K, Tomonari T, Hirata M, Bando M, Kida Y, Tanaka T, Kawaguchi T, Wada H, Taniguchi T, Okamoto K, Miyamoto H, Muguruma N, Tanahashi T, Takayama T
Cancers 2021 Sep 30;13(19)
Cancers 2021 Sep 30;13(19)
A nanounit strategy reverses immune suppression of exosomal PD-L1 and is associated with enhanced ferroptosis.
Wang G, Xie L, Li B, Sang W, Yan J, Li J, Tian H, Li W, Zhang Z, Tian Y, Dai Y
Nature communications 2021 Sep 30;12(1):5733
Nature communications 2021 Sep 30;12(1):5733
Serglycin induces osteoclastogenesis and promotes tumor growth in giant cell tumor of bone.
He Y, Cheng D, Lian C, Liu Y, Luo W, Wang Y, Ma C, Wu Q, Tian P, He D, Jia Z, Lv X, Zhang X, Pan Z, Lu J, Xiao Y, Zhang P, Liang Y, Yang Q, Hu G
Cell death & disease 2021 Sep 23;12(10):868
Cell death & disease 2021 Sep 23;12(10):868
A CD10-OGP Membrane Peptolytic Signaling Axis in Fibroblasts Regulates Lipid Metabolism of Cancer Stem Cells via SCD1.
Yu S, Lu Y, Su A, Chen J, Li J, Zhou B, Liu X, Xia Q, Li Y, Li J, Huang M, Ye Y, Zhao Q, Jiang S, Yan X, Wang X, Di C, Pan J, Su S
Advanced science (Weinheim, Baden-Wurttemberg, Germany) 2021 Oct;8(19):e2101848
Advanced science (Weinheim, Baden-Wurttemberg, Germany) 2021 Oct;8(19):e2101848
Type 2 diabetic mice enter a state of spontaneous hibernation-like suspended animation following accumulation of uric acid.
Zhao Y, Cheng R, Zhao Y, Ge W, Yang Y, Ding Z, Xu X, Wang Z, Wu Z, Zhang J
The Journal of biological chemistry 2021 Oct;297(4):101166
The Journal of biological chemistry 2021 Oct;297(4):101166
Attenuation of apoptotic cell detection triggers thymic regeneration after damage.
Kinsella S, Evandy CA, Cooper K, Iovino L, deRoos PC, Hopwo KS, Granadier DW, Smith CW, Rafii S, Dudakov JA
Cell reports 2021 Oct 5;37(1):109789
Cell reports 2021 Oct 5;37(1):109789
c-FOS drives reversible basal to squamous cell carcinoma transition.
Kuonen F, Li NY, Haensel D, Patel T, Gaddam S, Yerly L, Rieger K, Aasi S, Oro AE
Cell reports 2021 Oct 5;37(1):109774
Cell reports 2021 Oct 5;37(1):109774
Differential activation of Ca(2+) influx channels modulate stem cell potency, their proliferation/viability and tissue regeneration.
Ahamad N, Sun Y, Nascimento Da Conceicao V, Xavier Paul Ezhilan CRD, Natarajan M, Singh BB
NPJ Regenerative medicine 2021 Oct 20;6(1):67
NPJ Regenerative medicine 2021 Oct 20;6(1):67
PI3Kδ coordinates transcriptional, chromatin, and metabolic changes to promote effector CD8(+) T cells at the expense of central memory.
Cannons JL, Villarino AV, Kapnick SM, Preite S, Shih HY, Gomez-Rodriguez J, Kaul Z, Shibata H, Reilley JM, Huang B, Handon R, McBain IT, Gossa S, Wu T, Su HC, McGavern DB, O'Shea JJ, McGuire PJ, Uzel G, Schwartzberg PL
Cell reports 2021 Oct 12;37(2):109804
Cell reports 2021 Oct 12;37(2):109804
CD95/Fas protects triple negative breast cancer from anti-tumor activity of NK cells.
Qadir AS, Guégan JP, Ginestier C, Chaibi A, Bessede A, Charafe-Jauffret E, Macario M, Lavoué V, Rouge TM, Law C, Vilker J, Wang H, Stroup E, Schipma MJ, Bridgeman B, Murmann AE, Ji Z, Legembre P, Peter ME
iScience 2021 Nov 19;24(11):103348
iScience 2021 Nov 19;24(11):103348
A TLR7 antagonist restricts interferon-dependent and -independent immunopathology in a mouse model of severe influenza.
Rappe JCF, Finsterbusch K, Crotta S, Mack M, Priestnall SL, Wack A
The Journal of experimental medicine 2021 Nov 1;218(11)
The Journal of experimental medicine 2021 Nov 1;218(11)
Near-infrared photoimmunotherapy targeting human-EGFR in a mouse tumor model simulating current and future clinical trials.
Okada R, Furusawa A, Vermeer DW, Inagaki F, Wakiyama H, Kato T, Nagaya T, Choyke PL, Spanos WC, Allen CT, Kobayashi H
EBioMedicine 2021 May;67:103345
EBioMedicine 2021 May;67:103345
Immuno-Electron and Confocal Laser Scanning Microscopy of the Glycocalyx.
Twamley SG, Stach A, Heilmann H, Söhl-Kielczynski B, Stangl V, Ludwig A, Münster-Wandowski A
Biology 2021 May 4;10(5)
Biology 2021 May 4;10(5)
Simvastatin Enhances the Chondrogenesis But Not the Osteogenesis of Adipose-Derived Stem Cells in a Hyaluronan Microenvironment.
Wu SC, Chang CH, Chang LH, Wu CW, Chen JW, Chen CH, Lin YS, Chang JK, Ho ML
Biomedicines 2021 May 17;9(5)
Biomedicines 2021 May 17;9(5)
miR-34a mimic or pre-mir-34a, which is the better option for cancer therapy? KatoIII as a model to study miRNA action in human gastric cancer cells.
Jafari N, Abediankenari S, Hossein-Nataj H
Cancer cell international 2021 Mar 19;21(1):178
Cancer cell international 2021 Mar 19;21(1):178
Analysis of T cells in mouse lymphoid tissue and blood with flow cytometry.
Skordos I, Demeyer A, Beyaert R
STAR protocols 2021 Mar 19;2(1):100351
STAR protocols 2021 Mar 19;2(1):100351
Synchronous effects of targeted mitochondrial complex I inhibitors on tumor and immune cells abrogate melanoma progression.
AbuEid M, McAllister DM, McOlash L, Harwig MC, Cheng G, Drouillard D, Boyle KA, Hardy M, Zielonka J, Johnson BD, Hill RB, Kalyanaraman B, Dwinell MB
iScience 2021 Jun 25;24(6):102653
iScience 2021 Jun 25;24(6):102653
3-hydroxyanthranic acid increases the sensitivity of hepatocellular carcinoma to sorafenib by decreasing tumor cell stemness.
Gan G, Shi Z, Liu D, Zhang S, Zhu H, Wang Y, Mi J
Cell death discovery 2021 Jul 6;7(1):173
Cell death discovery 2021 Jul 6;7(1):173
Valproic acid stimulates myogenesis in pluripotent stem cell-derived mesodermal progenitors in a NOTCH-dependent manner.
Breuls N, Giarratana N, Yedigaryan L, Garrido GM, Carai P, Heymans S, Ranga A, Deroose C, Sampaolesi M
Cell death & disease 2021 Jul 5;12(7):677
Cell death & disease 2021 Jul 5;12(7):677
Thrombospondin-2 spatiotemporal expression in skeletal fractures.
Zondervan RL, Jenkins DC, Reicha JD, Hankenson KD
Journal of orthopaedic research : official publication of the Orthopaedic Research Society 2021 Jan;39(1):30-41
Journal of orthopaedic research : official publication of the Orthopaedic Research Society 2021 Jan;39(1):30-41
NF-κB-inducing kinase maintains T cell metabolic fitness in antitumor immunity.
Gu M, Zhou X, Sohn JH, Zhu L, Jie Z, Yang JY, Zheng X, Xie X, Yang J, Shi Y, Brightbill HD, Kim JB, Wang J, Cheng X, Sun SC
Nature immunology 2021 Feb;22(2):193-204
Nature immunology 2021 Feb;22(2):193-204
In Vitro Anti-cancer Activity of Adipose-Derived Mesenchymal Stem Cells Increased after Infection with Oncolytic Reovirus.
Babaei A, Bannazadeh Baghi H, Nezhadi A, Jamalpoor Z
Advanced pharmaceutical bulletin 2021 Feb;11(2):361-370
Advanced pharmaceutical bulletin 2021 Feb;11(2):361-370
Therapeutic Potential of Mesenchymal Stem Cells in a Pre-Clinical Model of Diabetic Kidney Disease and Obesity.
Sávio-Silva C, Soinski-Sousa PE, Simplício-Filho A, Bastos RMC, Beyerstedt S, Rangel ÉB
International journal of molecular sciences 2021 Feb 4;22(4)
International journal of molecular sciences 2021 Feb 4;22(4)
Theranostic near-infrared-IIb emitting nanoprobes for promoting immunogenic radiotherapy and abscopal effects against cancer metastasis.
Li H, Wang M, Huang B, Zhu SW, Zhou JJ, Chen DR, Cui R, Zhang M, Sun ZJ
Nature communications 2021 Dec 9;12(1):7149
Nature communications 2021 Dec 9;12(1):7149
Protocols for isolation and characterization of mouse placental hemogenic endothelial cells.
Liang G, Huang B, Wang F, Liu F
STAR protocols 2021 Dec 17;2(4):100884
STAR protocols 2021 Dec 17;2(4):100884
GPR120 induces regulatory dendritic cells by inhibiting HK2-dependent glycolysis to alleviate fulminant hepatic failure.
Yu H, Yang W, Huang J, Miao X, Wang B, Ren X, Gu Y, Wang Q, Ding X, Guo X, Qian F, Zhang Y, Xu H, Zheng L, Jin M
Cell death & disease 2021 Dec 16;13(1):1
Cell death & disease 2021 Dec 16;13(1):1
Chronic T cell proliferation in brains after stroke could interfere with the efficacy of immunotherapies.
Heindl S, Ricci A, Carofiglio O, Zhou Q, Arzberger T, Lenart N, Franzmeier N, Hortobagyi T, Nelson PT, Stowe AM, Denes A, Edbauer D, Liesz A
The Journal of experimental medicine 2021 Aug 2;218(8)
The Journal of experimental medicine 2021 Aug 2;218(8)
Stage-specific action of Runx1 and GATA3 controls silencing of PU.1 expression in mouse pro-T cells.
Hosokawa H, Koizumi M, Masuhara K, Romero-Wolf M, Tanaka T, Nakayama T, Rothenberg EV
The Journal of experimental medicine 2021 Aug 2;218(8)
The Journal of experimental medicine 2021 Aug 2;218(8)
Disruption of the MSL complex inhibits tumour maintenance by exacerbating chromosomal instability.
Monserrat J, Morales Torres C, Richardson L, Wilson TS, Patel H, Domart MC, Horswell S, Song OR, Jiang M, Crawford M, Bui M, Dalal Y, Scaffidi P
Nature cell biology 2021 Apr;23(4):401-412
Nature cell biology 2021 Apr;23(4):401-412
Low immunogenicity of malaria pre-erythrocytic stages can be overcome by vaccination.
Müller K, Gibbins MP, Roberts M, Reyes-Sandoval A, Hill AVS, Draper SJ, Matuschewski K, Silvie O, Hafalla JCR
EMBO molecular medicine 2021 Apr 9;13(4):e13390
EMBO molecular medicine 2021 Apr 9;13(4):e13390
The white matter is a pro-differentiative niche for glioblastoma.
Brooks LJ, Clements MP, Burden JJ, Kocher D, Richards L, Devesa SC, Zakka L, Woodberry M, Ellis M, Jaunmuktane Z, Brandner S, Morrison G, Pollard SM, Dirks PB, Marguerat S, Parrinello S
Nature communications 2021 Apr 12;12(1):2184
Nature communications 2021 Apr 12;12(1):2184
Down-Regulated Exosomal MicroRNA-221 - 3p Derived From Senescent Mesenchymal Stem Cells Impairs Heart Repair.
Sun L, Zhu W, Zhao P, Zhang J, Lu Y, Zhu Y, Zhao W, Liu Y, Chen Q, Zhang F
Frontiers in cell and developmental biology 2020;8:263
Frontiers in cell and developmental biology 2020;8:263
Graphene-based 2D constructs for enhanced fibroblast support.
Safina I, Bourdo SE, Algazali KM, Kannarpady G, Watanabe F, Vang KB, Biris AS
PloS one 2020;15(5):e0232670
PloS one 2020;15(5):e0232670
Utility Evaluation of Porcine Enteroids as PDCoV Infection Model in vitro.
Luo H, Zheng J, Chen Y, Wang T, Zhang Z, Shan Y, Xu J, Yue M, Fang W, Li X
Frontiers in microbiology 2020;11:821
Frontiers in microbiology 2020;11:821
Extracellular HMGB-1 activates inflammatory signaling in tendon cells and tissues.
Zhang C, Gu X, Zhao G, Wang W, Shao J, Zhu J, Yuan T, Sun J, Nie D, Zhou Y
Therapeutic advances in chronic disease 2020;11:2040622320956429
Therapeutic advances in chronic disease 2020;11:2040622320956429
Phosphatase SHP1 impedes mesenchymal stromal cell immunosuppressive capacity modulated by JAK1/STAT3 and P38 signals.
Jiang M, Ye J, Wang X, Li N, Wang Y, Shi Y
Cell & bioscience 2020;10:65
Cell & bioscience 2020;10:65
Dexamethasone inhibits stemness maintenance and enhances chemosensitivity of hepatocellular carcinoma stem cells by inducing deSUMOylation of HIF‑1α and Oct4.
Jiang Z, Zhang C, Liu X, Ma X, Bian X, Xiao X, Gao R, Sun Y, Wu W, Zhao P
International journal of oncology 2020 Sep;57(3):780-790
International journal of oncology 2020 Sep;57(3):780-790
Cancer cells educate natural killer cells to a metastasis-promoting cell state.
Chan IS, Knútsdóttir H, Ramakrishnan G, Padmanaban V, Warrier M, Ramirez JC, Dunworth M, Zhang H, Jaffee EM, Bader JS, Ewald AJ
The Journal of cell biology 2020 Sep 7;219(9)
The Journal of cell biology 2020 Sep 7;219(9)
Diacerein treatment prevents colitis-associated cancer in mice.
Paulino DSM, Mendes MCS, Camargo JA, Brambilla SR, Wood Dos Santos T, Ribeiro ML, Carvalheira JBC
World journal of clinical oncology 2020 Sep 24;11(9):732-746
World journal of clinical oncology 2020 Sep 24;11(9):732-746
Critical role of WNK1 in MYC-dependent early mouse thymocyte development.
Köchl R, Vanes L, Llorian Sopena M, Chakravarty P, Hartweger H, Fountain K, White A, Cowan J, Anderson G, Tybulewicz VL
eLife 2020 Oct 14;9
eLife 2020 Oct 14;9
Resveratrol rescues TNF‑α‑induced inhibition of osteogenesis in human periodontal ligament stem cells via the ERK1/2 pathway.
Yuan J, Wang X, Ma D, Gao H, Zheng D, Zhang J
Molecular medicine reports 2020 May;21(5):2085-2094
Molecular medicine reports 2020 May;21(5):2085-2094
Effect of Combining Low Temperature Plasma, Negative Pressure Wound Therapy, and Bone Marrow Mesenchymal Stem Cells on an Acute Skin Wound Healing Mouse Model.
Cui HS, Joo SY, Cho YS, Park JH, Kim JB, Seo CH
International journal of molecular sciences 2020 May 23;21(10)
International journal of molecular sciences 2020 May 23;21(10)
Tumor Cell Associated Hyaluronan-CD44 Signaling Promotes Pro-Tumor Inflammation in Breast Cancer.
Witschen PM, Chaffee TS, Brady NJ, Huggins DN, Knutson TP, LaRue RS, Munro SA, Tiegs L, McCarthy JB, Nelson AC, Schwertfeger KL
Cancers 2020 May 22;12(5)
Cancers 2020 May 22;12(5)
Localized cocktail chemoimmunotherapy after in situ gelation to trigger robust systemic antitumor immune responses.
Chao Y, Liang C, Tao H, Du Y, Wu D, Dong Z, Jin Q, Chen G, Xu J, Xiao Z, Chen Q, Wang C, Chen J, Liu Z
Science advances 2020 Mar;6(10):eaaz4204
Science advances 2020 Mar;6(10):eaaz4204
miR‑210 enhances mesenchymal stem cell‑modulated neural precursor cell migration.
Wang F, Zhu J, Zheng J, Duan W, Zhou Z
Molecular medicine reports 2020 Jun;21(6):2405-2414
Molecular medicine reports 2020 Jun;21(6):2405-2414
Chronic expression of p16(INK4a) in the epidermis induces Wnt-mediated hyperplasia and promotes tumor initiation.
Azazmeh N, Assouline B, Winter E, Ruppo S, Nevo Y, Maly A, Meir K, Witkiewicz AK, Cohen J, Rizou SV, Pikarsky E, Luxenburg C, Gorgoulis VG, Ben-Porath I
Nature communications 2020 Jun 1;11(1):2711
Nature communications 2020 Jun 1;11(1):2711
Identification, characterization and microRNA expression profiling of side population cells in human oral squamous cell carcinoma Tca8113 cell lines.
Luo W, Liu RS, E LL, Bai Y, Kong XP, Liu HW, Wu H, Liu HC
Molecular medicine reports 2020 Jul;22(1):286-296
Molecular medicine reports 2020 Jul;22(1):286-296
Requirements for the differentiation of innate T-bet(high) memory-phenotype CD4(+) T lymphocytes under steady state.
Kawabe T, Yi J, Kawajiri A, Hilligan K, Fang D, Ishii N, Yamane H, Zhu J, Jankovic D, Kim KS, Trinchieri G, Sher A
Nature communications 2020 Jul 6;11(1):3366
Nature communications 2020 Jul 6;11(1):3366
Mucosal-associated invariant T cells promote inflammation and intestinal dysbiosis leading to metabolic dysfunction during obesity.
Toubal A, Kiaf B, Beaudoin L, Cagninacci L, Rhimi M, Fruchet B, da Silva J, Corbett AJ, Simoni Y, Lantz O, Rossjohn J, McCluskey J, Lesnik P, Maguin E, Lehuen A
Nature communications 2020 Jul 24;11(1):3755
Nature communications 2020 Jul 24;11(1):3755
Head and Neck Cancer Stem Cell-Enriched Spheroid Model for Anticancer Compound Screening.
Goričan L, Gole B, Potočnik U
Cells 2020 Jul 16;9(7)
Cells 2020 Jul 16;9(7)
Distinct roles of PIK3CA in the enrichment and maintenance of cancer stem cells in head and neck squamous cell carcinoma.
Chen X, Cao Y, Sedhom W, Lu L, Liu Y, Wang H, Oka M, Bornstein S, Said S, Song J, Lu SL
Molecular oncology 2020 Jan;14(1):139-158
Molecular oncology 2020 Jan;14(1):139-158
Chemotherapeutic Stress Influences Epithelial-Mesenchymal Transition and Stemness in Cancer Stem Cells of Triple-Negative Breast Cancer.
Li X, Strietz J, Bleilevens A, Stickeler E, Maurer J
International journal of molecular sciences 2020 Jan 8;21(2)
International journal of molecular sciences 2020 Jan 8;21(2)
Pharmacological Activation of Pyruvate Kinase M2 Inhibits CD4(+) T Cell Pathogenicity and Suppresses Autoimmunity.
Angiari S, Runtsch MC, Sutton CE, Palsson-McDermott EM, Kelly B, Rana N, Kane H, Papadopoulou G, Pearce EL, Mills KHG, O'Neill LAJ
Cell metabolism 2020 Feb 4;31(2):391-405.e8
Cell metabolism 2020 Feb 4;31(2):391-405.e8
Efficacy of atovaquone on EpCAM(+)CD44(+) HCT-116 human colon cancer stem cells under hypoxia.
Fu C, Xiao X, Xu H, Lu W, Wang Y
Experimental and therapeutic medicine 2020 Dec;20(6):286
Experimental and therapeutic medicine 2020 Dec;20(6):286
Targeted expression profiling reveals distinct stages of early canine fibroblast reprogramming are regulated by 2-oxoglutarate hydroxylases.
Tobias IC, Kao MC, Parmentier T, Hunter H, LaMarre J, Betts DH
Stem cell research & therapy 2020 Dec 9;11(1):528
Stem cell research & therapy 2020 Dec 9;11(1):528
Antagonistic Inflammatory Phenotypes Dictate Tumor Fate and Response to Immune Checkpoint Blockade.
Bonavita E, Bromley CP, Jonsson G, Pelly VS, Sahoo S, Walwyn-Brown K, Mensurado S, Moeini A, Flanagan E, Bell CR, Chiang SC, Chikkanna-Gowda CP, Rogers N, Silva-Santos B, Jaillon S, Mantovani A, Reis e Sousa C, Guerra N, Davis DM, Zelenay S
Immunity 2020 Dec 15;53(6):1215-1229.e8
Immunity 2020 Dec 15;53(6):1215-1229.e8
Profiling and Targeting of Energy and Redox Metabolism in Grade 2 Bladder Cancer Cells with Different Invasiveness Properties.
Pasquale V, Ducci G, Campioni G, Ventrici A, Assalini C, Busti S, Vanoni M, Vago R, Sacco E
Cells 2020 Dec 11;9(12)
Cells 2020 Dec 11;9(12)
Inhibition of EZH2 ameliorates bacteria-induced liver injury by repressing RUNX1 in dendritic cells.
Wang Y, Wang Q, Wang B, Gu Y, Yu H, Yang W, Ren X, Qian F, Zhao X, Xiao Y, Zhang Y, Jin M, Zhu M
Cell death & disease 2020 Dec 1;11(11):1024
Cell death & disease 2020 Dec 1;11(11):1024
Transfer of metastatic traits via miR-200c in extracellular vesicles derived from colorectal cancer stem cells is inhibited by atractylenolide I.
Tang D, Xu X, Ying J, Xie T, Cao G
Clinical and translational medicine 2020 Aug;10(4):e139
Clinical and translational medicine 2020 Aug;10(4):e139
CCL5 derived from tumor-associated macrophages promotes prostate cancer stem cells and metastasis via activating β-catenin/STAT3 signaling.
Huang R, Wang S, Wang N, Zheng Y, Zhou J, Yang B, Wang X, Zhang J, Guo L, Wang S, Chen Z, Wang Z, Xiang S
Cell death & disease 2020 Apr 16;11(4):234
Cell death & disease 2020 Apr 16;11(4):234
Obesity-Altered Adipose Stem Cells Promote Radiation Resistance of Estrogen Receptor Positive Breast Cancer through Paracrine Signaling.
Sabol RA, Villela VA, Denys A, Freeman BT, Hartono AB, Wise RM, Harrison MAA, Sandler MB, Hossain F, Miele L, Bunnell BA
International journal of molecular sciences 2020 Apr 15;21(8)
International journal of molecular sciences 2020 Apr 15;21(8)
Therapeutic Effects of Human Urine-Derived Stem Cells in a Rat Model of Cisplatin-Induced Acute Kidney Injury In Vivo and In Vitro.
Sun B, Luo X, Yang C, Liu P, Yang Y, Dong X, Yang Z, Xu J, Zhang Y, Li L
Stem cells international 2019;2019:8035076
Stem cells international 2019;2019:8035076
BMX-ARHGAP fusion protein maintains the tumorigenicity of gastric cancer stem cells by activating the JAK/STAT3 signaling pathway.
Xu XF, Gao F, Wang JJ, Long C, Chen X, Tao L, Yang L, Ding L, Ji Y
Cancer cell international 2019;19:133
Cancer cell international 2019;19:133
HMGB3 silence inhibits breast cancer cell proliferation and tumor growth by interacting with hypoxia-inducible factor 1α.
Gu J, Xu T, Huang QH, Zhang CM, Chen HY
Cancer management and research 2019;11:5075-5089
Cancer management and research 2019;11:5075-5089
TGF‑β induces periodontal ligament stem cell senescence through increase of ROS production.
Fan C, Ji Q, Zhang C, Xu S, Sun H, Li Z
Molecular medicine reports 2019 Oct;20(4):3123-3130
Molecular medicine reports 2019 Oct;20(4):3123-3130
The ROP16III-dependent early immune response determines the subacute CNS immune response and type III Toxoplasma gondii survival.
Tuladhar S, Kochanowsky JA, Bhaskara A, Ghotmi Y, Chandrasekaran S, Koshy AA
PLoS pathogens 2019 Oct;15(10):e1007856
PLoS pathogens 2019 Oct;15(10):e1007856
The deubiquitinating enzyme PSMD14 facilitates tumor growth and chemoresistance through stabilizing the ALK2 receptor in the initiation of BMP6 signaling pathway.
Seo D, Jung SM, Park JS, Lee J, Ha J, Kim M, Park SH
EBioMedicine 2019 Nov;49:55-71
EBioMedicine 2019 Nov;49:55-71
Effects of demographic factors on adipogenic and chondrogenic differentiation in bone marrow-derived stem cells.
Lee H, Min SK, Park JB
Experimental and therapeutic medicine 2019 May;17(5):3548-3554
Experimental and therapeutic medicine 2019 May;17(5):3548-3554
Hypoxia changes chemotaxis behaviour of mesenchymal stem cells via HIF-1α signalling.
Xu W, Xu R, Li Z, Wang Y, Hu R
Journal of cellular and molecular medicine 2019 Mar;23(3):1899-1907
Journal of cellular and molecular medicine 2019 Mar;23(3):1899-1907
Better therapeutic potential of bone marrow-derived mesenchymal stem cells compared with chorionic villi-derived mesenchymal stem cells in airway injury model.
Ji S, Wu C, Tong L, Wang L, Zhou J, Chen C, Song Y
Regenerative medicine 2019 Mar;14(3):165-177
Regenerative medicine 2019 Mar;14(3):165-177
Human Pluripotent Stem Cell-Derived Multipotent Vascular Progenitors of the Mesothelium Lineage Have Utility in Tissue Engineering and Repair.
Colunga T, Hayworth M, Kreß S, Reynolds DM, Chen L, Nazor KL, Baur J, Singh AM, Loring JF, Metzger M, Dalton S
Cell reports 2019 Mar 5;26(10):2566-2579.e10
Cell reports 2019 Mar 5;26(10):2566-2579.e10
Growth Factor Screening in Dystrophic Muscles Reveals PDGFB/PDGFRB-Mediated Migration of Interstitial Stem Cells.
Camps J, Grosemans H, Gijsbers R, Maes C, Sampaolesi M
International journal of molecular sciences 2019 Mar 5;20(5)
International journal of molecular sciences 2019 Mar 5;20(5)
ER stress-induced mediator C/EBP homologous protein thwarts effector T cell activity in tumors through T-bet repression.
Cao Y, Trillo-Tinoco J, Sierra RA, Anadon C, Dai W, Mohamed E, Cen L, Costich TL, Magliocco A, Marchion D, Klar R, Michel S, Jaschinski F, Reich RR, Mehrotra S, Cubillos-Ruiz JR, Munn DH, Conejo-Garcia JR, Rodriguez PC
Nature communications 2019 Mar 20;10(1):1280
Nature communications 2019 Mar 20;10(1):1280
BRCA1 regulates the cancer stem cell fate of breast cancer cells in the context of hypoxia and histone deacetylase inhibitors.
Kim H, Lin Q, Yun Z
Scientific reports 2019 Jul 4;9(1):9702
Scientific reports 2019 Jul 4;9(1):9702
Conserved regulation of RNA processing in somatic cell reprogramming.
Kanitz A, Syed AP, Kaji K, Zavolan M
BMC genomics 2019 Jan 31;20(1):100
BMC genomics 2019 Jan 31;20(1):100
Sex Differences in Mouse Popliteal Lymph Nodes.
Dill-Garlow R, Chen KE, Walker AM
Scientific reports 2019 Jan 30;9(1):965
Scientific reports 2019 Jan 30;9(1):965
Overexpression of Aiolos promotes epithelial-mesenchymal transition and cancer stem cell-like properties in lung cancer cells.
Hung JJ, Kao YS, Huang CH, Hsu WH
Scientific reports 2019 Feb 28;9(1):2991
Scientific reports 2019 Feb 28;9(1):2991
A Novel Form of 4-1BBL Prevents Cancer Development via Nonspecific Activation of CD4(+) T and Natural Killer Cells.
Barsoumian HB, Batra L, Shrestha P, Bowen WS, Zhao H, Egilmez NK, Gomez-Gutierrez JG, Yolcu ES, Shirwan H
Cancer research 2019 Feb 15;79(4):783-794
Cancer research 2019 Feb 15;79(4):783-794
Anisomycin inhibits angiogenesis in ovarian cancer by attenuating the molecular sponge effect of the lncRNA‑Meg3/miR‑421/PDGFRA axis.
Ye W, Ni Z, Yicheng S, Pan H, Huang Y, Xiong Y, Liu T
International journal of oncology 2019 Dec;55(6):1296-1312
International journal of oncology 2019 Dec;55(6):1296-1312
Clonal copy-number mosaicism in autoreactive T lymphocytes in diabetic NOD mice.
Alriyami M, Marchand L, Li Q, Du X, Olivier M, Polychronakos C
Genome research 2019 Dec;29(12):1951-1961
Genome research 2019 Dec;29(12):1951-1961
A20 in Myeloid Cells Protects Against Hypertension by Inhibiting Dendritic Cell-Mediated T-Cell Activation.
Lu X, Rudemiller NP, Wen Y, Ren J, Hammer GE, Griffiths R, Privratsky JR, Yang B, Sparks MA, Crowley SD
Circulation research 2019 Dec 6;125(12):1055-1066
Circulation research 2019 Dec 6;125(12):1055-1066
Visfatin Mediates Malignant Behaviors through Adipose-Derived Stem Cells Intermediary in Breast Cancer.
Huang JY, Wang YY, Lo S, Tseng LM, Chen DR, Wu YC, Hou MF, Yuan SF
Cancers 2019 Dec 20;12(1)
Cancers 2019 Dec 20;12(1)
LGR5, a novel functional glioma stem cell marker, promotes EMT by activating the Wnt/β-catenin pathway and predicts poor survival of glioma patients.
Zhang J, Cai H, Sun L, Zhan P, Chen M, Zhang F, Ran Y, Wan J
Journal of experimental & clinical cancer research : CR 2018 Sep 12;37(1):225
Journal of experimental & clinical cancer research : CR 2018 Sep 12;37(1):225
Modifying the cancer-immune set point using vaccinia virus expressing re-designed interleukin-2.
Liu Z, Ge Y, Wang H, Ma C, Feist M, Ju S, Guo ZS, Bartlett DL
Nature communications 2018 Nov 8;9(1):4682
Nature communications 2018 Nov 8;9(1):4682
Inhibition of Fas associated phosphatase 1 (Fap1) facilitates apoptosis of colon cancer stem cells and enhances the effects of oxaliplatin.
Huang W, Bei L, Eklund EA
Oncotarget 2018 May 25;9(40):25891-25902
Oncotarget 2018 May 25;9(40):25891-25902
Mutant p53 gain of function underlies high expression levels of colorectal cancer stem cells markers.
Solomon H, Dinowitz N, Pateras IS, Cooks T, Shetzer Y, Molchadsky A, Charni M, Rabani S, Koifman G, Tarcic O, Porat Z, Kogan-Sakin I, Goldfinger N, Oren M, Harris CC, Gorgoulis VG, Rotter V
Oncogene 2018 Mar;37(12):1669-1684
Oncogene 2018 Mar;37(12):1669-1684
The hypoxic tumor microenvironment in vivo selects the cancer stem cell fate of breast cancer cells.
Kim H, Lin Q, Glazer PM, Yun Z
Breast cancer research : BCR 2018 Mar 6;20(1):16
Breast cancer research : BCR 2018 Mar 6;20(1):16
Oncofetal gene SALL4 reactivation by hepatitis B virus counteracts miR-200c in PD-L1-induced T cell exhaustion.
Sun C, Lan P, Han Q, Huang M, Zhang Z, Xu G, Song J, Wang J, Wei H, Zhang J, Sun R, Zhang C, Tian Z
Nature communications 2018 Mar 28;9(1):1241
Nature communications 2018 Mar 28;9(1):1241
RhoA, Rac1, and Cdc42 differentially regulate αSMA and collagen I expression in mesenchymal stem cells.
Ge J, Burnier L, Adamopoulou M, Kwa MQ, Schaks M, Rottner K, Brakebusch C
The Journal of biological chemistry 2018 Jun 15;293(24):9358-9369
The Journal of biological chemistry 2018 Jun 15;293(24):9358-9369
An alternative splicing switch in FLNB promotes the mesenchymal cell state in human breast cancer.
Li J, Choi PS, Chaffer CL, Labella K, Hwang JH, Giacomelli AO, Kim JW, Ilic N, Doench JG, Ly SH, Dai C, Hagel K, Hong AL, Gjoerup O, Goel S, Ge JY, Root DE, Zhao JJ, Brooks AN, Weinberg RA, Hahn WC
eLife 2018 Jul 30;7
eLife 2018 Jul 30;7
mTOR Modulates CD8+ T Cell Differentiation in Mice with Invasive Pulmonary Aspergillosis.
Wang H, Xiao Y, Su L, Cui N, Liu D
Open life sciences 2018 Jan;13:129-136
Open life sciences 2018 Jan;13:129-136
Tanshinone IIA and Astragaloside IV promote the angiogenesis of mesenchymal stem cell-derived endothelial cell-like cells via upregulation of Cx37, Cx40 and Cx43.
Li Z, Zhang S, Cao L, Li W, Ye YC, Shi ZX, Wang ZR, Sun LX, Wang JW, Jia LT, Wang W
Experimental and therapeutic medicine 2018 Feb;15(2):1847-1854
Experimental and therapeutic medicine 2018 Feb;15(2):1847-1854
Polymethoxylated Flavones from Orange Peels Inhibit Cell Proliferation in a 3D Cell Model of Human Colorectal Cancer.
Silva I, Estrada MF, V Pereira C, da Silva AB, Bronze MR, Alves PM, Duarte CMM, Brito C, Serra AT
Nutrition and cancer 2018 Feb-Mar;70(2):257-266
Nutrition and cancer 2018 Feb-Mar;70(2):257-266
SUV420H2 is an epigenetic regulator of epithelial/mesenchymal states in pancreatic cancer.
Viotti M, Wilson C, McCleland M, Koeppen H, Haley B, Jhunjhunwala S, Klijn C, Modrusan Z, Arnott D, Classon M, Stephan JP, Mellman I
The Journal of cell biology 2018 Feb 5;217(2):763-777
The Journal of cell biology 2018 Feb 5;217(2):763-777
Bryostatin-1 alleviates experimental multiple sclerosis.
Kornberg MD, Smith MD, Shirazi HA, Calabresi PA, Snyder SH, Kim PM
Proceedings of the National Academy of Sciences of the United States of America 2018 Feb 27;115(9):2186-2191
Proceedings of the National Academy of Sciences of the United States of America 2018 Feb 27;115(9):2186-2191
Foxp3 expression in induced regulatory T cells is stabilized by C/EBP in inflammatory environments.
Lee S, Park K, Kim J, Min H, Seong RH
EMBO reports 2018 Dec;19(12)
EMBO reports 2018 Dec;19(12)
Selective Export into Extracellular Vesicles and Function of tRNA Fragments during T Cell Activation.
Chiou NT, Kageyama R, Ansel KM
Cell reports 2018 Dec 18;25(12):3356-3370.e4
Cell reports 2018 Dec 18;25(12):3356-3370.e4
Glutamic Pyruvate Transaminase GPT2 Promotes Tumorigenesis of Breast Cancer Cells by Activating Sonic Hedgehog Signaling.
Cao Y, Lin SH, Wang Y, Chin YE, Kang L, Mi J
Theranostics 2017;7(12):3021-3033
Theranostics 2017;7(12):3021-3033
Zoledronate suppressed angiogenesis and osteogenesis by inhibiting osteoclasts formation and secretion of PDGF-BB.
Gao SY, Zheng GS, Wang L, Liang YJ, Zhang SE, Lao XM, Li K, Liao GQ
PloS one 2017;12(6):e0179248
PloS one 2017;12(6):e0179248
Targeted genome editing restores T cell differentiation in a humanized X-SCID pluripotent stem cell disease model.
Alzubi J, Pallant C, Mussolino C, Howe SJ, Thrasher AJ, Cathomen T
Scientific reports 2017 Sep 29;7(1):12475
Scientific reports 2017 Sep 29;7(1):12475
Extrafollicular CD4(+) T-B interactions are sufficient for inducing autoimmune-like chronic graft-versus-host disease.
Deng R, Hurtz C, Song Q, Yue C, Xiao G, Yu H, Wu X, Muschen M, Forman S, Martin PJ, Zeng D
Nature communications 2017 Oct 17;8(1):978
Nature communications 2017 Oct 17;8(1):978
Tristetraprolin inhibits macrophage IL-27-induced activation of antitumour cytotoxic T cell responses.
Wang Q, Ning H, Peng H, Wei L, Hou R, Hoft DF, Liu J
Nature communications 2017 Oct 11;8(1):867
Nature communications 2017 Oct 11;8(1):867
IL-7-dependent STAT1 activation limits homeostatic CD4+ T cell expansion.
Le Saout C, Luckey MA, Villarino AV, Smith M, Hasley RB, Myers TG, Imamichi H, Park JH, O'Shea JJ, Lane HC, Catalfamo M
JCI insight 2017 Nov 16;2(22)
JCI insight 2017 Nov 16;2(22)
Role of Triggering Receptor Expressed on Myeloid Cell-1 Expression in Mammalian Target of Rapamycin Modulation of CD8(+) T-cell Differentiation during the Immune Response to Invasive Pulmonary Aspergillosis.
Cui N, Wang H, Su LX, Zhang JH, Long Y, Liu DW
Chinese medical journal 2017 May 20;130(10):1211-1217
Chinese medical journal 2017 May 20;130(10):1211-1217
SOCS3 treatment prevents the development of alopecia areata by inhibiting CD8+ T cell-mediated autoimmune destruction.
Gao Z, Jin YQ, Wu W
Oncotarget 2017 May 16;8(20):33432-33443
Oncotarget 2017 May 16;8(20):33432-33443
A high-yield isolation and enrichment strategy for human lung microvascular endothelial cells.
Gaskill C, Majka SM
Pulmonary circulation 2017 Mar;7(1):108-116
Pulmonary circulation 2017 Mar;7(1):108-116
Integrin-β4 identifies cancer stem cell-enriched populations of partially mesenchymal carcinoma cells.
Bierie B, Pierce SE, Kroeger C, Stover DG, Pattabiraman DR, Thiru P, Liu Donaher J, Reinhardt F, Chaffer CL, Keckesova Z, Weinberg RA
Proceedings of the National Academy of Sciences of the United States of America 2017 Mar 21;114(12):E2337-E2346
Proceedings of the National Academy of Sciences of the United States of America 2017 Mar 21;114(12):E2337-E2346
Egr2 and 3 control adaptive immune responses by temporally uncoupling expansion from T cell differentiation.
Miao T, Symonds ALJ, Singh R, Symonds JD, Ogbe A, Omodho B, Zhu B, Li S, Wang P
The Journal of experimental medicine 2017 Jun 5;214(6):1787-1808
The Journal of experimental medicine 2017 Jun 5;214(6):1787-1808
Excessive expression of miR-27 impairs Treg-mediated immunological tolerance.
Cruz LO, Hashemifar SS, Wu CJ, Cho S, Nguyen DT, Lin LL, Khan AA, Lu LF
The Journal of clinical investigation 2017 Feb 1;127(2):530-542
The Journal of clinical investigation 2017 Feb 1;127(2):530-542
Constitutively Active SMAD2/3 Are Broad-Scope Potentiators of Transcription-Factor-Mediated Cellular Reprogramming.
Ruetz T, Pfisterer U, Di Stefano B, Ashmore J, Beniazza M, Tian TV, Kaemena DF, Tosti L, Tan W, Manning JR, Chantzoura E, Ottosson DR, Collombet S, Johnsson A, Cohen E, Yusa K, Linnarsson S, Graf T, Parmar M, Kaji K
Cell stem cell 2017 Dec 7;21(6):791-805.e9
Cell stem cell 2017 Dec 7;21(6):791-805.e9
ST6GALNAC1 plays important roles in enhancing cancer stem phenotypes of colorectal cancer via the Akt pathway.
Ogawa T, Hirohashi Y, Murai A, Nishidate T, Okita K, Wang L, Ikehara Y, Satoyoshi T, Usui A, Kubo T, Nakastugawa M, Kanaseki T, Tsukahara T, Kutomi G, Furuhata T, Hirata K, Sato N, Mizuguchi T, Takemasa I, Torigoe T
Oncotarget 2017 Dec 22;8(68):112550-112564
Oncotarget 2017 Dec 22;8(68):112550-112564
Antibody Tumor Targeting Is Enhanced by CD27 Agonists through Myeloid Recruitment.
Turaj AH, Hussain K, Cox KL, Rose-Zerilli MJJ, Testa J, Dahal LN, Chan HTC, James S, Field VL, Carter MJ, Kim HJ, West JJ, Thomas LJ, He LZ, Keler T, Johnson PWM, Al-Shamkhani A, Thirdborough SM, Beers SA, Cragg MS, Glennie MJ, Lim SH
Cancer cell 2017 Dec 11;32(6):777-791.e6
Cancer cell 2017 Dec 11;32(6):777-791.e6
The Ox40/Ox40 Ligand Pathway Promotes Pathogenic Th Cell Responses, Plasmablast Accumulation, and Lupus Nephritis in NZB/W F1 Mice.
Sitrin J, Suto E, Wuster A, Eastham-Anderson J, Kim JM, Austin CD, Lee WP, Behrens TW
Journal of immunology (Baltimore, Md. : 1950) 2017 Aug 15;199(4):1238-1249
Journal of immunology (Baltimore, Md. : 1950) 2017 Aug 15;199(4):1238-1249
Androgen receptor in cancer-associated fibroblasts influences stemness in cancer cells.
Liao CP, Chen LY, Luethy A, Kim Y, Kani K, MacLeod AR, Gross ME
Endocrine-related cancer 2017 Apr;24(4):157-170
Endocrine-related cancer 2017 Apr;24(4):157-170
Comparison of Four Protocols to Generate Chondrocyte-Like Cells from Human Induced Pluripotent Stem Cells (hiPSCs).
Suchorska WM, Augustyniak E, Richter M, Trzeciak T
Stem cell reviews and reports 2017 Apr;13(2):299-308
Stem cell reviews and reports 2017 Apr;13(2):299-308
Llgl1 prevents metaplastic survival driven by epidermal growth factor dependent migration.
Greenwood E, Maisel S, Ebertz D, Russ A, Pandey R, Schroeder J
Oncotarget 2016 Sep 20;7(38):60776-60792
Oncotarget 2016 Sep 20;7(38):60776-60792
Comparable roles of CD44v8-10 and CD44s in the development of bone metastases in a mouse model.
Hiraga T, Nakamura H
Oncology letters 2016 Oct;12(4):2962-2969
Oncology letters 2016 Oct;12(4):2962-2969
Sertoli cell condition medium can induce germ like cells from bone marrow derived mesenchymal stem cells.
Monfared MH, Minaee B, Rastegar T, Khrazinejad E, Barbarestani M
Iranian journal of basic medical sciences 2016 Nov;19(11):1186-1192
Iranian journal of basic medical sciences 2016 Nov;19(11):1186-1192
SOX2 and PI3K Cooperate to Induce and Stabilize a Squamous-Committed Stem Cell Injury State during Lung Squamous Cell Carcinoma Pathogenesis.
Kim BR, Van de Laar E, Cabanero M, Tarumi S, Hasenoeder S, Wang D, Virtanen C, Suzuki T, Bandarchi B, Sakashita S, Pham NA, Lee S, Keshavjee S, Waddell TK, Tsao MS, Moghal N
PLoS biology 2016 Nov;14(11):e1002581
PLoS biology 2016 Nov;14(11):e1002581
Stem Cells Antigen-1 Enriches for a Cancer Stem Cell-Like Subpopulation in Mouse Gastric Cancer.
Park JW, Park JM, Park DM, Kim DY, Kim HK
Stem cells (Dayton, Ohio) 2016 May;34(5):1177-87
Stem cells (Dayton, Ohio) 2016 May;34(5):1177-87
PRDM14 promotes RAG-dependent Notch1 driver mutations in mouse T-ALL.
Carofino BL, Ayanga B, Tracey LJ, Brooke-Bisschop T, Justice MJ
Biology open 2016 May 15;5(5):645-53
Biology open 2016 May 15;5(5):645-53
Cryptotanshinone targets tumor-initiating cells through down-regulation of stemness genes expression.
Zhang Y, Cabarcas SM, Zheng JI, Sun L, Mathews LA, Zhang X, Lin H, Farrar WL
Oncology letters 2016 Jun;11(6):3803-3812
Oncology letters 2016 Jun;11(6):3803-3812
Treg engage lymphotoxin beta receptor for afferent lymphatic transendothelial migration.
Brinkman CC, Iwami D, Hritzo MK, Xiong Y, Ahmad S, Simon T, Hippen KL, Blazar BR, Bromberg JS
Nature communications 2016 Jun 21;7:12021
Nature communications 2016 Jun 21;7:12021
The Z-cad dual fluorescent sensor detects dynamic changes between the epithelial and mesenchymal cellular states.
Toneff MJ, Sreekumar A, Tinnirello A, Hollander PD, Habib S, Li S, Ellis MJ, Xin L, Mani SA, Rosen JM
BMC biology 2016 Jun 17;14:47
BMC biology 2016 Jun 17;14:47
Oligodendrocyte death results in immune-mediated CNS demyelination.
Traka M, Podojil JR, McCarthy DP, Miller SD, Popko B
Nature neuroscience 2016 Jan;19(1):65-74
Nature neuroscience 2016 Jan;19(1):65-74
Effects of nerve growth factor and basic fibroblast growth factor dual gene modification on rat bone marrow mesenchymal stem cell differentiation into neuron-like cells in vitro.
Hu Y, Zhang Y, Tian K, Xun C, Wang S, Lv D
Molecular medicine reports 2016 Jan;13(1):49-58
Molecular medicine reports 2016 Jan;13(1):49-58
Equine-Induced Pluripotent Stem Cells Retain Lineage Commitment Toward Myogenic and Chondrogenic Fates.
Quattrocelli M, Giacomazzi G, Broeckx SY, Ceelen L, Bolca S, Spaas JH, Sampaolesi M
Stem cell reports 2016 Jan 12;6(1):55-63
Stem cell reports 2016 Jan 12;6(1):55-63
Breast cancer stem cells expressing different stem cell markers exhibit distinct biological characteristics.
Shao J, Fan W, Ma B, Wu Y
Molecular medicine reports 2016 Dec;14(6):4991-4998
Molecular medicine reports 2016 Dec;14(6):4991-4998
A cell-autonomous tumour suppressor role of RAF1 in hepatocarcinogenesis.
Jeric I, Maurer G, Cavallo AL, Raguz J, Desideri E, Tarkowski B, Parrini M, Fischer I, Zatloukal K, Baccarini M
Nature communications 2016 Dec 21;7:13781
Nature communications 2016 Dec 21;7:13781
Resident T Cells Are Unable To Control Herpes Simplex Virus-1 Activity in the Brain Ependymal Region during Latency.
Menendez CM, Jinkins JK, Carr DJ
Journal of immunology (Baltimore, Md. : 1950) 2016 Aug 15;197(4):1262-75
Journal of immunology (Baltimore, Md. : 1950) 2016 Aug 15;197(4):1262-75
Identification and validation of multiple cell surface markers of clinical-grade adipose-derived mesenchymal stromal cells as novel release criteria for good manufacturing practice-compliant production.
Camilleri ET, Gustafson MP, Dudakovic A, Riester SM, Garces CG, Paradise CR, Takai H, Karperien M, Cool S, Sampen HJ, Larson AN, Qu W, Smith J, Dietz AB, van Wijnen AJ
Stem cell research & therapy 2016 Aug 11;7(1):107
Stem cell research & therapy 2016 Aug 11;7(1):107
Multi-lineage differentiation of human umbilical cord Wharton's Jelly Mesenchymal Stromal Cells mediates changes in the expression profile of stemness markers.
Ali H, Al-Yatama MK, Abu-Farha M, Behbehani K, Al Madhoun A
PloS one 2015;10(4):e0122465
PloS one 2015;10(4):e0122465
Reprogramming Roadblocks Are System Dependent.
Chantzoura E, Skylaki S, Menendez S, Kim SI, Johnsson A, Linnarsson S, Woltjen K, Chambers I, Kaji K
Stem cell reports 2015 Sep 8;5(3):350-64
Stem cell reports 2015 Sep 8;5(3):350-64
Anisotropic stress orients remodelling of mammalian limb bud ectoderm.
Lau K, Tao H, Liu H, Wen J, Sturgeon K, Sorfazlian N, Lazic S, Burrows JT, Wong MD, Li D, Deimling S, Ciruna B, Scott I, Simmons C, Henkelman RM, Williams T, Hadjantonakis AK, Fernandez-Gonzalez R, Sun Y, Hopyan S
Nature cell biology 2015 May;17(5):569-79
Nature cell biology 2015 May;17(5):569-79
Special AT-rich sequence-binding protein-1 participates in the maintenance of breast cancer stem cells through regulation of the Notch signaling pathway and expression of Snail1 and Twist1.
Sun Z, Zhang C, Zou X, Jiang G, Xu Z, Li W, Xie H
Molecular medicine reports 2015 May;11(5):3235-542
Molecular medicine reports 2015 May;11(5):3235-542
Human adipose-derived stem cells partially rescue the stroke syndromes by promoting spatial learning and memory in mouse middle cerebral artery occlusion model.
Zhou F, Gao S, Wang L, Sun C, Chen L, Yuan P, Zhao H, Yi Y, Qin Y, Dong Z, Cao L, Ren H, Zhu L, Li Q, Lu B, Liang A, Xu GT, Zhu H, Gao Z, Ma J, Xu J, Chen X
Stem cell research & therapy 2015 May 9;6(1):92
Stem cell research & therapy 2015 May 9;6(1):92
Manic fringe promotes a claudin-low breast cancer phenotype through notch-mediated PIK3CG induction.
Zhang S, Chung WC, Wu G, Egan SE, Miele L, Xu K
Cancer research 2015 May 15;75(10):1936-43
Cancer research 2015 May 15;75(10):1936-43
Enrichment of Human Stem-Like Prostate Cells with s-SHIP Promoter Activity Uncovers a Role in Stemness for the Long Noncoding RNA H19.
Bauderlique-Le Roy H, Vennin C, Brocqueville G, Spruyt N, Adriaenssens E, Bourette RP
Stem cells and development 2015 May 15;24(10):1252-62
Stem cells and development 2015 May 15;24(10):1252-62
Multi-Drug Resistance ABC Transporter Inhibition Enhances Murine Ventral Prostate Stem/Progenitor Cell Differentiation.
Samant MD, Jackson CM, Felix CL, Jones AJ, Goodrich DW, Foster BA, Huss WJ
Stem cells and development 2015 May 15;24(10):1236-51
Stem cells and development 2015 May 15;24(10):1236-51
Mesodermal iPSC-derived progenitor cells functionally regenerate cardiac and skeletal muscle.
Quattrocelli M, Swinnen M, Giacomazzi G, Camps J, Barthélemy I, Ceccarelli G, Caluwé E, Grosemans H, Thorrez L, Pelizzo G, Muijtjens M, Verfaillie CM, Blot S, Janssens S, Sampaolesi M
The Journal of clinical investigation 2015 Dec;125(12):4463-82
The Journal of clinical investigation 2015 Dec;125(12):4463-82
Amniotic fluid stem cells prevent follicle atresia and rescue fertility of mice with premature ovarian failure induced by chemotherapy.
Xiao GY, Liu IH, Cheng CC, Chang CC, Lee YH, Cheng WT, Wu SC
PloS one 2014;9(9):e106538
PloS one 2014;9(9):e106538
Oncogene ablation-resistant pancreatic cancer cells depend on mitochondrial function.
Viale A, Pettazzoni P, Lyssiotis CA, Ying H, Sánchez N, Marchesini M, Carugo A, Green T, Seth S, Giuliani V, Kost-Alimova M, Muller F, Colla S, Nezi L, Genovese G, Deem AK, Kapoor A, Yao W, Brunetto E, Kang Y, Yuan M, Asara JM, Wang YA, Heffernan TP, Kimmelman AC, Wang H, Fleming JB, Cantley LC, DePinho RA, Draetta GF
Nature 2014 Oct 30;514(7524):628-32
Nature 2014 Oct 30;514(7524):628-32
FOXF1 mediates mesenchymal stem cell fusion-induced reprogramming of lung cancer cells.
Wei HJ, Nickoloff JA, Chen WH, Liu HY, Lo WC, Chang YT, Yang PC, Wu CW, Williams DF, Gelovani JG, Deng WP
Oncotarget 2014 Oct 15;5(19):9514-29
Oncotarget 2014 Oct 15;5(19):9514-29
Validation of the effects of TGF-β1 on tumor recurrence and prognosis through tumor retrieval and cell mechanical properties.
Wu TH, Chou YW, Chiu PH, Tang MJ, Hu CW, Yeh ML
Cancer cell international 2014 Mar 3;14(1):20
Cancer cell international 2014 Mar 3;14(1):20
Tumor-suppressive activity of Lunatic Fringe in prostate through differential modulation of Notch receptor activation.
Zhang S, Chung WC, Wu G, Egan SE, Xu K
Neoplasia (New York, N.Y.) 2014 Feb;16(2):158-67
Neoplasia (New York, N.Y.) 2014 Feb;16(2):158-67
Serum- and growth-factor-free three-dimensional culture system supports cartilage tissue formation by promoting collagen synthesis via Sox9-Col2a1 interaction.
Ahmed N, Iu J, Brown CE, Taylor DW, Kandel RA
Tissue engineering. Part A 2014 Aug;20(15-16):2224-33
Tissue engineering. Part A 2014 Aug;20(15-16):2224-33
Microvesicles derived from human umbilical cord Wharton's jelly mesenchymal stem cells attenuate bladder tumor cell growth in vitro and in vivo.
Wu S, Ju GQ, Du T, Zhu YJ, Liu GH
PloS one 2013;8(4):e61366
PloS one 2013;8(4):e61366
Evidence for a multipotent mammary progenitor with pregnancy-specific activity.
Kaanta AS, Virtanen C, Selfors LM, Brugge JS, Neel BG
Breast cancer research : BCR 2013;15(4):R65
Breast cancer research : BCR 2013;15(4):R65
miR-126 and miR-126* repress recruitment of mesenchymal stem cells and inflammatory monocytes to inhibit breast cancer metastasis.
Zhang Y, Yang P, Sun T, Li D, Xu X, Rui Y, Li C, Chong M, Ibrahim T, Mercatali L, Amadori D, Lu X, Xie D, Li QJ, Wang XF
Nature cell biology 2013 Mar;15(3):284-94
Nature cell biology 2013 Mar;15(3):284-94
Increased invasion and tumorigenicity capacity of CD44+/CD24- breast cancer MCF7 cells in vitro and in nude mice.
Yan W, Chen Y, Yao Y, Zhang H, Wang T
Cancer cell international 2013 Jun 24;13(1):62
Cancer cell international 2013 Jun 24;13(1):62
High-resolution analysis with novel cell-surface markers identifies routes to iPS cells.
O'Malley J, Skylaki S, Iwabuchi KA, Chantzoura E, Ruetz T, Johnsson A, Tomlinson SR, Linnarsson S, Kaji K
Nature 2013 Jul 4;499(7456):88-91
Nature 2013 Jul 4;499(7456):88-91
Minor cell-death defects but reduced tumor latency in mice lacking the BH3-only proteins Bad and Bmf.
Baumgartner F, Woess C, Pedit V, Tzankov A, Labi V, Villunger A
Oncogene 2013 Jan 31;32(5):621-30
Oncogene 2013 Jan 31;32(5):621-30
Inhibiting interactions of lysine demethylase LSD1 with snail/slug blocks cancer cell invasion.
Ferrari-Amorotti G, Fragliasso V, Esteki R, Prudente Z, Soliera AR, Cattelani S, Manzotti G, Grisendi G, Dominici M, Pieraccioli M, Raschellà G, Chiodoni C, Colombo MP, Calabretta B
Cancer research 2013 Jan 1;73(1):235-45
Cancer research 2013 Jan 1;73(1):235-45
GATA3 suppresses metastasis and modulates the tumour microenvironment by regulating microRNA-29b expression.
Chou J, Lin JH, Brenot A, Kim JW, Provot S, Werb Z
Nature cell biology 2013 Feb;15(2):201-13
Nature cell biology 2013 Feb;15(2):201-13
Distinct fibroblast lineages determine dermal architecture in skin development and repair.
Driskell RR, Lichtenberger BM, Hoste E, Kretzschmar K, Simons BD, Charalambous M, Ferron SR, Herault Y, Pavlovic G, Ferguson-Smith AC, Watt FM
Nature 2013 Dec 12;504(7479):277-281
Nature 2013 Dec 12;504(7479):277-281
Phenotypic CD8+ T cell diversification occurs before, during, and after the first T cell division.
Lemaître F, Moreau HD, Vedele L, Bousso P
Journal of immunology (Baltimore, Md. : 1950) 2013 Aug 15;191(4):1578-85
Journal of immunology (Baltimore, Md. : 1950) 2013 Aug 15;191(4):1578-85
Estrogen and progesterone together expand murine endometrial epithelial progenitor cells.
Janzen DM, Cheng D, Schafenacker AM, Paik DY, Goldstein AS, Witte ON, Jaroszewicz A, Pellegrini M, Memarzadeh S
Stem cells (Dayton, Ohio) 2013 Apr;31(4):808-22
Stem cells (Dayton, Ohio) 2013 Apr;31(4):808-22
The CD44+ ALDH+ population of human keratinocytes is enriched for epidermal stem cells with long-term repopulating ability.
Szabo AZ, Fong S, Yue L, Zhang K, Strachan LR, Scalapino K, Mancianti ML, Ghadially R
Stem cells (Dayton, Ohio) 2013 Apr;31(4):786-99
Stem cells (Dayton, Ohio) 2013 Apr;31(4):786-99
Phenotypic conversions of "protoplasmic" to "reactive" astrocytes in Alexander disease.
Sosunov AA, Guilfoyle E, Wu X, McKhann GM 2nd, Goldman JE
The Journal of neuroscience : the official journal of the Society for Neuroscience 2013 Apr 24;33(17):7439-50
The Journal of neuroscience : the official journal of the Society for Neuroscience 2013 Apr 24;33(17):7439-50
Stem-like epithelial cells are concentrated in the distal end of the fallopian tube: a site for injury and serous cancer initiation.
Paik DY, Janzen DM, Schafenacker AM, Velasco VS, Shung MS, Cheng D, Huang J, Witte ON, Memarzadeh S
Stem cells (Dayton, Ohio) 2012 Nov;30(11):2487-97
Stem cells (Dayton, Ohio) 2012 Nov;30(11):2487-97
Increased protection from vaccinia virus infection in mice genetically prone to lymphoproliferative disorders.
Seedhom MO, Mathurin KS, Kim SK, Welsh RM
Journal of virology 2012 Jun;86(11):6010-22
Journal of virology 2012 Jun;86(11):6010-22
Arthritogenic self-reactive CD4+ T cells acquire an FR4hiCD73hi anergic state in the presence of Foxp3+ regulatory T cells.
Martinez RJ, Zhang N, Thomas SR, Nandiwada SL, Jenkins MK, Binstadt BA, Mueller DL
Journal of immunology (Baltimore, Md. : 1950) 2012 Jan 1;188(1):170-81
Journal of immunology (Baltimore, Md. : 1950) 2012 Jan 1;188(1):170-81
The high and low molecular weight forms of hyaluronan have distinct effects on CD44 clustering.
Yang C, Cao M, Liu H, He Y, Xu J, Du Y, Liu Y, Wang W, Cui L, Hu J, Gao F
The Journal of biological chemistry 2012 Dec 14;287(51):43094-107
The Journal of biological chemistry 2012 Dec 14;287(51):43094-107
GLI1 confers profound phenotypic changes upon LNCaP prostate cancer cells that include the acquisition of a hormone independent state.
Nadendla SK, Hazan A, Ward M, Harper LJ, Moutasim K, Bianchi LS, Naase M, Ghali L, Thomas GJ, Prowse DM, Philpott MP, Neill GW
PloS one 2011;6(5):e20271
PloS one 2011;6(5):e20271
High levels of the adhesion molecule CD44 on leukemic cells generate acute myeloid leukemia relapse after withdrawal of the initial transforming event.
Quéré R, Andradottir S, Brun AC, Zubarev RA, Karlsson G, Olsson K, Magnusson M, Cammenga J, Karlsson S
Leukemia 2011 Mar;25(3):515-26
Leukemia 2011 Mar;25(3):515-26
PTEN loss accelerates KrasG12D-induced pancreatic cancer development.
Hill R, Calvopina JH, Kim C, Wang Y, Dawson DW, Donahue TR, Dry S, Wu H
Cancer research 2010 Sep 15;70(18):7114-24
Cancer research 2010 Sep 15;70(18):7114-24
CD44 expression is developmentally regulated in the mouse lens and increases in the lens epithelium after injury.
Desai VD, Wang Y, Simirskii VN, Duncan MK
Differentiation; research in biological diversity 2010 Feb;79(2):111-9
Differentiation; research in biological diversity 2010 Feb;79(2):111-9
Two host factors regulate persistence of H7-specific T cells injected in tumor-bearing mice.
Meunier MC, Baron C, Perreault C
PloS one 2009;4(1):e4116
PloS one 2009;4(1):e4116
Effects of Culturing on the Stability of the Putative Murine Adipose Derived Stem Cells Markers.
Maddox JR, Liao X, Li F, Niyibizi C
The open stem cell journal 2009 Jan 1;1:54-61
The open stem cell journal 2009 Jan 1;1:54-61
Modulation of naive CD4+ T-cell responses to an airway antigen during pulmonary mycobacterial infection.
Anis MM, Fulton SA, Reba SM, Harding CV, Boom WH
Infection and immunity 2007 May;75(5):2260-8
Infection and immunity 2007 May;75(5):2260-8
Msx2-interacting nuclear target protein (Mint) deficiency reveals negative regulation of early thymocyte differentiation by Notch/RBP-J signaling.
Tsuji M, Shinkura R, Kuroda K, Yabe D, Honjo T
Proceedings of the National Academy of Sciences of the United States of America 2007 Jan 30;104(5):1610-5
Proceedings of the National Academy of Sciences of the United States of America 2007 Jan 30;104(5):1610-5
No comments: Submit comment
Supportive validation
- Submitted by
- Invitrogen Antibodies (provider)
- Main image
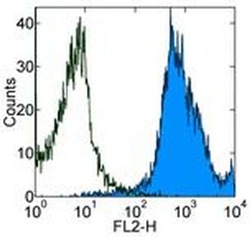
- Experimental details
- Staining of C57BL/6 splenocytes with 0.06 µg of Rat IgG2b kappa Isotype Control Biotin (Product # 13-4031-82) (open histogram) or 0.06 µg of Anti-Human/Mouse CD44 Biotin (filled histogram) followed by Streptavidin PE (Product # 12-4317-87). Total viable cells were used for analysis.
- Conjugate
- Biotin

- Submitted by
- Invitrogen Antibodies (provider)
- Main image
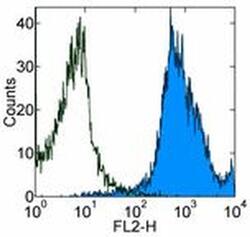
- Experimental details
- Staining of C57BL/6 splenocytes with 0.06 µg of Rat IgG2b kappa Isotype Control Biotin (Product # 13-4031-82) (open histogram) or 0.06 µg of Anti-Human/Mouse CD44 Biotin (filled histogram) followed by Streptavidin PE (Product # 12-4317-87). Total viable cells were used for analysis.
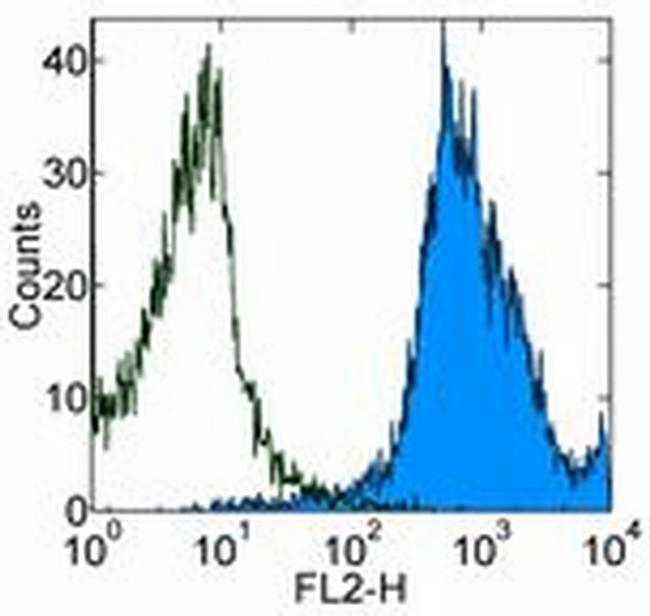
Supportive validation
- Submitted by
- Invitrogen Antibodies (provider)
- Main image
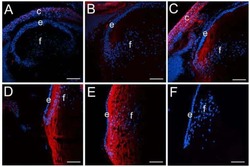
- Experimental details
- NULL
- Conjugate
- Biotin
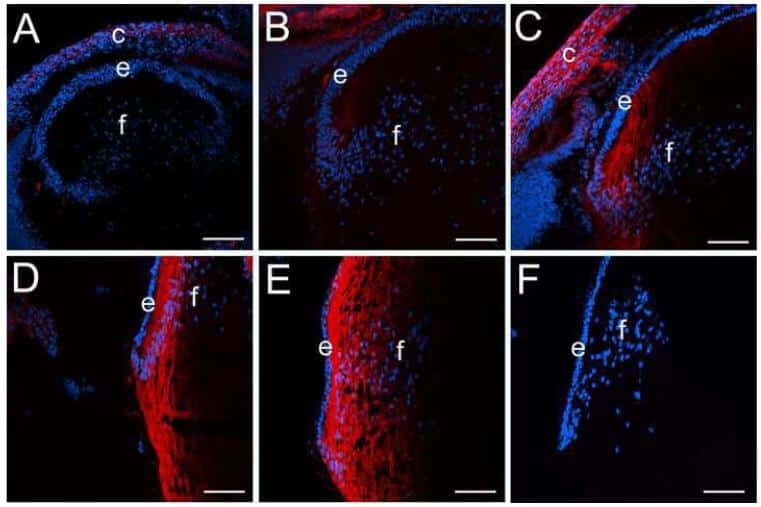
- Submitted by
- Invitrogen Antibodies (provider)
- Main image

- Experimental details
- NULL
- Conjugate
- Biotin
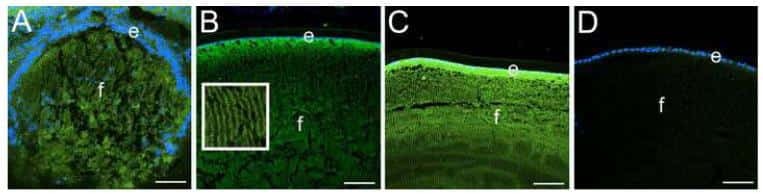
- Submitted by
- Invitrogen Antibodies (provider)
- Main image
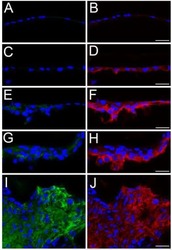
- Experimental details
- NULL
- Conjugate
- Biotin

- Submitted by
- Invitrogen Antibodies (provider)
- Main image
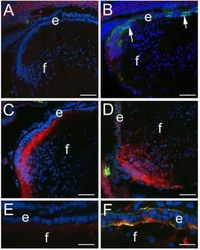
- Experimental details
- NULL
- Conjugate
- Biotin

- Submitted by
- Invitrogen Antibodies (provider)
- Main image
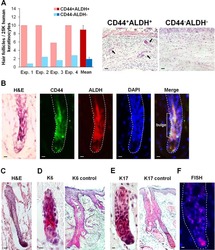
- Experimental details
- NULL
- Conjugate
- Biotin

- Submitted by
- Invitrogen Antibodies (provider)
- Main image
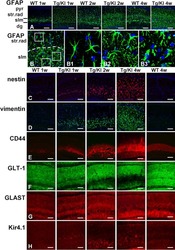
- Experimental details
- NULL
- Conjugate
- Biotin
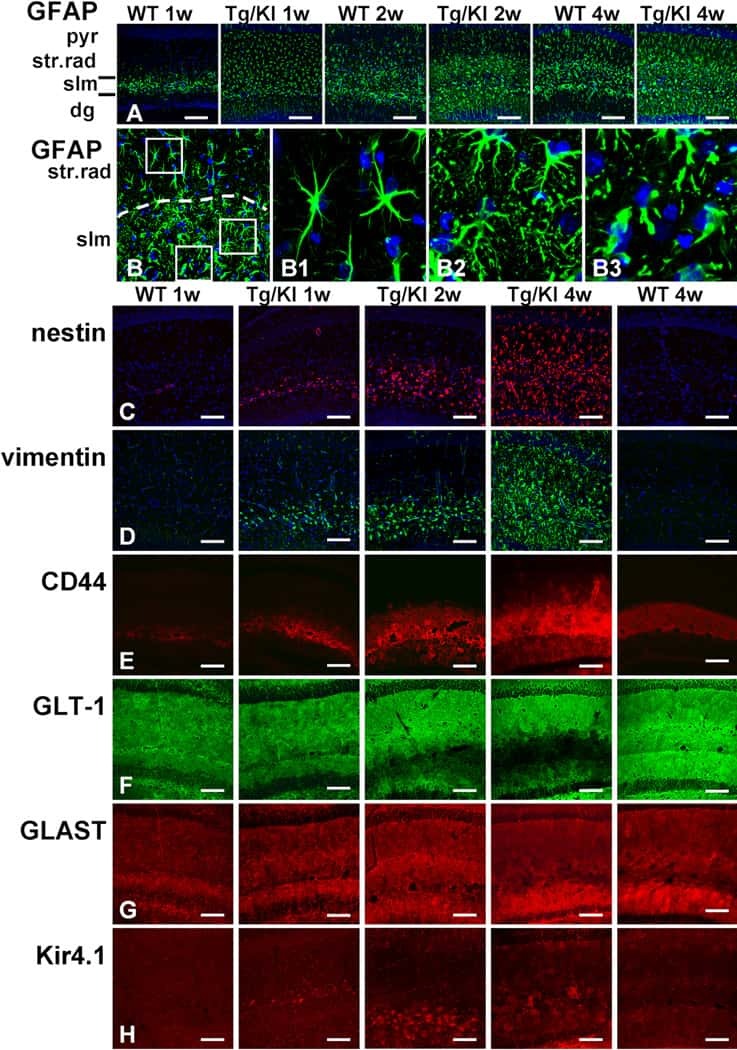
- Submitted by
- Invitrogen Antibodies (provider)
- Main image

- Experimental details
- NULL
- Conjugate
- Biotin
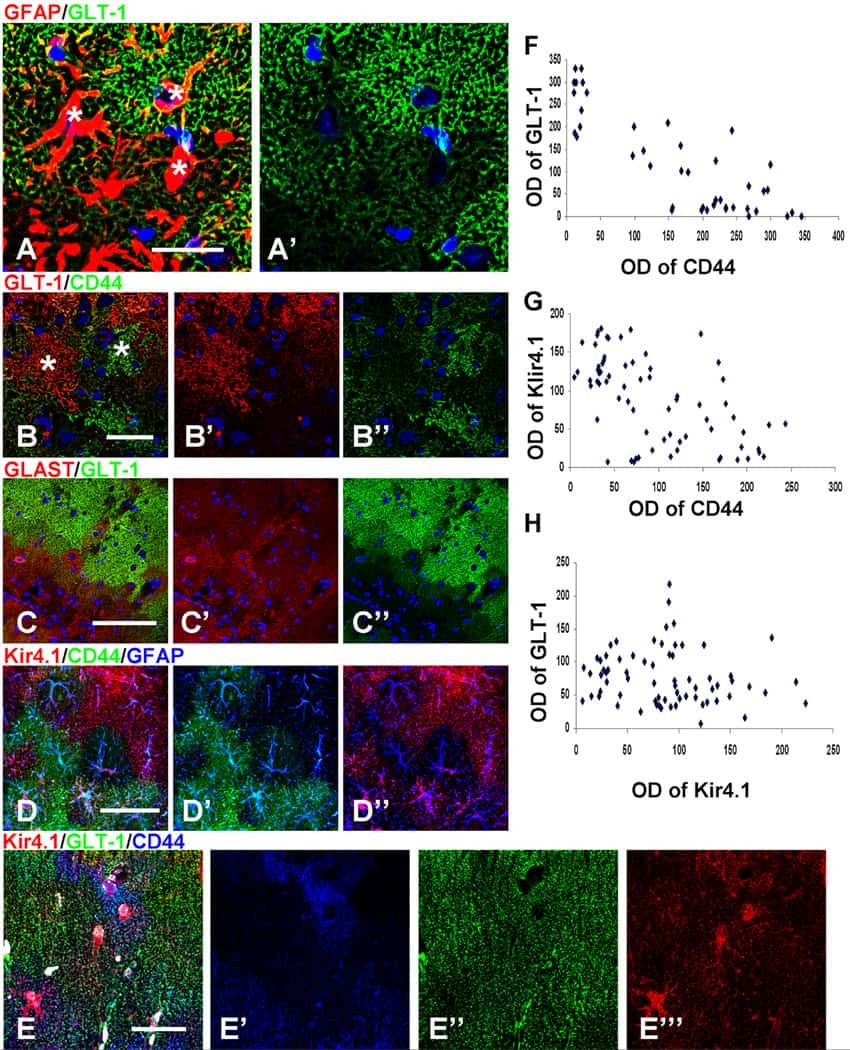
- Submitted by
- Invitrogen Antibodies (provider)
- Main image
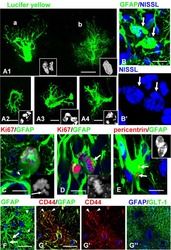
- Experimental details
- NULL
- Conjugate
- Biotin
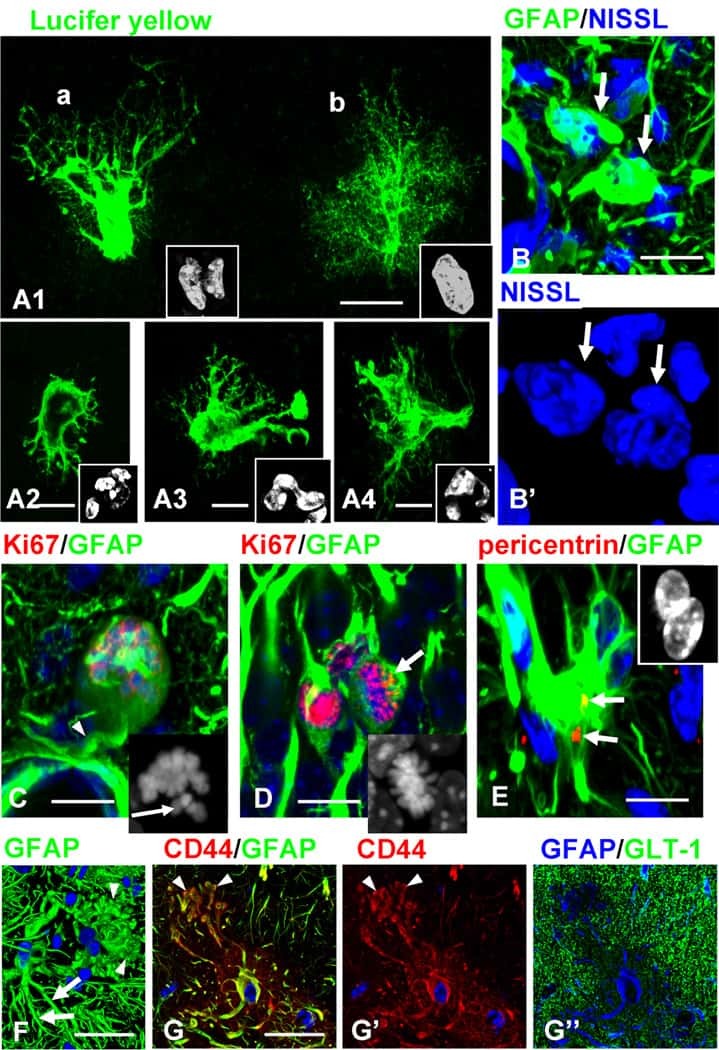
- Submitted by
- Invitrogen Antibodies (provider)
- Main image
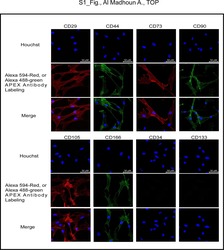
- Experimental details
- NULL
- Conjugate
- Biotin
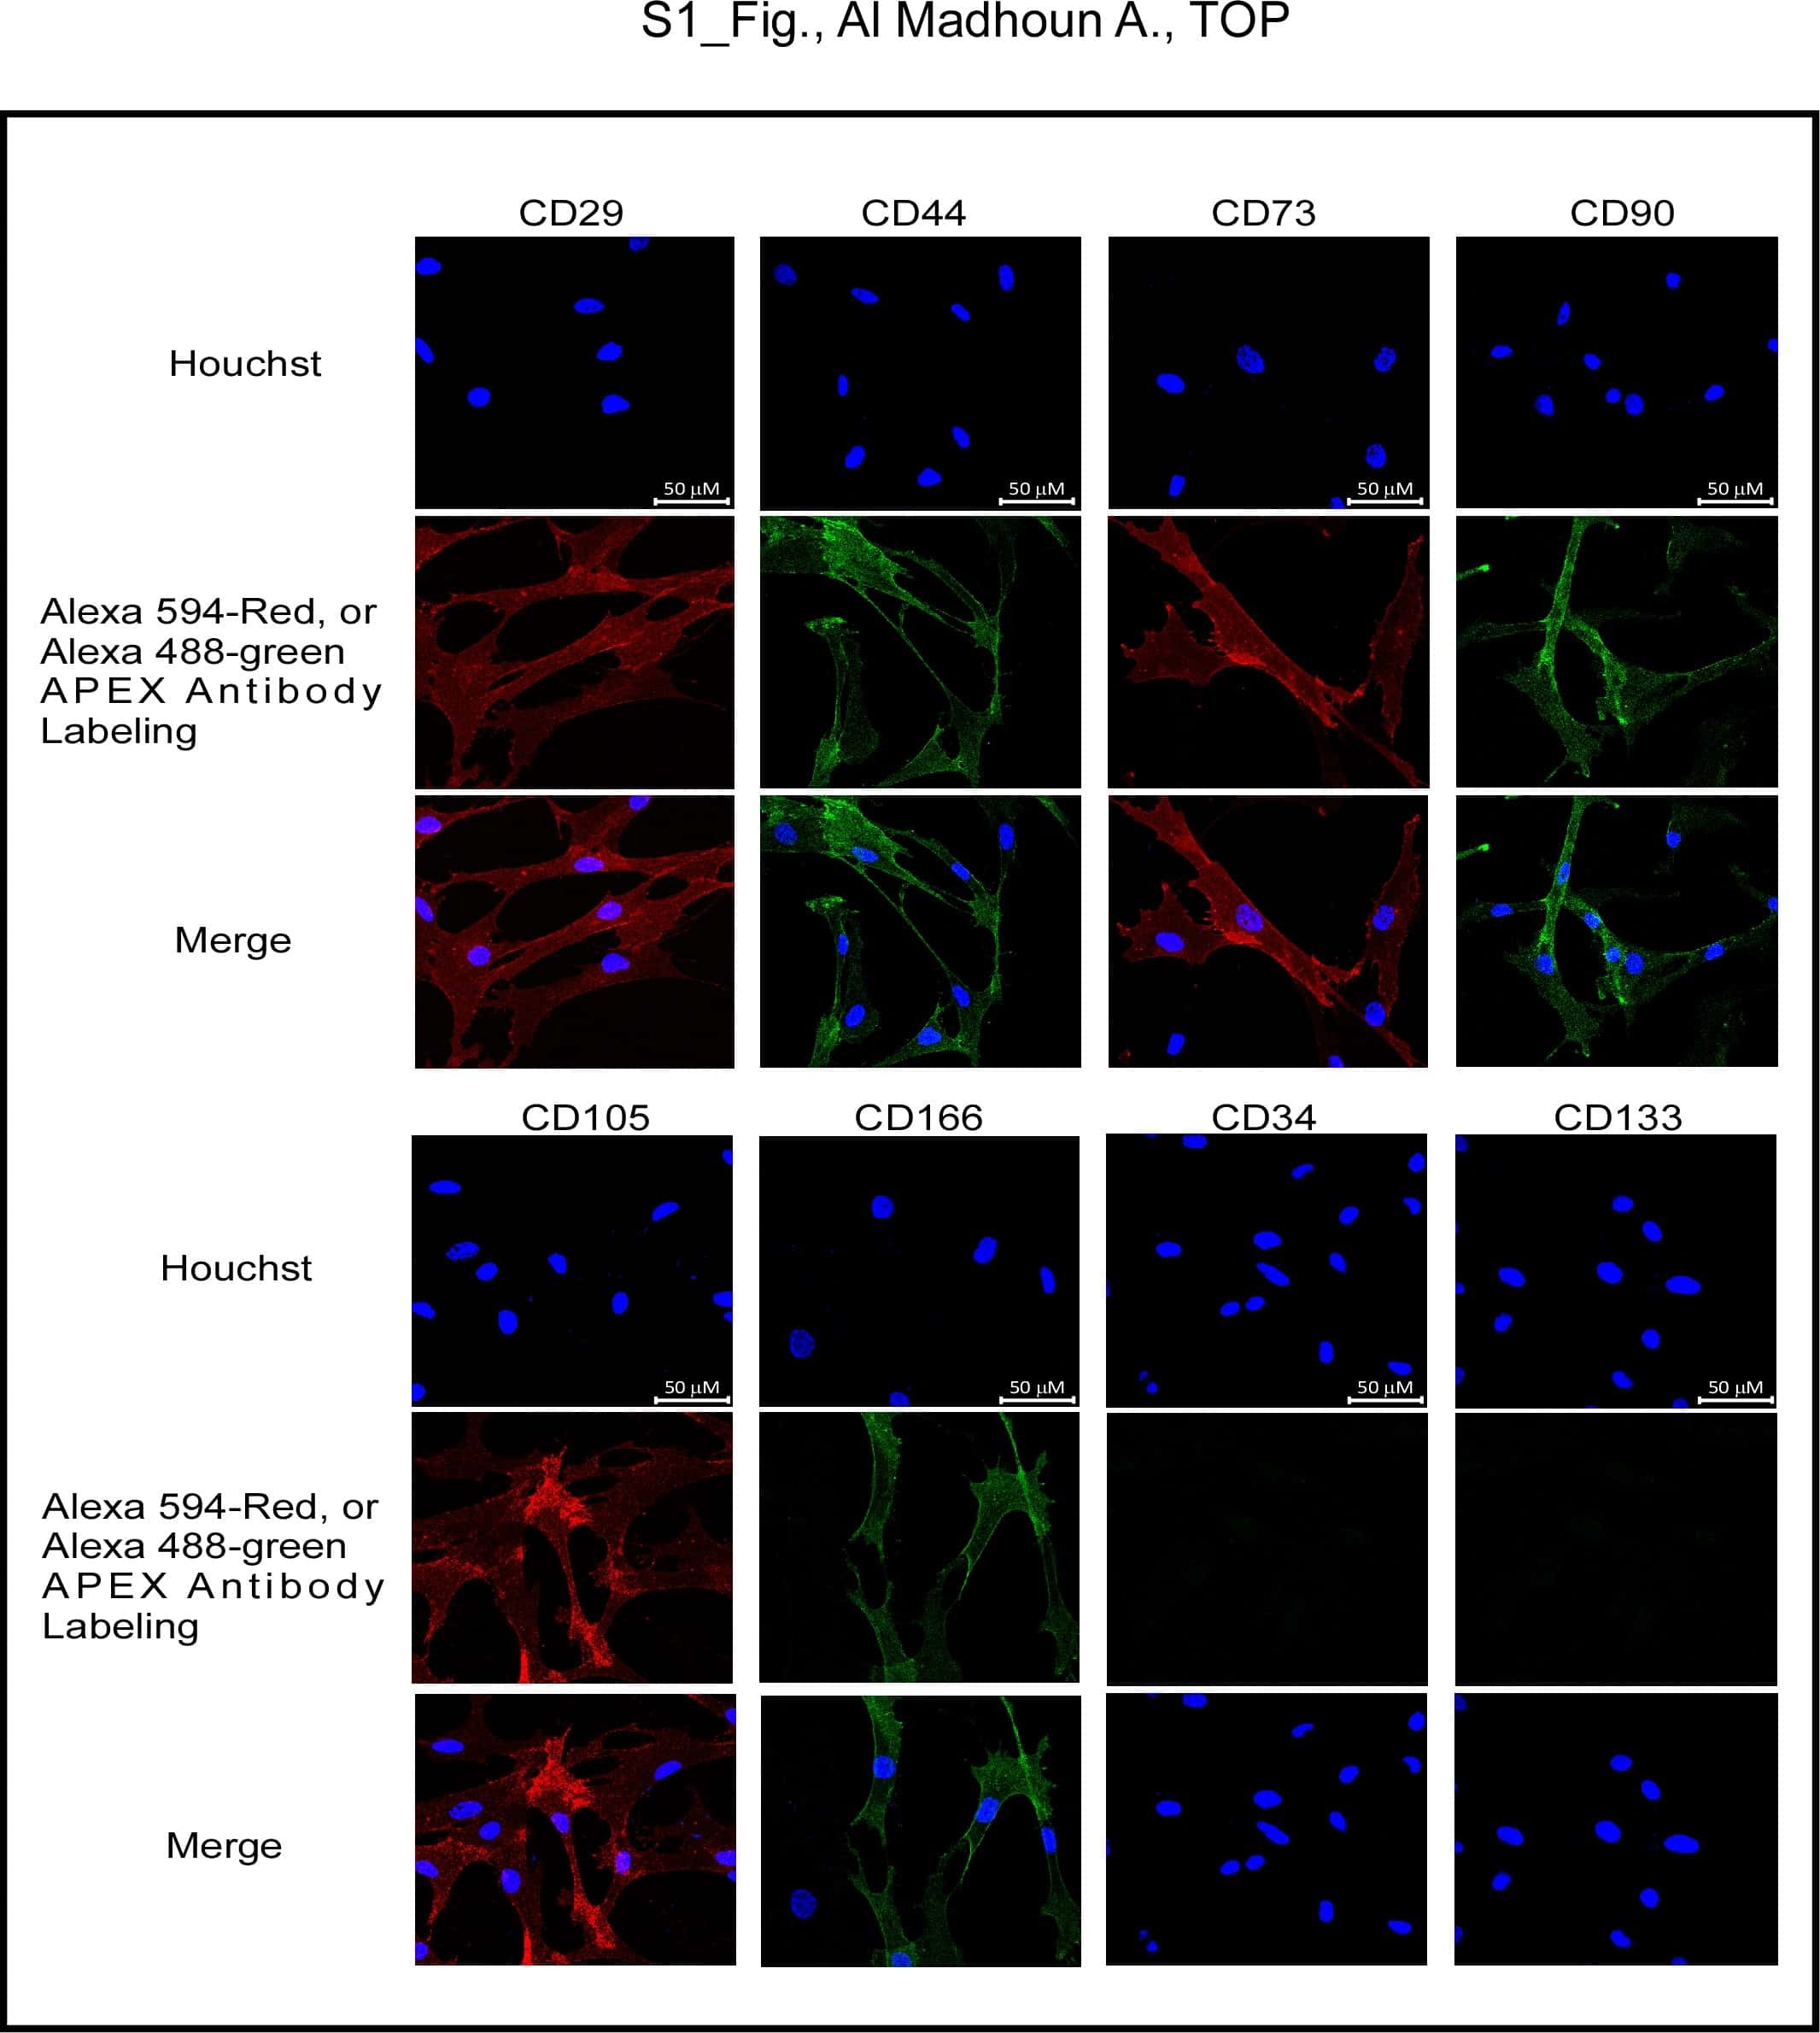
- Submitted by
- Invitrogen Antibodies (provider)
- Main image
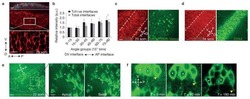
- Experimental details
- NULL
- Conjugate
- Biotin
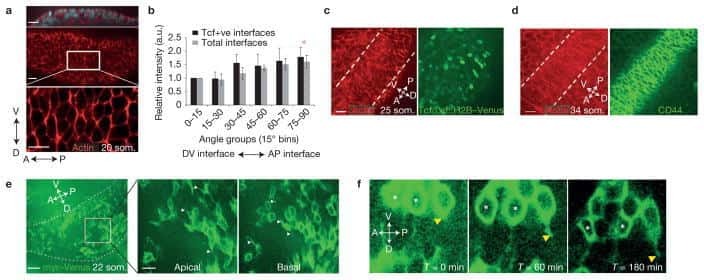
- Submitted by
- Invitrogen Antibodies (provider)
- Main image

- Experimental details
- NULL
- Conjugate
- Biotin
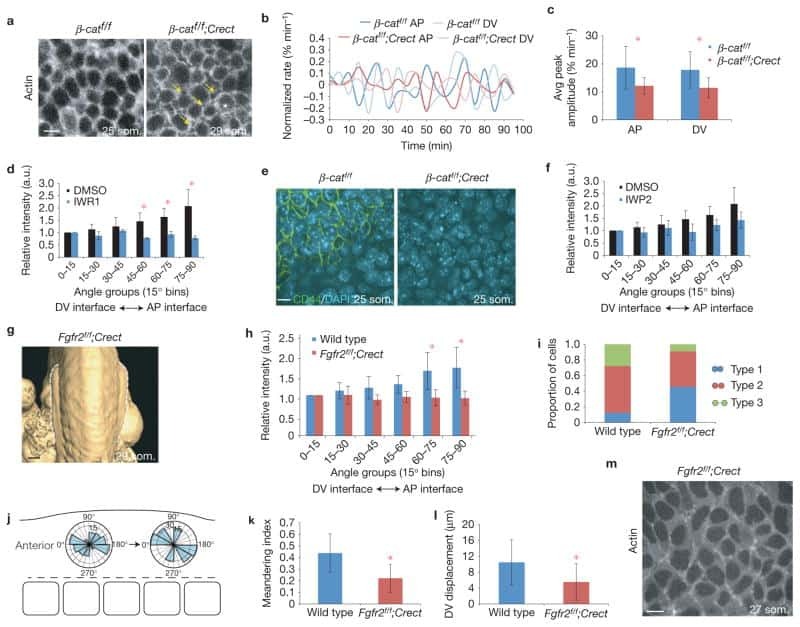
- Submitted by
- Invitrogen Antibodies (provider)
- Main image

- Experimental details
- NULL
- Conjugate
- Biotin
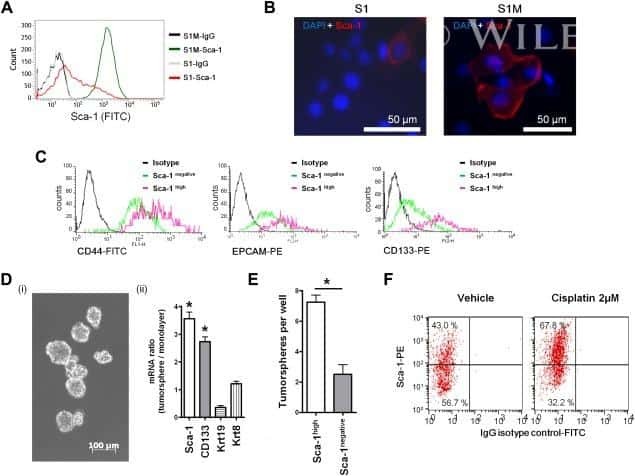
- Submitted by
- Invitrogen Antibodies (provider)
- Main image
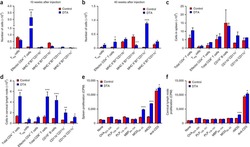
- Experimental details
- NULL
- Conjugate
- Biotin

- Submitted by
- Invitrogen Antibodies (provider)
- Main image
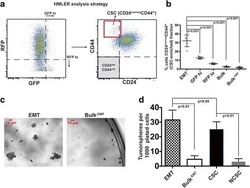
- Experimental details
- NULL
- Conjugate
- Biotin

- Submitted by
- Invitrogen Antibodies (provider)
- Main image

- Experimental details
- NULL
- Conjugate
- Biotin
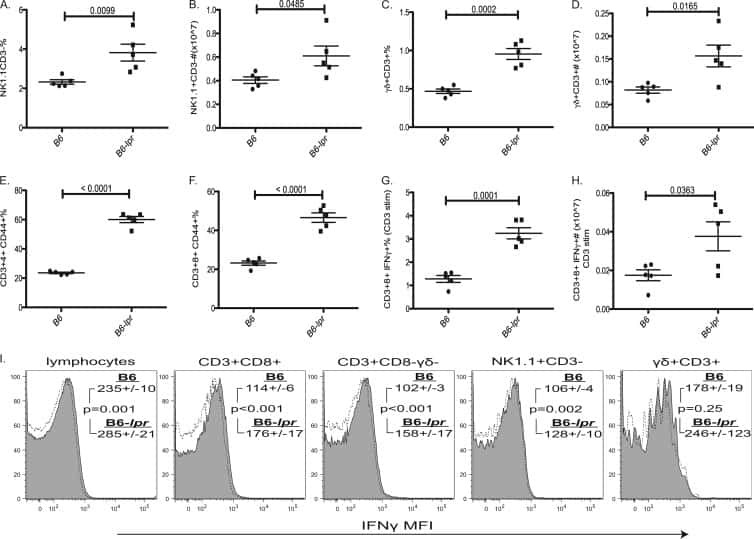
- Submitted by
- Invitrogen Antibodies (provider)
- Main image
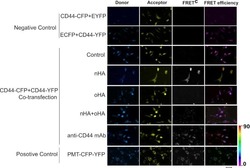
- Experimental details
- FIGURE 3. FRET analysis of CD44-CFP/CD44-YFP clustering in COS-7 cells. COS-7 cells were co-transfected with CD44-CFP and CD44-YFP, and treated with medium, nHA (125 mug/ml), oHA (125 mug/ml), or anti-CD44 mAb (10 mug/ml) for 2 h. After exposed to nHA, one group of cells was treated with oHA (125 mug/ml) for another 2 h. Cells treated with culture medium were used as negative control. Another three controls were used: two negative control pairs CD44-CFP with EYFP-N1 and ECFP-N1 with CD44-YFP and a positive control tandem PMT-CFP-YFP construct. nHA induced CD44-CFP-CD44-YFP clustering as indicated by the FRET signal. oHA did not induce CD44-CFP-CD44-YFP clustering but reduced FRET signal induced by nHA. Similar findings were observed when the cells were treated by anti-CD44 mAb. FRET images were normalized with respect to FRET efficiency and shown in a pseudocolor mode. The scale indicated FRET efficiency from purple (0) to red (90%); scale bar = 100 mum. The results represent five separate experiments; more than three cells were analyzed each time.
- Conjugate
- Biotin
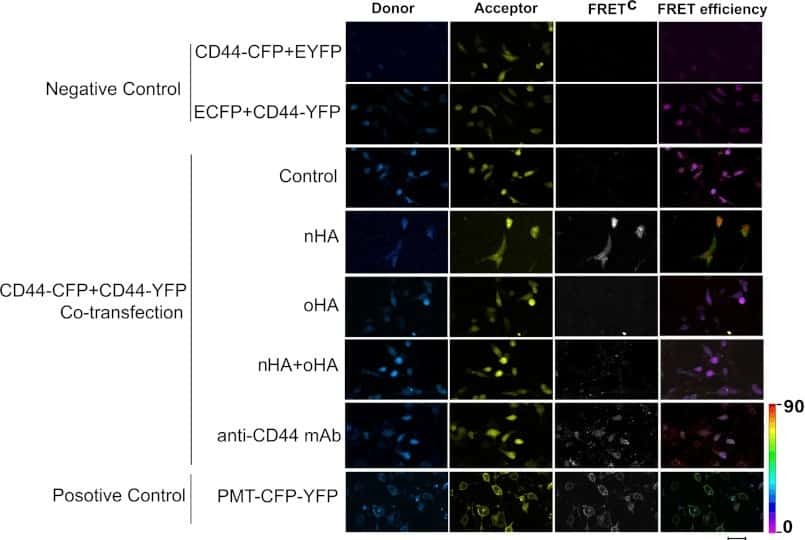
- Submitted by
- Invitrogen Antibodies (provider)
- Main image
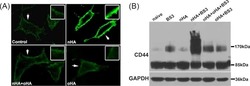
- Experimental details
- FIGURE 4. Immunocytochemistry and chemical cross-linker analysis of CD44 clustering in transfected COS-7 cells. A , clustering of CD44 with different treatments was analyzed by immunocytochemistry. CD44-transfected COS-7 cells were pretreated with DMEM ( Control ), oHA (125 mug/ml), or nHA (125 mug/ml) for 2 h at 37 degC. After exposure to nHA, one group of cells was treated with oHA (125 mug/ml) for another 2 h. CD44 was distributed into clusters in nHA-treated cells (indicated by the arrows ). B , CD44-transfected COS-7 cells were pretreated with DMEM ( Control ), oHA (125 mug/ml), and nHA (125 mug/ml) for 2 h at 37 degC. After exposure to nHA, one group of cells was treated with oHA (125 mug/ml) for another 2 h, then all cells were incubated with or without BS 3 protein cross-linker (2 m m ) for 1 h at 4 degC. The cross-linked CD44 on cell surface was detected by Western blot analysis. Without BS 3 treatment, immunoblotting of the cell lysate revealed a major 85-kDa band. Incubation of cells with BS 3 led to the appearance of additional immunoreactive bands at 170 kDa. Shown are representative images from three independent experiments with similar results.
- Conjugate
- Biotin
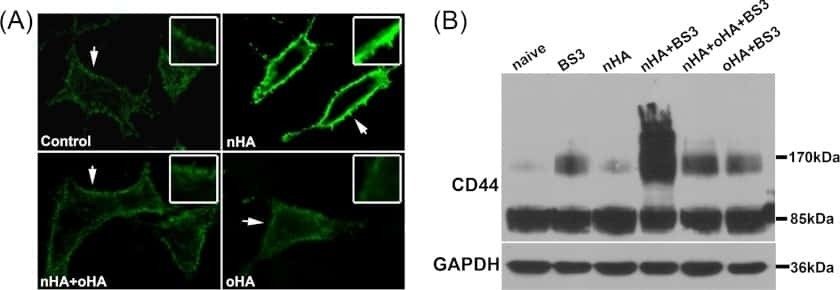
- Submitted by
- Invitrogen Antibodies (provider)
- Main image
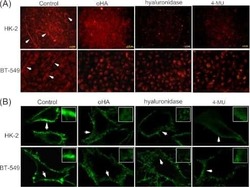
- Experimental details
- FIGURE 6. oHA abrogates CD44 clustering triggered by endogenous nHA in HK-2 and BT-549 cells. A , the expression of hyaluronan with or without oHA treatment was detected by immunocytochemistry analysis. Endogenous nHA was cross-linked into cables (indicated by the arrows ). Sections were imaged by microscopy (x20 objective). To confirm the nature of HA staining, cells were treated with bovine testicular hyaluronidase (250 mug/ml) at 37 degC for 2 h before fixation and the addition of biotinylated HA-binding protein. 4-MU (0.5 m m , 24 h), the hyaluronan synthesis inhibitor, was used as positive control. B , the clustering of CD44 with or without oHA treatment was analyzed by immunocytochemistry. CD44 was distributed into clusters in naive HK-2 and BT-549 cells (indicated by the arrows ). As a positive control, cells were treated with bovine testicular hyaluronidase (250 mug/ml) at 37 degC for 2 h. Treatment with 4-MU (0.5 m m , 24 h) was performed to detect the effect of inhibition of endogenous HA synthesis on CD44 clustering.
- Conjugate
- Biotin
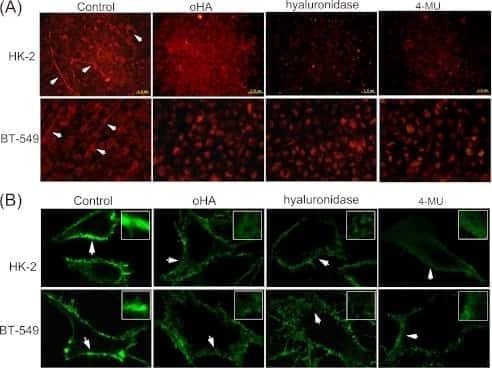
- Submitted by
- Invitrogen Antibodies (provider)
- Main image

- Experimental details
- FIGURE 7. CD44 clustering on the surface of HK-2 and BT-549 cells was assessed by chemical cross-linker analysis. A and B , HK-2 cells ( A ) and BT-549 cells ( B ) were pretreated with DMEM ( Control ), oHA (250 mug/ml), and hyaluronidase (250 mug/ml) for 2 h at 37 degC, then incubated with or without BS 3 protein cross-linker (2 m m ) for 1 h at 4 degC. Treatment with bovine testicular hyaluronidase (250 mug/ml) was used as positive control. After incubation, the cross-linking reaction was quenched by 20 m m Tris, pH 7.5. Cells were washed twice and lysed with cell lysis buffer. The cross-linked CD44 on the cell surface was detected by Western blot analysis. Without BS 3 treatment, immunoblotting of cell lysate revealed a major 85-kDa band. Incubation of cells with BS 3 led to the appearance of additional immunoreactive bands at 170 kDa. C and D , to confirm the effect of endogenous HA on CD44 clustering, HK-2 ( C ) cells and BT-549 cells ( D ) were pretreated with or without the hyaluronan synthesis inhibitor 4-MU (0.5 m m , 24 h) then incubated with or without BS 3 protein cross-linker (2 m m ) for 1 h at 4 degC. The cross-linked CD44 on cell surface was detected by Western blot analysis. Shown are representative images from three independent experiments with similar results.
- Conjugate
- Biotin
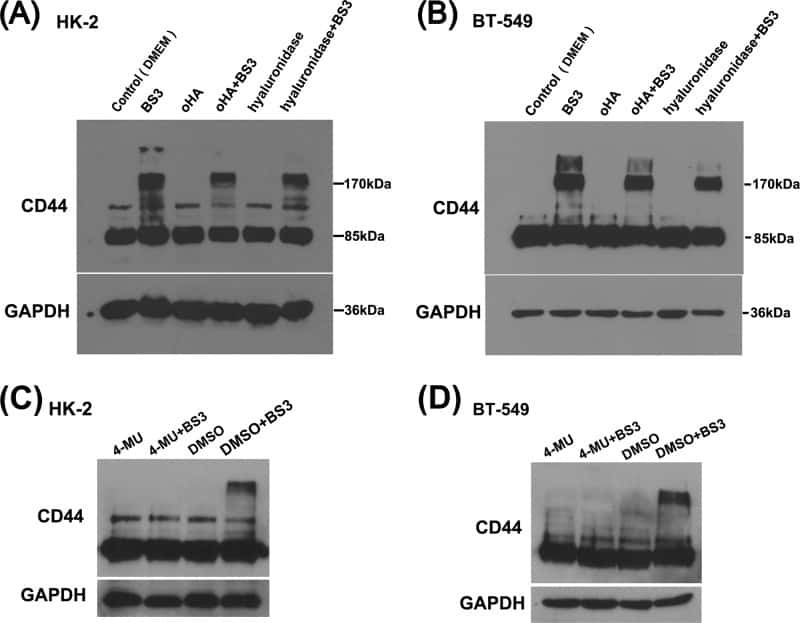
- Submitted by
- Invitrogen Antibodies (provider)
- Main image
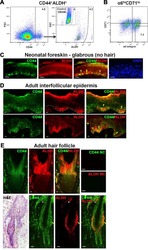
- Experimental details
- NULL
- Conjugate
- Biotin
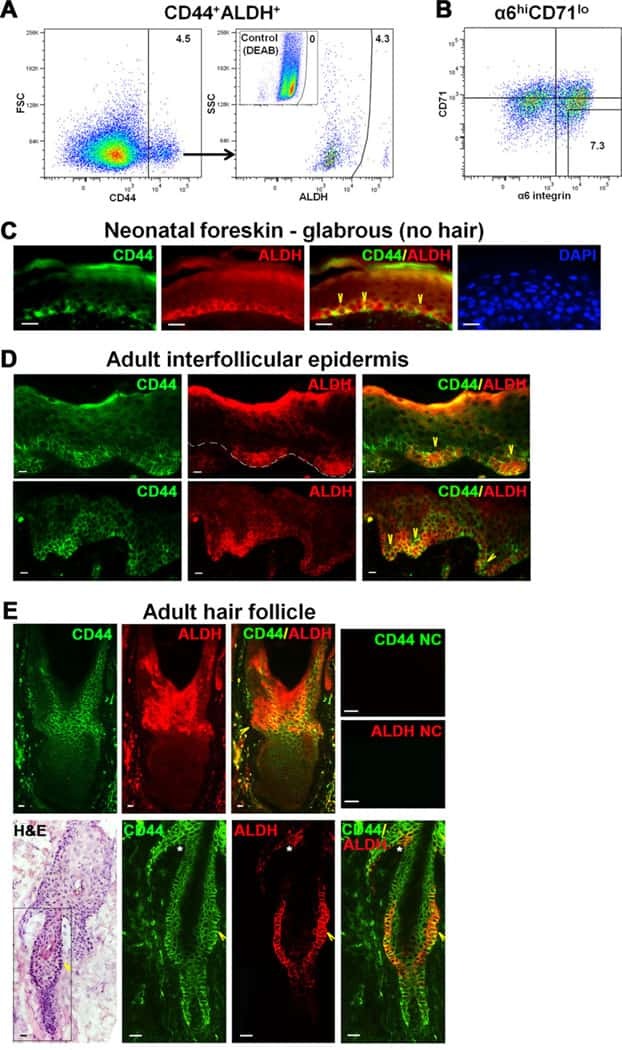
- Submitted by
- Invitrogen Antibodies (provider)
- Main image

- Experimental details
- NULL
- Conjugate
- Biotin
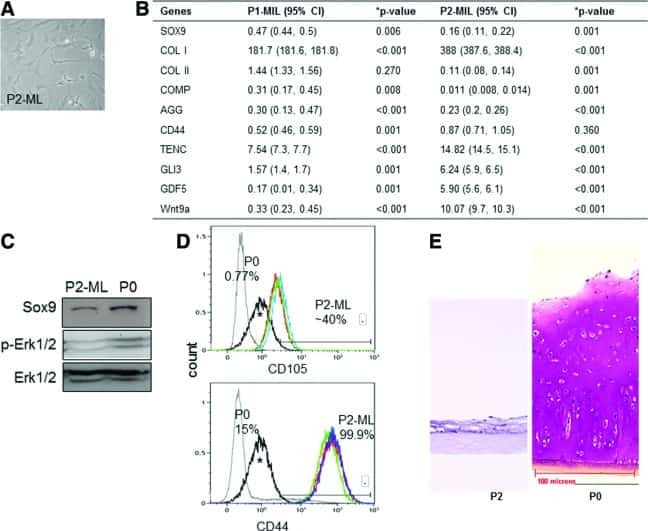
- Submitted by
- Invitrogen Antibodies (provider)
- Main image

- Experimental details
- NULL
- Conjugate
- Biotin
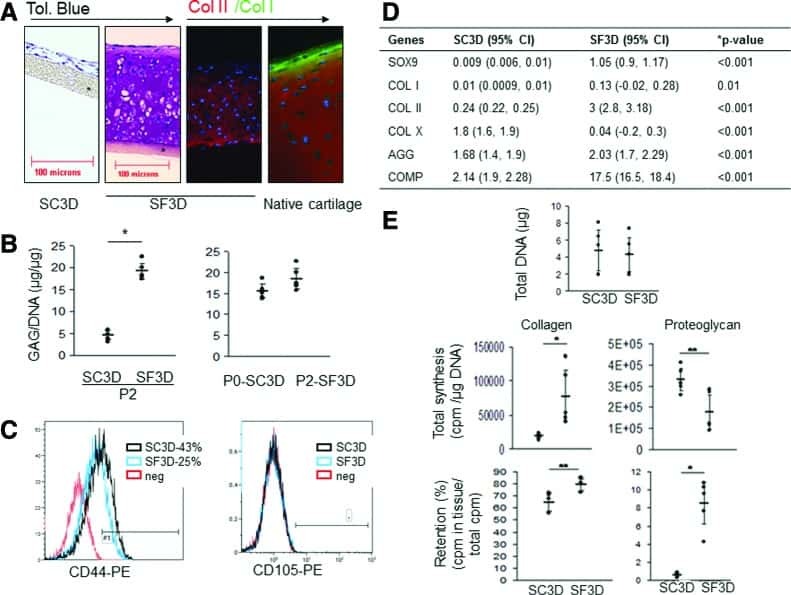
- Submitted by
- Invitrogen Antibodies (provider)
- Main image
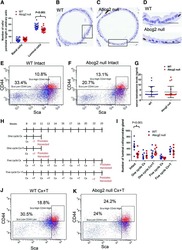
- Experimental details
- NULL
- Conjugate
- Biotin
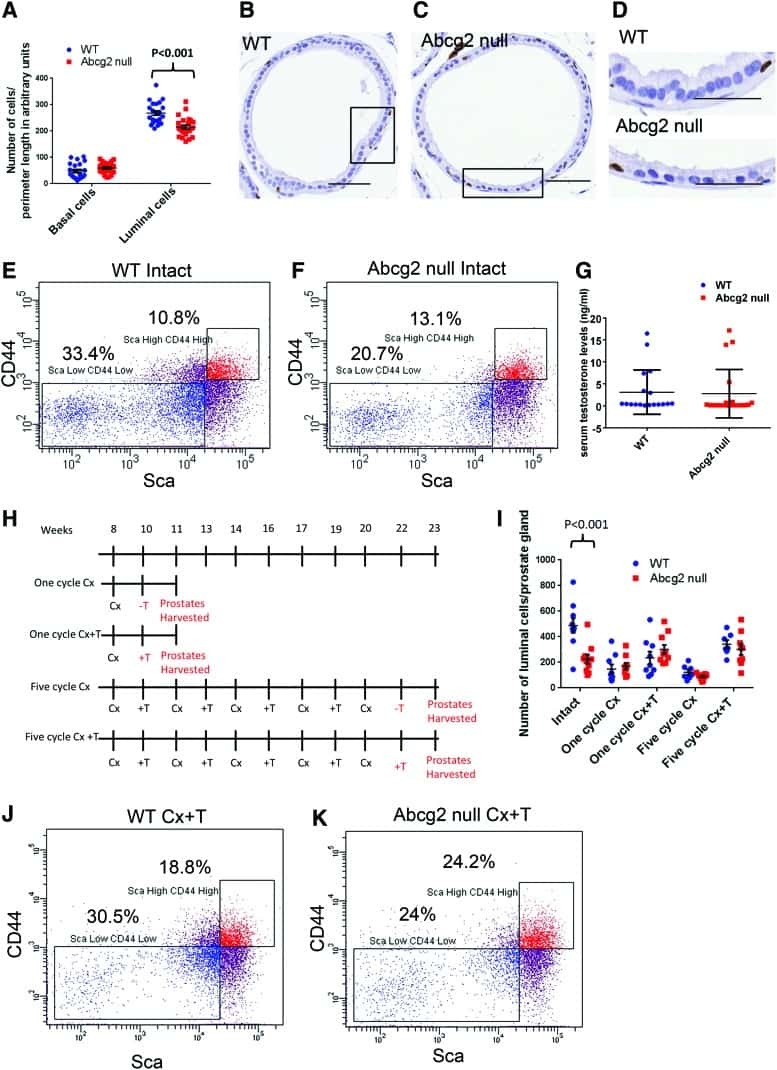
- Submitted by
- Invitrogen Antibodies (provider)
- Main image
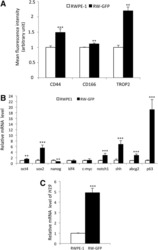
- Experimental details
- NULL
- Conjugate
- Biotin

- Submitted by
- Invitrogen Antibodies (provider)
- Main image
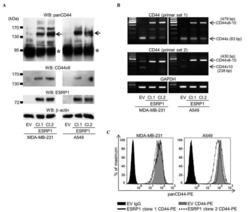
- Experimental details
- NULL
- Conjugate
- Biotin

- Submitted by
- Invitrogen Antibodies (provider)
- Main image

- Experimental details
- NULL
- Conjugate
- Biotin
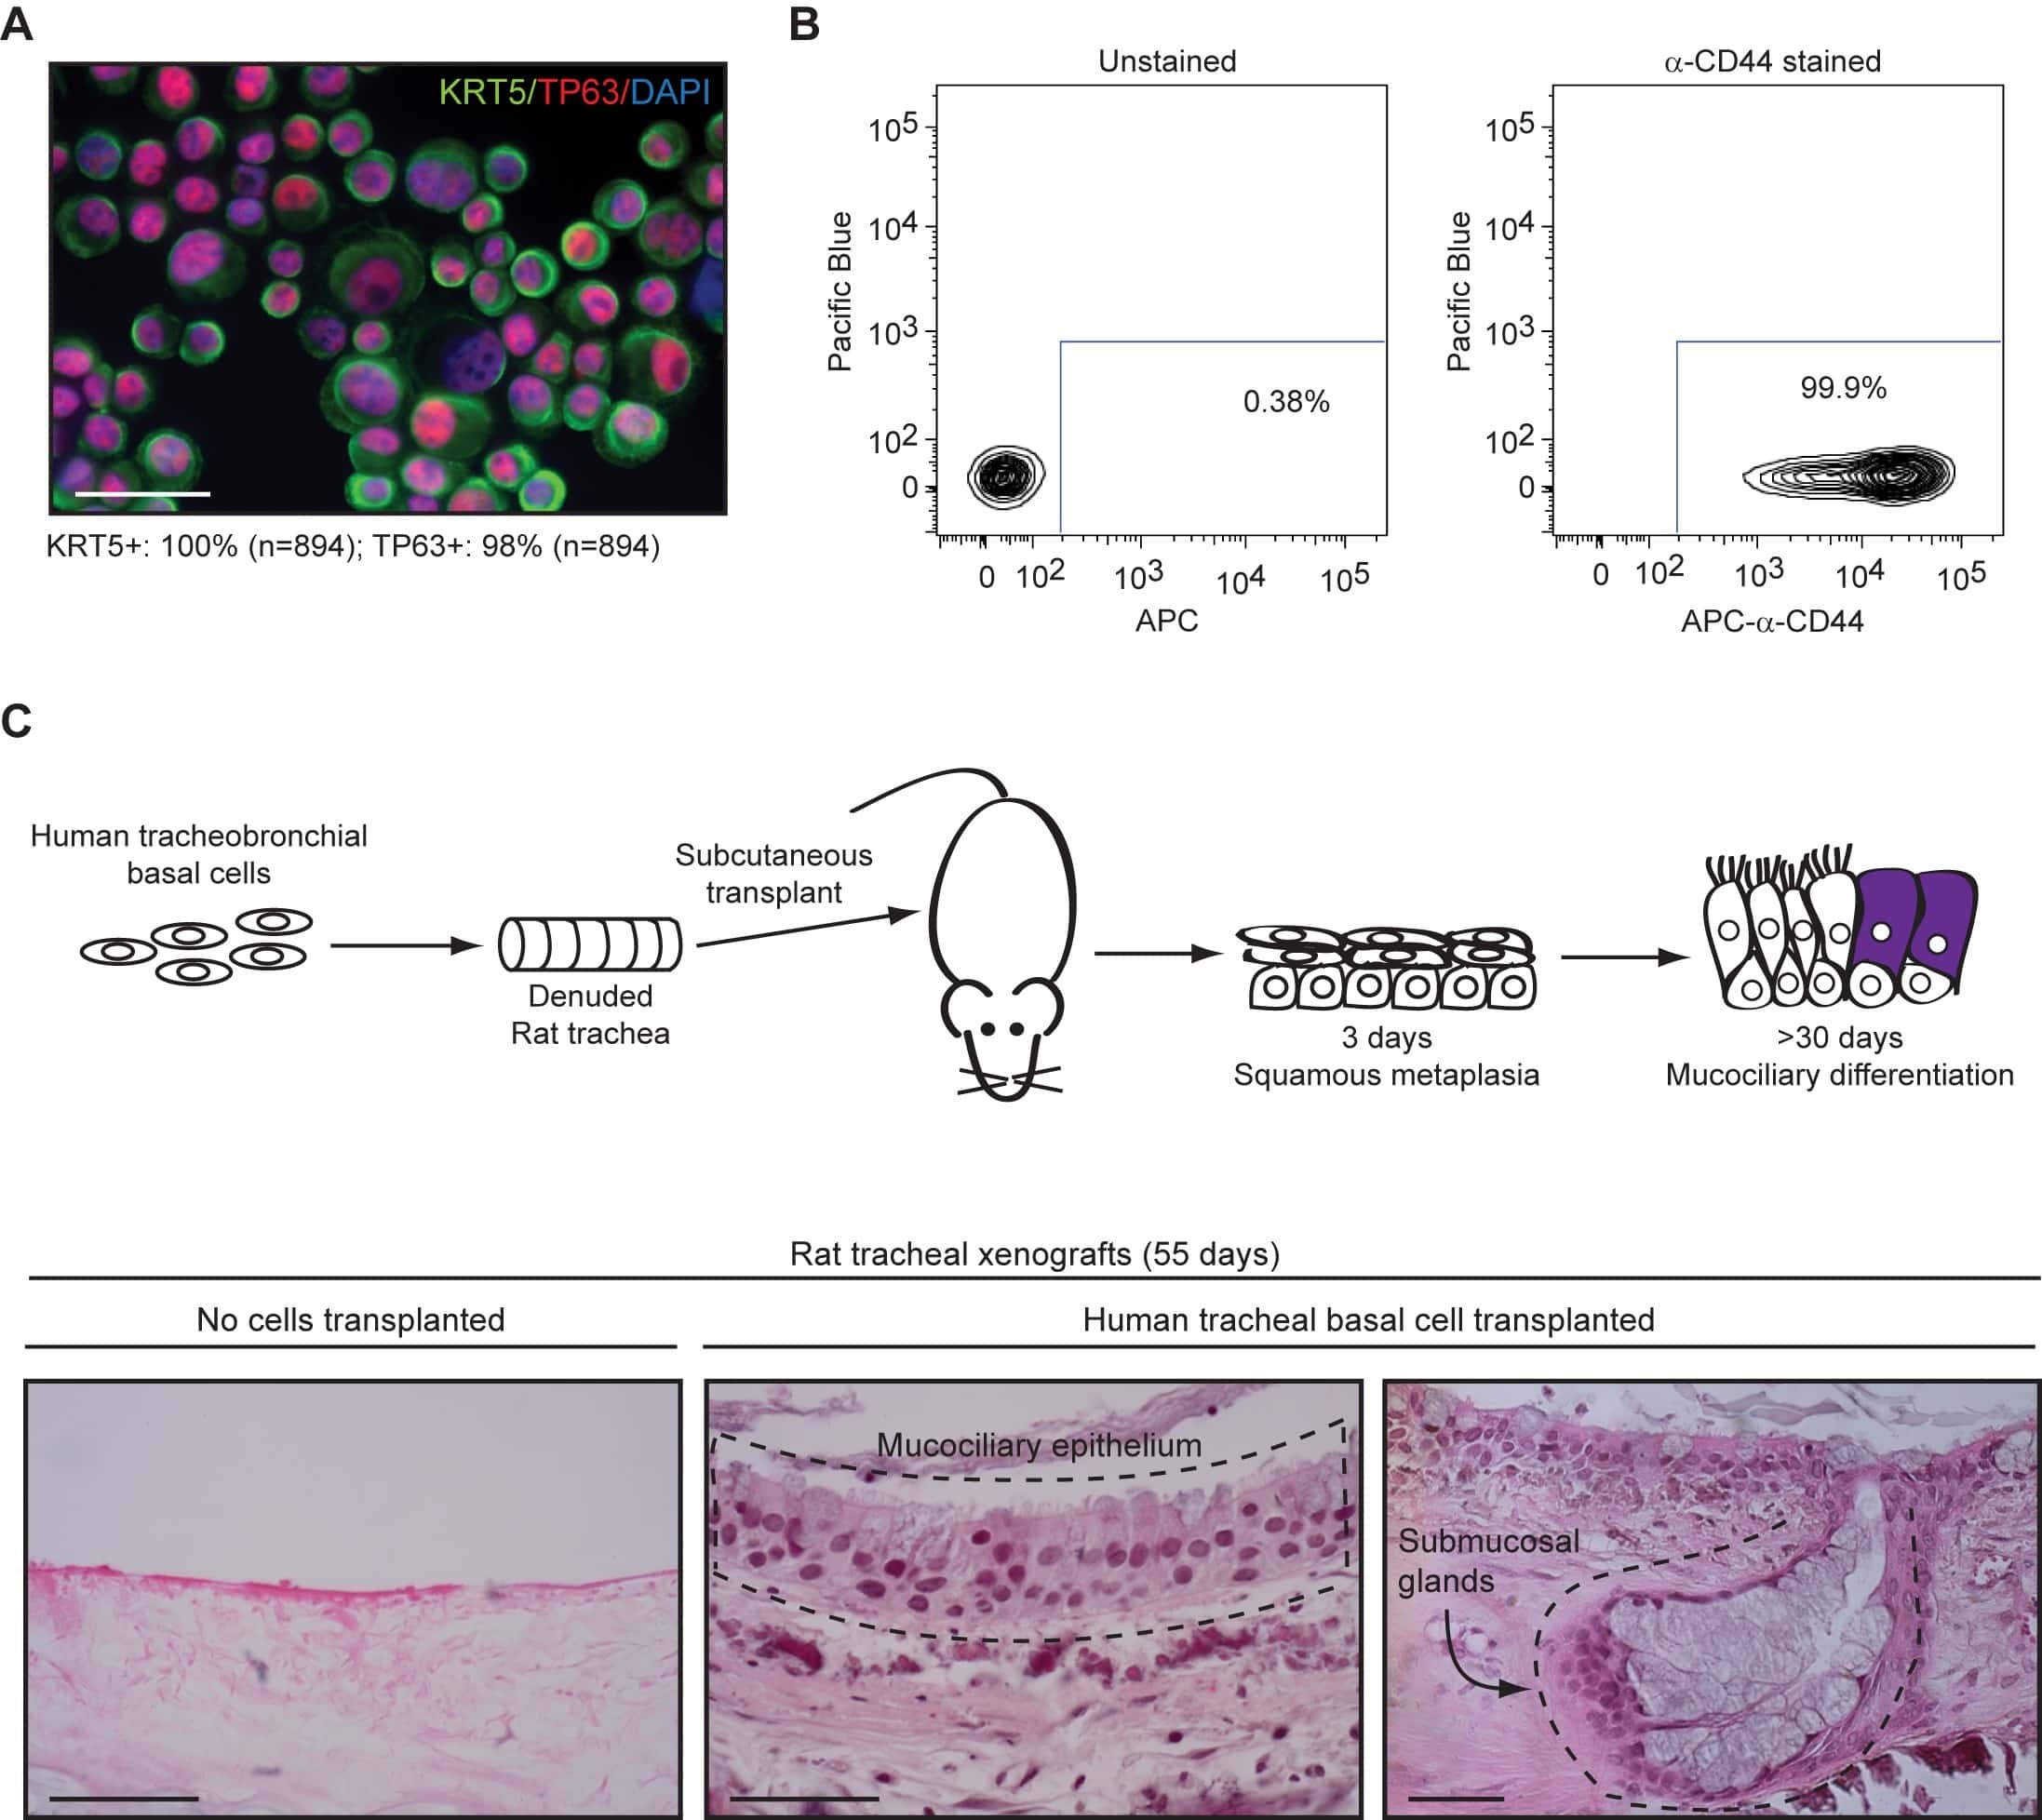
- Submitted by
- Invitrogen Antibodies (provider)
- Main image
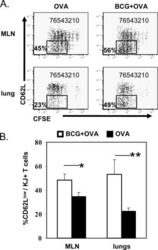
- Experimental details
- NULL
- Conjugate
- Biotin
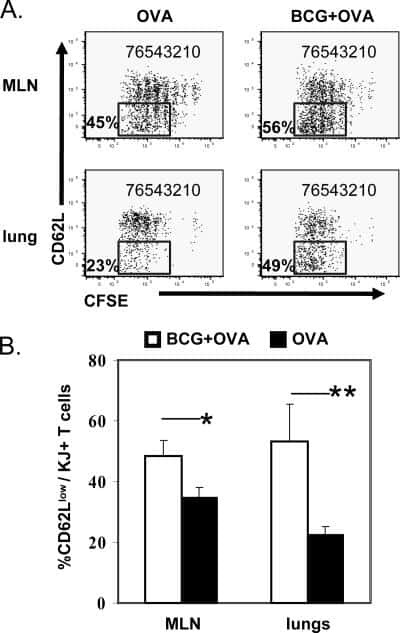
- Submitted by
- Invitrogen Antibodies (provider)
- Main image
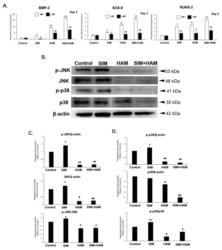
- Experimental details
- Figure 3 SIM plus HAM enhances the mRNA expression of transcription factors for ADSC chondrogenesis and osteogenesis. ADSCs were pretreated with IM7 (+IM7) or without IM7 (-IM7) prior to SIM treatment and cultivated in wells with/without an HA coating, and the mRNA expression levels of ( A ) BMP-2, SOX-9 and RUNX-2 in the control, SIM, HAM and SIM+HAM groups on day 3 were analyzed. The mRNA levels are expressed relative to those in the control group, which are defined as 1. The values presented are the means +- SEMs ( n = 6). (*) and (**) indicate p < 0.05 and p < 0.01, respectively, compared with the control group. (#) and (##) indicate p < 0.05 and p < 0.01, respectively, and represent the comparison between +IM7 and -IM7 in each group. ( B ) p38 and JNK signaling were analyzed by Western blot. Representative Western blot photographs were shown. ( C ) The p-JNK/beta-actin, JNK/beta-actin and p-JNK/JNK ratios and ( D ) p-p38/beta-actin, p38/beta-actin and p-p38/p38 ratios are expressed relative to that in the control group on day 3, which is defined as 1. The values presented are the means +- SEMs ( n = 6). (*) and (**) indicate p < 0.05 and p < 0.01, respectively, compared with the control group. (#) and (##) indicate p < 0.05 and p < 0.01, respectively, compared with the SIM group.
- Conjugate
- Biotin

- Submitted by
- Invitrogen Antibodies (provider)
- Main image
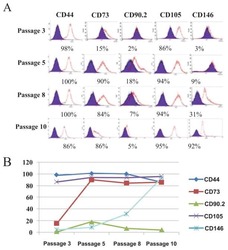
- Experimental details
- NULL
- Conjugate
- Biotin
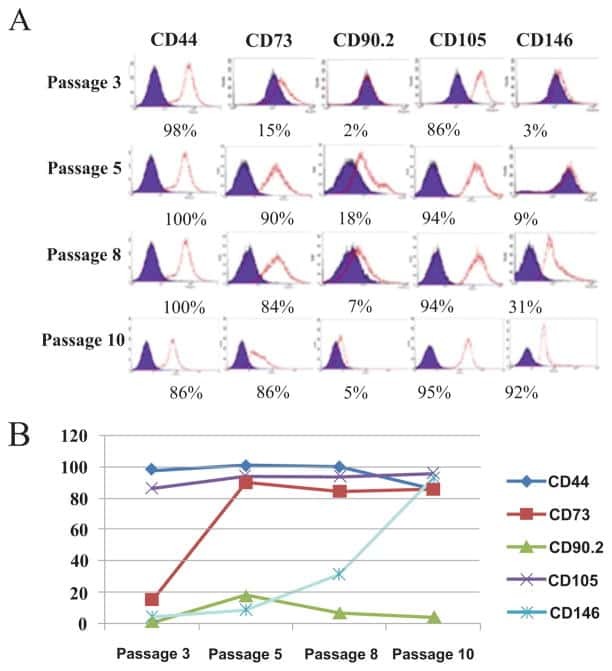
- Submitted by
- Invitrogen Antibodies (provider)
- Main image
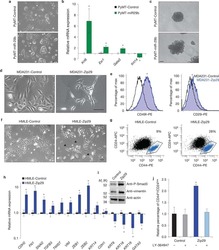
- Experimental details
- NULL
- Conjugate
- Biotin
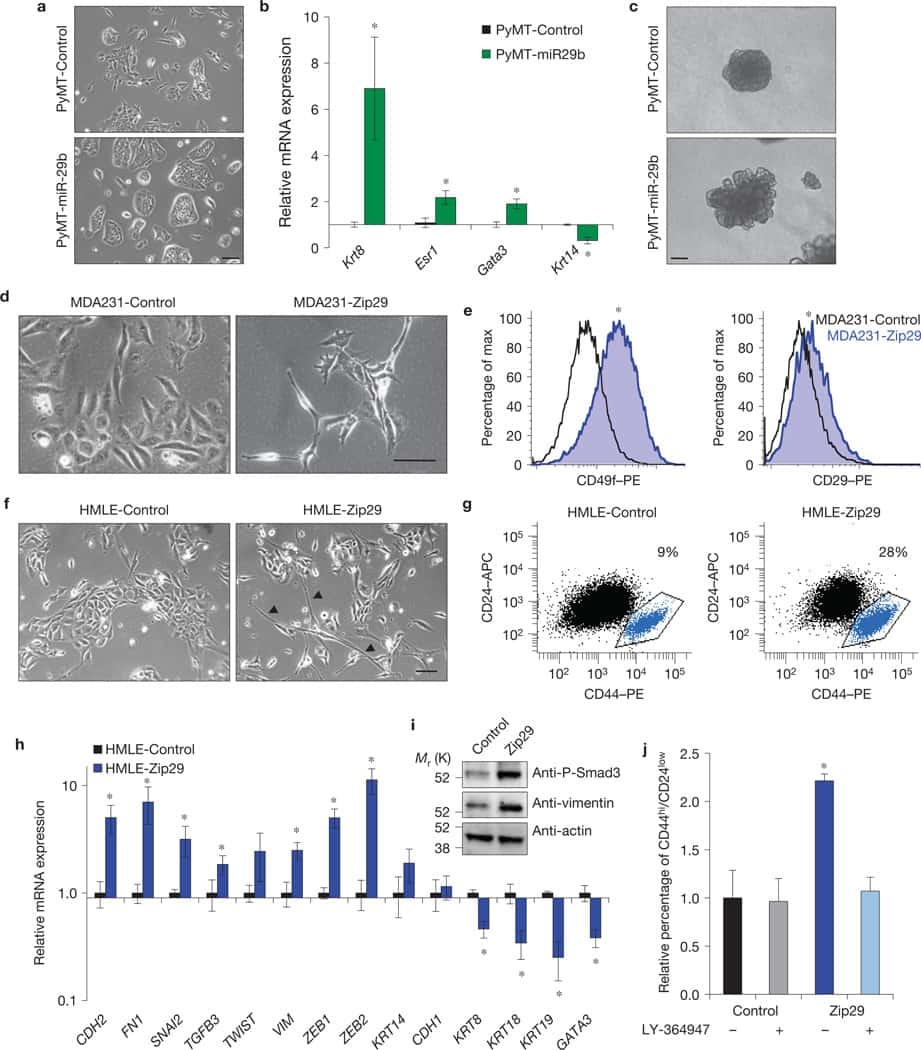
- Submitted by
- Invitrogen Antibodies (provider)
- Main image
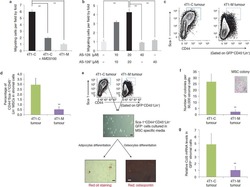
- Experimental details
- NULL
- Conjugate
- Biotin
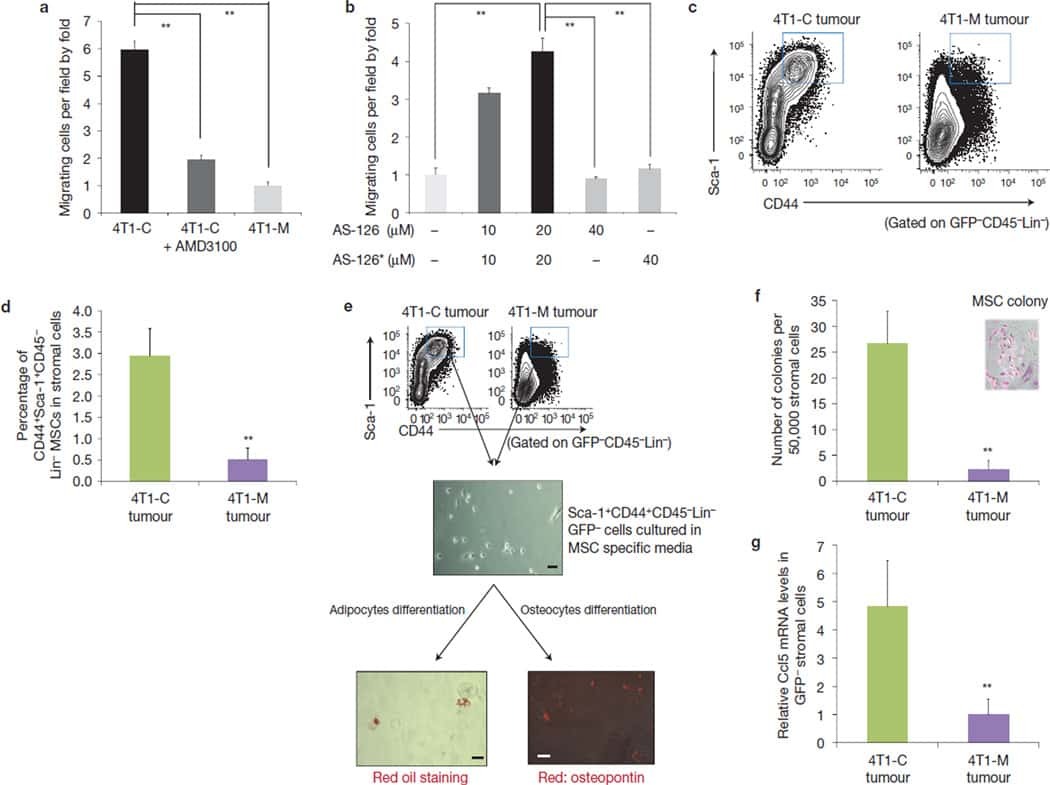
- Submitted by
- Invitrogen Antibodies (provider)
- Main image
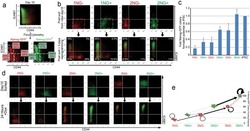
- Experimental details
- NULL
- Conjugate
- Biotin
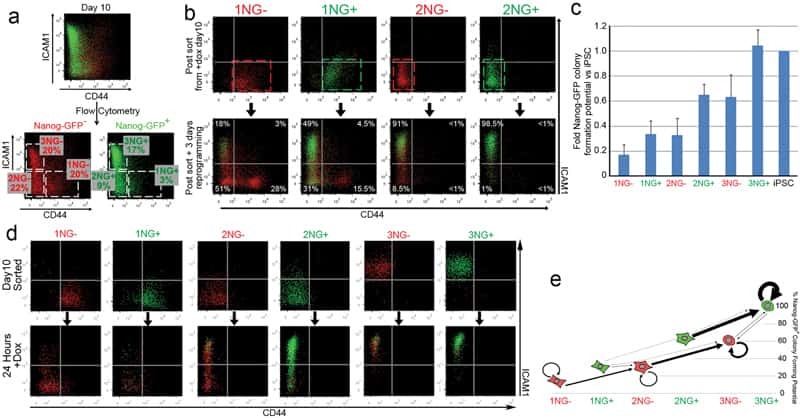
- Submitted by
- Invitrogen Antibodies (provider)
- Main image
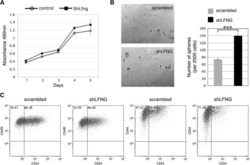
- Experimental details
- NULL
- Conjugate
- Biotin

- Submitted by
- Invitrogen Antibodies (provider)
- Main image
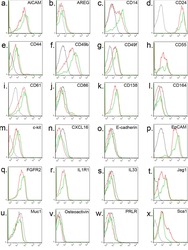
- Experimental details
- NULL
- Conjugate
- Biotin
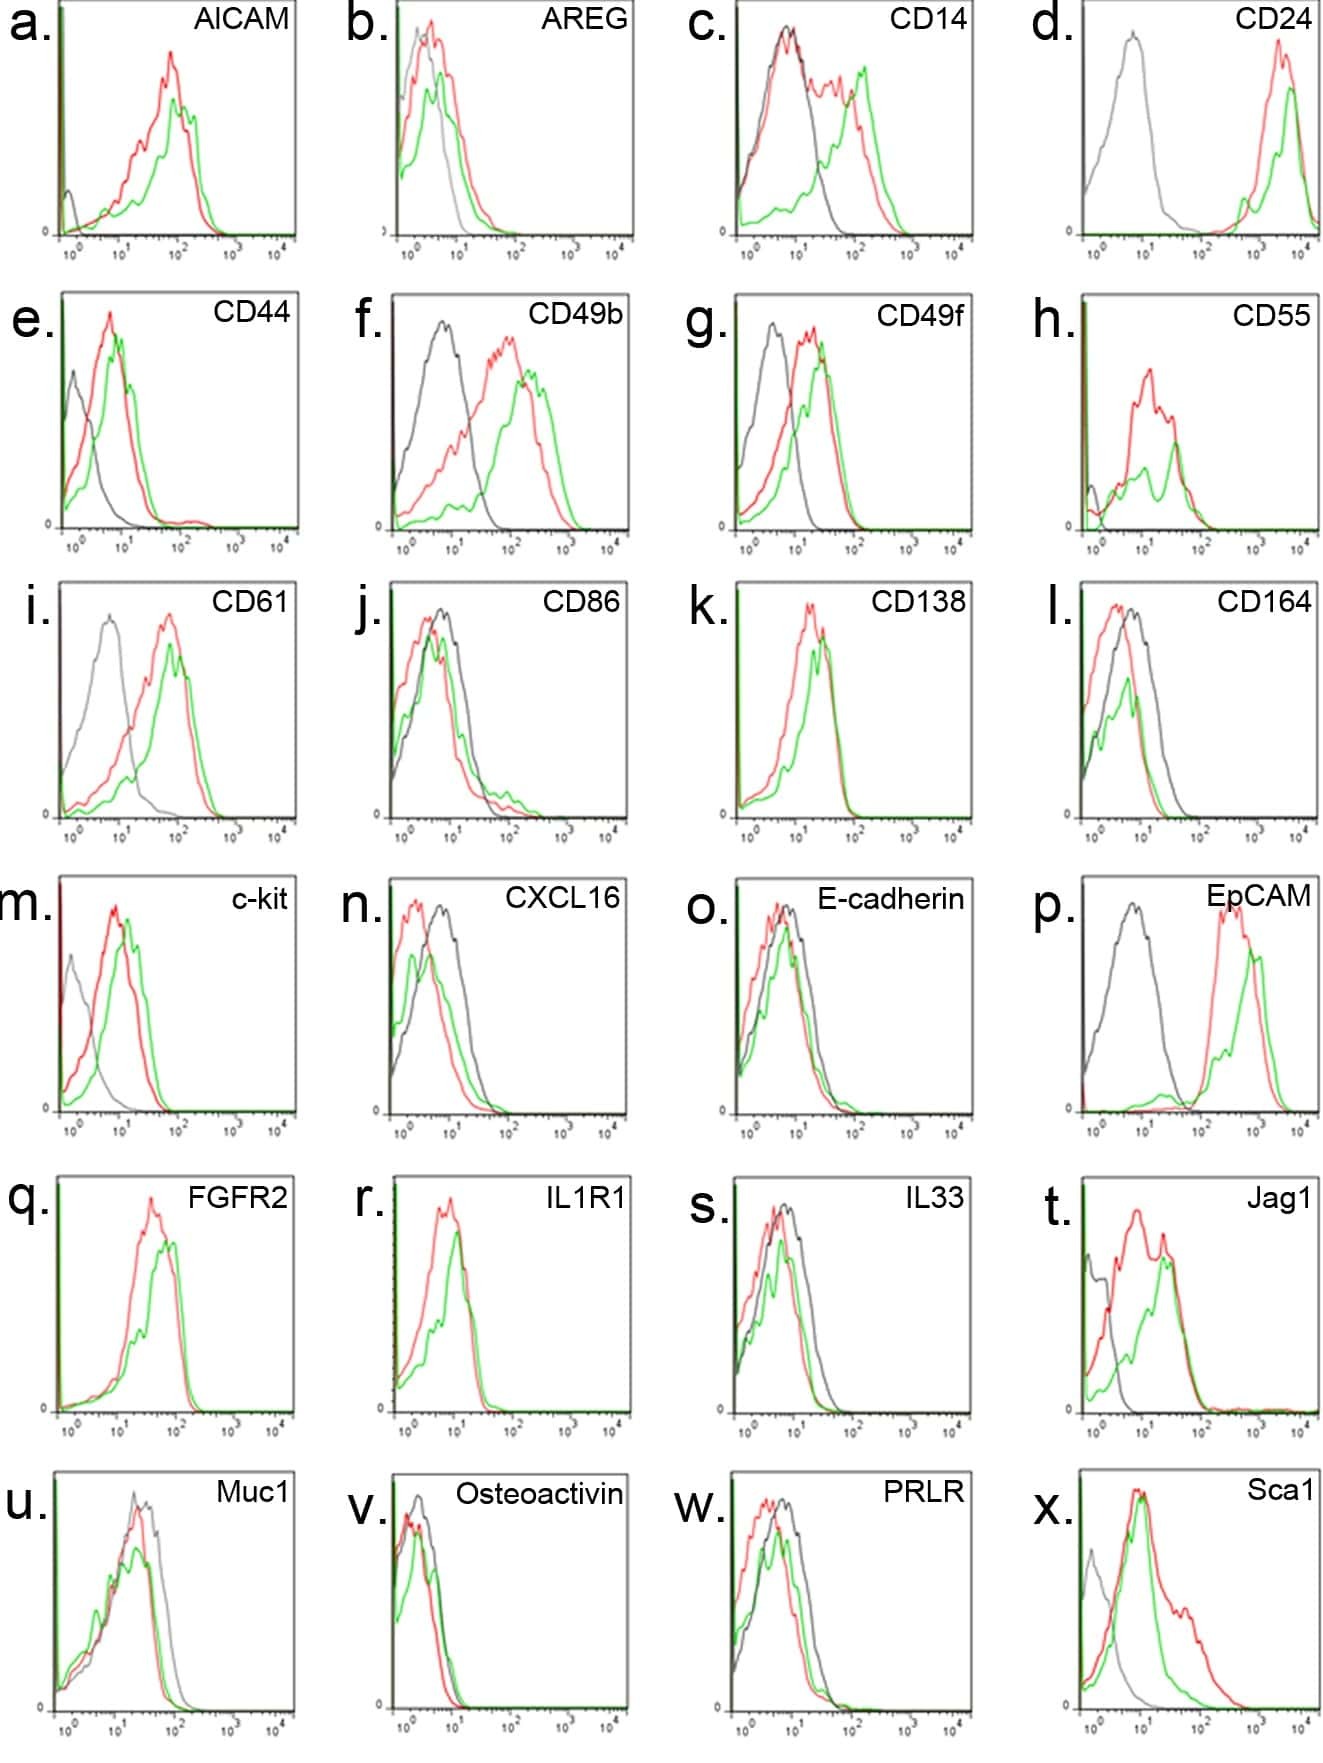
- Submitted by
- Invitrogen Antibodies (provider)
- Main image
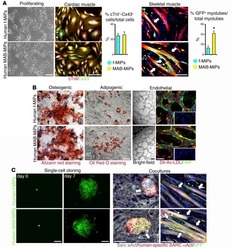
- Experimental details
- NULL
- Conjugate
- Biotin
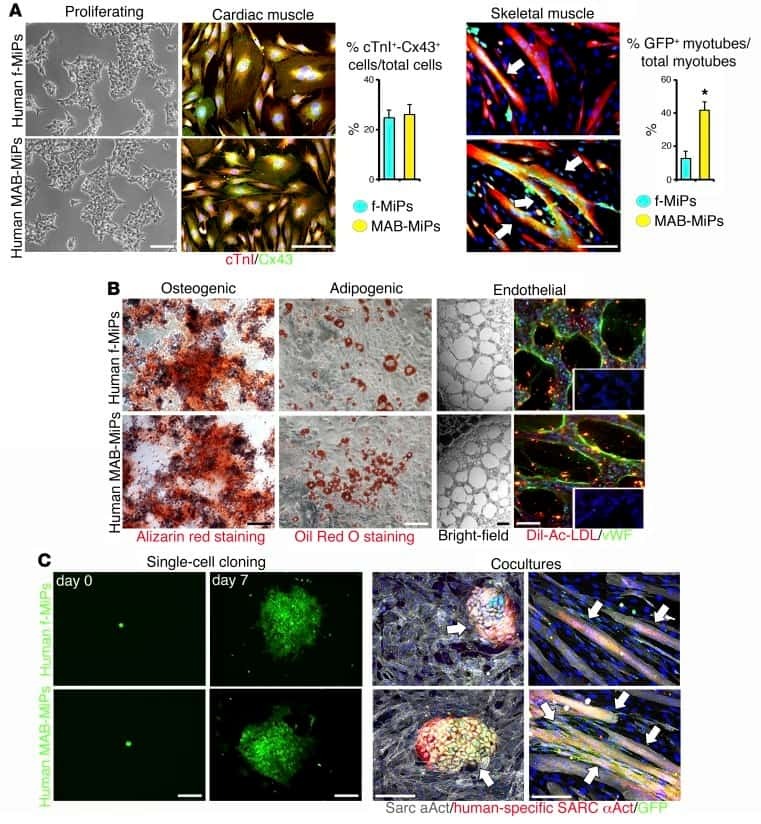
- Submitted by
- Invitrogen Antibodies (provider)
- Main image

- Experimental details
- NULL
- Conjugate
- Biotin
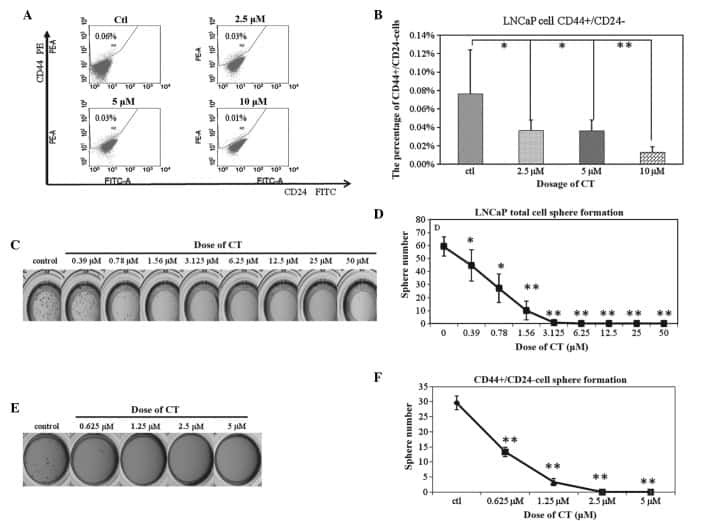
- Submitted by
- Invitrogen Antibodies (provider)
- Main image
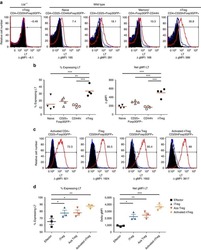
- Experimental details
- NULL
- Conjugate
- Biotin
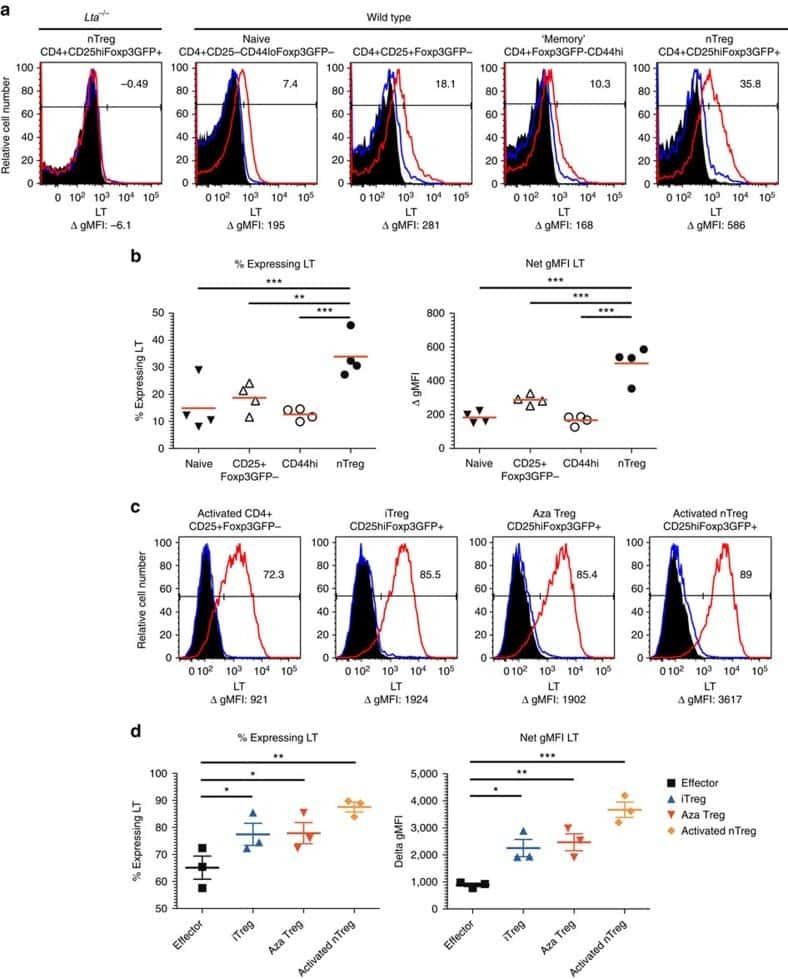
- Submitted by
- Invitrogen Antibodies (provider)
- Main image
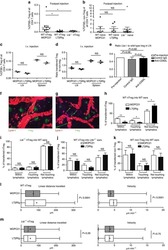
- Experimental details
- NULL
- Conjugate
- Biotin

- Submitted by
- Invitrogen Antibodies (provider)
- Main image
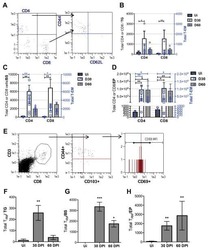
- Experimental details
- NULL
- Conjugate
- Biotin
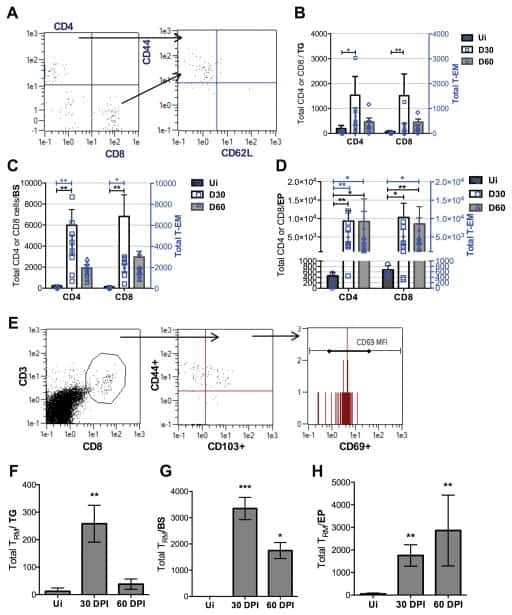
- Submitted by
- Invitrogen Antibodies (provider)
- Main image

- Experimental details
- NULL
- Conjugate
- Biotin
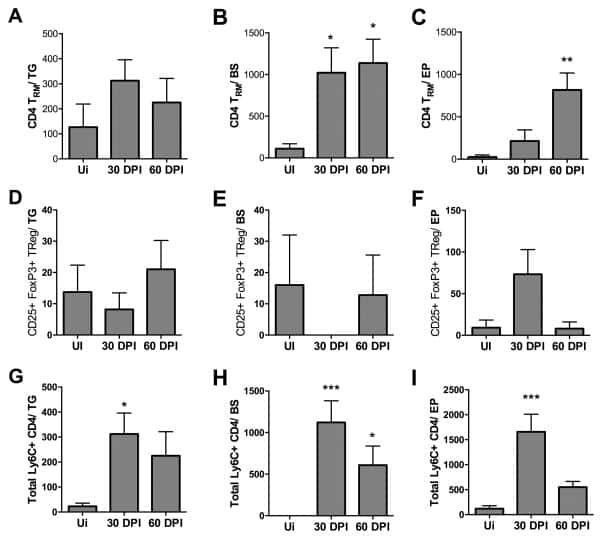
- Submitted by
- Invitrogen Antibodies (provider)
- Main image
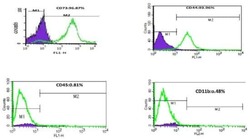
- Experimental details
- NULL
- Conjugate
- Biotin

- Submitted by
- Invitrogen Antibodies (provider)
- Main image
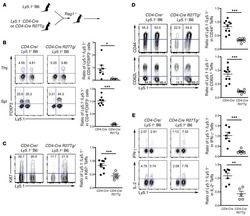
- Experimental details
- NULL
- Conjugate
- Biotin
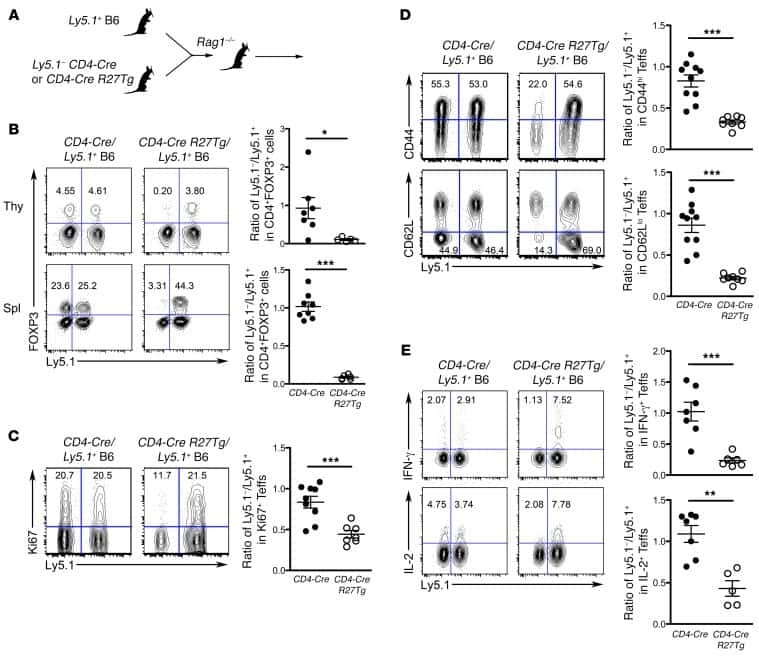
- Submitted by
- Invitrogen Antibodies (provider)
- Main image
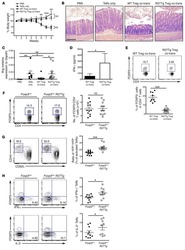
- Experimental details
- NULL
- Conjugate
- Biotin

- Submitted by
- Invitrogen Antibodies (provider)
- Main image
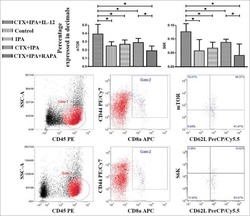
- Experimental details
- NULL
- Conjugate
- Biotin
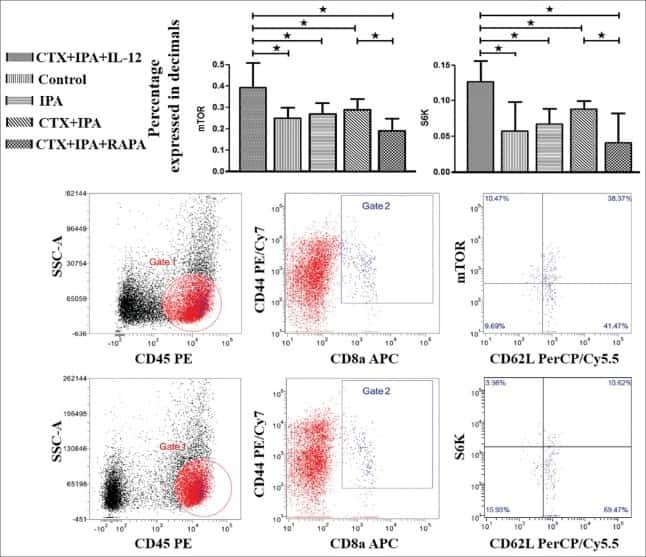
- Submitted by
- Invitrogen Antibodies (provider)
- Main image
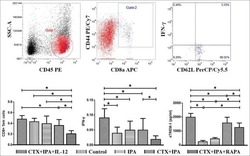
- Experimental details
- NULL
- Conjugate
- Biotin
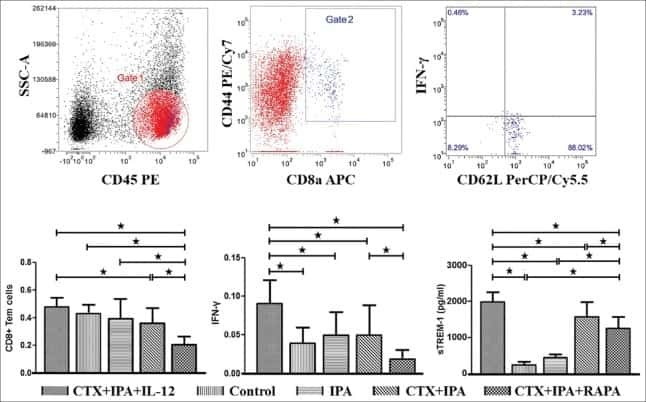
- Submitted by
- Invitrogen Antibodies (provider)
- Main image
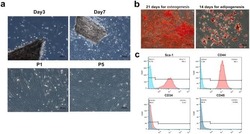
- Experimental details
- NULL
- Conjugate
- Biotin
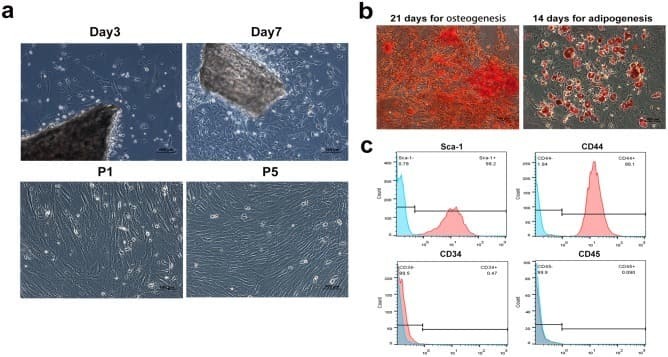
- Submitted by
- Invitrogen Antibodies (provider)
- Main image
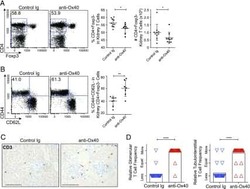
- Experimental details
- NULL
- Conjugate
- Biotin
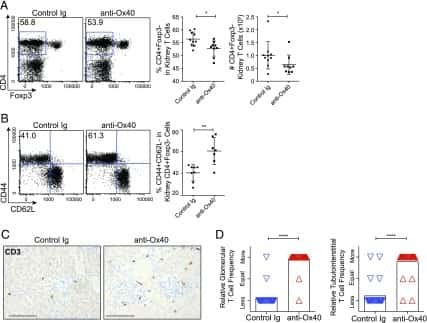
- Submitted by
- Invitrogen Antibodies (provider)
- Main image
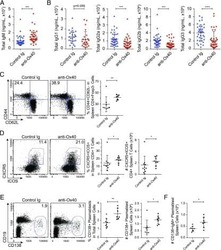
- Experimental details
- NULL
- Conjugate
- Biotin
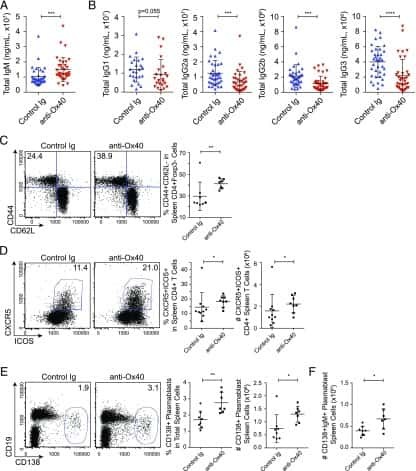
- Submitted by
- Invitrogen Antibodies (provider)
- Main image

- Experimental details
- NULL
- Conjugate
- Biotin
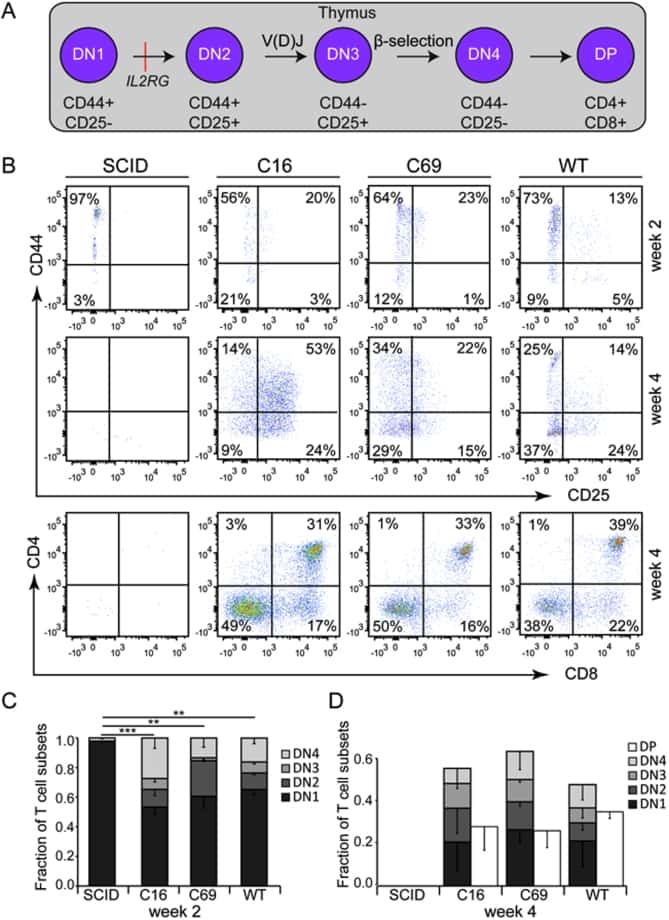
- Submitted by
- Invitrogen Antibodies (provider)
- Main image
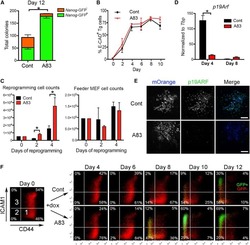
- Experimental details
- NULL
- Conjugate
- Biotin
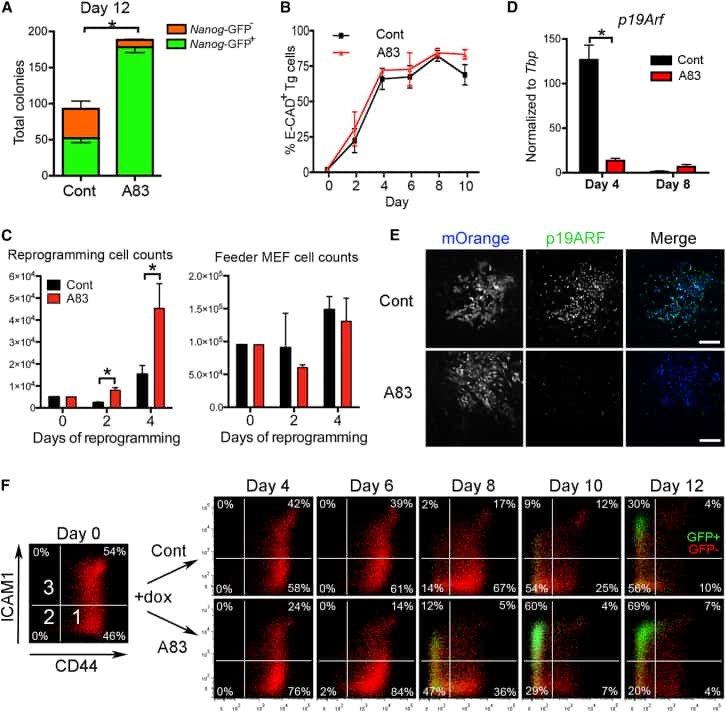
- Submitted by
- Invitrogen Antibodies (provider)
- Main image
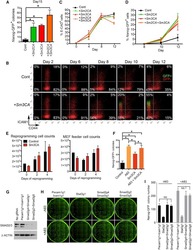
- Experimental details
- NULL
- Conjugate
- Biotin
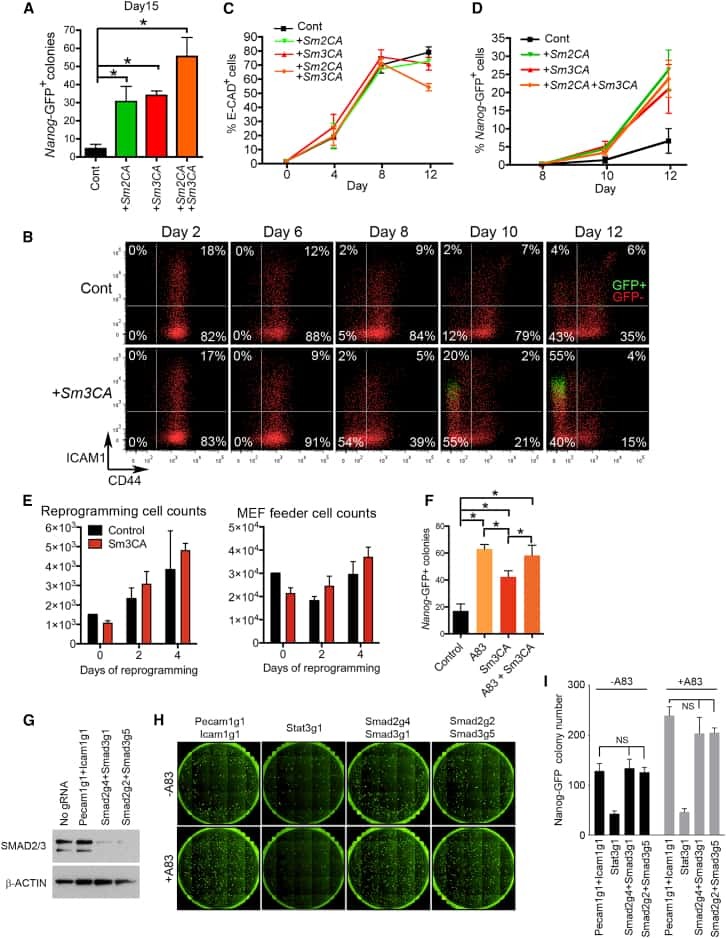
- Submitted by
- Invitrogen Antibodies (provider)
- Main image
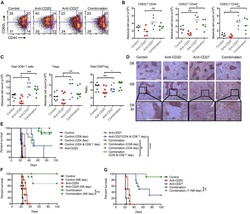
- Experimental details
- NULL
- Conjugate
- Biotin

- Submitted by
- Invitrogen Antibodies (provider)
- Main image
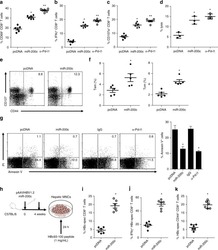
- Experimental details
- NULL
- Conjugate
- Biotin

- Submitted by
- Invitrogen Antibodies (provider)
- Main image
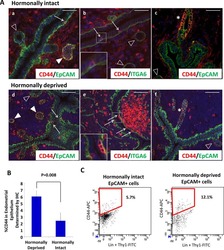
- Experimental details
- NULL
- Conjugate
- Biotin
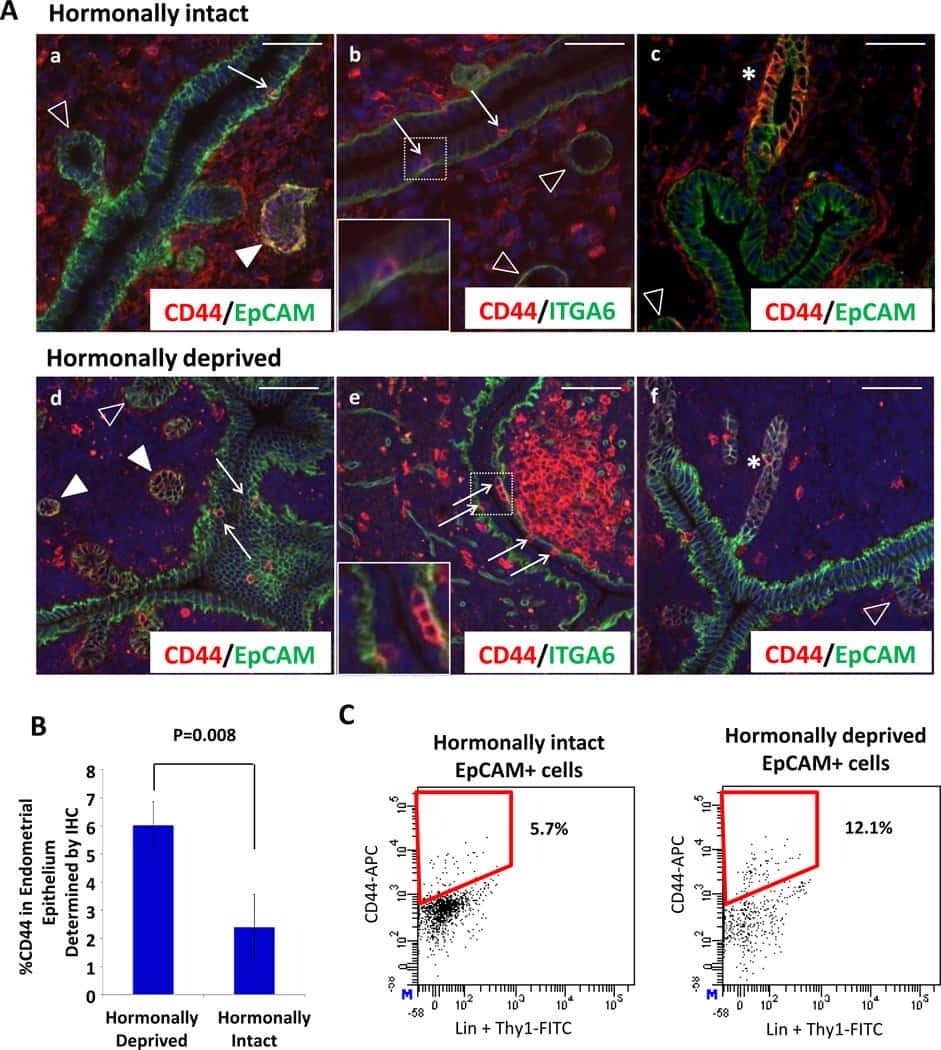
- Submitted by
- Invitrogen Antibodies (provider)
- Main image

- Experimental details
- NULL
- Conjugate
- Biotin
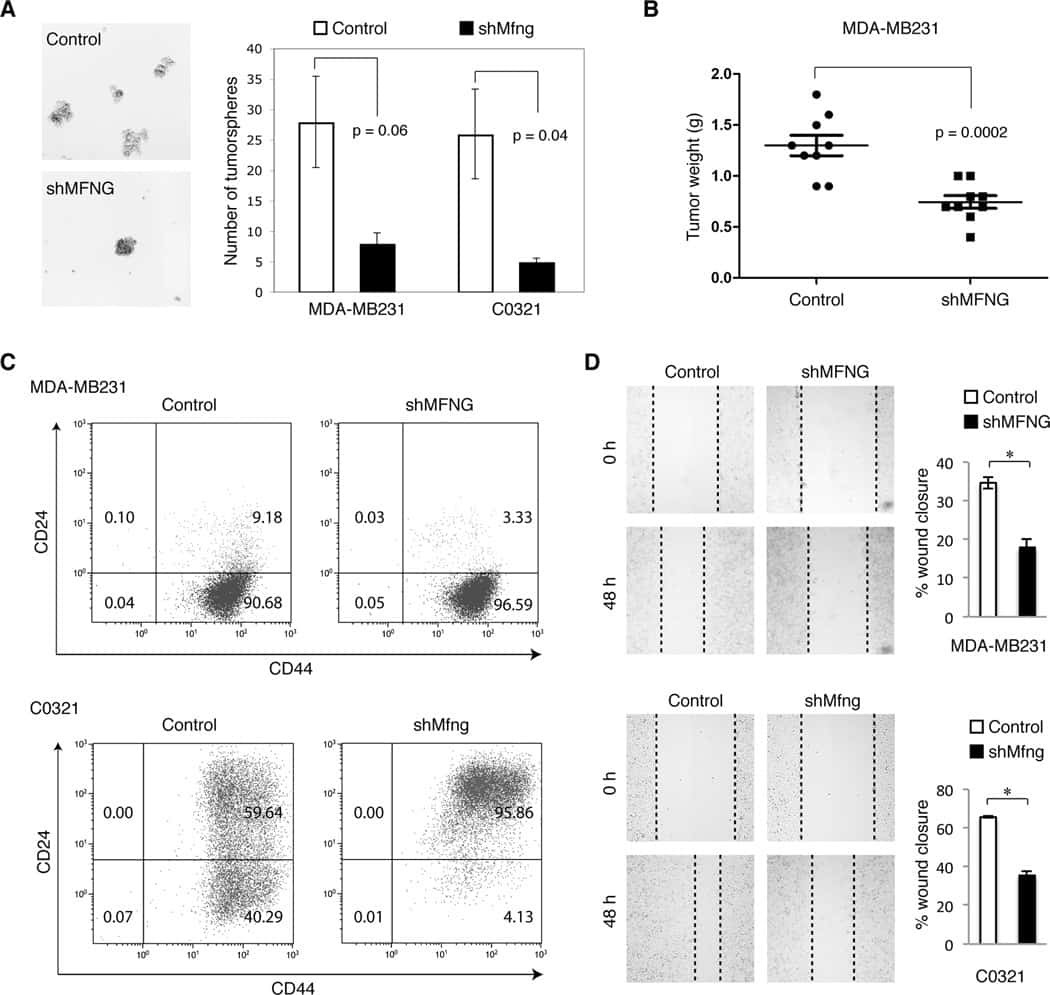
- Submitted by
- Invitrogen Antibodies (provider)
- Main image
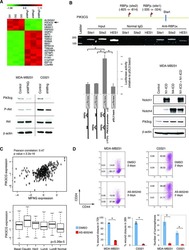
- Experimental details
- NULL
- Conjugate
- Biotin

- Submitted by
- Invitrogen Antibodies (provider)
- Main image
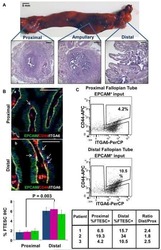
- Experimental details
- NULL
- Conjugate
- Biotin
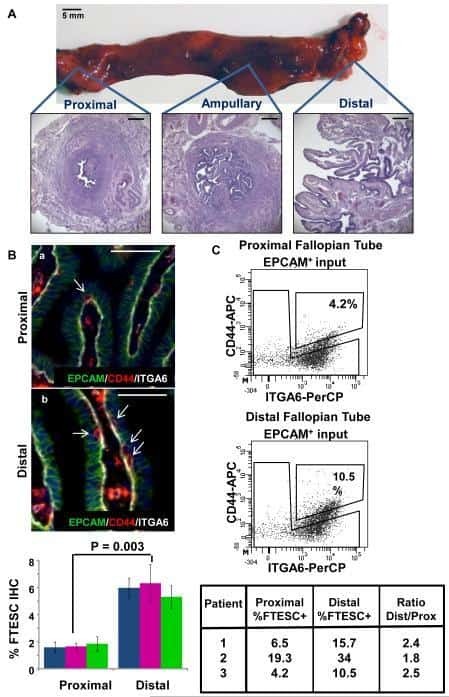
- Submitted by
- Invitrogen Antibodies (provider)
- Main image
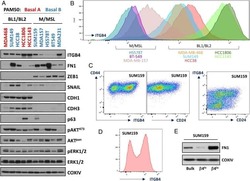
- Experimental details
- NULL
- Conjugate
- Biotin

- Submitted by
- Invitrogen Antibodies (provider)
- Main image
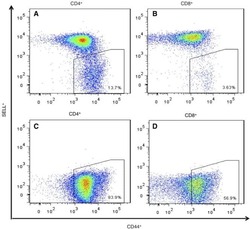
- Experimental details
- NULL
- Conjugate
- Biotin
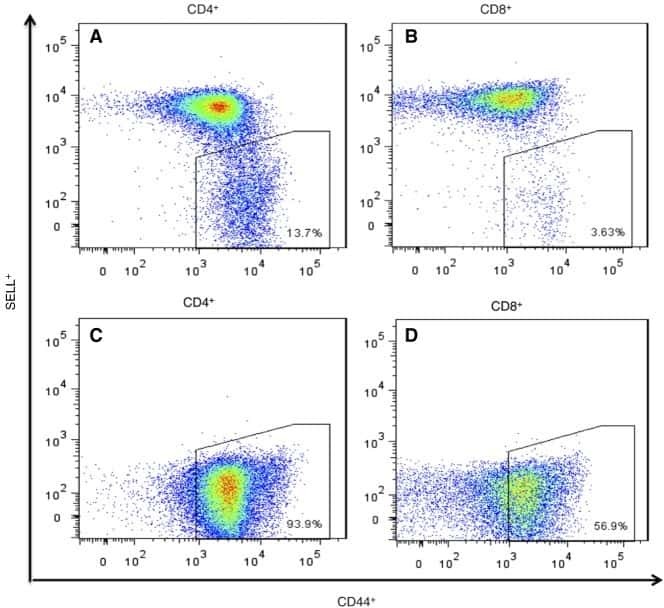
- Submitted by
- Invitrogen Antibodies (provider)
- Main image

- Experimental details
- NULL
- Conjugate
- Biotin
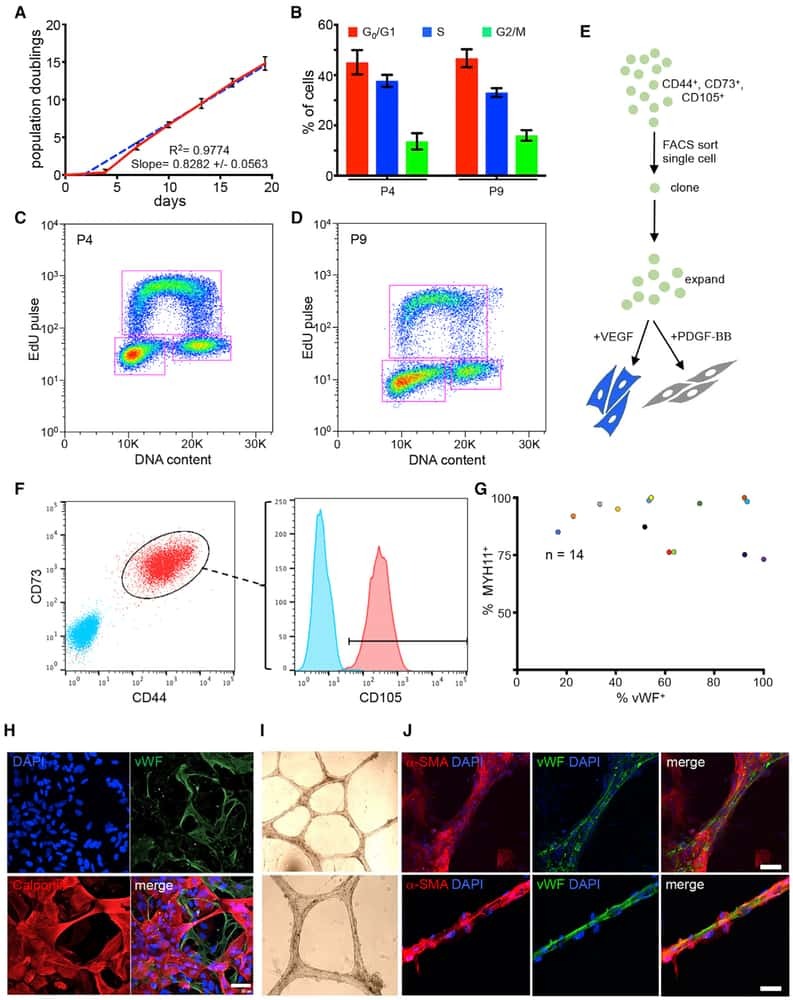
- Submitted by
- Invitrogen Antibodies (provider)
- Main image
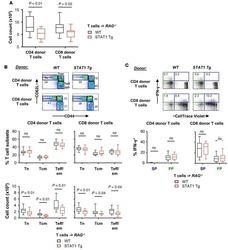
- Experimental details
- NULL
- Conjugate
- Biotin

- Submitted by
- Invitrogen Antibodies (provider)
- Main image
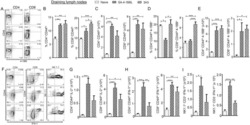
- Experimental details
- NULL
- Conjugate
- Biotin
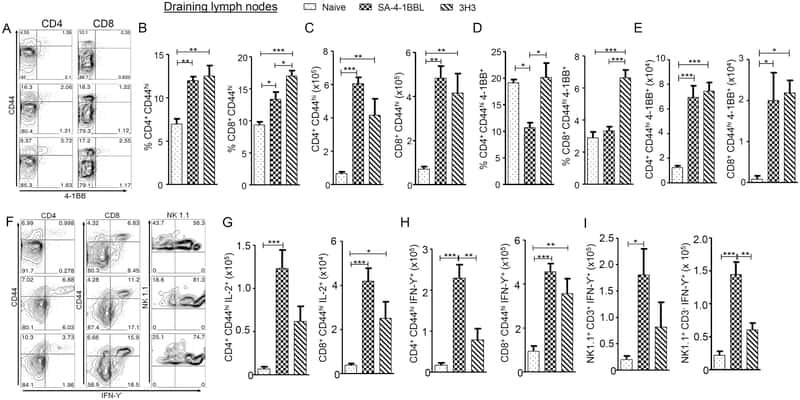
- Submitted by
- Invitrogen Antibodies (provider)
- Main image

- Experimental details
- NULL
- Conjugate
- Biotin
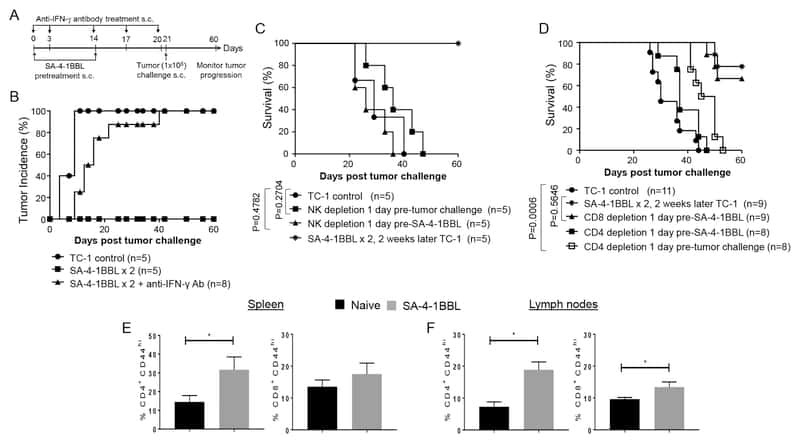
- Submitted by
- Invitrogen Antibodies (provider)
- Main image
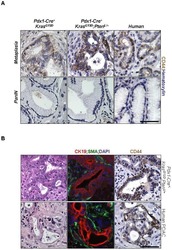
- Experimental details
- NULL
- Conjugate
- Biotin

- Submitted by
- Invitrogen Antibodies (provider)
- Main image
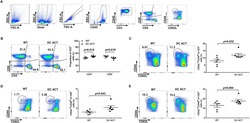
- Experimental details
- NULL
- Conjugate
- Biotin
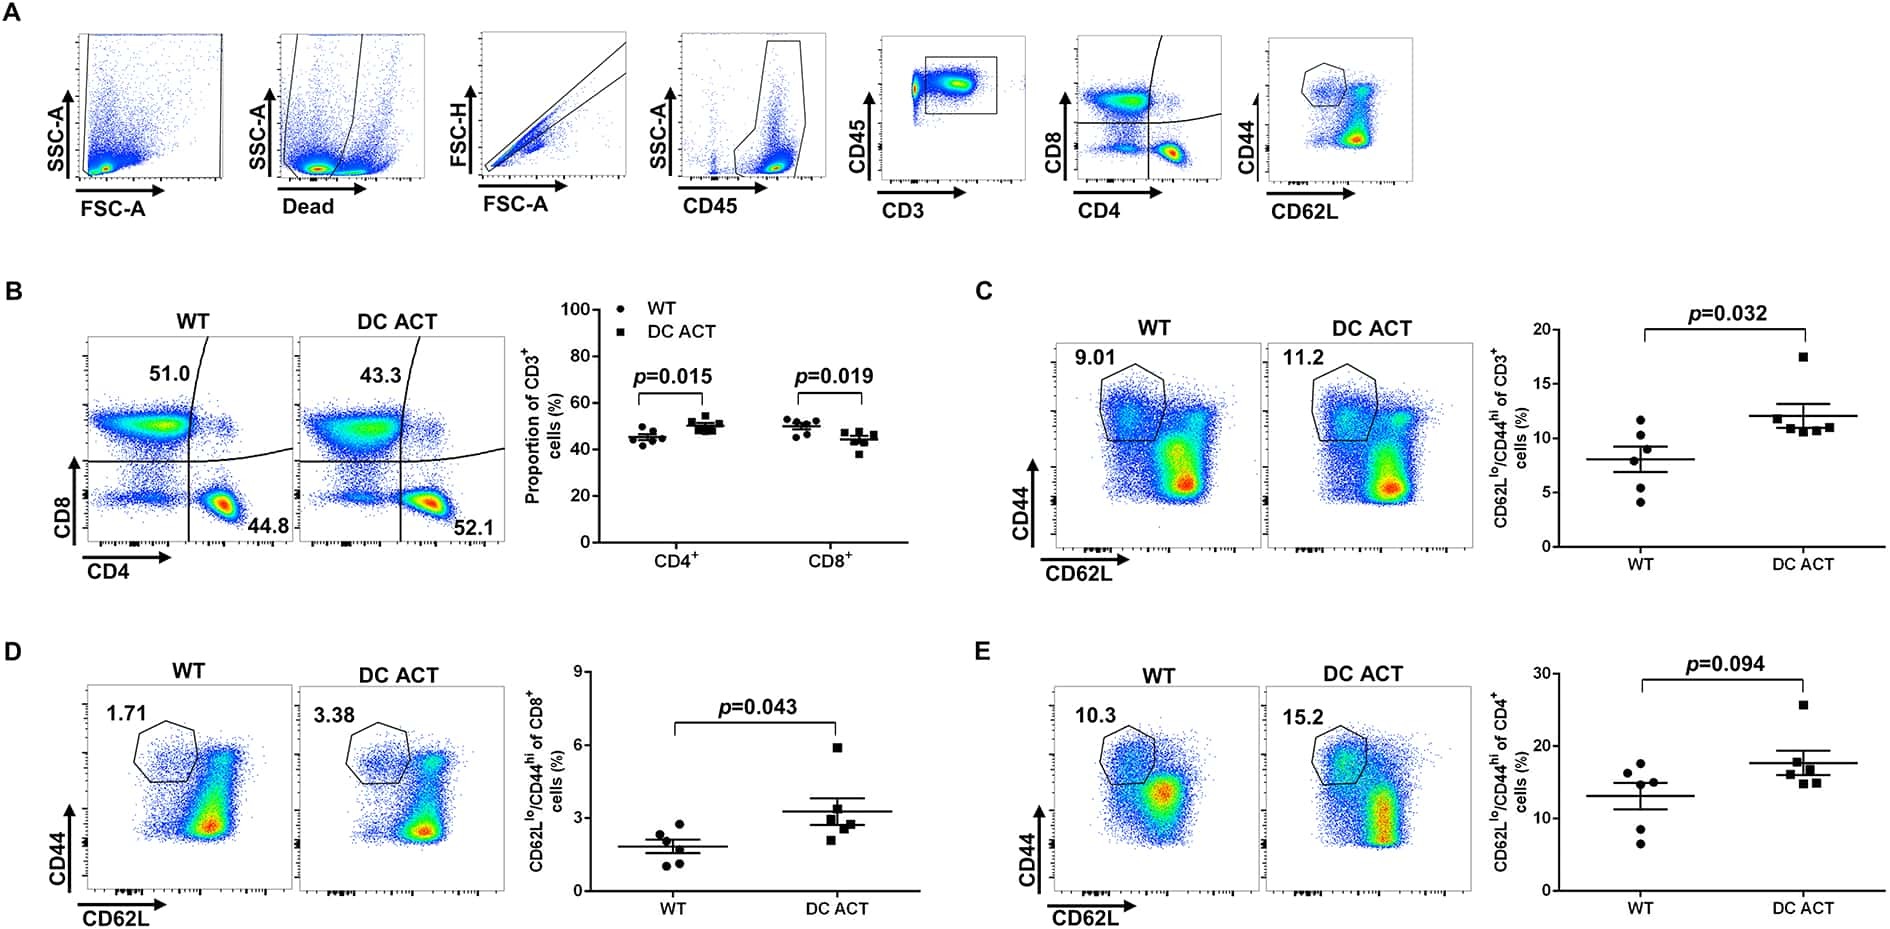
- Submitted by
- Invitrogen Antibodies (provider)
- Main image
- Experimental details
- NULL
- Conjugate
- Biotin
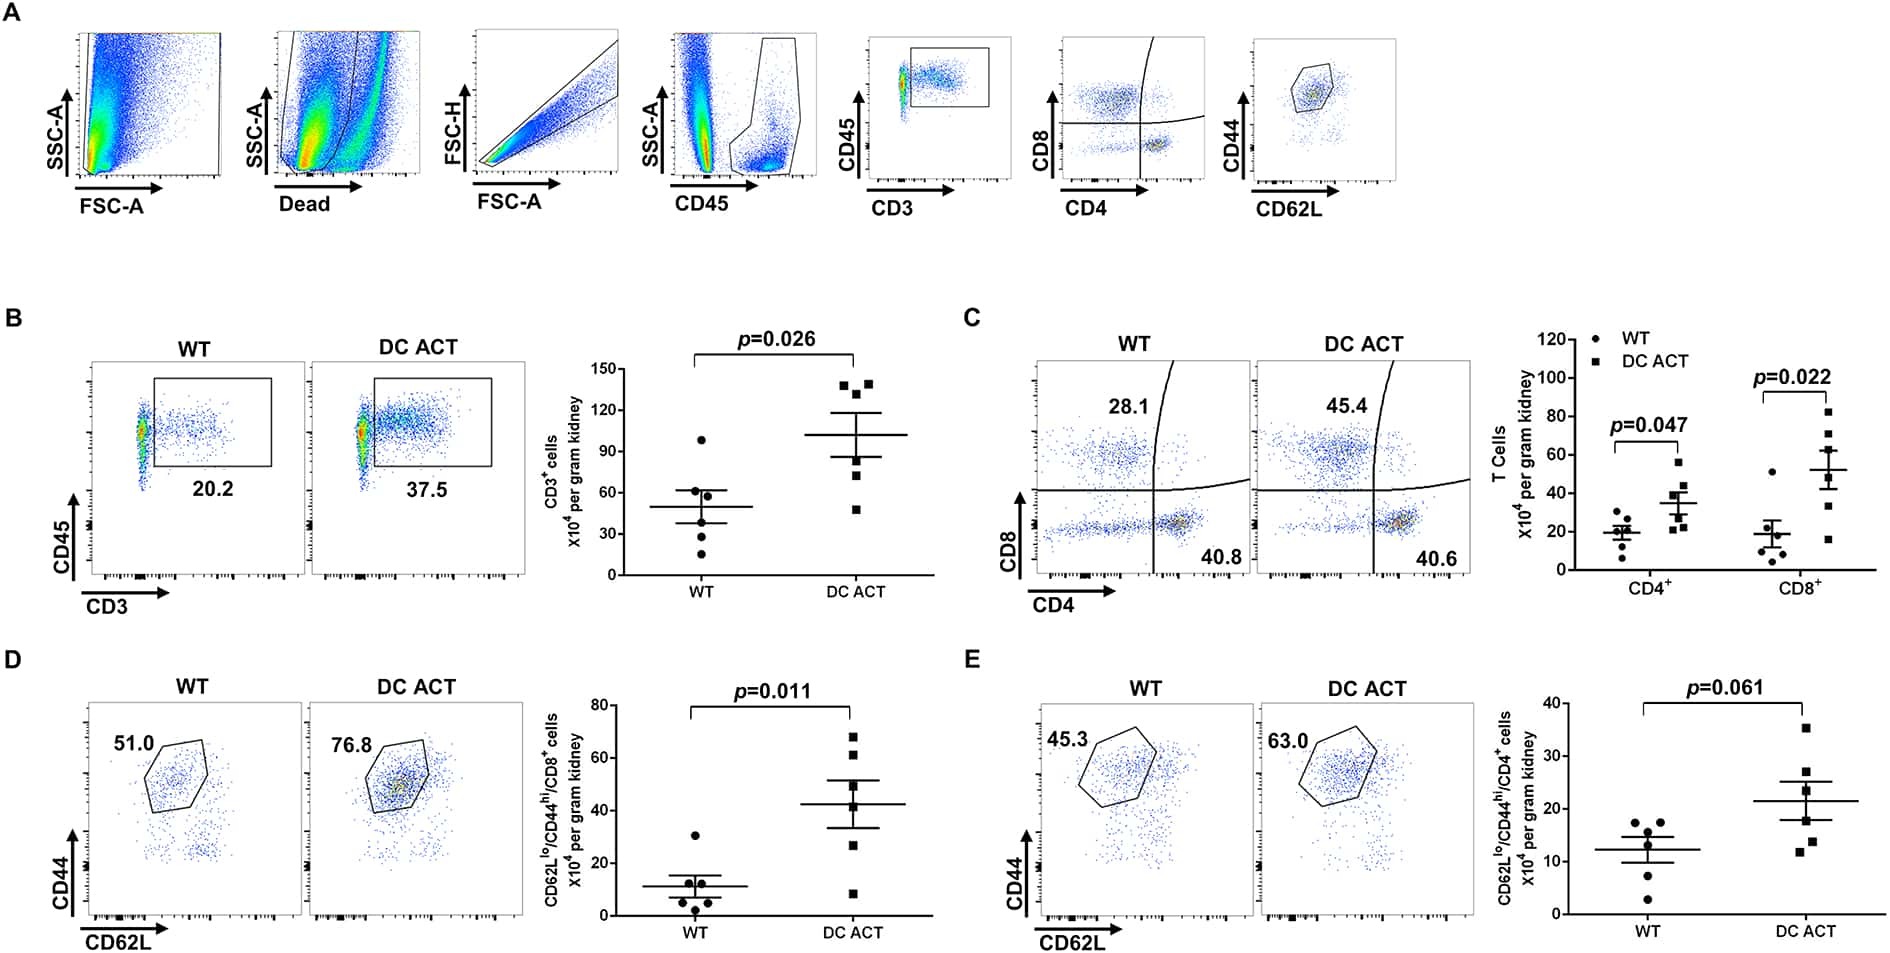
- Submitted by
- Invitrogen Antibodies (provider)
- Main image
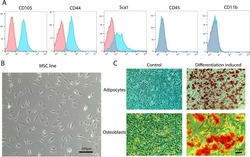
- Experimental details
- NULL
- Conjugate
- Biotin
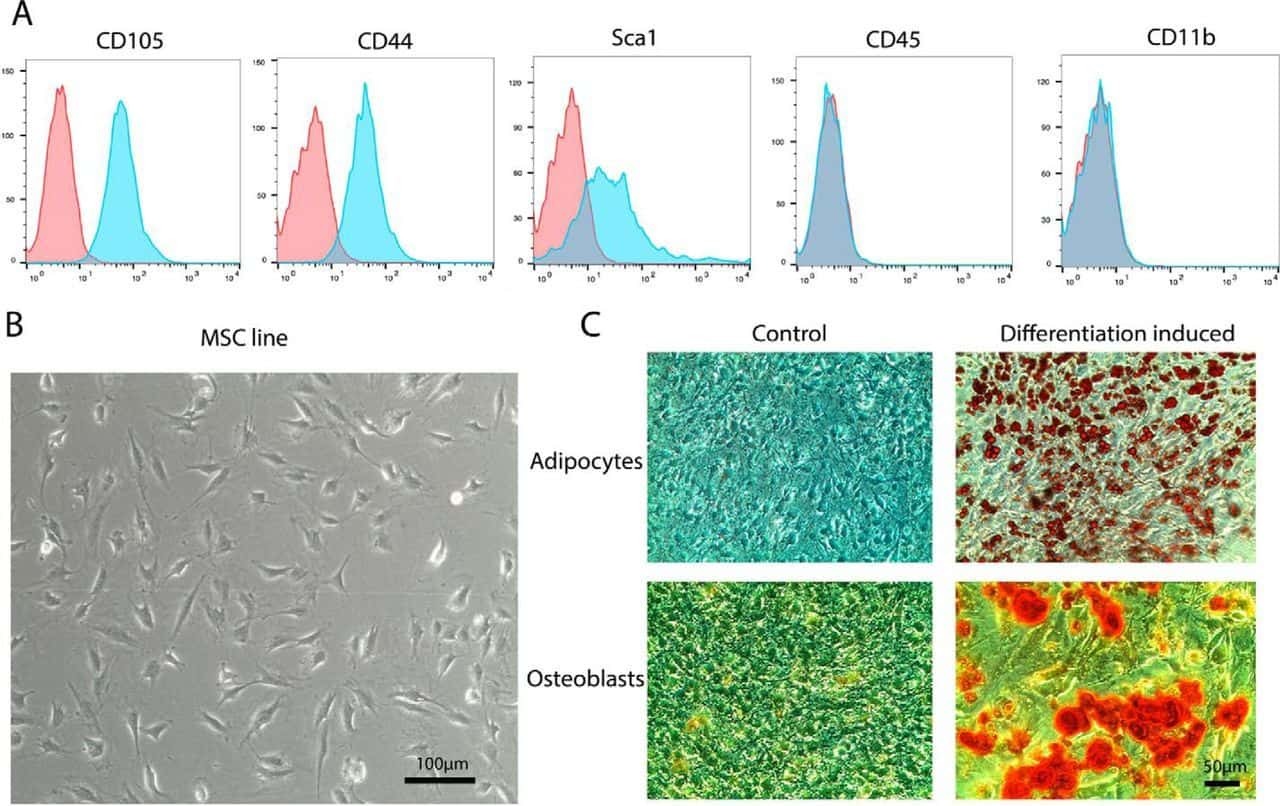
- Submitted by
- Invitrogen Antibodies (provider)
- Main image
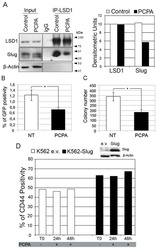
- Experimental details
- NULL
- Conjugate
- Biotin
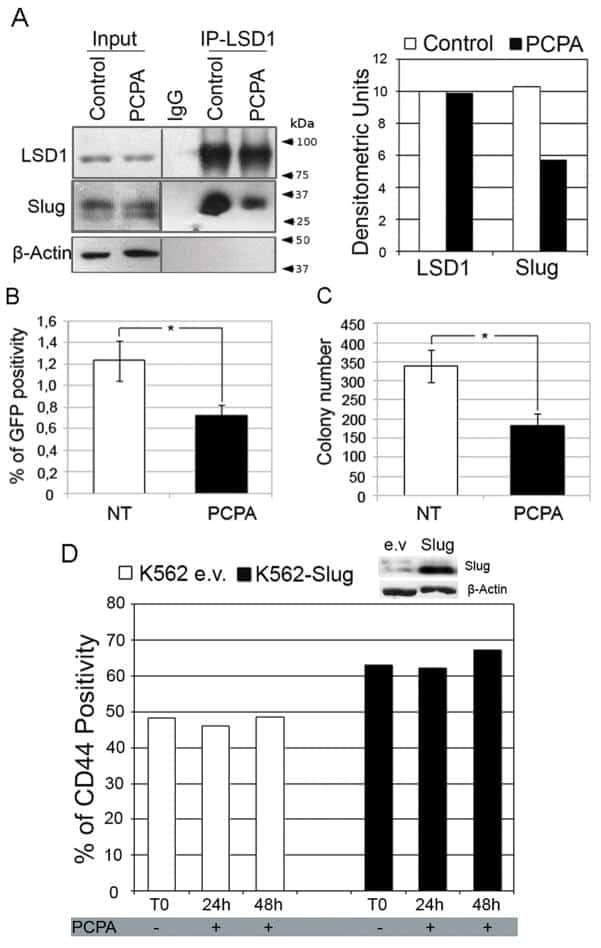
- Submitted by
- Invitrogen Antibodies (provider)
- Main image
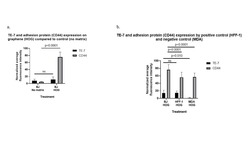
- Experimental details
- NULL
- Conjugate
- Biotin
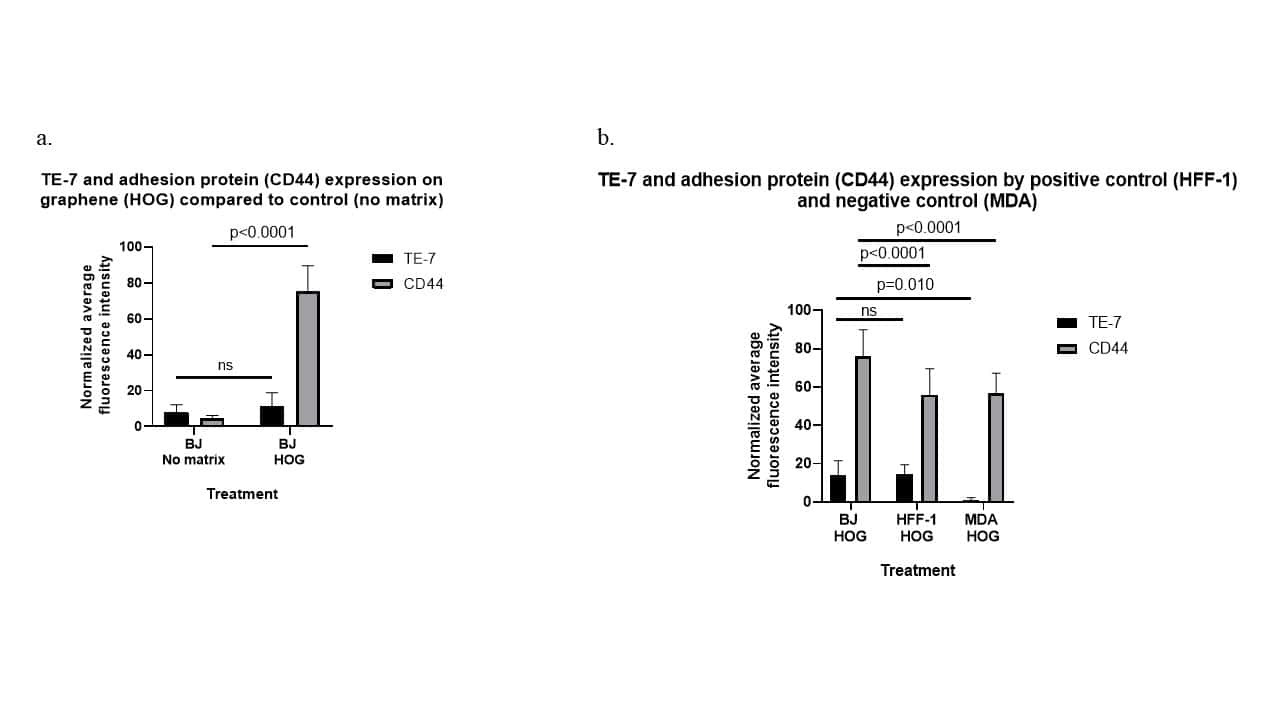
- Submitted by
- Invitrogen Antibodies (provider)
- Main image
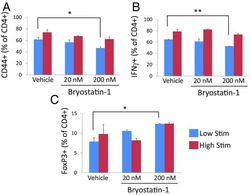
- Experimental details
- NULL
- Conjugate
- Biotin

- Submitted by
- Invitrogen Antibodies (provider)
- Main image
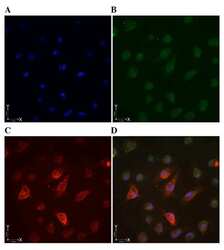
- Experimental details
- Figure 3. Immunofluorescence detection of breast cancer cells with different stem cell marker by laser confocal microscopy. (A) DAPI stained nuclei. (B) ALDH1 + cells exhibited green fluorescence in the cytoplasm. (C) CD44 + CD24 -/low cells were exhibited brownish/red fluorescence in the membrane, with some cells showing cytoplasmic fluorescence. (D) ALDH1 + CD44 + CD24 -/low cells exhibited brownish/red fluorescence in the membrane and green fluorescence in the cytoplasm. ALDH1, aldehyde dehydrogenase 1.
- Conjugate
- Biotin
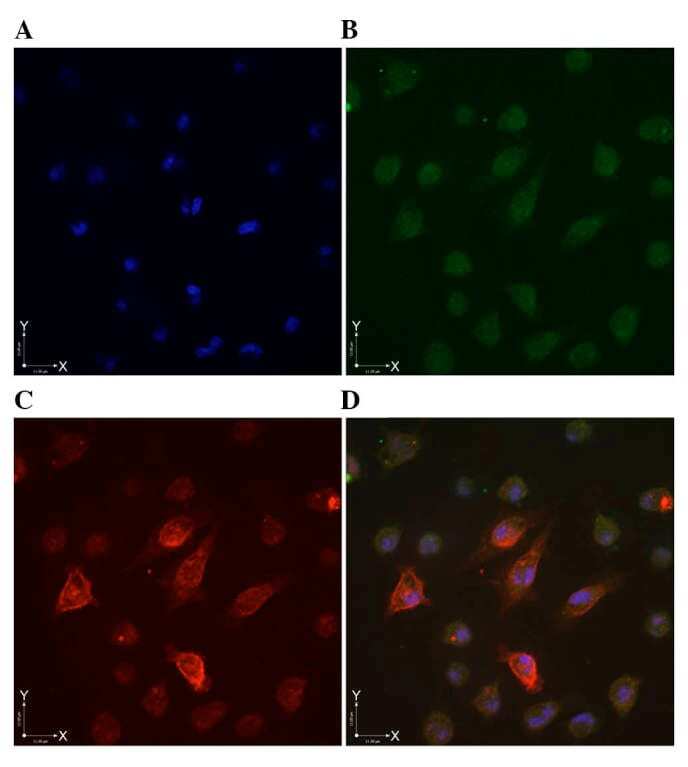
- Submitted by
- Invitrogen Antibodies (provider)
- Main image
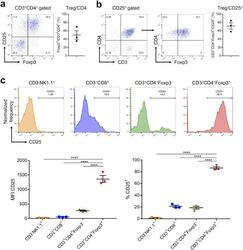
- Experimental details
- Fig. 2 CD25 expression on tumor-infiltrating lymphocytes. (a) Tumor-infiltrating lymphocytes were analyzed with flow cytometry. Tregs accounted for 49.8% of CD4 + T cells. (b) 71.5% of CD25 positive cells were CD3 + CD4 + Foxp3 + Tregs (c) Upper: Surface expression of CD25 was evaluated for NK cells, CD8 + T cells, CD4 + Foxp3 - T cells, and CD4 + Foxp3 + Tregs. Lower: CD4 + Foxp3 + Tregs showed significantly higher mean fluorescence intensity (MFI) of CD25 (left) and CD25 positive percentage (right) ( n = 4; one-way ANOVA followed by Tukey''s test; ****, p < 0.0001). Fig 2
- Conjugate
- Biotin
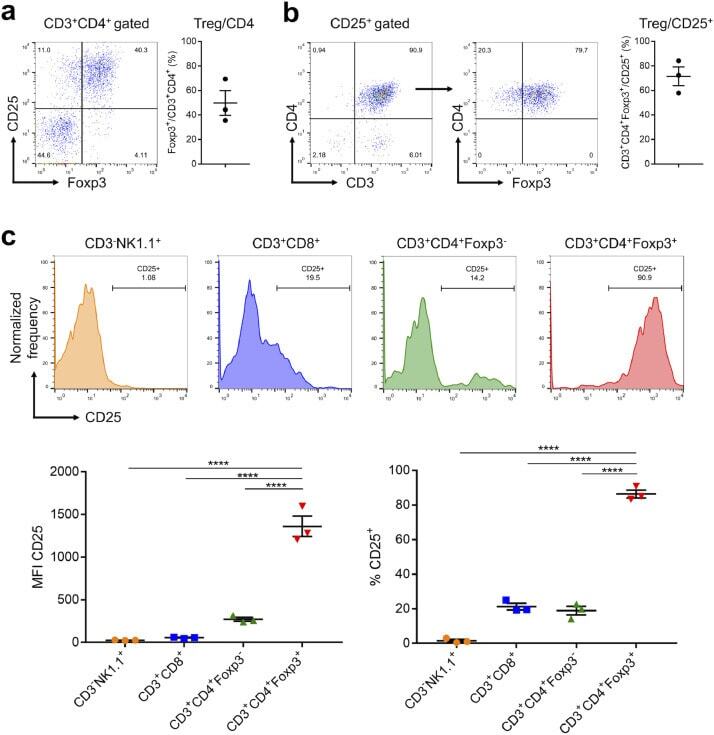
- Submitted by
- Invitrogen Antibodies (provider)
- Main image
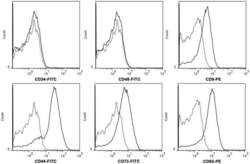
- Experimental details
- Figure 2 hWJMSC-MVs surface expressed molecules analysis. Flow cytometery analysis showed hWJMSC-MVs were positive for some surface expressed molecules typically expressed by MSCs, such as CD9, CD44, CD63, CD73, and negative for CD34, CD45.
- Conjugate
- Biotin

- Submitted by
- Invitrogen Antibodies (provider)
- Main image

- Experimental details
- Figure 2 GPT2-induced breast cancer cell stemness and tumorigenesis A. & B. GPT2 promotes colony formation of breast cancer cells. A. Colony formation assay (n = 3), ***: P < 0.001; **: P < 0.01. B. Soft agar assay (n = 3). ***: P < 0.001 C. The effects of glutamine on colony formation. The basic medium was without glutamine. D. Flow cytometry analysis of CD44 and CD24 expression in GPT2 overexpressing MDA-MB-231 and GPT2 knockdown MCF7 cells. The values represent percentage of CD44 + CD24 - cells. **: P < 0.01;*: P < 0.05. E. GPT2 and ALDH expression was analyzed in GPT2 overexpressing MDA-MB-231 and GPT2 knockdown MCF7 cells by immunofluorescence staining. Red and green represent GPT2 and ALDH, respectively (20 X). F. Representative Western blots show the expression of ALDH, SOX2, OCT4 and NANOG in GPT2 overexpressing MDA-MB-231 and GPT2 knockdown MCF7 cells. G. GPT2 and ALDH expression was analyzed in clinical breast tumors and paratumor tissues by immunofluorescence staining (n= 6 cases). Red and green represent GPT2 and ALDH, respectively (10 X). The values on the histogram represent cell numbers per view. The big white bars represent GPT2 positive cell numbers while the small shading bars inside indicate ALDH positive cell numbers. GPT2 overexpression cells were MDA-MB-231 while GPT2 knockdown cells were MCF7. Data in (A-G) represent three independent experiments. Error bars: standard deviation. ***: P < 0.001; **: P < 0.01; *: P < 0.05.
- Conjugate
- Biotin
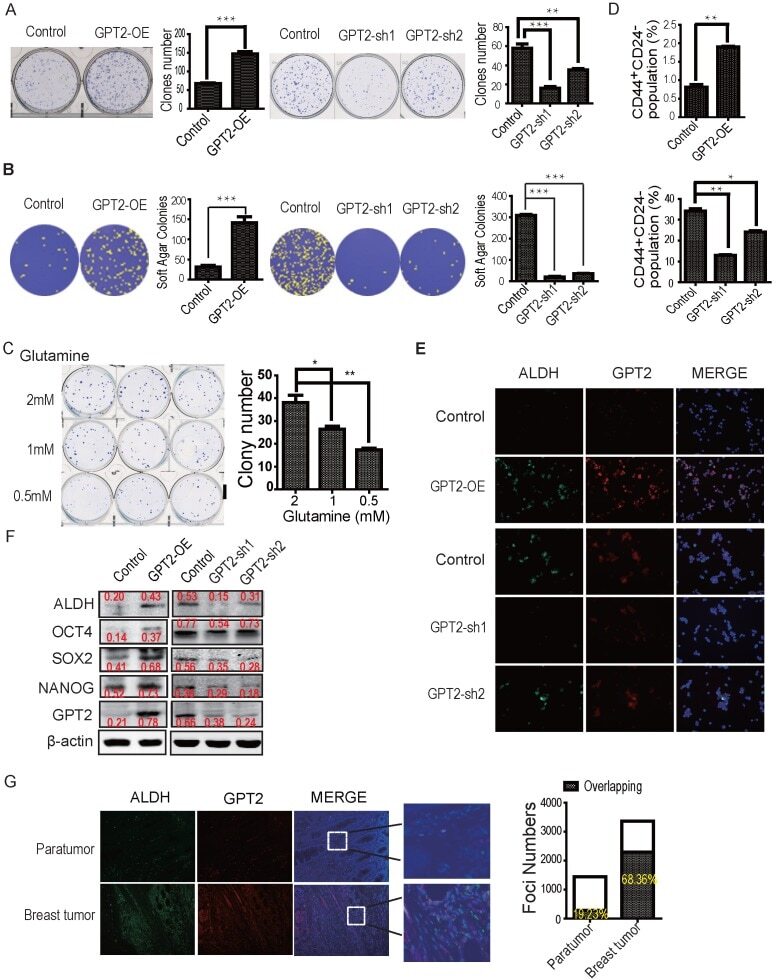
- Submitted by
- Invitrogen Antibodies (provider)
- Main image
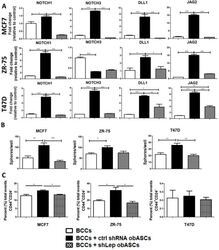
- Experimental details
- Figure 4 obASCs promote a cancer stem-like phenotype through leptin. ( A ) Transwell co-culture with shCtrl obASCs upregulates NOTCH1, NOTCH3, DELTA1, and JAGGED2 in ER + BCCs. ( B ) BCCs have increased ability to form mammospheres after co-culture with shCtrl obASCs followed by 2 Gy radiation compared to non-co-cultured cells or cells co-cultured with shLep obASCs. ( C ) Flow cytometric analysis of the breast cancer stem cell markers CD44 + CD24 - was evaluated for BCCs after transwell co-culture with shCtrl obASCs or shLep obASCs. Values reported are the mean of three independent experiments each performed in triplicate. Bars, +- SEM. * p < 0.05, ** p < 0.01, *** p < 0.001.
- Conjugate
- Biotin
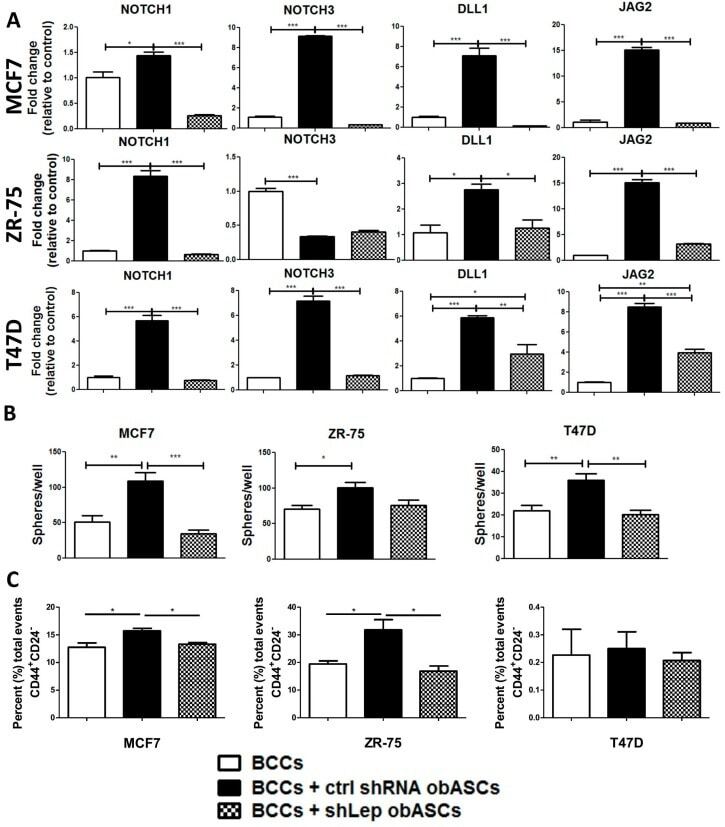
- Submitted by
- Invitrogen Antibodies (provider)
- Main image
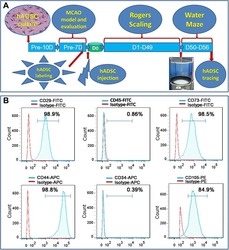
- Experimental details
- Figure 1 Experimental diagram (A) , hADSC surface antigen profiling with FACS showed that hADSCs positively express CD29, CD44, CD73 and CD105, negatively express CD34 and CD45 (B) . FACS, flow activated cell sorting; hADSCs, human adipose-derived stem cells.
- Conjugate
- Biotin
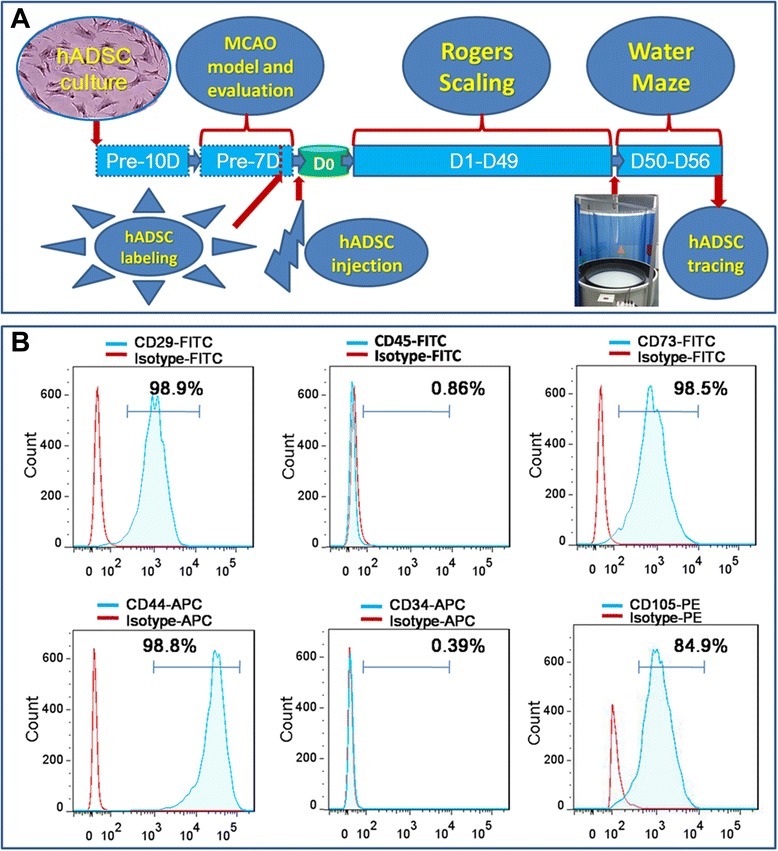
- Submitted by
- Invitrogen Antibodies (provider)
- Main image
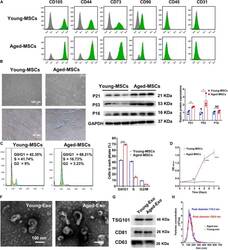
- Experimental details
- FIGURE 1 Characterization of young and aged MSCs and exosomes. (A) Surface marker profiling of young-MSCs and aged-MSCs. (B) SA-beta-Gal staining showed that senescence increased significantly in aged MSCs. (C) Representative immunoblot images and quantitative analysis of p21, p53, and p16 protein level in young and aged-MSCs. ( n = 3). (D) Quantitation of cell cycle phases by propidium iodide staining. ( n = 3). (E) The CCK-8 assay showed that aged MSCs grew more slowly than young MSCs. ( n = 6). (F) Young and aged exosomes were observed using TEM. (G) The exosome surface markers were analyzed by Western blot. (H) Nanoparticle tracking analysis was used to analyze the particle size and concentration of Young-Exo and Aged-Exo. * p < 0.05; ** p < 0.01; *** p < 0.001; **** p < 0.0001; NS, not significant.
- Conjugate
- Biotin
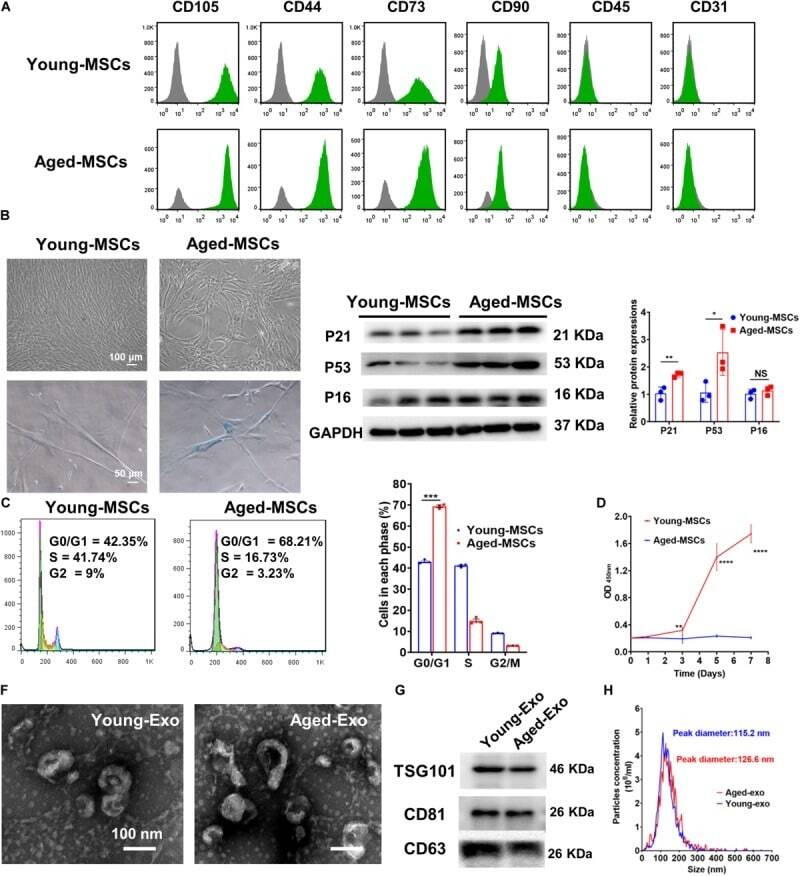
- Submitted by
- Invitrogen Antibodies (provider)
- Main image
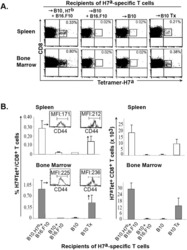
- Experimental details
- Figure 4 Persistence of H7 a -specific CD8 + memory T cells. We studied four experimental groups: i) B10.H7 b and B10 mice successfully treated for melanoma as described in Fig. 1 (+B16.F10); ii) euthymic and thymectomized (Tx) B10 mice that underwent the same protocol excepting injection of melanoma cells on day 0. On day 100, we sacrificed 3 mice per group and stained cell suspensions from spleen and bone marrow with H7 a tetramers and antibodies against CD8 and CD44. A) Dot plots of one representative experiment out of three (gated on CD8 cells). B) Proportion and absolute number of H7 a -specific T cells in recipients' spleen and bone marrow (2 tibiae and femurs). Histograms represent the mean+-SD of 3 mice per group. Inserts depict CD44 expression on tetramer + CD8 T cells found in euthymic B10.H7 b and thymectomized B10 hosts. MFI: mean fluorescence intensity.
- Conjugate
- Biotin

- Submitted by
- Invitrogen Antibodies (provider)
- Main image
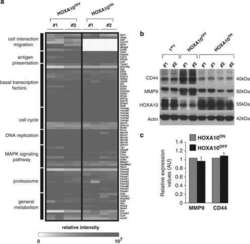
- Experimental details
- Figure 4 High levels of the CD44 transendothelial marker correlate with increased leukemia rate generated by LICs after withdrawal of the initial HOXA10 transforming event. ( a ) Functional clustering of proteins detected by mass spectrometry comparing leukemic cells from HOXA10 ON secondary recipient mice to leukemic cells from the HOXA10 OFF group (two donors are tested: nos. 1 and 2). The secondary leukemias show high expression of subset of proteins involved in transendothelial migration, whereas proteins from other functional clusters do not exhibit a difference. ( b ) Western blot showing high levels of the CD44 protein in leukemic cells from the HOXA10 OFF mice. A representative western blot is displayed using recipients of cells from donors: nos. 1 and 2. ( c ) Transcriptional analysis of CD44 and MMP9 genes. Results are expressed in arbitrary units (AU): raw data from HOXA10 ON microarrays are normalized to HOXA10 OFF . Data show means+-s.e.m. of three donors.
- Conjugate
- Biotin

- Submitted by
- Invitrogen Antibodies (provider)
- Main image
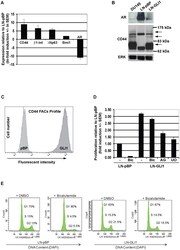
- Experimental details
- Figure 2 GLI1 induces an androgen-independent phenotype in LNCaP cells. (A) qPCR analysis of epithelial marker expression in LNCaP-GLI1 cells relative to LNCaP-pBP cells (n.b. the data is presented as natural logarithms so the relative induction of CD44 is almost 7000-fold). (B) Western blot analysis of AR and CD44 expression in LNCaP-pBP, LNCaP-GLI1 and DU145 cells (arrows denote CD44 isoforms common to LNCaP-GLI1 and DU145 cells). (C) FACS analysis of CD44 expression in LNCaP-pBP and LNCaP-GLI1 cells. (D) Proliferation assay to compare and to determine the effect of bicalutamide upon the proliferation rate of LNCaP-pBP and LNCaP-GLI1 cells as well as the effect of AG1478 (EGFR inhibitor) and U0126 (MEK inhibitor) upon the latter. (E) Analysis of the cell cycle by flow cytometry in LNCaP-pBP and LNCaP-GLI1 cells exposed to bicalutamide.
- Conjugate
- Biotin

- Submitted by
- Invitrogen Antibodies (provider)
- Main image
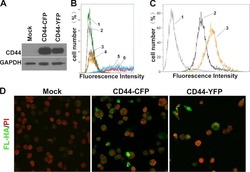
- Experimental details
- FIGURE 1. Binding of exogenous fl-HA by COS-7 cells transfected with CD44 expression constructs. 24 h post-transfection, COS-7 cells were analyzed by Western blot and flow cytometry analysis. The capacity of transfected cells to bind exogenous fl-HA was analyzed by flow cytometry and immunocytochemistry analysis. A , shown is immunoblotting of CD44 in the lysates from CD44-CFP ( lane 2 )- and CD44-YFP ( lane 3 )-transfected COS-7 cells. Naive COS-7 cell was used as the negative control. B , cell surface expression of CD44 in CD44-CFP- and CD44-YFP-transfected COS-7 cells was assessed by flow cytometry. Histograms indicate log fluorescence intensity ( x axis) versus relative cell number ( y axis). 1 , naive COS-7 cells was used as mock; 2 , isotype-matched antibody as negative control; 3 , pECFP-N1 transfected cells; 4 , pEYFP-N1 transfected cells; 5 , CD44-CFP transfected cells; 6 , CD44-YFP transfected cells. C , shown is binding and uptake of exogenous fl-HA by transfected COS-7 cells. 1 , naive COS-7 cells was used as negative control; 2 , CD44-CFP transfected COS-7 cells; 3 , CD44-YFP transfected COS-7 cells. D , binding of exogenous fl-HA by transfected COS-7 cells was detected by immunocytochemistry analysis. Nuclei were visualized by propidium iodide ( PI ) staining. COS-7 cells were transfected with CD44-CFP or CD44-YFP respectively. Naive COS-7 cells were used as mock control.
- Conjugate
- Biotin
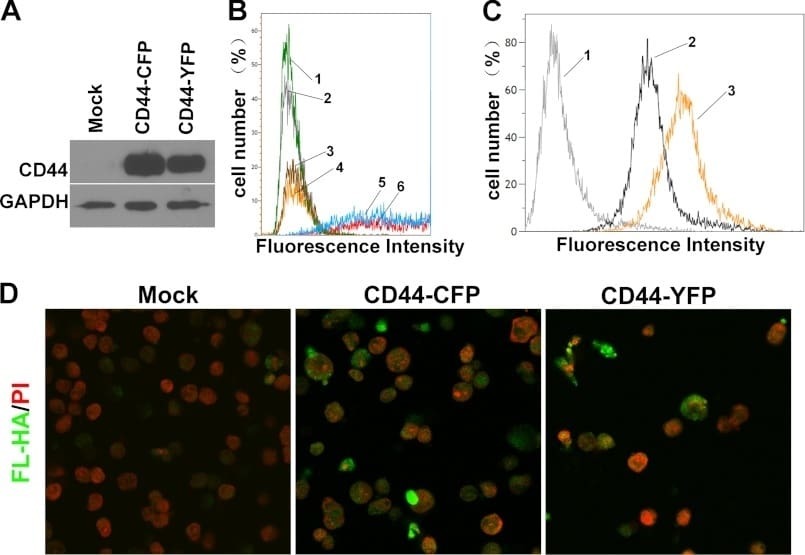
- Submitted by
- Invitrogen Antibodies (provider)
- Main image

- Experimental details
- Figure 1 Immunophenotypic profiles of tumor-retrieved cells. The tumor-retrieved cells from mice were labeled with PE-conjugated Sca-1 and FITC-conjugated CD44 antigens and analyzed by flow cytometry. From the (A) non-recurrence (Non-Rec) and (B) recurrence (Rec) group, the cells that were positive for CD44 and Sca-1 were gated and then further analyzed. The percentages of gated Sca-1 - -CD44 - , Sca-1 + -CD44 - , Sca-1 - -CD44 + and Sca-1 + -CD44 + cells in total tumor cells are presented on plot. All of the tumor-retrieved cells were sorted into four subgroups and cultured separately for later analyses.
- Conjugate
- Biotin
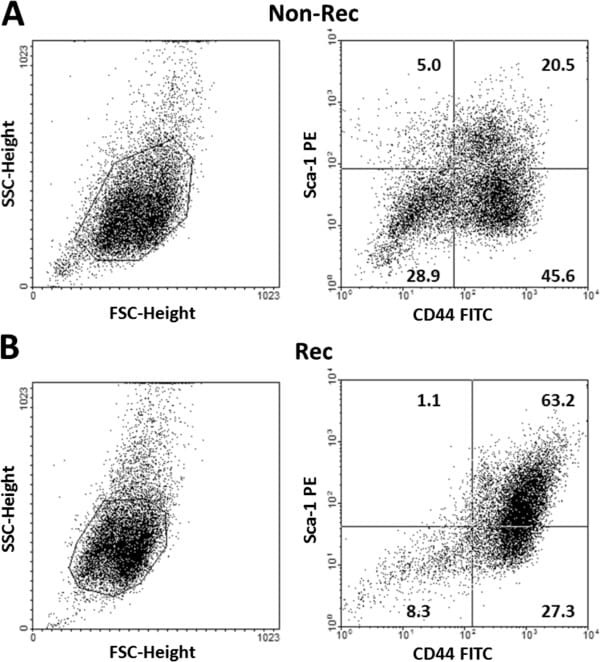
- Submitted by
- Invitrogen Antibodies (provider)
- Main image
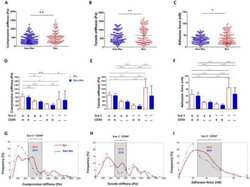
- Experimental details
- Figure 2 CM measurements of the tumor-retrieved cells with different recurrence status before and after flow-cytometry sorting. All cells were assessed with the microplate mechanical measurement system (MMS). The (A) compressive stiffness (CS), (B) tensile stiffness (TS) and (C) adhesion force (AF) of the non-recurrence (Non-Rec) and recurrence (Rec) group were measured and graphed as the mean (dotted line) +- SD (upper and lower index) in the scatter plots. *, p < 0.05; **, p < 0.01. (D, E and F) The red and blue bars represent the Rec and Non-Rec groups, respectively. After sorting, each subgroup of cells was maintained separately for CM measurements. Based on the data, the double positive subgroup had higher CMs than the single positive subgroups, and a greater variation was observed in the double negative subgroup. (G, H and I) The distributions of the CM properties after Gaussian curve fit. Red dotted lines indicate the Rec group, and blue dashed lines indicate the Non-Rec group. The gray areas contain the suspected mesenchymal stem cells (MSCs), which are Sca-1 + -CD44 + . The number of peaks were counted after all CM data were fitted, and noticeably only one peak is present in each of the gray areas from the Rec population.
- Conjugate
- Biotin
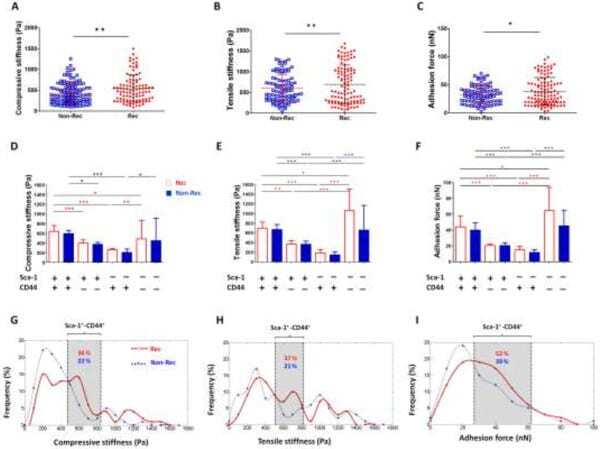
- Submitted by
- Invitrogen Antibodies (provider)
- Main image

- Experimental details
- Figure 4 Fusion progeny display stem cell properties similar to MSCs (A) Cell-surface marker profiles of fusion and parent MSC cells determined by flow cytometry using antibodies against indicated antigens; grey regions represent isotype controls. (B) Multilineage differentiation capacity of fusion progeny and parental MSCs. Osteogenic differentiation was assessed by Alizarin Red S staining for mineral nodule deposition. Chondrogenic differentiation was assessed by Alcian blue staining for proteoglycan deposition. Adipogenic differentiation was assessed by Oil Red O staining for lipid vesicle formation. IM: induction medium. (C ) Quantitation of multilineage differentiation of fusion progeny and parental MSCs from three independent experiments. Values are means + SEM; *, P
- Conjugate
- Biotin
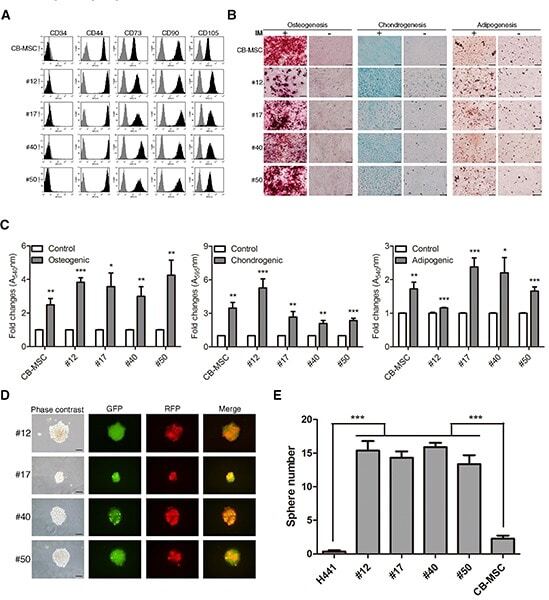
- Submitted by
- Invitrogen Antibodies (provider)
- Main image
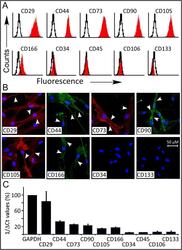
- Experimental details
- Fig 2 Flow cytometry, Immunofluorescence and qRT-PCR of WJ-MSCs. (A). Representative flow cytometry of WJ-MSCs (n = 3). Cells express CD29, CD44, CD73, CD90, CD105, and are negative for the hematopoietic (CD34 and CD45) and endothelial (CD106 and CD133) markers. Black open histogram indicates controls signal; red shaded histogram represents positive reactivity with the indicated antibody. (B) Confocal laser images of Immunofluorescence using APEX-labeling system for conjugating primary antibodies; CD29-Alexa Fluor 594, CD34-, CD44-, CD90- and CD133- Alexa Fluor 488. CD73-PE and CD105-PE were manufacturer labeled. 600X magnifications (C) qRT-PCR of the prospective markers for RNA isolated from undifferentiated WJ-MSCs cells, values were expressed as a percentage relative to 1/dCt of GAPDH gene.
- Conjugate
- Biotin
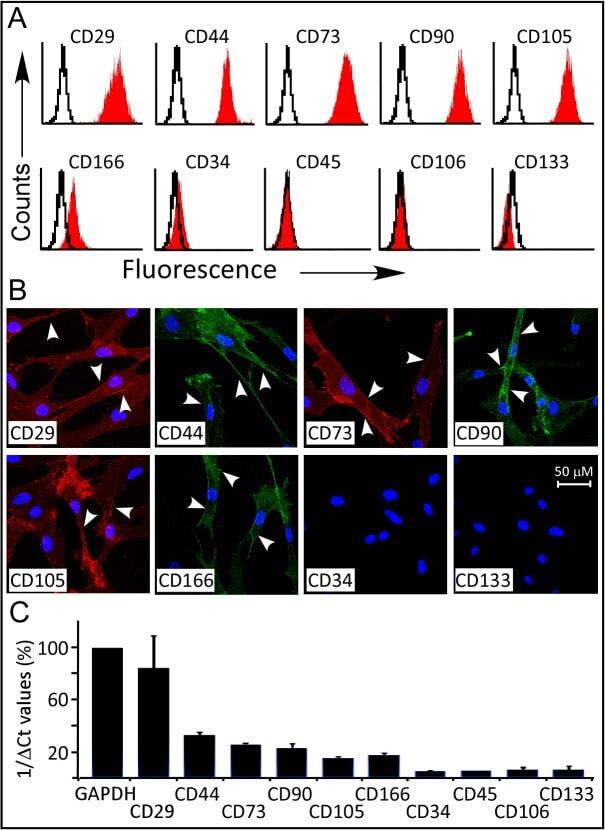
- Submitted by
- Invitrogen Antibodies (provider)
- Main image
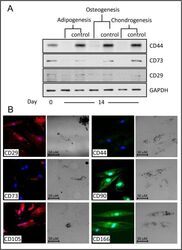
- Experimental details
- Fig 4 Protein expression of CD-markers during multi-lineage differentiation. (A) Western Blot analysis of undifferentiated (D0) and multi-lineage differentiated WJ-MSCs (D14). (B) Adipogenic differentiation of WJ-MSCs, immunofluorescence images using Confocal Laser microscopy (400X magnification). Primary antibodies were conjugated as described in Material and Methods. CD29-Alexa Fluor 594, CD44-, CD90- and CD166-Alexa Fluor 488, CD-73- and CD105-PE. Oil Red-O staining was observed as black dots using monochrome digital camera (phase contrast images) or red dots using 633-nm Laser beam.
- Conjugate
- Biotin
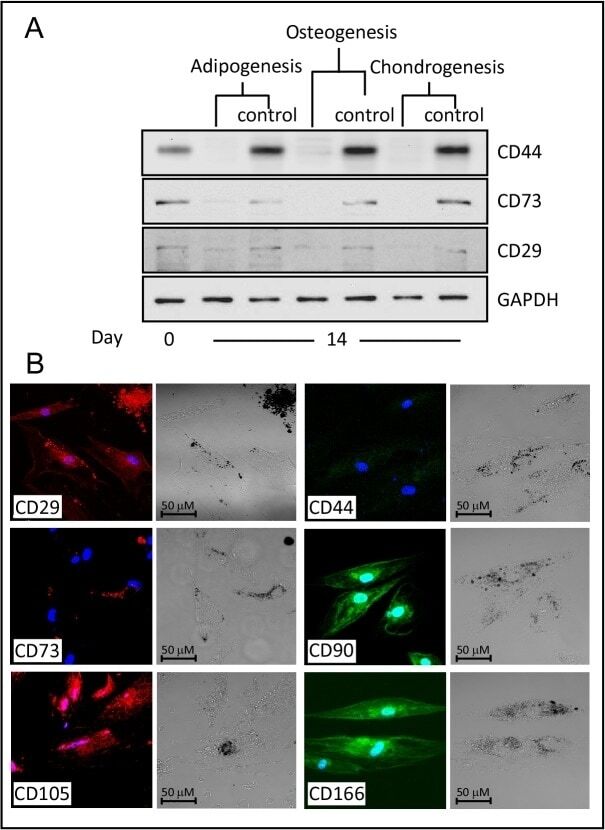
- Submitted by
- Invitrogen Antibodies (provider)
- Main image
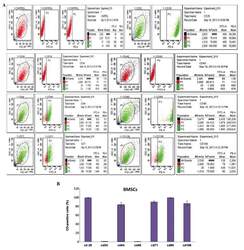
- Experimental details
- Figure 2 Identification and immunophenotypic characterization of bone marrow mesenchymal stem cells (BMSCs) isolated from Sprague Dawley rats, as determined by flow cytometric analysis of surface antigens. (A) The cells were harvested and stained with fluorescein isothiocyanate-conjugated anti-rat CD29, CD34, CD44, CD45, CD71, CD90, CD106. The BMSCs were negative for CD34, CD45, but positive for mesenchymal markers CD29, CD44, CD71, CD90 and CD106. (B) Statistical analysis of numerous samples. Fourth passage BMSCs CD marker expression was as follows: CD29 (99.25+-0.82%), CD34 (1.00+-0.20%), CD44 (83.73+-4.95%), CD45 (0.98+-0.19%), CD71 (89.86+-2.39%), CD90 (99.21+-0.79%), CD106 (86.42+-5.67%).
- Conjugate
- Biotin

- Submitted by
- Invitrogen Antibodies (provider)
- Main image
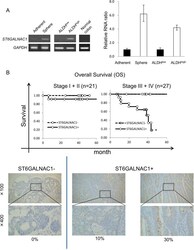
- Experimental details
- Figure 3 Expression of ST6GALNAC1 in CR-CSCs/CICs and clinical samples ( A ) RT-PCR and qRT-PCR analyses of ST6GALNAC1 in CR-CSCs/CICs, non-CSCs/CICs and normal colon mucosa. Expression of ST6GALNAC1 was analyzed by RT-PCR using cDNAs derived from adherent-cultured cells, sphere-cultured cells, ALDH high cells, ALDH low cells and normal colon tissue (left). GAPDH was used as an internal control. Expression of ST6GALNAC1 was analyzed by qRT-PCR using cDNAs of adherent-cultured cells, sphere-cultured cells, ALDH high cells and ALDH low cells. Data are shown as means +- SD. An asterisk indicates statistical difference. ( B ) Overall survival (OS) for patients with ST6GALNAC1-positive cancer and those with ST6GALNAC1-negative cancer after primary surgery. ST6GALNAC1 protein was detected by immunohistochemical (IHC) staining using an ST6GALNAC1-specific antibody in colorectal cancer cases. The positive rates of ST6GALNAC1 were 0%-80%. ST6GALNAC1-positive patients in Stage III and IV showed a significantly shorter survival time than that of ST6GALNAC1-negative patients in Stage III and IV after surgery (upper panel). Representative images are shown (lower panel). ST6GALNAC1-negative case (0%) and ST6GALNAC1-positive cases (10% and 30%). Magnification, x100 and x400.
- Conjugate
- Biotin
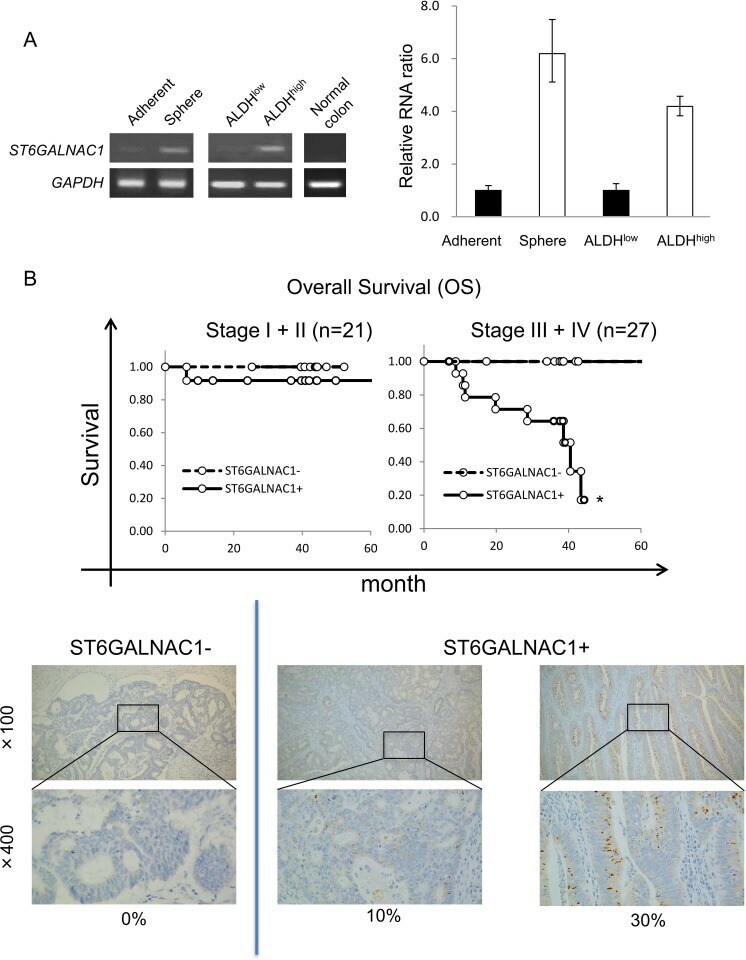
- Submitted by
- Invitrogen Antibodies (provider)
- Main image

- Experimental details
- Figure 3 Knocking down of PIK3CA failed to reverse EMT and reduce CSC population. (A) Western blotting of p110alpha, E-cadherin and vimentin in CU110-2 cells stably transfected with lentiviral-mediated shRNA ( shPIK3CA ) or a scrambled control ( SCR ). GAPDH was used as a loading control. Quantitation of western blots is shown in right. (B) HNSCC Sphe-forming assay of CU110 cells stably transfected either shPIK3CA or SCR lentivirus. Sphes with diameter >= 30 mum were counted; quantification of Sphe is shown on the right, n = 3; error bars indicate SD. * P < 0.05 (two-tailed Student t- test). Scale bar: 100 u m . (C) FACS analysis of CD44 in CU110 cells stably transfected either shPIK3CA or SCR lentivirus. Quantification of CD44 population is shown on top. n = 3; error bars indicate SD. (D) FACS analysis of CD24 in CU110 cells stably transfected either shPIK3CA or SCR lentivirus. Quantification of CD24 population is shown on top. n = 3; error bars indicate SD. (E) SP fraction using Hoechst dye-effluxing analysis in CU110 cells stably transfected either shPIK3CA or SCR lentivirus. Quantification of SP fraction is shown on top. n = 3; error bars indicate SD. * P < 0.05 (two-tailed Student t- test). (F) HNSCC Sphe-forming assay of Fadu or UMSCC47 cell lines stably transfected with either shPIK3CA or SCR . The quantification is shown on the left. Error bars indicate SD. Scale bar: 100 u m.
- Conjugate
- Biotin
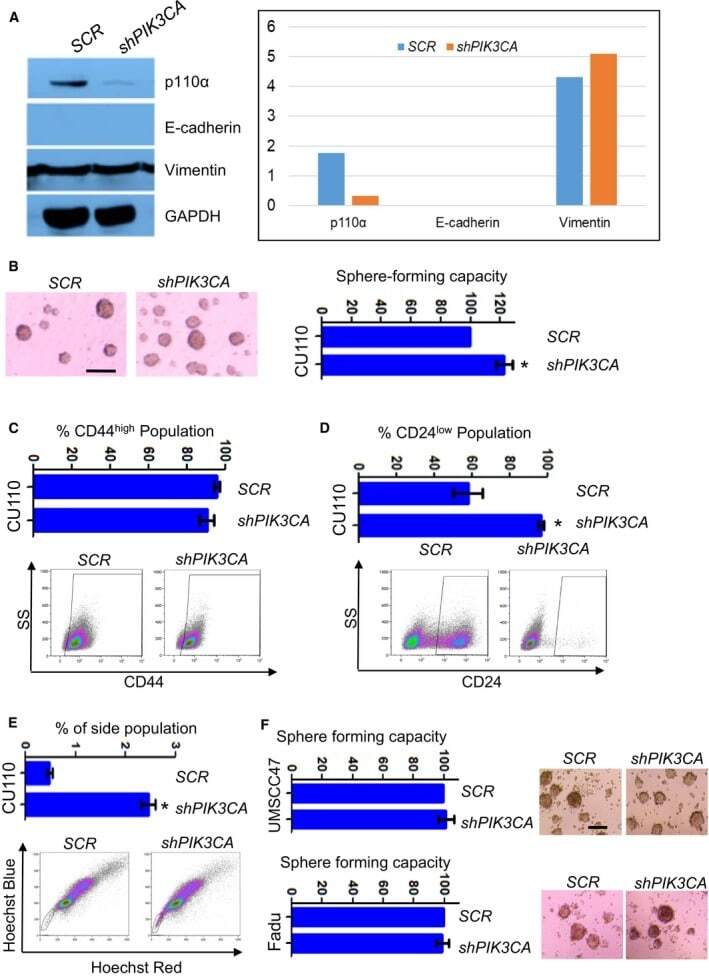
- Submitted by
- Invitrogen Antibodies (provider)
- Main image
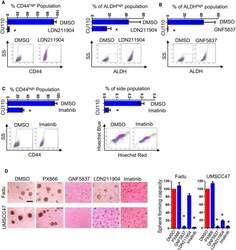
- Experimental details
- Figure 6 Targeting multiple RTK pathways effectively eliminates CSC populations with inhibiting Ephs, TRKs, and c-Kit the most prominent. (A) FACS analysis of CD44 (left) or ALDH (right) in CU110 cells treated with LDN211904. Error bars indicate SD. n = 3. * P < 0.05 (two-tailed Student t- test). (B) FACS analysis of ALDH in CU110 cells treated with GNF5837. Error bars indicate SD. n = 3. * P < 0.05 (two-tailed Student t- test). (C) FACS analysis of CD44 (left) or SP fraction (right) in CU110 cells treated with imatinib. Error bars indicate SD. n = 3. * P < 0.05 (two-tailed Student t- test). (D) Effect of pharmaceutical inhibitors (as indicated in the figure) on reducing CSC population in human HNSCC cell lines: Fadu and UMSCC47, using Sphe-forming assay. The quantification is shown on right. n = 3; error bars indicate SD. * P < 0.05 (two-tailed Student t- test). Scale bar: 100 u m.
- Conjugate
- Biotin
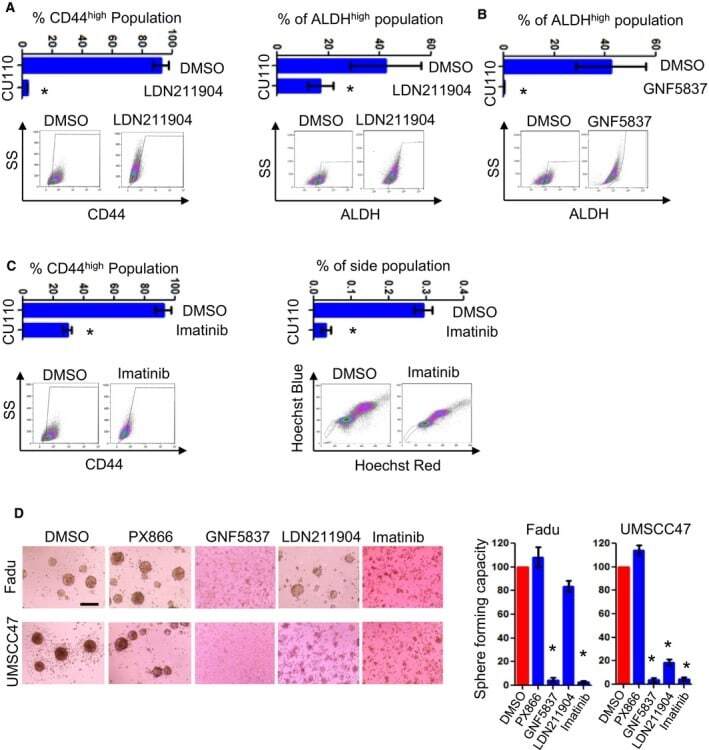
- Submitted by
- Invitrogen Antibodies (provider)
- Main image
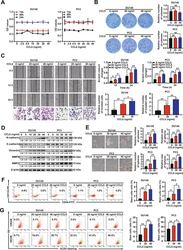
- Experimental details
- Fig. 2 CCL5 promotes the invasion and the PCSCs subpopulation of prostate cancer cells in vitro. a , b CCL5 (2.5-40 ng/ml) had no obvious influences on the proliferation and colony formation capacities of the prostate cancer cell lines DU145 and PC3. c CCL5 addition (20-40 ng/ml) significantly promoted the migration and invasion of DU145 and PC3 cells. Scale bars represent 200 mum for wound healing assay images and 50 mum for transwell assay images. d Western blotting assay revealed that CCL5 (5-40 ng/ml) could promote EMT and metastasis of both DU145 and PC3 cells. e CCL5 treatment (20-40 ng/ml) significantly increased not only the number but also the size of mammospheres formed by prostate cancer cells. Scale bar, 100 mum. f , g CCL5 treatment (20-40 ng/ml) significantly elevated the CD44 + /CD133 + subpopulation and the ALDH + subpopulation in DU145 and PC3 cells, indicating that CCL5 could promote the self-renewal of PCSCs. All values are presented as the mean +- SD. n = 3, * p < 0.05, ** p < 0.01.
- Conjugate
- Biotin
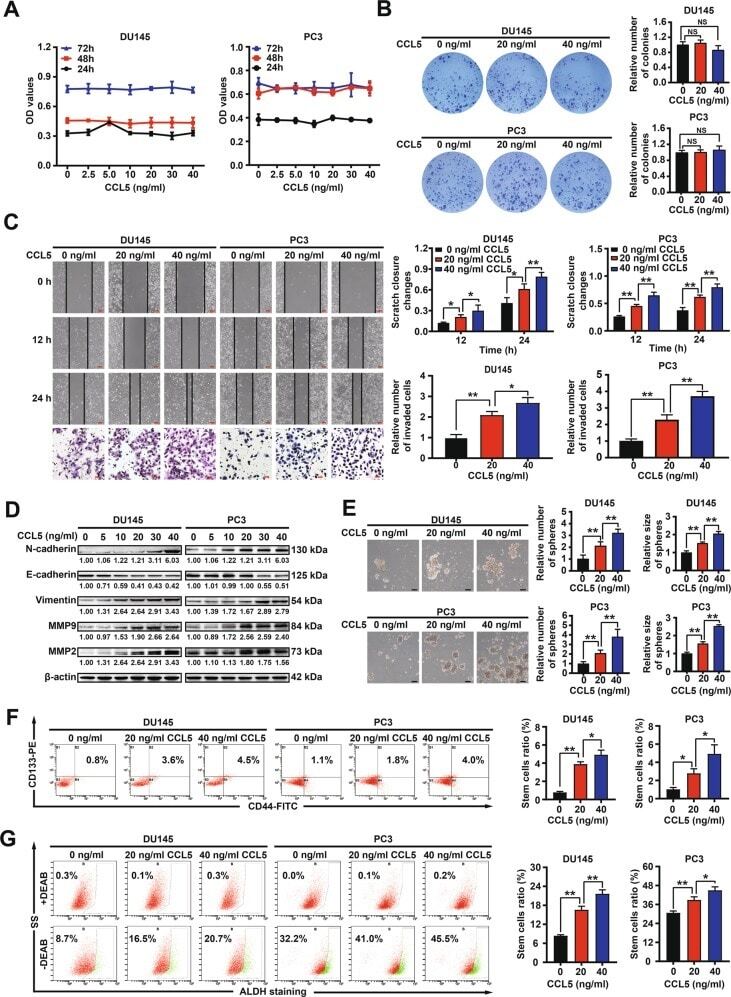
- Submitted by
- Invitrogen Antibodies (provider)
- Main image
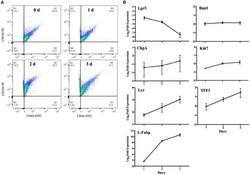
- Experimental details
- FIGURE 4 Changes in cellular sub-populations in differentiating MPIEs. (A) CD326 (Epcam) versus CD44 expression in cells harvested at different time points. (B) Transcriptional changes of the major cell marker genes in 3 days of differentiation detected by RT-qPCR. The transcription levels were normalized to that of GAPDH and the relative fold changes were calculated using the 2 -DeltaDeltaCT . Each bar indicated means +- standard deviations for three independent trials. The abbreviations on the map are leucine-rich-repeat-containing G-protein-coupled receptor 5 ( Lgr5 ), B cell-specific moloney murine leukemia virus integration site 1 ( Bmi1 ), Ki-67 ( Ki67 ), chromogranin A ( ChgA ), trefoil factor 3 ( TFF3 ), lysozyme ( Lyz ) and fatty acid-binding protein 1 ( L-Fabp ).
- Conjugate
- Biotin
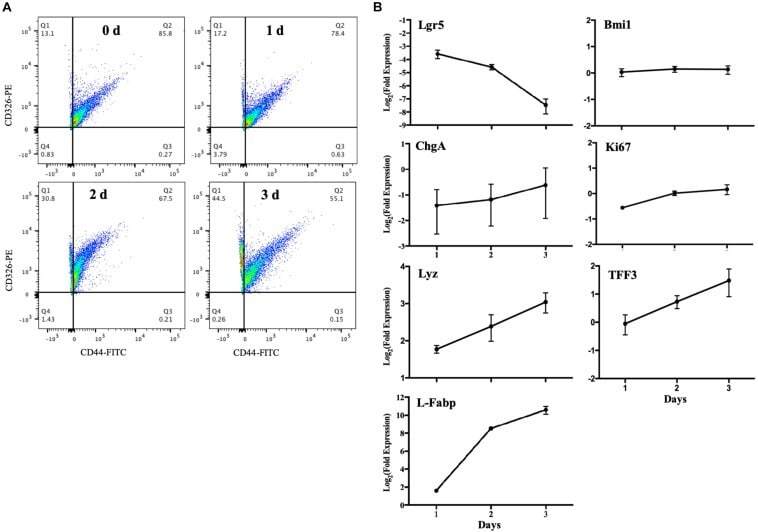
- Submitted by
- Invitrogen Antibodies (provider)
- Main image
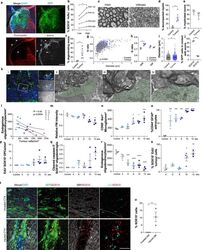
- Experimental details
- Fig. 3 Exposure to disrupted myelin drives GBM progression down the oligodendrocyte lineage. a SOX10 (grey), fluoromyelin (FM, red), DAPI (blue) immunofluorescence of GFP + G144 xenografts (PDX144). Arrowheads denote disrupted areas. Scale = 500 um b , % SOX10 + tumour cells in areas of high (blue)/low (grey) disruption in indicated xenografts. >=120 cells across >=6 ROIs per region. n = 4 xenografts. p = 0.03, Mean, paired one-tailed Student''s t test c , Electron micrographs of myelin bundles in the ipsilateral (infiltrated) and contralateral (intact) striatum of PDX144. Scale=1 um. d - i , quantification of indicated axonal and myelin phenotypes in EM data from b . n = 3-4 xenografts. d p = 0.03, f, p = 0.03, g p < 0.0001, h p = 0.01, i p = 0.01, ** p < 0.01, * p < 0.05, Mean +- SEM, paired one-tailed Student''s t test, 2-way ANOVA or linear regression. j % GFP + tumour cells in contact with axons. >=300 SOX10 + /SOX10 - cells across 3 ROIs. Mean +- SEM, n = 3 tumours, p < 0.0001. Unpaired two-tailed Student''s t test. k i Correlative light and electron micrograph (CLEM) of tumour cell directly interacting with multiple white matter axons. ii-iv magnifications of i highlighting interactions with decompacted myelin (A, B), naked (C), and intact myelinated axon (D) Scale = 10 um (i), 5 um (ii), 1 um (iii, iv). l - s time-course analysis of tumour cell differentiation and glial response during corpus callosum (CC) infiltration in PDX144. l quantification of FM intensity relat
- Conjugate
- Biotin
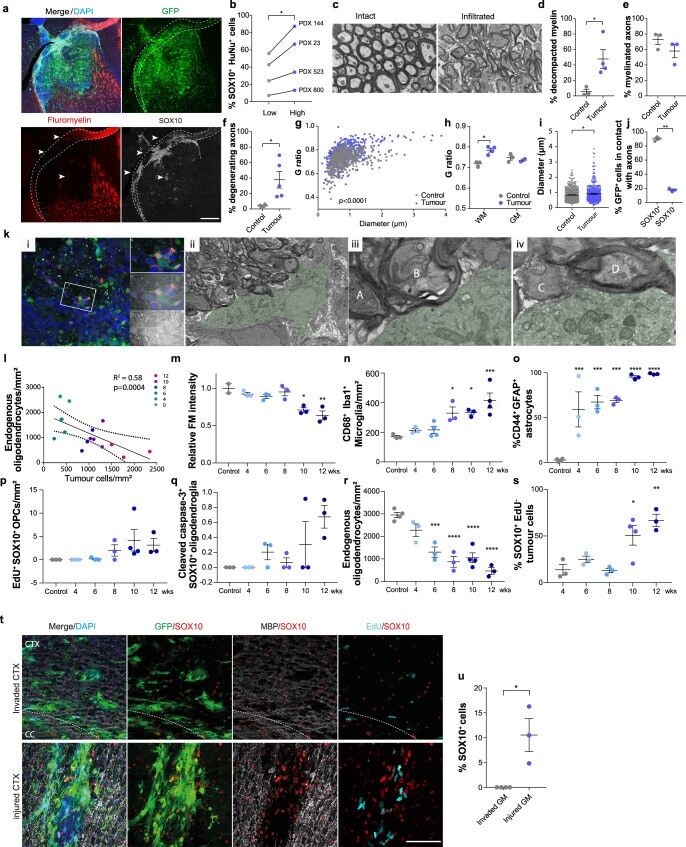
- Submitted by
- Invitrogen Antibodies (provider)
- Main image
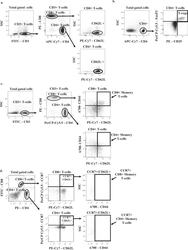
- Experimental details
- Figure 9 Representative gating strategies used to analyze cell types by flow cytometry. Shown are representative dot plots with gating for CD4+/CD62L+ and CD8+/CD62L+ T-cells ( a ), T-regulatory Cells (CD4+/CD25+/FOXP3+) ( b ), CD4+ Memory T-cells (CD4+/CD44+/CD62L+) and CD8+ Memory T-cells (CD8+/CD44+/CD62L+) ( c ), and CCR7+/CD4+ Memory T-cells and CCR7+/CD8+ Memory T-cells ( d ).
- Conjugate
- Biotin

- Submitted by
- Invitrogen Antibodies (provider)
- Main image
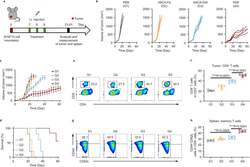
- Experimental details
- Fig. 5 HGF induced an effective therapeutic effect against B16F10 tumor. a Schematic illustration of the experiment design to assess the tumor inhibition and the immune responses as triggered by PBS, HACA-Fe, HACA-GW, or HGF NPs on subcutaneous B16F10 tumor model. G1, PBS; G2, HACA-Fe; G3, HACA-GW; G4, HGF. b and c Tumor growth curves during treatment. d Survival rates of different groups over time. e and f Representative flow cytometry plots and quantification of e CD8 + f and CD4 + T cells after gating on CD45 + CD3 + T cells in tumor tissue. g and h Representative flow cytometric analysis of memory T cells (CD3 + CD8 + CD44 + CD62L - , gated on CD3 + CD8 + T cells) in the spleen. Data were presented as mean +- SD. n = 5 biologically independent animals per group. Statistically significant differences between groups were identified by one-way ANOVA with Tukey's post hoc test. * P < 0.05, ** P < 0.01, *** P < 0.001 and **** P < 0.0001.
- Conjugate
- Biotin
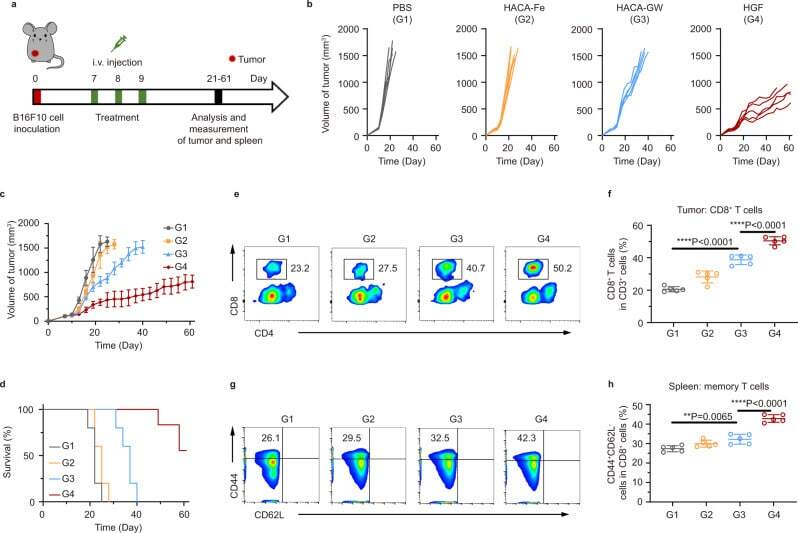
- Submitted by
- Invitrogen Antibodies (provider)
- Main image
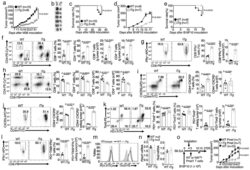
- Experimental details
- Figure 2. Ectopic expression of NIK prevents T cell exhaustion and promotes antitumor immunity. a-c , Tumor growth curve ( a ), image of day 32 tumors ( b ), and survival curve ( c ) of the MC38-bearing NIK iTg and wildtype control mice. d , e , Tumor growth ( d ) and survival ( e ) curves of NIK iTg and wildtype control mice injected s.c. with 5 x 10 5 B16F10 melanoma cells. f , g , Flow cytometric analysis of the frequency and absolute cell number of CD4 + and CD8 + T cells ( f ) and IFN-gamma-producing CD8 + effector T cells ( g ) in day-32 tumor of MC38-bearing NIK iTg and wildtype control mice ( f , g , n=6 per genotype). h-j , Flow cytometric analysis of the frequency and absolute cell number of CD4 + and CD8 + T cells in the draining lymph node ( h ) and CD44 + CXCR3 + CD8 + effector T cells in the draining lymph node ( i ) or tumor ( j ) of day-32 MC38-implanted NIK iTg and wildtype control mice ( h , n=6 per group; i , n=4 per group; j , n=3 per group). k , l , Flow cytometric analysis of the frequency and absolute cell number of PD1 + Tim3 + and PD1 + Tim3 - CD8 + T cells ( k ) and IFN-gamma-producing gated PD1 + Tim3 + CD8 + T cells ( l ) in day-32 tumor of the MC38-bearing wildtype or iTg mice ( k , l , n=6 per genotype). m , n , Flow cytometry ( m ) and qRT-PCR ( n ) analyses of PD1 and Tim3 expression level in tumor-infiltrating PD1 + Tim3 + CD8 + T cells of MC38-bearing (day 32) wildtype or iTg mice ( n , WT: n=2; NIK iTg : n=3) . o , Schematic of experimental
- Conjugate
- Biotin

- Submitted by
- Invitrogen Antibodies (provider)
- Main image
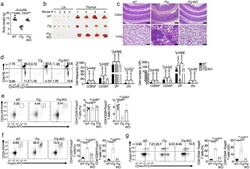
- Experimental details
- Figure 6. HK2 deletion blocks the autoimmune phenotype of NIK tTg mice. a, Body weight of 36-day old wildtype (WT), NIK tTg (tTg), and NIK tTg Hk tKO (tTg-tKO) littermate mice (WT: n=5, tTg: n=8, tTg-tKO: n=7) . b , Image of inguinal lymph nodes and thymi of four pairs of mice with the indicated genotypes. c , H&E staining of colon and lung sections from moribund NIK tTg , NIK tTg Hk tKO and age-matched littermate wildtype control mice were assessed for leukocyte infiltrates by hematoxylin-eosin stain. Scale bars: 100 mum. (n=3 in each group). d-g , Flow cytometric analysis of the frequency and absolute cell number of double-negative (DN), double-positive (DP), CD8 + single-positive (SP), and CD4 + SP thymocytes ( d ), thymic CD25 + foxp3 + T reg cells ( e ), lymph node CD25 + foxp3 + T reg cells ( f ), and lymph node CD44 - foxp3 + T reg cells ( g ) in NIK tTg , NIK tTg Hk tKO or wildtype mice ( e-f , NIK iTg : n=6, NIK tTg Hk tKO : n=4, wildtype: n=5). Data are representative of two ( a-c , e-g ) or three ( d ) independent experiments. Summary data are shown as mean +- s.e.m. with P values determined by two-tailed Student's t test ( a , d-g ) .
- Conjugate
- Biotin
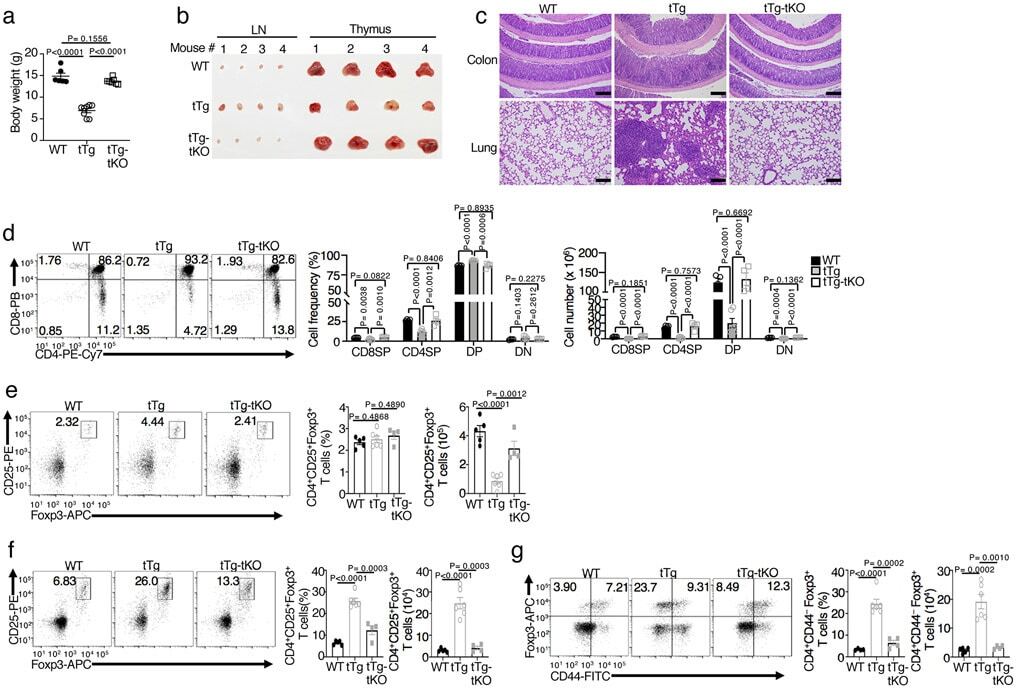
- Submitted by
- Invitrogen Antibodies (provider)
- Main image

- Experimental details
- Extended Data Fig. 1 NIK regulates T cell exhaustion and antitumor immunity a, genotyping PCR of R26Stop FL Map3k14 (Map3k14 Tg ), Map3k14 +/+ CreER, and R26Stop FL Map3k14 -CreER ( Map3k14 Tg CreER) mice, showing the PCR products of NIK-GFP in Map3k14 Tg allele and CreER. b, Immunoblot analysis of NIK expression in tamoxifen-treated Map3k14 +/+ CreER (WT) and Map3k14 Tg CreER (iTg) mice. c, Schematic of experimental design for producing B16F10 tumor-bearing NIK iTg and WT control mice. Each mouse was injected s.c. with 5 x 10 5 B16F10 cells (WT=9, iTg=7). d,e, Flow cytometric analysis of the frequency and absolute cell number of CD4 and CD8 T cells in the tumor (d) or draining lymph node (e) of day 18 B16F10 tumor-implanted NIK-iTg and WT mice ( d , WT: n=4; iTg: n=5; e , n=6 per genotype). f,g, Flow cytometric analysis of the frequency and absolute number of CD44 + CXCR3 + CD8 effector T cells in the draining lymph node ( f ) or tumor ( g ) of day 18 B16F10 tumor-implanted NIK-iTg and wildtype mice ( f , n=6 per genotype; g, n=4 per genotype). h,i, Flow cytometric analysis of the frequency and absolute number of PD1 + Tim3 + CD8 + T cells ( h ) or IFNgamma-producing PD1 + Tim3 + CD8 T cells ( i ) in the tumor of day 18 B16F10-implanted NIK iTg and wildtype control mice (h,i, n=4 per genotype). Data are representative of three independent experiments. Summary data are shown as mean +- s.e.m. with P values determined by two-tailed Student's t test.
- Conjugate
- Biotin
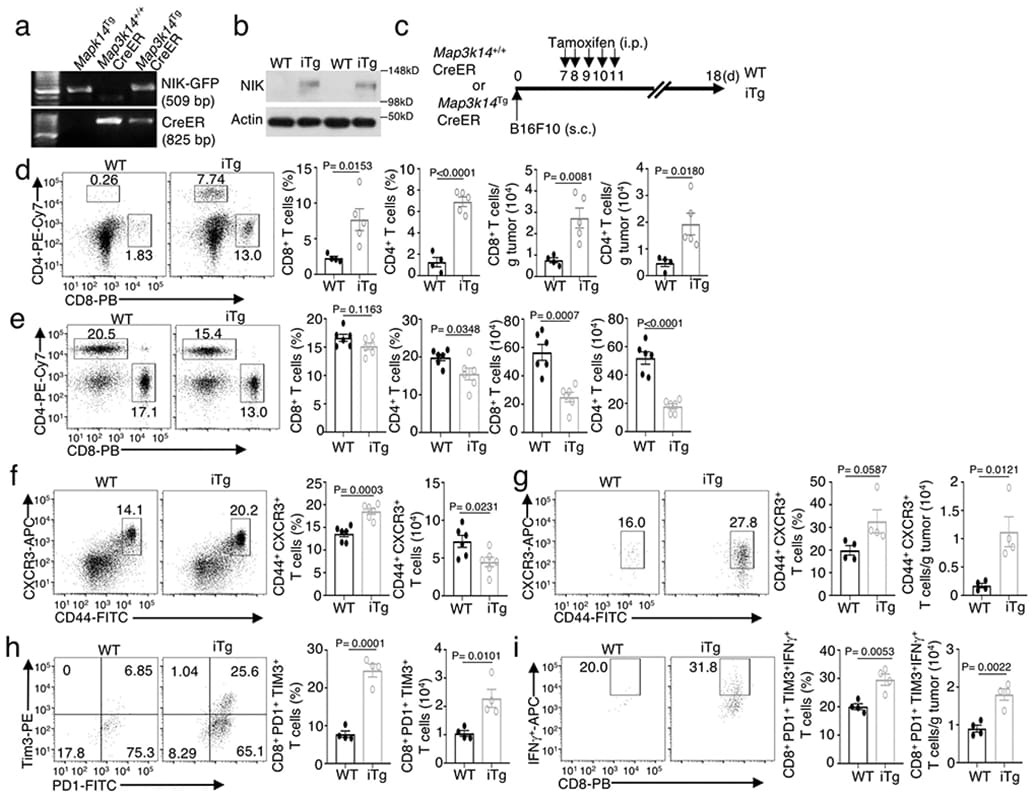
- Submitted by
- Invitrogen Antibodies (provider)
- Main image
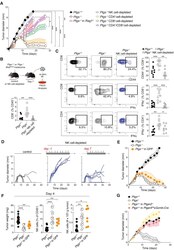
- Experimental details
- Figure 2 NK Cells Contribute to Both Innate and Adaptive Immune Control of Ptgs -/- Tumors (A) Growth profile of Ptgs +/+ and Ptgs -/- melanoma cells implanted into Rag1 -/- or wild-type mice untreated or depleted of NK, CD4 + , and/or CD8 + cells. (B and C) Frequency of CD8 + T cells (B); representative plots and frequency of CD8 + CD44 + , CD8 + IFNgamma + , and CD4 + IFNgamma + T cells (C) gated on live, CD45 + , CD3epsilon + cells in Ptgs +/+ and Ptgs -/- untreated or NK cell-depleted wild-type mice analyzed 7 days post-implantation. (D) Individual growth profiles of Ptgs -/- melanoma cells in wild-type mice depleted of NK cells from the day before or a week after cancer cell implantation. (E) Growth profile of Ptgs +/+ and Ptgs -/- cells in wild-type mice or Ptgs +/+ cells in GPP mice. (F) Tumor weight, NK cell frequency, and number per g of tumor analyzed 4 days after implantation of Ptgs +/+ and Ptgs -/- cells in wild-type or Ptgs +/+ cells in GPP mice. (G) Growth profile of Ptgs +/+ and Ptgs -/- melanoma cells in wild-type or Ptgs +/+ melanoma cells in Ptger2 -/- or Gzmb-Cre Ptger4 floxed/floxed mice. Data are expressed as mean +- SEM, one-way (B-C and F) or two-way ANOVA (A).
- Conjugate
- Biotin
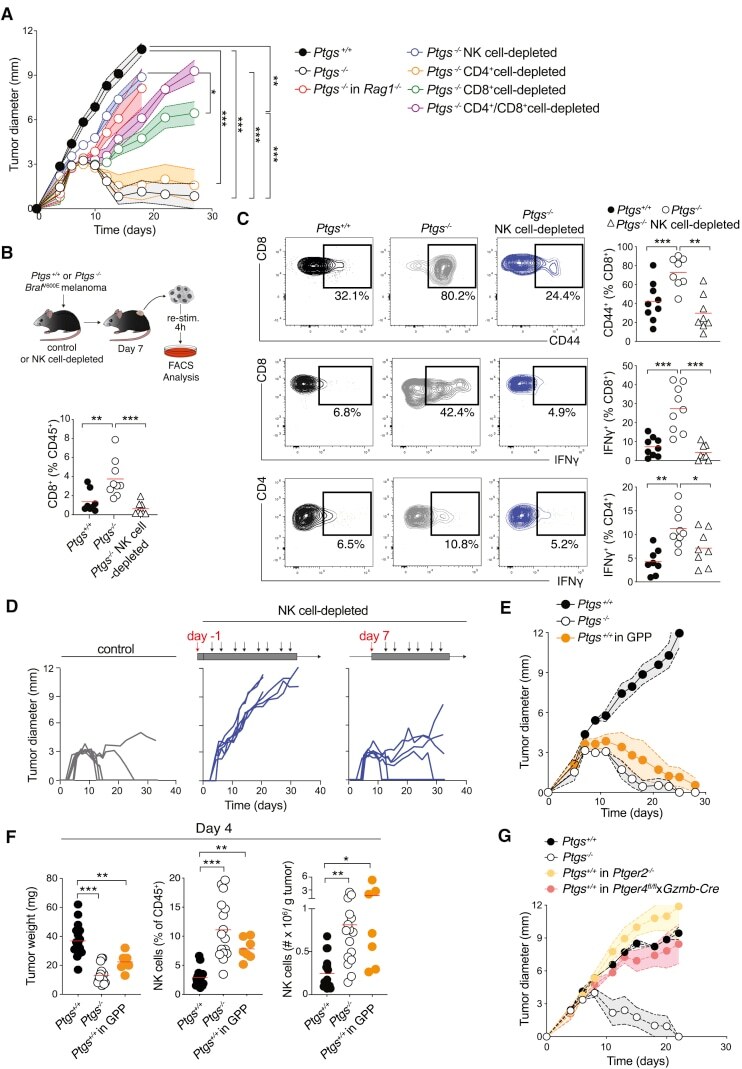
- Submitted by
- Invitrogen Antibodies (provider)
- Main image

- Experimental details
- Figure 6 Assessments of organ damage and mouse metabolites during HLSA or recovery from HLSA. A , upper left panel , MMP-1, IL-1beta, and CRP levels in plasma had no significant change between the control group, HLSA group, and R-HLSA group. Upper right panel , CK-MB as a marker of heart injury in the plasma had no significant change between the control group, HLSA group, and R-HLSA group. Lower left panel , creatinine and BUN as markers of kidney injury in the plasma slightly increased in the HLSA group and returned to normal level after recovery from HLSA. Lower right panel , AST and ALT as markers of liver injury in the plasma showed no change between the control group, HLSA group, and R-HLSA group. Data were presented as mean +- SD (N = 6; ANOVA: ** p < 0.01). B , upper panel , food consumption and water consumption 3 days before and 3 days after a single ATP-induced HLSA depicted no change. Data were presented as mean +- SD (N = 6; ANOVA: p > 0.05). Lower panel , metabolomics analysis of scores plot from PCA analysis based on 1 H NMR data from the plasma, brain, liver, and kidney of the control group, HLSA group, and R-HLSA group. The PCA score showcased clusters correspond to metabolic patterns in different groups, with each point representing one sample. Circles represent 95% confidence interval for each score in each group (see also Figs. S5-S8 ). C , draining lymph nodes of mice that underwent HLSA once a day for 10 consecutive days were analyzed with FACS. CD44 and
- Conjugate
- Biotin
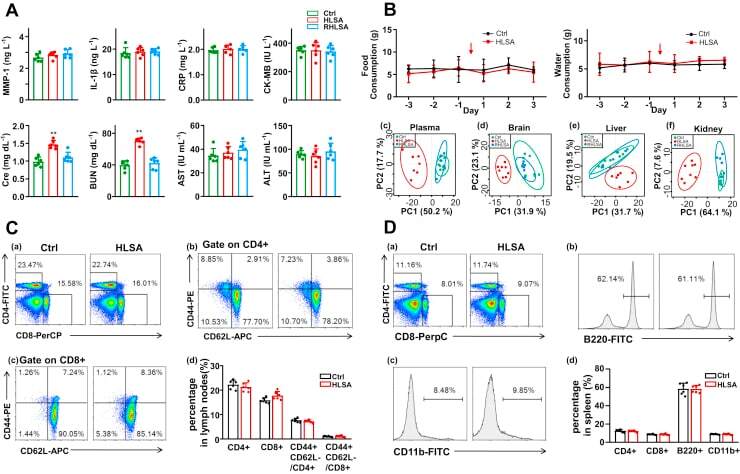
- Submitted by
- Invitrogen Antibodies (provider)
- Main image
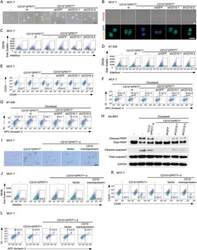
- Experimental details
- Figure 2 CD10 in CAFs sustains cancer stemness and chemoresistance. A-E) Indicated tumor cell lines were cultured alone (-) or cocultured with CD10 + GPR77 + -depleted CAFs (CD10 + GPR77 + -d) or paired CD10 + GPR77 + CAFs transduced without (-) or with shGFP or shCD10. A) Representative images of mammosphere formation in MCF-7 cells. Scale bar, 100 um. B) Representative images of PKH26 and Numb immunofluorescence staining of MCF-7 cells. Scale bar, 50 um. C,D) Percentage of ALDH1 + cells in C) MCF-7 and D) BT-549 cells detected by flow cytometry. Numerical values are presented as percentage (mean +- SEM, n = 3). E) Percentage of CD44 high CD24 low cells in MCF-7 cells cocultured with indicated CAFs was detected by flow cytometry. Numerical values are presented as percentage (mean +- SEM, n = 3). F,G) Representative flow cytometry plots for F) MCF-7 and G) BT-549 cells treated with docetaxel after being cultured alone (-) or cocultured with the indicated CAFs. The proportion of Annexin V + /Propidium iodide - (early apoptosis) and Annexin V + /Propidium iodide + (late apoptosis) cells is shown. The numerical values indicate Annexin V + percentage. Data are represented as the mean +- SEM of F) n = 4 or G) n = 3 independent experiments. H) Representative immunoblots for cleaved/total caspase-3 and PARP in SK-BR3 cells treated with docetaxel after being cultured alone (-) or cocultured with indicated CAFs ( n = 3). I-L) MCF-7 cells were cocultured with CD10 + GPR77 + CAFs or CD1
- Conjugate
- Biotin
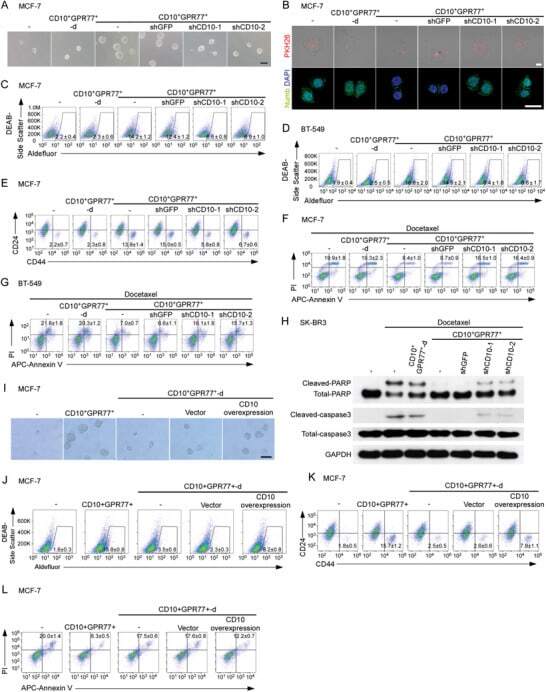
- Submitted by
- Invitrogen Antibodies (provider)
- Main image

- Experimental details
- Fig. 2 Cancer stem cell (CSC)-like cells are enriched in the hypoxic populations freshly isolated from xenografts. Tumor cells are enzymatically dissociated and isolated from either the MDA-MB-231/HRE-EGFP ( a - c ) or MCF7/HRE-EGFP ( d - f ) xenografts. Stem cell characteristics are evaluated by fluorescence-activated cell sorting (FACS) for the expression of CSC-associated surface markers CD24, CD44 and CD49f. Representative FACS plots are shown in a , c , d and f . Quantitative population analyses are shown in b ( n = 4-5; * p < 0.05, *** p < 0.001, Student's t test) and e (n = 4; *** p < 0.001, Student's t test). These results are confirmed by three or more independent experiments. EGFP, enhanced green fluorescent protein; SSC, side scatter
- Conjugate
- Biotin
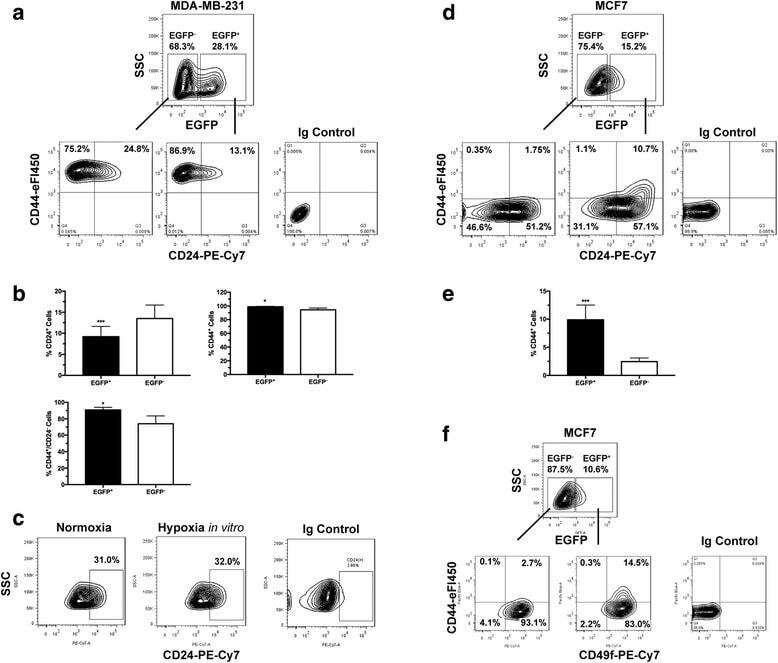
- Submitted by
- Invitrogen Antibodies (provider)
- Main image
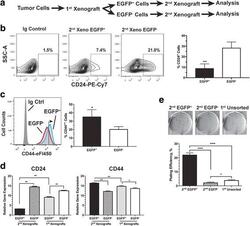
- Experimental details
- Fig. 4 The cancer stem cell (CSC)-like population is further enriched in secondary xenografts derived from the enhanced green fluorescent protein (EGFP) + MDA-MB-231 cells. a Generation of the secondary xenografts. b , c Surface levels of CD24 and CD44 are analyzed by fluorescence-activated cell sorting. b Average CD24 + populations from six individual tumors (*** p < 0.001, Student's t test). c Average CD44 ++ (right-pointing arrow) populations from three individual tumors (* p < 0.05, Student's t test). d Quantitative RT-PCR analysis of expression of CD24 and CD44 genes in the EGFP + and EGFP - cells freshly isolated from either the 2 nd or 1 st xenografts (n = 3; * p < 0.05, ** p < 0.01, Student's t test). e Clonogenic growth of sorted EGFP + and EGFP - cells freshly isolated from the 2 nd xenografts in comparison to the unsorted tumor cells from the 1 st xenografts (n = 3; * p < 0.05, *** p < 0.0001, Student's t test)
- Conjugate
- Biotin
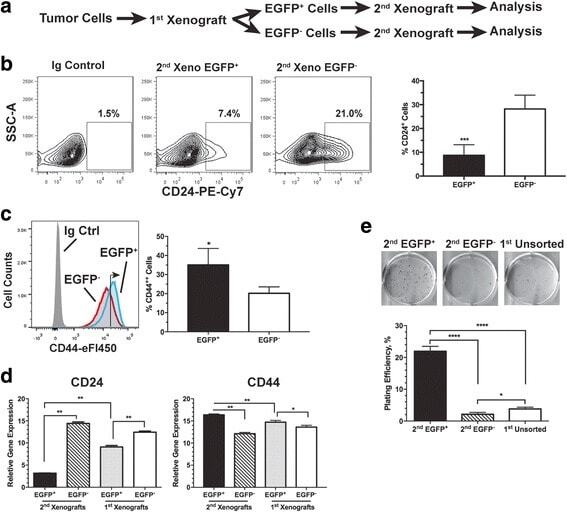
- Submitted by
- Invitrogen Antibodies (provider)
- Main image

- Experimental details
- Figure 2 BRCA1 suppresses CD44 expression in breast cancer cells. The cell surface CD44 levels in HCC1937 +- BRCA1 cells were analyzed by flow cytometry with representative flow cytometry data shown in ( A ) and quantitation in ( B , n = 3). ( C ) Expression levels of the total CD44 (including all isoforms/variants), CD44s, and the CD44v5/6 variant in HCC1937 +- BRCA1 cells measured by qRT-PCR (n = 3). ( D ) CD44 promoter activity in HCC1937 +- BRCA1 cells was measured using luciferase assay (n = 4).
- Conjugate
- Biotin
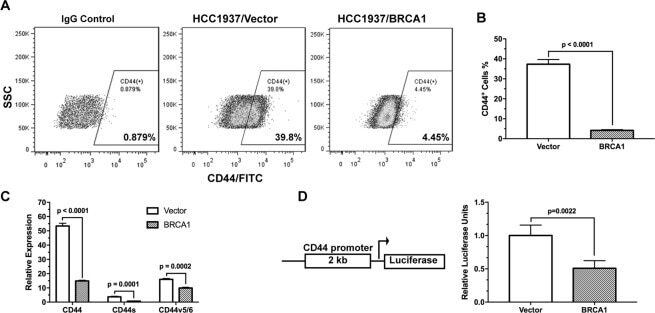
- Submitted by
- Invitrogen Antibodies (provider)
- Main image
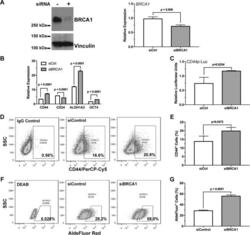
- Experimental details
- Figure 3 Down-regulation of BRCA1 promotes breast cancer stem cell characteristics. ( A ) BRCA1 was down-regulated by RNA inference in the BRCA1-competent SKBR-3 breast cancer cells, which was confirmed by Western blot and qRT-PCR (n = 3). ( B ) Expression of breast cancer stem cell-associated genes in SKBR3 +- siBRCA1 cells were measured by qRT-PCR (n = 3). ( C ) CD44 promoter activity in SKBR3 +- siBRCA1 cells was measured using luciferase assay (n = 3). The cell surface CD44 levels in SKBR3 +- siBRCA1 cells were analyzed by flow cytometry with representative flow cytometry data shown in ( D ) and quantitation in ( E , n = 3). The ALDH activity in SKBR3 +- siBRCA1 cells were analyzed by flow cytometry with representative flow cytometry data shown in ( F ) and quantitation in ( G , n = 3). The DEAB treated cells were used as negative control.
- Conjugate
- Biotin

- Submitted by
- Invitrogen Antibodies (provider)
- Main image

- Experimental details
- Figure 4 Down-regulation of BRCA1 promotes cancer cell stemness in neuroblastoma cells. BRCA1 was down-regulated by RNA inference in the SK-N-BE(2)C human neuroblastoma cells (Western blot shown in A ). Effects of BRCA1 on neuroblastoma cell clonogenicity was measured by the clonogenic assay ( B , n = 6). The cell surface levels of CD44 ( C ) and CD24 ( D ) in BE(2)C +- siBRCA1 cells were analyzed by flow cytometry (n = 3). Expression of neuroendocrine cancer stem cell-associated genes in BE(2)C +- siBRCA1 cells were measured by qRT-PCR ( E , n = 3).
- Conjugate
- Biotin
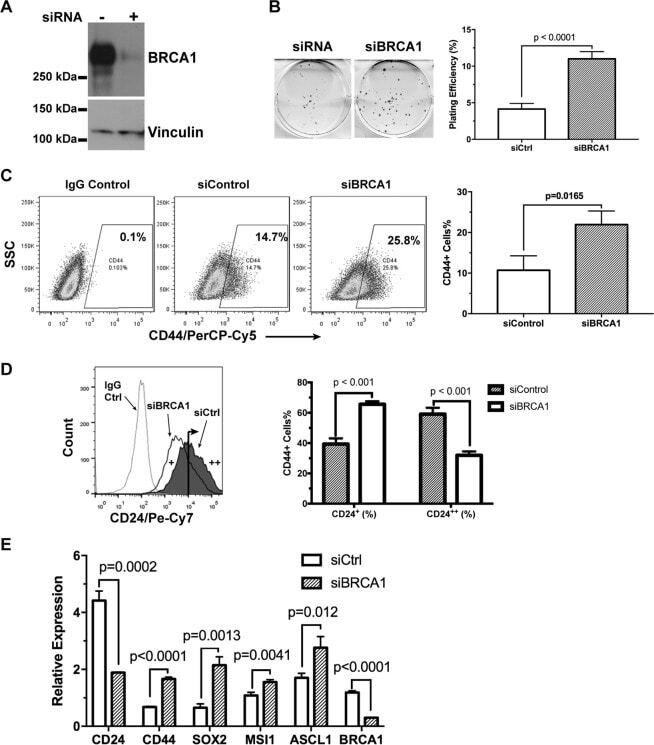
- Submitted by
- Invitrogen Antibodies (provider)
- Main image

- Experimental details
- FIGURE 2 T cell senescence in various adipose tissues of old mice. (A,B) Flow cytometric analysis of CD45 + CD3 + T cells in AT of young and old mice and their quantitation. (C,D) Representative flow cytometric analysis of CD44 subsets in T cells isolated from adipose tissue and their quantification. (E,F) Representative flow cytometry of CD28 + T cells in adipose tissue from young or old mice and their quantification. * P < 0.05; ** P < 0.01; *** P < 0.001 vs. young mice, n = 3~6 per group.
- Conjugate
- Biotin
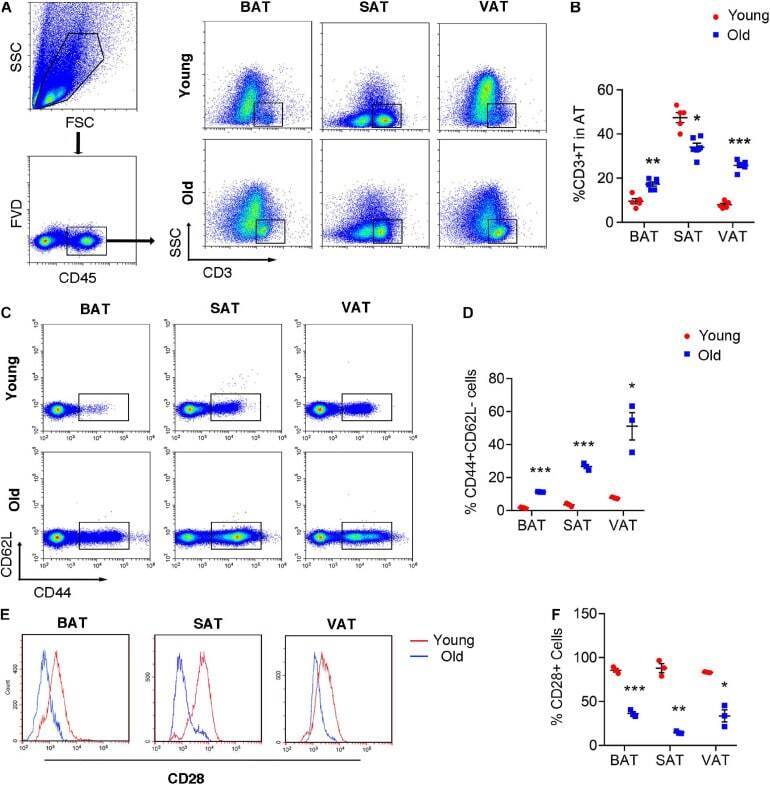
- Submitted by
- Invitrogen Antibodies (provider)
- Main image
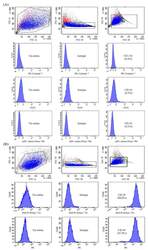
- Experimental details
- Figure 1 Fluorescence-activated cell sorting (FACS) analyses of mesenchymal stem cell MSC)-conjugated control isotype IgG or antibodies against indicated cell-surface proteins. MSCs were negative for CD11b, CD34, and CD45 ( A ) and positive for CD29 and CD44 ( B ).
- Conjugate
- Biotin
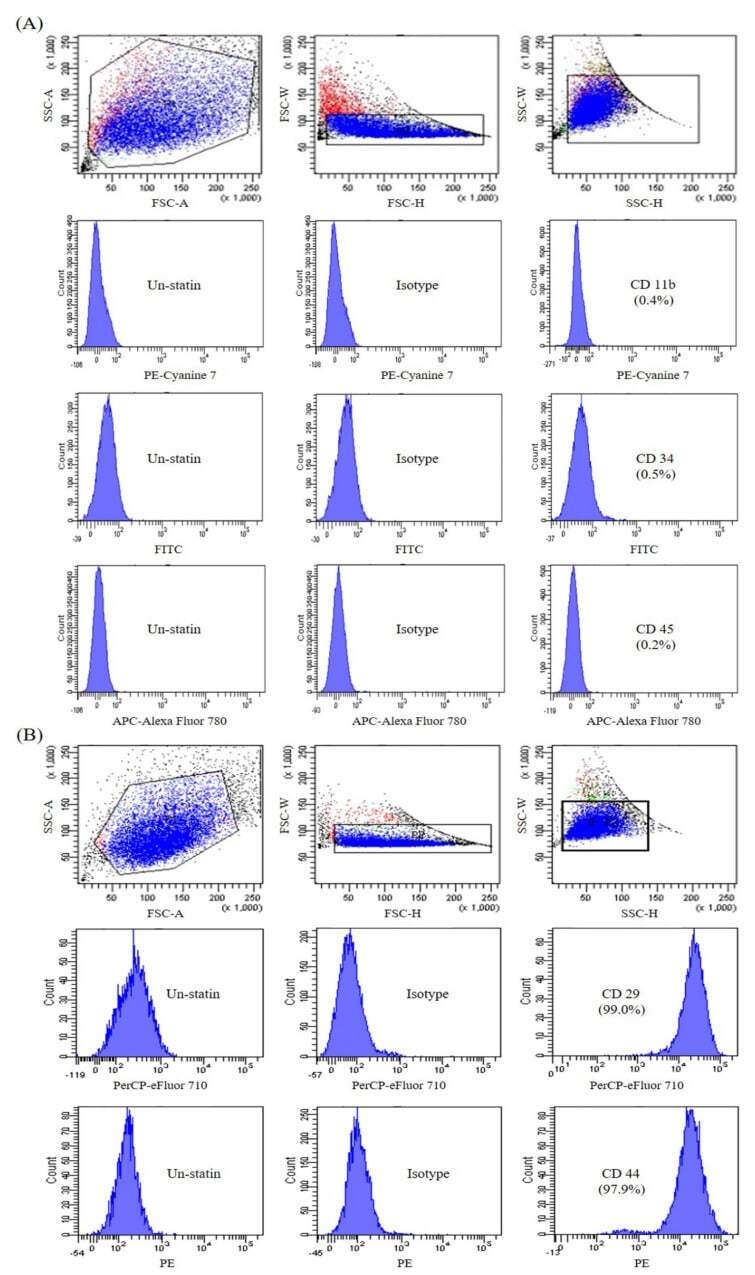
- Submitted by
- Invitrogen Antibodies (provider)
- Main image
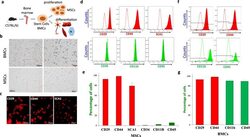
- Experimental details
- Fig. 1 Isolation and characterization of mesenchymal stem cells. a Schematic showing isolation of mouse bone marrow cells (BMCs) and its properties of self-renewal and differentiation of MSCs. b Representative microscopic images displaying isolated bone marrow cells that show circular and round-shaped morphology of BMCs; whereas, adhered MSCs show fibroblast or eye-shaped morphology. c Immunofluorescence images of MSCs showing the expression of MSC-positive markers (CD29, CD44, and SCA1). d Immunophenotypic characterization of MSCs using flow cytometer showing the absolute counts of MSC positive markers such as CD29, CD44, and SCA1, as well as expression of MSC-negative (CD34, CD45, and CD11b). Isotype controls for each antibody were used as controls and FITC/rhodamine-conjugated secondary antibodies were used for their detection. e Bar graph (quantification from four independent experiments (expressed as mean +- standard error)) showing the percentage of cells expressing the MSC-positive and negative markers respectively. f , g Immunophenotypic characterization of BMCs using flow cytometer showing expression various markers (CD29, CD44, CD45, and CD11b). Bar graph expressed as mean +- standard error shows quantification of respective markers from three independent experiments.
- Conjugate
- Biotin

- Submitted by
- Invitrogen Antibodies (provider)
- Main image
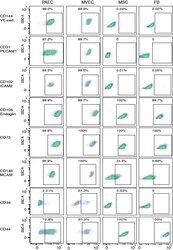
- Experimental details
- Fig. 3 Expression of endothelial cell surface determinants by primary lung MVEC. Lung cells were incubated with primary antibodies directly conjugated to fluorophores and staining intensity analyzed by flow cytometry. Representative dot plots are presented. Human lung FB and MSC were used as known negative controls, and PAEC as a known positive control. DAPI was used to exclude dead cells.
- Conjugate
- Biotin
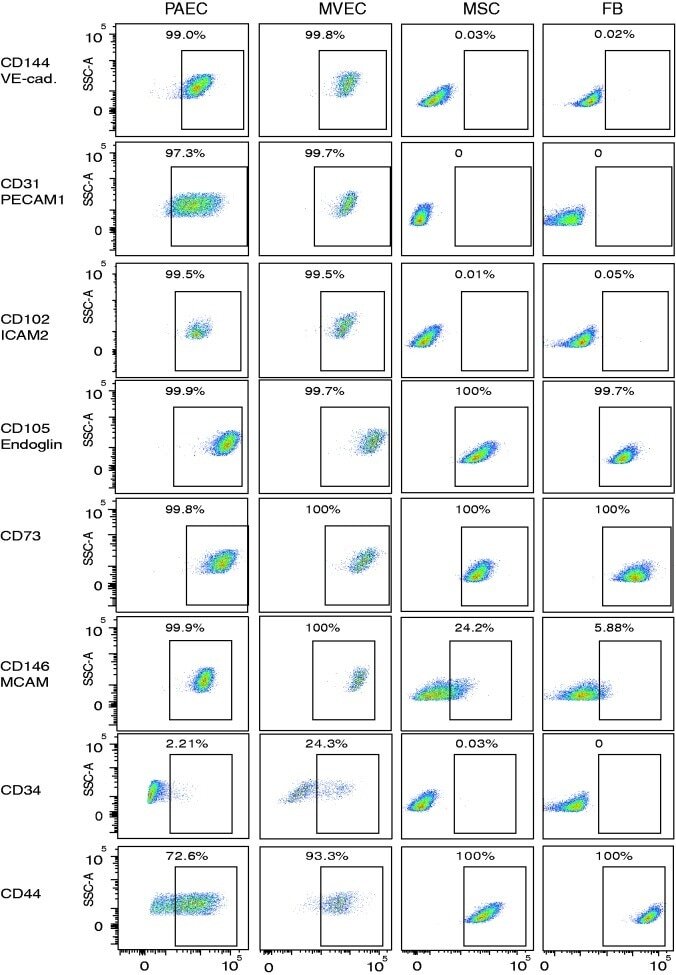
- Submitted by
- Invitrogen Antibodies (provider)
- Main image
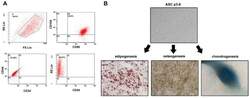
- Experimental details
- Figure 1 Identification of ADSCs. ( A ) ADSCs were isolated from the adipose tissue of breast tumors. After two to three passages, the expressions of ADSCs markers (CD90FITC, CD105PE, and CD44FITC) and the lack of CD34PE and CD45FITC were confirmed by flow cytometry. ( B ) The differentiation ability of ADSCs was tested by adipogenesis, osteogenesis, and chondrogenesis.
- Conjugate
- Biotin
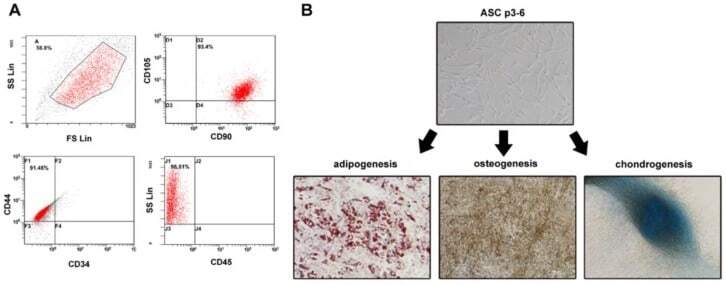
- Submitted by
- Invitrogen Antibodies (provider)
- Main image
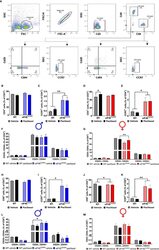
- Experimental details
- Figure 3 Paclitaxel dysregulates CD4 + and CD8 + T-cell subpopulations in an eIF4E-dependent manner. (A) Gating strategy used for flow cytometry of lymphocytes from popliteal and inguinal lymph nodes. T-cells were separated from the whole lymphoid cells population using CD3. CD3 + cells were then gated for CD4 + T-cell and CD8 + T-cells. For each of these subsets, cells were further gated for CCR7 or CD25 and CD44. (B) Quantification of CD4 + T-cells from the CD3 population from male mice. (C) CCR7 + T-cells from isolated CD4 + population in males, ** p 0.0063. (D) CD4 + cells gated for CD25 and/or CD44 in males. (E) Quantification of CD4 + T-cells from the CD3 + population from female mice, * p 0.0101. (F) CCR7 + T-cells from isolated CD4 + population in female mice, * p 0.0250. (G) CD4 + cells gated for CD25 and/or CD44 in female mice, ** p 0.0011. (H) Quantification of CD8 + T-cells from the CD3 + population from male mice. (I) CCR7 + T-cells from isolated CD8 + population in males, * p 0.0433. (J) CD8 + cells gated for CD25 and/or CD44 in males, * p 0.0396. (K) Quantification of CD8 + T-cells from the CD3 population from female mice, * p 0.041. (L) CCR7 + T-cells from isolated CD8 + population in female mice, ** p 0.0097. (M) CD8 + cells gated for CD25 and/or CD44 in female mice. All data are presented as mean +- standard error of the mean, n = 3 mice each for male/female WT vehicle-treated and WT paclitaxel groups, n = 4 mice each for male/female eIF4E S209A vehicle-trea
- Conjugate
- Biotin
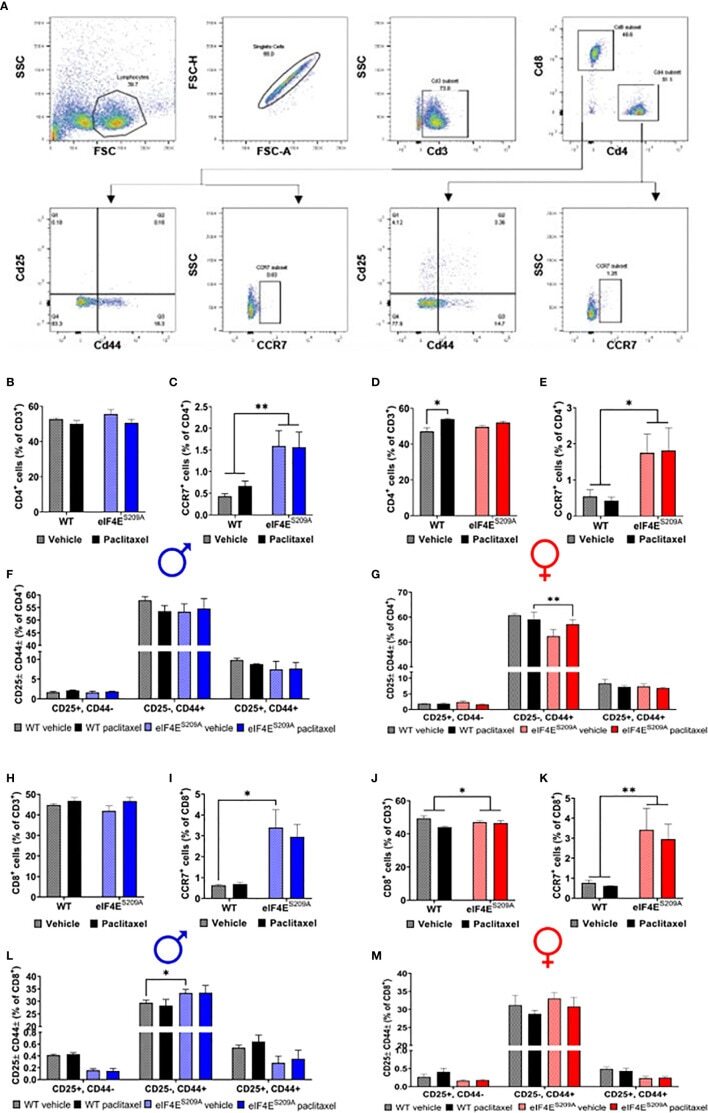
- Submitted by
- Invitrogen Antibodies (provider)
- Main image
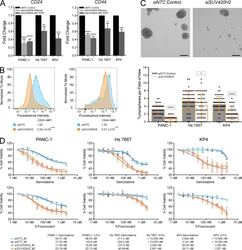
- Experimental details
- Figure 4. SUV420H2 knockdown decreases stemness and anticancer drug resistance of mesenchymal pancreatic cancer cells. (A) CD24 and CD44 RNA expression levels with NTC control or SUV420H2 knockdown determined by RNaseq or qRT-PCR. For graphs, bars indicate mean +- SD. For RNaseq, n = 3 biological replicates and differences assessed by using voom+limma (see Materials and methods). For qRT-PCR, n = 3 biological replicates each averaged from three technical replicates, and differences were assessed by Student's t test compared with siNTC control. *, P < 0.05; **, P < 0.01; ***, P < 0.001; ****, P < 0.0001. (B) Cell-surface protein level for CD24 and CD44 analyzed by flow cytometry in PANC-1 cells. B shows one representative panel per condition of a set of triplicates; differences were assessed by Student's t test compared with siNTC control. ***, P < 0.001; ****, P < 0.0001. (C) Tumorsphere formation assay showing representative images from a PANC-1 experiment and quantitation in three pancreatic cancer cell lines. n = 60 fields of view considered for each cell line, composed of 20 across three biological triplicates. Bar graphs depict mean +- SD. Differences were assessed by Student's t test compared with siNTC control in each cell line. *, P < 0.05; ****, P < 0.0001. Bars, 250 um. (D) Cell viability assays demonstrating effects of Gemcitabine and 5-Fluorouracil (5-FU) over 72 h on mesenchymal pancreatic cancer cells with NTC control or SUV420H2 knockdown, with two siRNAs for e
- Conjugate
- Biotin
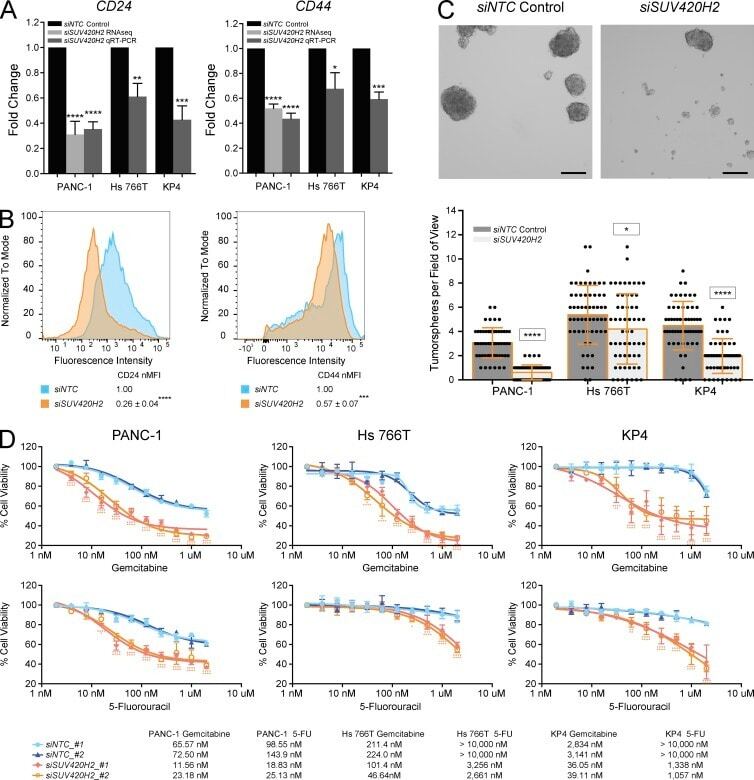
- Submitted by
- Invitrogen Antibodies (provider)
- Main image
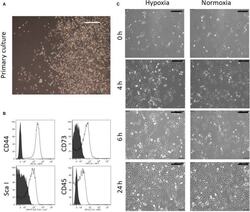
- Experimental details
- Figure 1 Characterization of murine MSCs. (A) Morphology of primary MSCs isolated from mouse bone marrow. MSCs easily form large colonies. (B) Histogram of flow cytometry for cell surface marker of MSCs. (C) Morphology of MSCs under normoxia and hypoxia conditions. Bar equals 200 um in all panels
- Conjugate
- Biotin
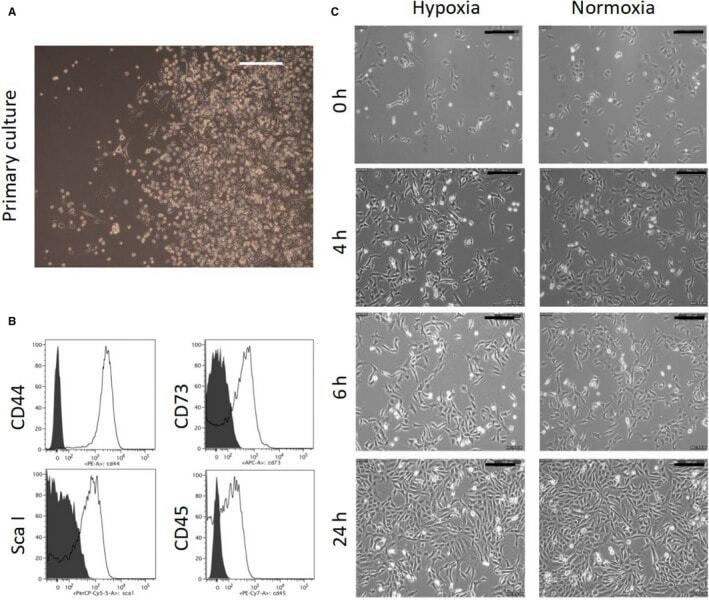
- Submitted by
- Invitrogen Antibodies (provider)
- Main image
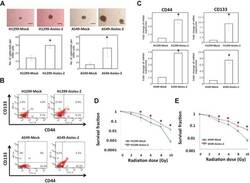
- Experimental details
- Figure 5 Overexpression of Aiolos upregulates the CSC-like properties in H1299 and A549 cells. ( A ) Representative images (top) and quantification (bottom) of spheroid formation in H1299-Mock and H1299-Aiolos cells and in A549-Mock and A549-Aiolos cells. Scale bars, 100 mum. Asterisk indicates P < 0.05, compared with control cells (Student's t-test). ( B ) Lung cancer stem cell surface markers (CD44 and CD133) in H1299-Aiolos vs H1299-Mock cells and in A549-Aiolos vs A549-Mock cells were analyzed by flow cytometry. ( C ) Real-time PCR analysis of CD44 and CD133 expression in H1299-Aiolos vs H1299-Mock cells (top) and in A549-Aiolos vs A549-Mock cells (bottom). Asterisk indicates P < 0.05, compared with control cells (Student's t-test). ( D ) Survival fraction of H1299-Aiolos cells after irradiation treatment. Asterisks indicate P < 0.05, compared with H1299-Mock cells (Student's t-test). ( E ) Survival fraction of A549-Aiolos cells after irradiation treatment. Asterisks indicate P < 0.05, compared with A549-Mock cells (Student's t-test).
- Conjugate
- Biotin
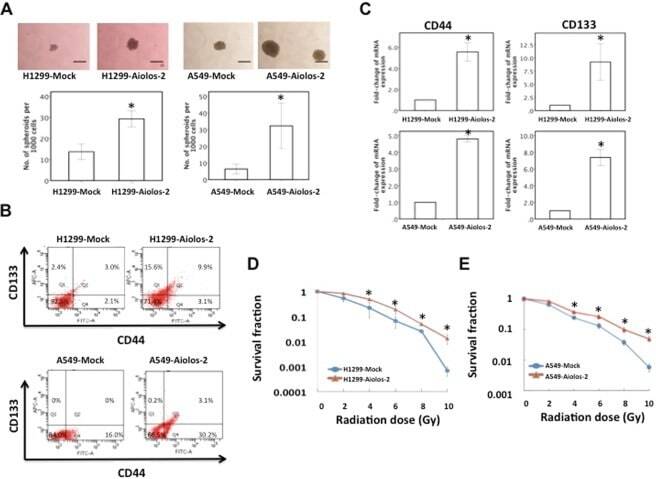
- Submitted by
- Invitrogen Antibodies (provider)
- Main image
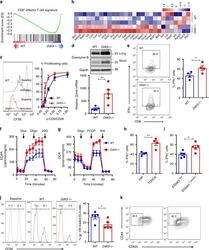
- Experimental details
- Fig. 3 Chop negatively regulates effector CD8 + T cell activity. a Gene set enrichment analysis was performed to determine the specific enrichment in effector CD8 + T cell gene signature in primed wild-type or Ddit3 -/- Pmel CD8 + T cells. b Heatmap showing the expression of selective effector function-related transcripts in primed wild-type vs. Ddit3 -/- Pmel CD8 + T cells, as described in the Methods section. c Carboxyfluorescein succinimidyl ester (CFSE)-labeled wild-type or Ddit3 -/- CD8 + T cells were stimulated with anti-CD3/CD28 and proliferation tested after 72 h by fluorescence-activated cell sorter (FACS). Left: representative histogram of T cell proliferation (n = 6); right: T cell proliferation rates under different concentrations of anti-CD3/CD28 (ug/ml) ( n = 6). d Granzyme B protein (upper panel, long- and short-time exposure) and Gzmb mRNA levels (lower panel) in wild-type or Ddit3 -/- CD8 + T cells primed with anti-CD3/CD28 for 72 h ( n = 5). e Percentage of IFNgamma + cells in wild-type or Ddit3 -/- CD8 + T cells primed as in ( d ). Right: representative FACS findings; left: merged percentage values from n = 4. f Extracellular acidification rate (ECAR) of wild-type or Ddit3 -/- CD8 + T cells primed as in d upon glycolysis stress analysis ( n = 3). g Oxygen consumption rate (OCR) of wild-type or Ddit3 -/- CD8 + T cells activated as in d after mitochondrial stress analysis ( n = 3). h , i Percentage of IFNgamma + cells in CD8 + T cells primed in the presence o
- Conjugate
- Biotin

- Submitted by
- Invitrogen Antibodies (provider)
- Main image
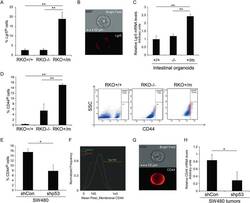
- Experimental details
- Fig. 2 Mutant p53-expressing cells contain larger CD44 Br and Lgr5 Br sub-populations a, b RKO isogenic cell lines were immuno-stained with anti-Lgr5 antibody and the size of Lgr5 Br sub-population was measured by ImageStream X. a Graph presenting an averaged percentage of Lgr5 Br cells obtained from three independent experiments. Error bars represent SE. b Representative photo of Lgr5 Br cedi, c Organoids were produced from intestinal epithelial cells extracted from WTp53, p53 knock-out (p53 KO), or WTp53/mutant p53 R172H heterozygous mice, as previously described [ 15 ]. Lgr5 mRNA expression levels were measured by qRT-FCR using specific primers. Graph represents an average of three independent organoids pools. Error bars represent SE. d RKO isogenic cell lines were immuno-stained with either anti-CD44 antibody that recognizes all CD44 isoforms and the size of CD44 Br sub-populations was measured by FACS. Left: Graph presenting an averaged percentage of CD44 Br cells obtained from three experiments. Error bars represent SE. Right panel shows representative dot plots indicating on percentage of CD44 Br sub-populations, e-g The established shCon and shp53 SW480 cells were immuno-stained with either anti-CD44 antibody that recognizes all CD44 isoforms and the size of CD44 Br sub-populations was measured by ImageStream X. e Graph presenting an averaged percentage of cells obtained from four experiments, f Representative plot of the mean pixel intensity
- Conjugate
- Biotin
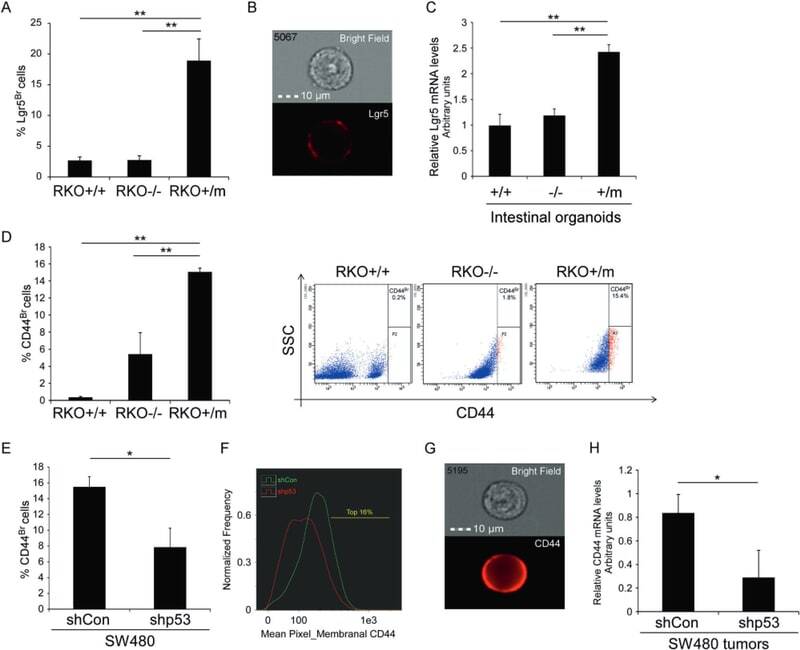
- Submitted by
- Invitrogen Antibodies (provider)
- Main image
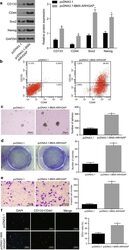
- Experimental details
- Fig. 2 BMX-ARHGAP upregulation induces SGC7901 stem cell formation, proliferation and invasion. a Protein expression of CD133, CD44, SOX2 and Nanog in transfected SGC7901 cells determined by western blot assay; b CD133 + CD44 + cells sorted by flow cytometry; c the number of formed cell spheres after transfection shown by cell sphere formation assay ( x200); d the number of formed cell colonies after transfection shown by cell colony formation assay; e , the invasion ability of CD133 + and CD44 + evaluated by Transwell assay (x200); f proliferation ability of CD133 + and CD44 + evaluated by EdU labeling assay (x100). * p < 0.05 vs. the pcDNA3.1-transfected cells. Measurement data were expressed as mean +- standard deviation and analyzed by independent t -test; each experiment was repeated three times. BMX bone marrow kinase on chromosome X, ARHGAP RhoA GTPase activating protein
- Conjugate
- Biotin
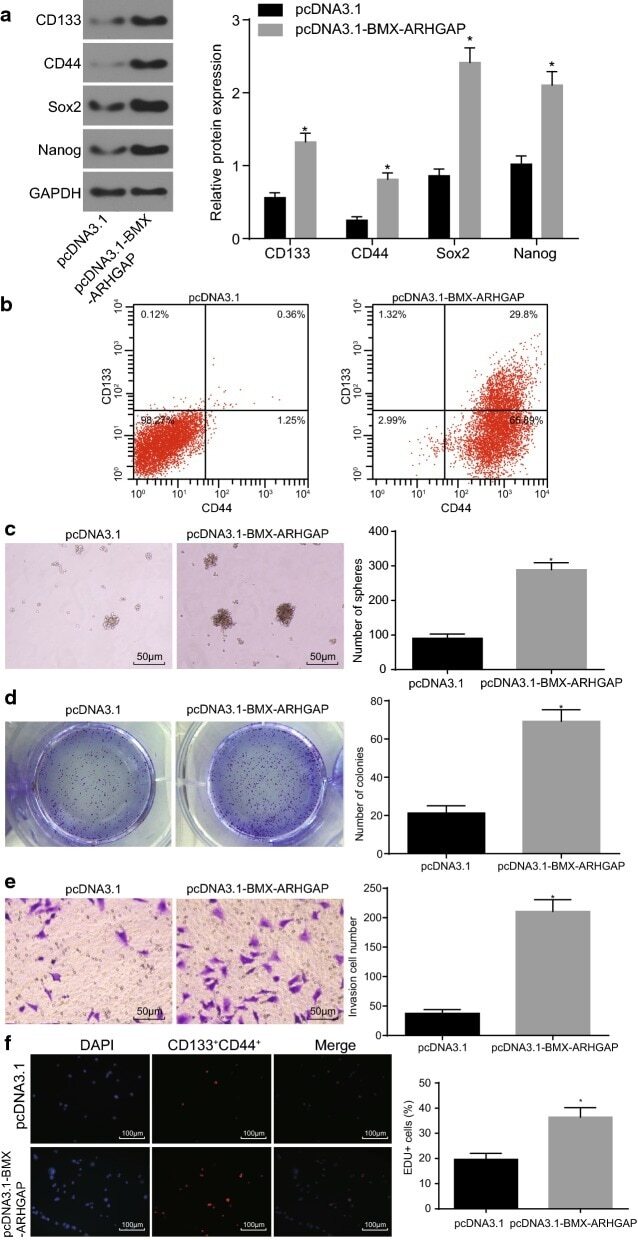
- Submitted by
- Invitrogen Antibodies (provider)
- Main image
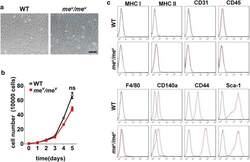
- Experimental details
- Fig. 1 SHP1 deficiency had no effect on the cell morphology, proliferation rate or surface markers. a Phase-contrast images of MSCs derived from bone marrow of WT and me v /me v mice. Scale bar: 50 mum. b The same number of WT and me v /me v MSCs were coated into the 6 well plates, the number were calculated every day until the sixth day and the proliferation rate was monitored. c After isolation from bone marrow and culture for an equal number of passages, me v /me v and WT MSCs were harvested and analyzed for the indicated markers by immunofluorescence staining and flow cytometry. The experiments were repeated at least three times. Error bars represent +- SEM (n = 3), ns, not significant
- Conjugate
- Biotin
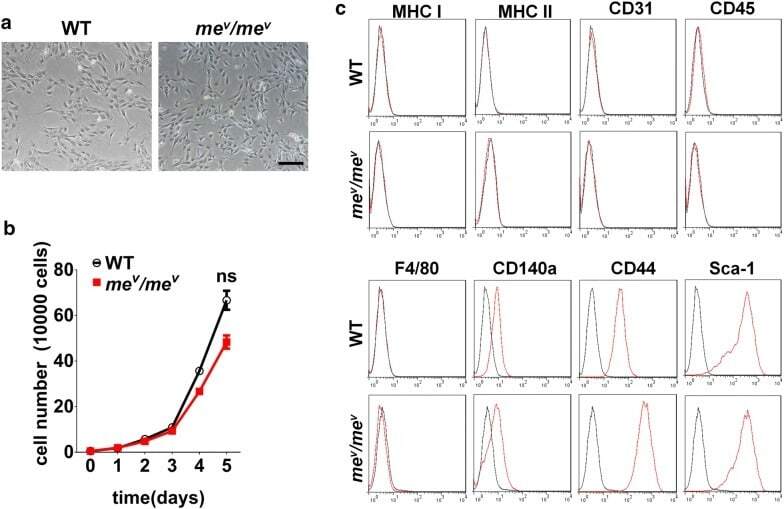
- Submitted by
- Invitrogen Antibodies (provider)
- Main image
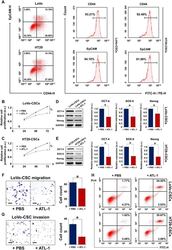
- Experimental details
- FIGURE 1 Characterization of colorectal CSCs isolated from LoVo and HT29 cells. A, Flow cytometric sorting of CSCs using CD44 and EpCAM as markers. The percentage of parental LoVo and HT29 cells expressing both CD44 and EpCAM was approximately 15%, representing the proportion of CSCs. CSCs isolated from parental LoVo and HT29 cells (denoted as LoVo-CSCs and HT29-CSCs, respectively) exhibited high expression of both markers (>90%). Relative proliferation of (B) LoVo-CSCs and (C) HT29-CSCs was inhibited by ATL-1 at 200 muM for up to 72 h, compared to that of control (+PBS) CSCs. The protein expression of stemness markers OCT-4, SOX-9, and Nanog, relative to GAPDH, in (D) LoVo-CSCs and (E) HT29-CSCs was downregulated by ATL-1 at 200 muM after 48 h of culture, compared to that of control (+PBS) CSCs. Transwell assay of the (F) migration and (G) invasion of LoVo-CSCs demonstrated decreased cell counts in both cases when ATL-1 was administered at 200 muM, compared to those of control (+PBS) CSCs. H, The percentage of apoptotic LoVo-CSCs and HT29-CSCs was elevated in the presence of ATL-1 at 200 muM, compared to that of control (+PBS) CSCs. The data represent the mean +- SD of three independent technical replicates ( t -test); * P < .05; % P < .05 at 72 h
- Conjugate
- Biotin

- Submitted by
- Invitrogen Antibodies (provider)
- Main image
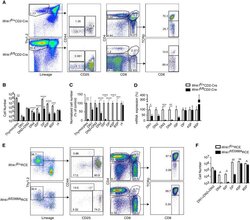
- Experimental details
- Figure 1. Essential role for WNK1 in thymocyte development. ( A ) Flow cytometric analysis of thymocytes from Wnk1 fl/+ CD2-Cre and Wnk1 fl/fl CD2-Cre mice showing double negative (DN, Thy1.2 + Lineage - ) thymocytes subdivided into DN1 (CD44 + CD25 - ), DN2+DN3 (CD25 + ), and DN4 (CD44 - CD25 - ) subsets, immature single positive (ISP, CD4 - CD8 + TCRbeta - ), double positive (DP, CD4 + CD8 + ), CD4 + single positive (4SP, CD4 + CD8 - ), and CD8 + single positive (8SP, CD4 - CD8 + TCRbeta + ) thymocytes. Numbers show % of cells falling into each gate. ( B ) Mean +- SEM number of total thymocytes and of thymocytes at each developmental stage defined using the gates in A, as well as gammadelta thymocytes (CD4 - TCRgamma + ). ( C ) Mean +- SEM number of cells in each thymocyte population in Wnk1 fl/fl CD2-Cre animals normalized to Wnk1 fl/+ CD2-Cre controls (set to 100%). ( D ) Mean +- SEM Wnk1 mRNA levels in thymic subsets from Wnk1 fl/+ CD2-Cre and Wnk1 fl/fl CD2-Cre mice, normalized to Wnk1 fl/+ CD2-Cre controls (set to 100%) measured by Q-PCR from exon 1 to exon 2. CD44 levels were used to separate DN2 (CD44 + ) and DN3 (CD44 - ) thymocytes. ( E ) Flow cytometric analysis of Rag1 -/- radiation chimeras reconstituted with bone marrow from Wnk1 fl/+ RCE and Wnk1 fl/D368A RCE mice, treated with tamoxifen and analyzed 7 d later showing gating for thymocyte subsets as in A, with DN (Thy1.2 + Lineage - ) thymocytes pre-gated on CD4 - CD8 - cells. ( F ) Mean +- SEM number of cells
- Conjugate
- Biotin

- Submitted by
- Invitrogen Antibodies (provider)
- Main image
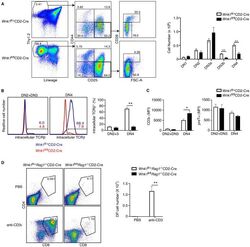
- Experimental details
- Figure 2. WNK1 is required for thymocytes to develop past the pre-TCR checkpoint. ( A ) Left: flow cytometric analysis of Thy1.2 + Lineage - thymocytes separated by expression of CD44 and CD25, and then DN3 (CD44 - CD25 + ) cells separated into DN3a (small, FSC low CD28 - ) and DN3b (large, FSC high CD28 + ) cells. Right: Mean +- SEM cell numbers in DN subsets. ( B ) Left: Flow cytometric analysis of thymocytes from Wnk1 fl/+ CD2-Cre and Wnk1 fl/fl CD2-Cre mice showing intracellular TCRbeta levels in DN2+DN3 and DN4 subsets. Numbers indicate the percentage of TCRbeta + cells. Right: Mean +- SEM percentage of DN2+DN3 and DN4 cells that are intracellular TCRbeta + . ( C ) Mean +- SEM of CD3epsilon or pre-Talpha surface levels measured as mean fluorescence intensity (MFI) in flow cytometry of DN2+DN3 and DN4 thymocytes from Wnk1 fl/+ CD2-Cre and Wnk1 fl/fl CD2-Cre mice. ( D ) Left: flow cytometric analysis of CD4 and CD8 levels on thymocytes from Wnk1 fl/+ Rag1 -/- CD2-Cre and Wnk1 fl/fl Rag1 -/- CD2-Cre mice harvested 4 d after intraperitoneal injection with PBS or anti-CD3epsilon antibody. Gate indicates DP thymocytes and number shows percentage of cells in the gate. Right: mean +- SEM number of DP thymocytes defined using the gates on the left. *0.01
- Conjugate
- Biotin
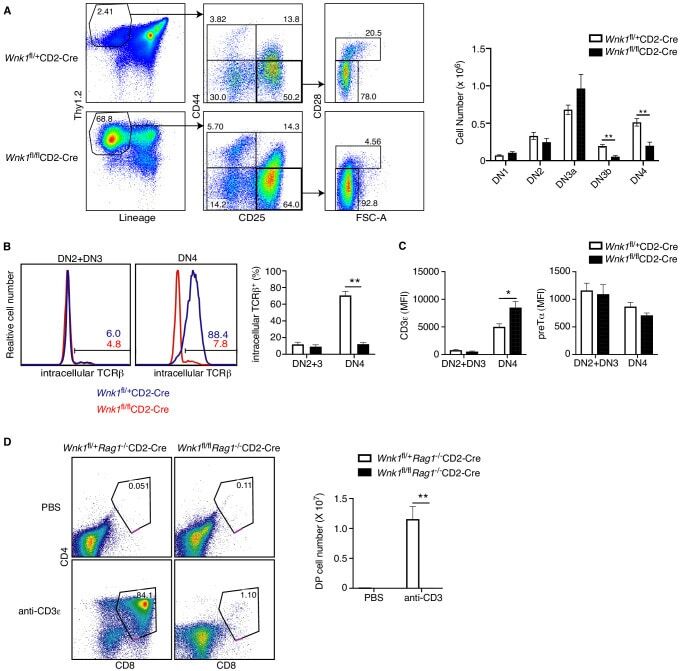
- Submitted by
- Invitrogen Antibodies (provider)
- Main image
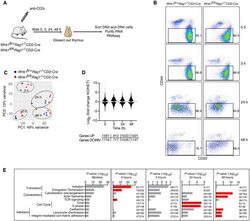
- Experimental details
- Figure 3. RNAseq of WNK1-deficient thymocytes reveals significant changes in five distinct processes. ( A ) Thymi were harvested from Wnk1 fl/+ Rag1 -/- CD2-Cre and Wnk1 fl/fl Rag1 -/- CD2-Cre mice that were either untreated (0 hr) or had been injected with anti-CD3epsilon antibody 3, 24 or 48 hr earlier. DN3+DN4 thymocytes were sorted, RNA purified and analyzed by RNAseq, results of which are shown in C-E. ( B ) Flow cytometric analysis of DN thymocytes from the experiment described in A. Gates indicate cells (Thy1.2 + , CD44 - ) that were sorted for further RNAseq analysis. ( C ) Principal component analysis using expression of all normalized genes for all samples from the experiment described in A. ( D ) Log 2 fold changes and total number of statistically significant differentially expressed genes (DEGs) in samples from Wnk1 fl/fl Rag1 -/- CD2-Cre (KO) mice compared to Wnk1 fl/+ Rag1 -/- CD2-Cre (HET) mice at each time point ( Supplementary files 2 , 3 ). ( E ) Metacore process analysis of DEGs. Selected processes and their P -values are shown at each time point; graph on left shows the lowest P -value for each process from any of the four time points. Red bars indicate time point with the lowest P -values for each process (Minimal). Ratios indicate the number of DEGs at each time point over the number of all genes in the indicated processes. Significance calculated by Wald's test ( D ) and Hypergeometric test ( E ). Sample sizes: three Wnk1 fl/+ Rag1 -/- CD2-Cre and four
- Conjugate
- Biotin
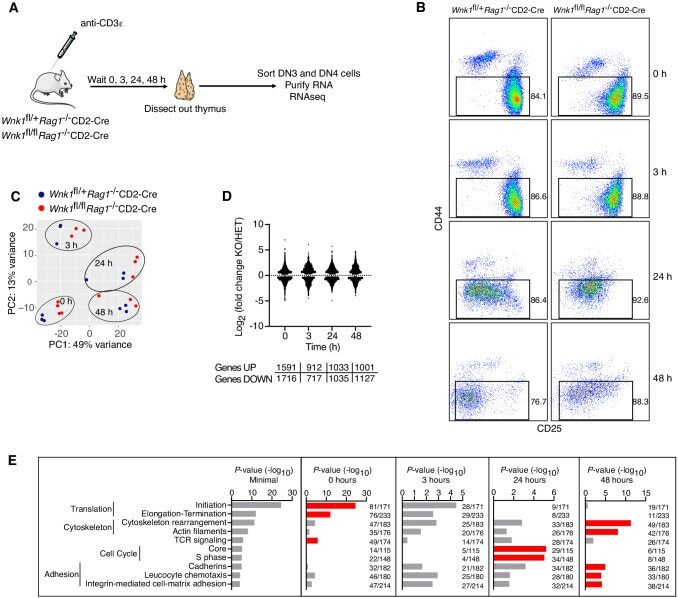
- Submitted by
- Invitrogen Antibodies (provider)
- Main image
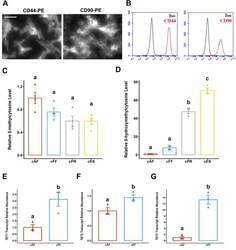
- Experimental details
- Fig. 1 Cell type-dependent levels of 5-methylcytosine and 5-hydroxymethylcytosine. a Representative fluorescent micrographs for canine fetal fibroblasts (cFFs) stained with phycoerythin (PE)-conjugated antibodies against CD44 and CD90/THY1. Scale bar unit length is 50 mum. b Overlay histograms showing cFFs stained with PE-conjugated antibodies (red) or isotype control antibodies (black). Fold difference in c 5-methylcytosine and d 5-hydroxymethylcyctosine levels in canine adult fibroblast (cAF), canine fetal fibroblast (cFF), canine partially reprogrammed (cPR), and canine embryonic stem cells (cESCs). Data are presented as mean +- standard error, n = 4. Relative transcript abundance for e TET1, f TET2, and g TET3 in steady-state cultures of cAF and cFF. Data are presented as mean +- standard error, n = 3. Means annotated with different letters are considered significantly different by one-way analysis of variance and Tukey's honestly squared difference test, P < 0.05
- Conjugate
- Biotin
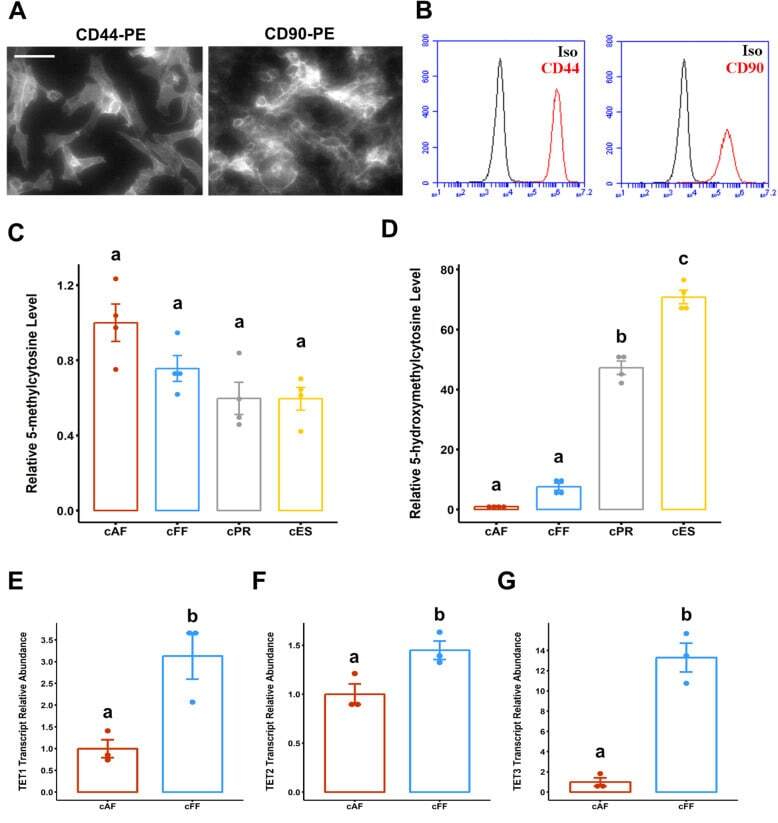
- Submitted by
- Invitrogen Antibodies (provider)
- Main image

- Experimental details
- Fig. 3 Expression levels of CD44 and EpCAM on KatoIII cells surface and the effect of transient transfection of miR-34a-5p mimic on these markers expression. a The flow cytometry analysis indicated that EpCAM and CD44 are expressed in almost all and ~ 97% of KatoIII cells, respectively. The expression of CD44 on KatoIII cells showed lower intensity than EpCAM expression. In addition, two sub-populations of EpCAM positive cells with different fluorescence intensity were observed in KatoIII cell line. b The frequency and MFI of EpCAM marker were compared between adhesive KatoIII cells dissociated from the flask using trypsin enzyme and non-adhesive KatoIII cells. Data showed that the use of trypsin enzyme for detachment of the adherent cells from the flask reduced the fluorescence intensity of EpCAM (116.5 +- 0.7), in comparison to the suspended cells (180 +- 5.65). But, the use of trypsin enzyme for detachment of the adherent cells had no effect on the frequency of EpCAM positive cells. c According to the flow cytometry analysis, transient transfection of the miR-34a-5p mimic at 25 nM had no effect on percentage of CD44 and EpCAM positive cells in KatoIII cells. MFI: Median Fluorescence Intensity
- Conjugate
- Biotin
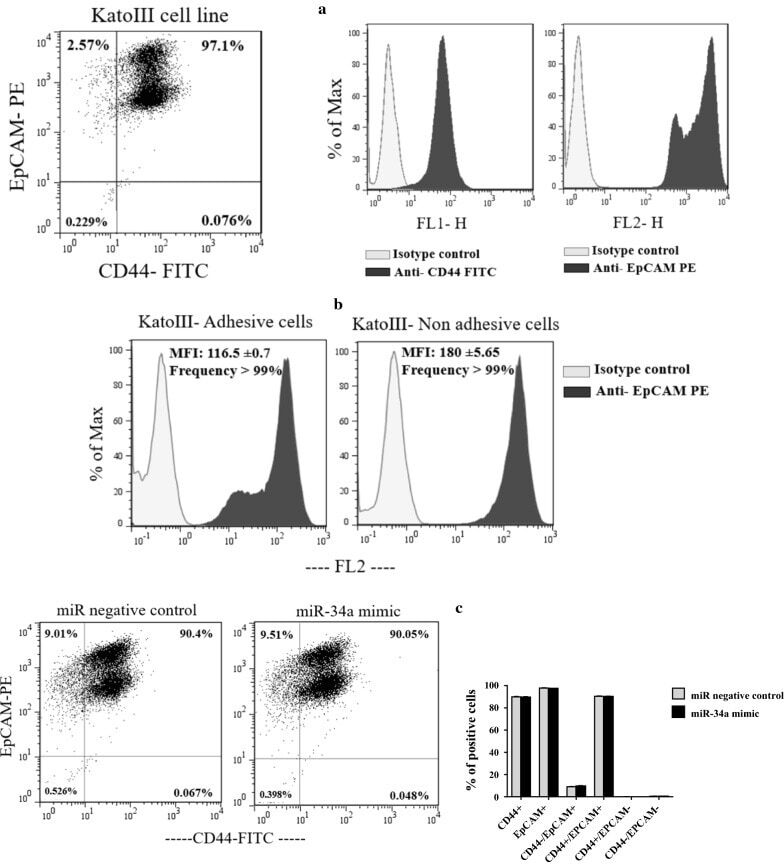
- Submitted by
- Invitrogen Antibodies (provider)
- Main image
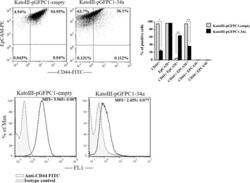
- Experimental details
- Fig. 5 The effect of stable transfection of pre-mir-34a on the expression levels of CD44 and EpCAM markers. The flow cytometric detection illustrated that the percentage of CD44 + cells and the MFI of CD44 marker were significantly decreased in the KatoIII-pGFPC1-34a cells compared to the KatoIII-pGFPC1- empty cells. No difference was found in percentage of EpCAM + cells between these two stable cells. *p < 0.05; **p < 0.01. MFI: Median Fluorescence Intensity
- Conjugate
- Biotin

- Submitted by
- Invitrogen Antibodies (provider)
- Main image
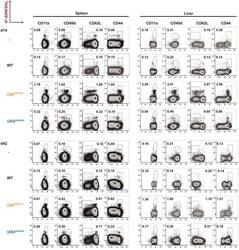
- Experimental details
- Figure EV3 Sporozoite surface antigen induces a greater effector CD8 + T-cell phenotype than EEF vacuolar membrane antigen C57BL/6 mice received 2 x 10 6 OT-I cells alone ( n = 2) or were additionally immunised with 10,000 gamma-radiation attenuated WT ( n = 3), CSP SIINFEKL ( n = 4) or UIS4 SIINFEKL ( n = 4) sporozoites intravenously. Spleens and livers were harvested either 14 or 42 days later, and proportions of CD8 + T cells expressing effector surface markers were quantified. Flow cytometry plots show representative percentages of CD8 + T cells co-staining K b -SIINFEKL and markers of effector phenotype (CD11a hi , CD49d hi , CD62L lo , CD44 hi ).
- Conjugate
- Biotin
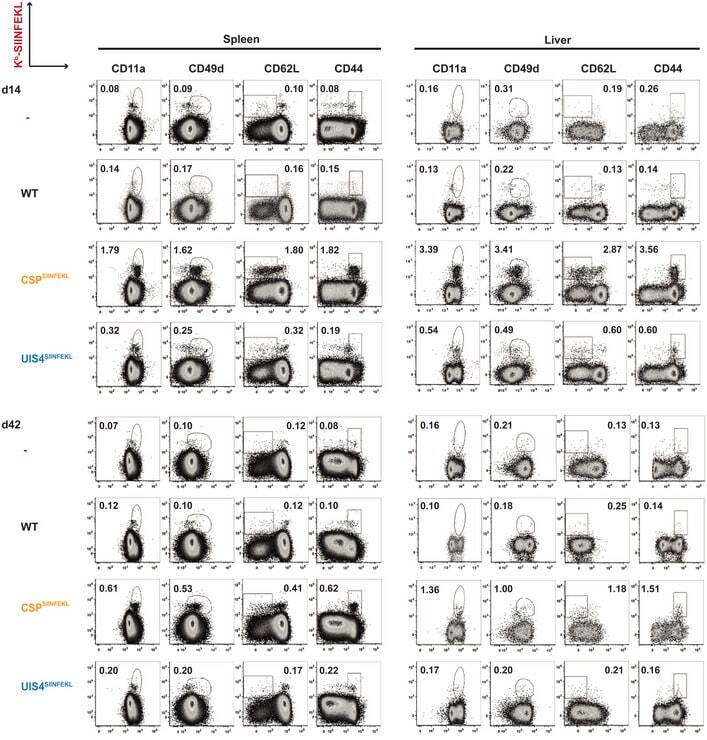
- Submitted by
- Invitrogen Antibodies (provider)
- Main image
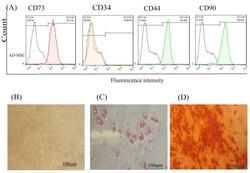
- Experimental details
- Figure 1 AD-MSCs characterization; (A) Flow cytometry assay to assess the CD markers in the surface of extracted AD-MSCs. Target cells were positive for CD73 (95.1%), and CD90 (90.6%) surface markers and were negative for CD44 and CD34 markers. (B) Morphology of AD-MSCs at passage 3. (C) Oil red staining to prove the adipogenic potential differentiation of AD-MSCs. (D) Alizarin-red staining to confirm the osteogenic potential differentiation of AD-MSCs. Scale bar = 100 mum. Abbreviations: AD-MSCs: adipose-derived mesenchymal stem cells.
- Conjugate
- Biotin
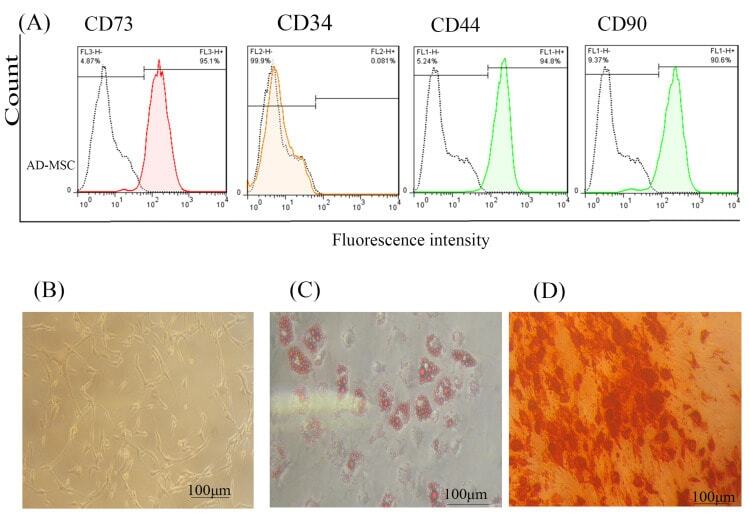
- Submitted by
- Invitrogen Antibodies (provider)
- Main image
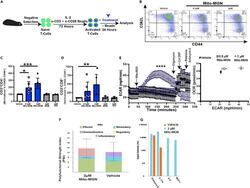
- Experimental details
- Figure 5 Impact of Mito-MGN on T cell activation and effector functions (A) Schematic for analyzing Mito-MGN effects on splenic T cells. (B-D) Changes in T cell activation. Representative flow cytometry plots of CD44 hi CD62L lo levels in T cells (B). Enumeration of activated T cells of CD4 + (C) and CD8 + (D) T cell subsets in Mito-MGN treated and vehicle control cells. Values are mean +- SD, n = 6 independent experiments. Statistical significance determined using a Student's t-test (**, p< 0.01; ***, p< 0.001). Effects of Mito-MGN on T cell proliferation and early activation markers are shown in Figure S8 . (E) Realtime measurement of extracellular acidification rate (ECAR) (left panel) and oxygen consumption rate (OCR) in treated T cells Values are mean +- SD of n = 3 biological replicates completed in technical quadruplicate. Statistical differences at individual time points were analyzed using Student's t-test (****, p< 0.0001). (F and G) IsoPlexis IsoLight assay measured Polyfunctionality Strength Index (PSI) scores (F) and effector or inflammatory cytokine levels (G) in Mito-MGN treated compared to vehicle control T cells. Values are mean +- SD from 2 biological replicates.
- Conjugate
- Biotin
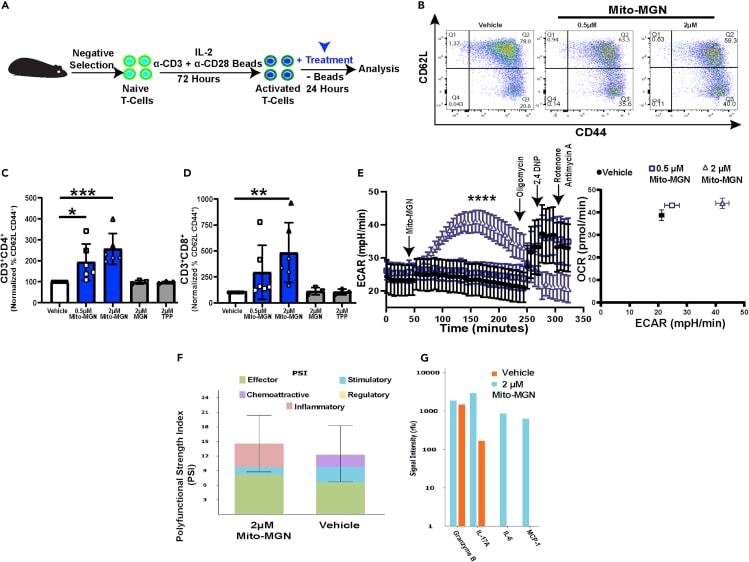
- Submitted by
- Invitrogen Antibodies (provider)
- Main image
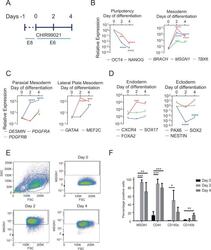
- Experimental details
- Fig. 1 Mesodermal progenitors can be derived trough a chemically defined monolayer approach. A Schematic overview of the protocol to differentiate induced pluripotent stem cells towards mesodermal progenitors. B - D Gene expression of markers for pluripotency, early and late mesoderm, ectoderm, and endoderm during mesoderm differentiation. E FACS analysis of Mesogenin1 (MSGN1) during differentiation using a MSGN1-2A-Venus reporter line. F Percentage of MSGN1, CD44, and CD140A/B positive cells during differentiation, based on FACS analysis. * P < 0.05; ** P < 0.01; *** P < 0.001; **** P < 0.0001. n = 3-4.
- Conjugate
- Biotin

- Submitted by
- Invitrogen Antibodies (provider)
- Main image
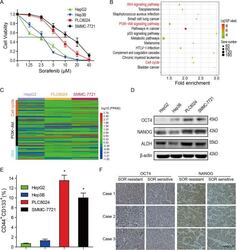
- Experimental details
- Fig. 1 Tumor stemness is increased in sorafenib-resistant hepatocellular carcinoma cells. A SMMC-7721 and PLC8024 cells were more resistant to sorafenib than HepG2 and Hep3B cells. HCC cells were treated with 0-40 muM sorafenib and the cell viability was analyzed by the CCK8 assay. Data were presented as mean +- SD ( n = 3). B The KEGG analysis on the upregulated/downregulated genes. The genes expression changed more than 2 folds were analyzed between sorafenib-resistant vs. sorafenib-sensitive HCC cells. C Heatmap of gene expression participated in cell cycle pathway, Wnt signaling, and PI3K-AKT pathway. The levels of the gene expression were reflected by different colors, colors from blue to red stood for expression levels from low expression to high expression. D The expression of stem cell markers was enhanced in sorafenib-resistant HCC cells. The expression of ALDH, SOX2, and OCT4 was analyzed. E The CD44 + CD133 + subpopulations were increased in sorafenib-resistant HCC cells. The CD44 + CD133 + subpopulation was analyzed by flow cytometry using anti-CD44 and anti-CD133 antibodies. * P < 0.05, ** P < 0.01. F Stemness was increased in sorafenib-resistant HCC tumors. OCT4 and NANOG expression were detected by IHC. Bar = 100 mum.
- Conjugate
- Biotin
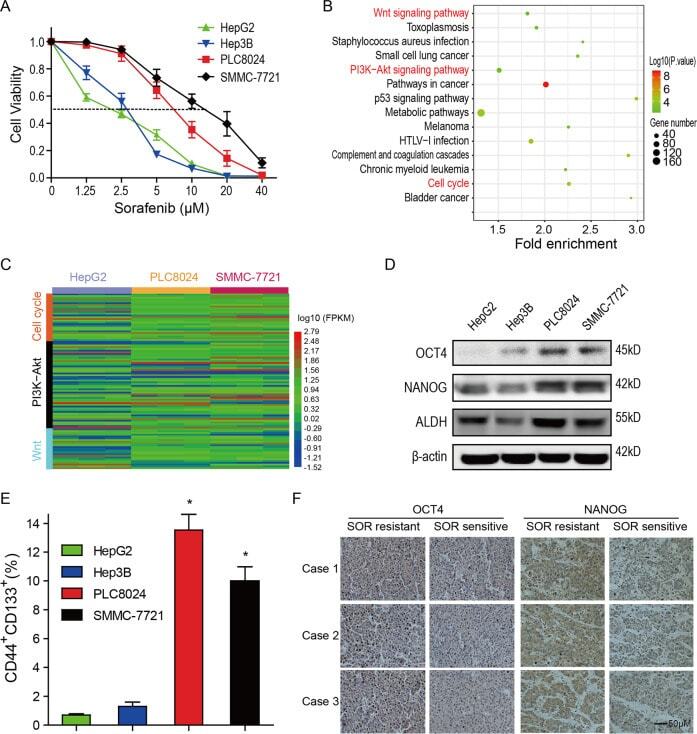
- Submitted by
- Invitrogen Antibodies (provider)
- Main image
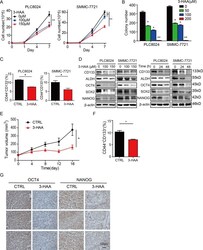
- Experimental details
- Fig. 3 3-hydroxyanthranic acid inhibits tumor stemness of sorafenib-resistant HCC cells. A 3-HAA inhibited cell growth of sorafenib-resistant HCC cells. Cell numbers of HCC cells were counted by cytometry. Data were presented as mean +- SD ( n = 3). * P < 0.05, ** P < 0.01. B 3-HAA reduced colony formation in sorafenib-resistant SMMC-7721 and PLC8024 cells. Cells were treated with 3-HAA at the indicated dose. * P < 0.05, ** P < 0.01. C The ratio of CD44 + CD133 + subpopulation was decreased in 3-HAA-treated SMMC-7721 and PLC8024 cells. Cells were treated with 3-HAA at the dose of 100 muM for 48 h. * P < 0.05. D 3-HAA inhibited the expression of stem cell markers in HCC cells. The treating time was 48 h for the dose-response experiment and the dose of 3-HAA was 100 muM for the time-course analysis. E 3-HAA suppressed tumor growth of SMMC-7721 xenografts. The 3-HAA was administrated 100 mg/kg day by intraperitoneal injection for 16 days, five mice were recruited in the control and 3-HAA-treated group. The tumor volumes were presented as mean +- SD. * P < 0.05. F 3-HAA decreased the proportion of CD44 + CD133 + subpopulation in SMMC-7721 xenografts. Tumor cells were analyzed by flow cytometry using anti-CD133-PE and anti-CD44-APC. * P < 0.05. G 3-HAA inhibited the expression of stem cell markers in SMMC-7721 xenografts. Bar = 100 mum.
- Conjugate
- Biotin
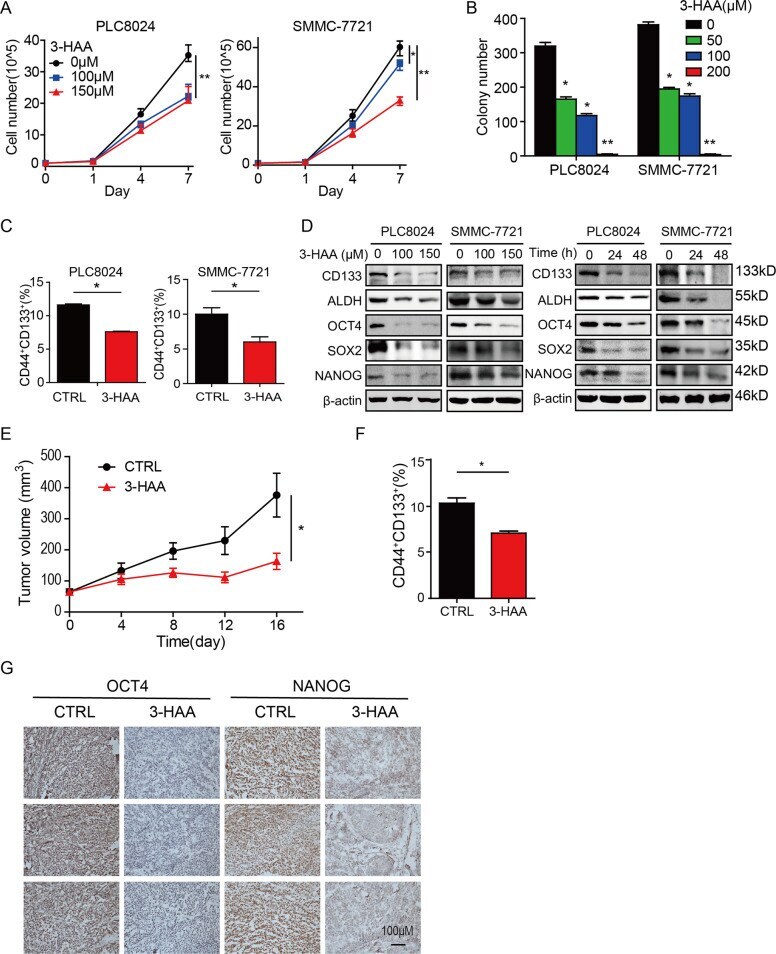
- Submitted by
- Invitrogen Antibodies (provider)
- Main image
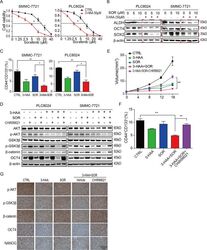
- Experimental details
- Fig. 5 The 3-HAA increases the sensitivity of HCC cells to sorafenib by suppressing stemness. A The cell viability of 3-HAA-treated SMMC-7721 and PLC8024 cells was analyzed by CCK8 assay. Cells were treated with sorafenib at the indicated dose with or without 100 muM 3-HAA for 4 days. * P < 0.05. B The combination of 3-HAA and sorafenib dramatically inhibited ALDH, SOX2, and OCT4 expression in SMMC-7721 and PLC8024 cells. Cells were treated with 100 muM of 3-HAA and sorafenib at the indicated dose for 24 h. C The combination of sorafenib and 3-HAA significantly reduced the proportion of CD133 + CD44 + tumor cells than either 3-HAA alone or sorafenib alone in SMMC-7721 and PLC8024 cells. Cells were treated with 100 muM 3-HAA and 5 muM sorafenib for 24 h. * P < 0.05, ** P < 0.01. D CHIR99021 recovered the AKT/GSK3beta/beta-catenin signaling and the expression of stemness markers, inhibited by the combination treatment. Cells were treated with 100 muM 3-HAA, 5 muM sorafenib, and/or 5 muM CHIR99021 for 24 h. E CHIR99021 recovered the combination-suppressed tumor growth of SMMC-7721 xenografts. 3-HAA and sorafenib were separately administrated by intraperitoneal injection for 16 days at the dose of 100 and 10 mg/kg day, respectively. CHIR99021 was administered orally at 40 mg/kg day, five mice were recruited in each group. The tumor volumes are presented as mean +- SD. ** P < 0.01. F CHIR99021 increased the ratio of CD44 + CD133 + subpopulation in SMMC-7721 xenografts. Tumor cells
- Conjugate
- Biotin
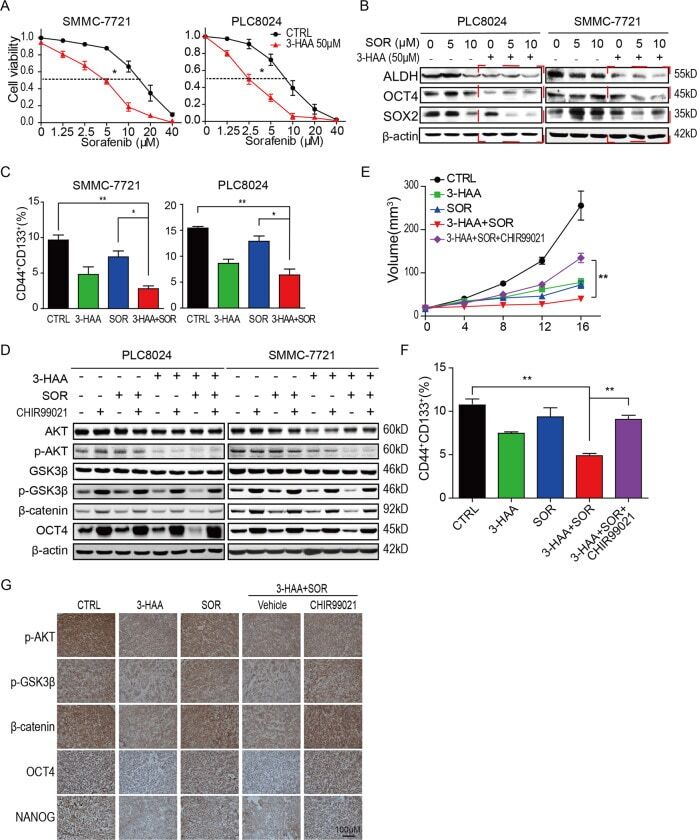
- Submitted by
- Invitrogen Antibodies (provider)
- Main image
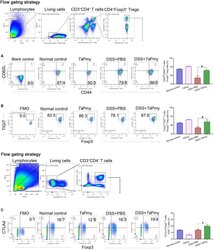
- Experimental details
- FIGURE 7 r Ts Pmy maintains majority of Tregs in an effective suppressor status (CD62L lo CD44 hi eTregs) with greater expression of functional phenotypes of TIGIT and CTLA4 in cLP with DSS-induced colitis. Flow cytometry results showed the frequencies of CD44 hi CD62L lo cells (A) and TIGIT + cells (B) in CD4 + Foxp3 + T cells of cLP from r Ts Pmy or PBS-treated mice with or without DSS colitis. The blank control of antibodies of CD62L and CD44 (A) was shown, and the antibody of TIGIT (B) were cut in FMO control samples. The corresponding percentages are shown on the right ( n = 5). (C) The frequency of Foxp3 + CTLA4 + cells in CD3 + CD4 + T cells. The antibody of CTLA4 was cut in FMO control samples. The corresponding percentage is shown on the right ( n = 3-5). The bars represent the mean +- SEM. * p < 0.05. cLP, colonic lamina propria.
- Conjugate
- Biotin
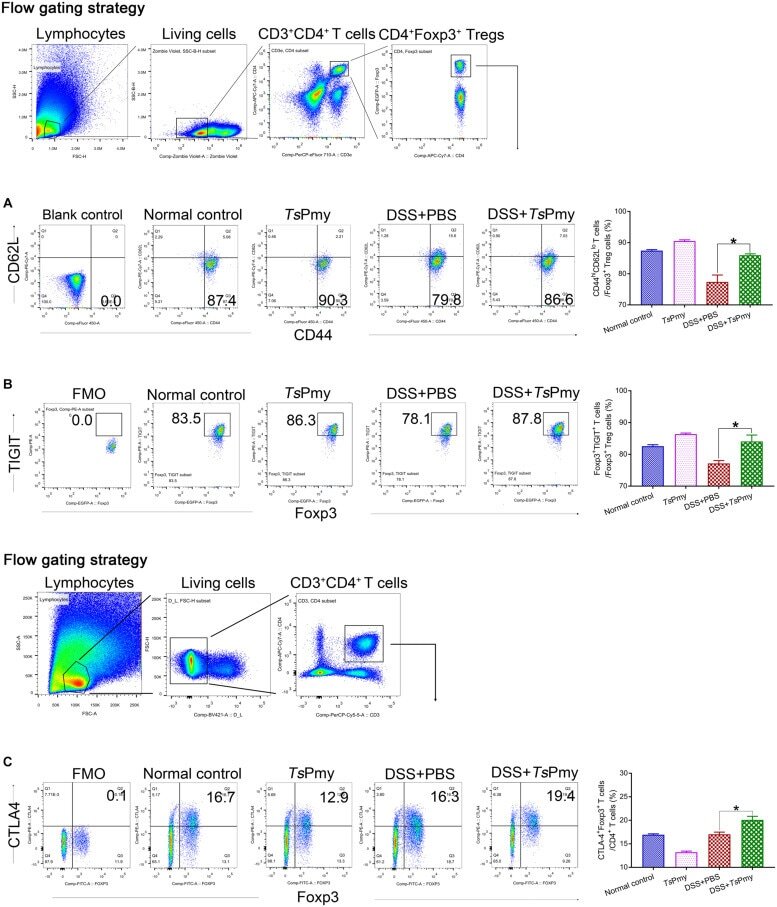
- Submitted by
- Invitrogen Antibodies (provider)
- Main image
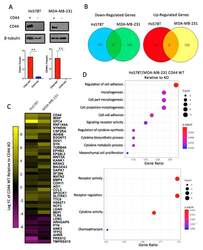
- Experimental details
- Figure 3 CD44 deletion in breast cancer cell lines decreases expression of genes involved in cellular adhesion and cytokine activity. ( A ) CD44 KO was confirmed via Western blot and compared to the loading control beta-tubulin via densitometry. CD44 KO indicates that cells received gRNA targeting exons 1 and 5 of CD44. CD44 WT (CD29+/CD44+) and CD44 KO (CD29+/CD44-) cells were sorted and expanded in culture. ( B ) Venn diagram illustrating RNA sequencing results (submitted in triplicate). A total of 1530 and 320 genes were impacted by CD44 KO in the Hs578T cells and MDA-MB-231 cells, respectively. When comparing each of these data sets, 40 genes were differentially expressed in both Hs578T and MDA-MB-231 cells upon deletion of CD44. ( C ) Heat map demonstrating log fold change of differential gene expression in CD44 WT relative to CD44 KO Hs578T and MDA-MB-231 cells. ( D ) Gene ontology analysis identifying gene sets enriched in CD44 WT relative to CD44 KO Hs578T and MDA-MB-231 cells. Dot size represents the number of genes enriched within that pathway, while color represents an adjusted p -value.
- Conjugate
- Biotin
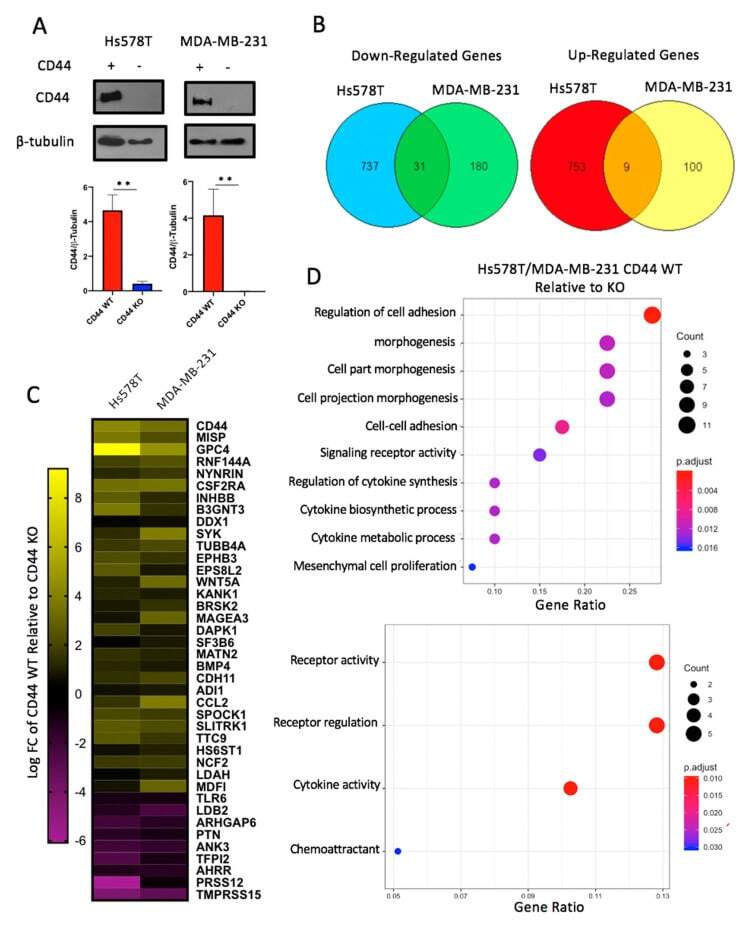
- Submitted by
- Invitrogen Antibodies (provider)
- Main image
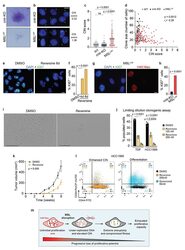
- Experimental details
- Figure 6 Enhanced chromosomal instability induced by MSL disruption exhausts cancer cell proliferative capacity. a . Clonogenic assays comparing MSL LOF ( MSL3 -KO) and control TDF cells visualized by crystal violet staining. Scale bar: 1 mm. b . DNA FISH detecting the pericentromeric region of chromosome 12 in clonal populations grown for 14 d. Cells from distinct locations within the clones are juxtaposed. Scale bar: 10 mum. c-d . Quantification of CIN score ( c ) and relationship with clone size ( d ). N = 105, 96, 121 biologically independent clones collected from two experiments. Horizontal lines: median values. P-value from one-way ANOVA followed by Tukey's test ( c ) and two-sided Spearman correlation test (MSL LOF cells in d ). N.s. : non-significant (p-value > 0.99). R s : correlation coefficient for MSL LOF cells. e-h. Immunodetection of Ki67 ( e , g ) and quantification of non-proliferative Ki67-negative cells ( f , h ). N = 100, 102, 130, 1375, 1300 independent cells for DMSO, 4d and 6d reversine, cntr-KO and MSL LOF ( MSL3 -KO) cells collected from two experiments. MEXF-2090 cells are shown in g - h ; TDF and other PDX-derived cells showed similar results. P-value from two-tailed Fisher's exact test. Scale bar: 10 mum. i-j . Limiting dilution clonogenic assays. Phase contrast images of DMSO- and reversine-treated TDF cells 12 d after plating ( i ) and quantification of populated wells ( j ). The percentage of wells containing at least one clone larger than 20 cel
- Conjugate
- Biotin

- Submitted by
- Invitrogen Antibodies (provider)
- Main image
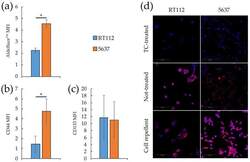
- Experimental details
- Figure 2 Stemness markers of monolayers and spheroids from RT112 and 5637 cells. ( a - c ) Median fluorescence intensity of Aldefluor TM ( a ), CD44 ( b ) and CD133 ( c ) by flow cytometry analysis on RT112 and 5637 cells grown as monolayers. Results are the mean of two ( a ) and three ( b , c ) experimental replicates. Statistical test: t -test, * for p < 0.05. ( d ) Representative images from confocal immunofluorescence (IF) microscopy of RT112 and 5637 cells using SOX2 Antibody (red) and Hoechst 33342 (blue) for nuclei. Cells were grown as monolayer or spheroids on different (Tissue culture-treated, Not-treated or Cell repellent) supports, before being seeded in adherent condition on chamber slides for IF.
- Conjugate
- Biotin

- Submitted by
- Invitrogen Antibodies (provider)
- Main image

- Experimental details
- Figure 2 The proportion of CD8 + effector memory T (Tem) cells and levels of IFN-gamma, mTOR and S6K in CD8 + Tem cells were significantly increased by IL-12 stimulation but significantly decreased by rapamycin treatment. The peripheral blood mononuclear cells obtained from the cyclophosphamide plus invasive pulmonary aspergillosis (CTX + IPA) mice, CTX + IPA mice treated with IL-12 (CTX + IPA+IL-12) or rapamycin (CTX + IPA+RAPA), and control animals were assessed using flow cytometry seven days after A . fumigatus infection. The side scatter (SSC) and CD8a were applied to gate on CD8 + T lymphocytes, CD44 + CD45 + CD62 +/- were considered to represent the Tem cells. Representative dot plots are shown, and the percentages of Tem cells and of Tem cells expressing IFNgamma, mTOR, and S6K are expressed as the mean +- S.D. * p < 0.05; ** p < 0.01; *** p < 0.001.
- Conjugate
- Biotin
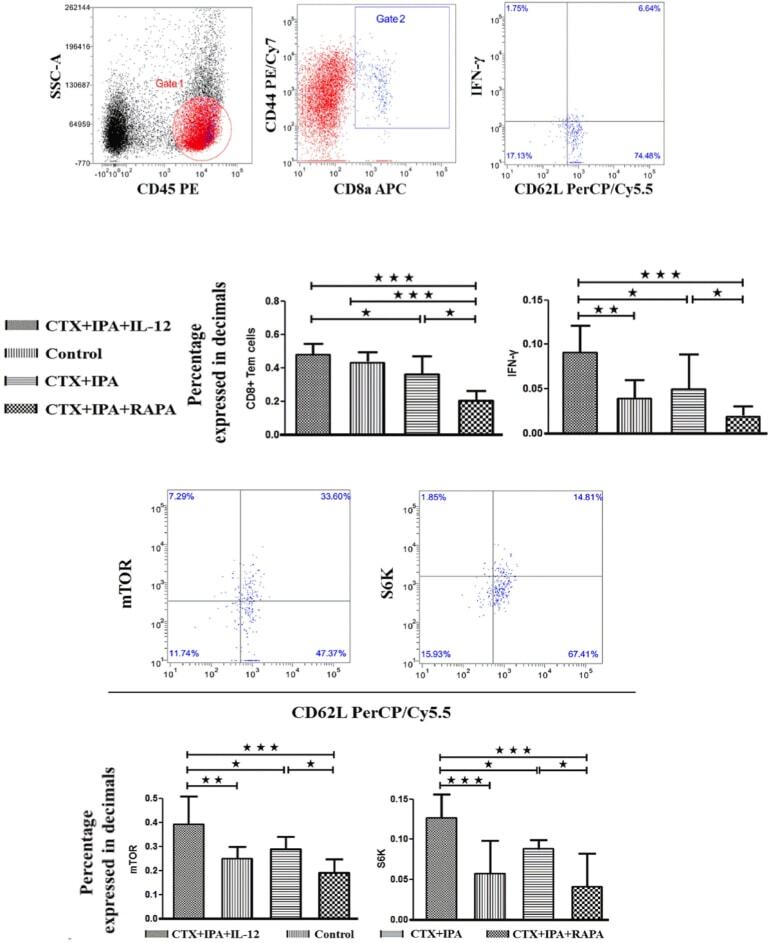
- Submitted by
- Invitrogen Antibodies (provider)
- Main image
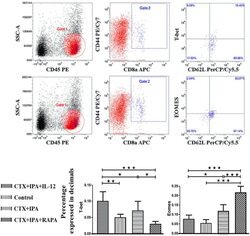
- Experimental details
- Figure 3 IL-12 significantly increased the expression of T-bet but significantly decreased the expression of Eomesodermin in CD8 + effector memory T (Tem) cells, which was blocked by rapamycin treatment. The peripheral blood mononuclear cells obtained from the cyclophosphamide plus invasive pulmonary aspergillosis (CTX + IPA) mice, CTX + IPA mice treated with IL-12(CTX + IPA+IL-12) or rapamycin (CTX + IPA+RAPA), and control animals were assessed using flow cytometry seven days after A . fumigatus infection. The side scatter (SSC) and CD8a were applied to gate on CD8 + T lymphocytes, CD44 + CD45 + CD62 +/- were considered to represent the Tem cells. Representative dot plots are shown, and the percentages of Tem cells and of Tem cells expressing T-bet and Eomesodermin are expressed as the mean +- S.D. * p < 0.05; ** p < 0.01; *** p < 0.001.
- Conjugate
- Biotin
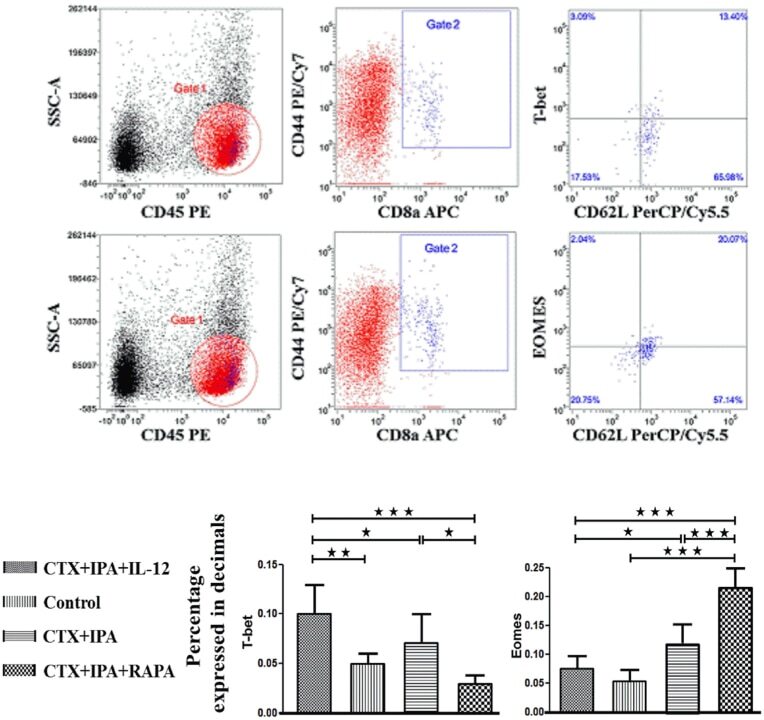
- Submitted by
- Invitrogen Antibodies (provider)
- Main image

- Experimental details
- 10.1371/journal.pone.0247990.g003 Fig 3 Enhanced protection against Mtb HN878 in CB6F1 mice with liposomal formulations. (A) Increased polyfunctional ID93-specific CD4+CD44+ T cells from the spleens of immunized CB6F1 mice four weeks after the final immunization. The data are represented as the percentage of CD4+CD44+CD154+ T cells producing one or more cytokines following ex-vivo stimulation with ID93; cytokine producing subsets are shown as stacked bars, with mean + SD of each subset. Comparisons of total cytokine producing cells between groups were performed using one-way ANOVA with Bonferroni's multiple comparison test. Down-inflected lines indicate * p
- Conjugate
- Biotin
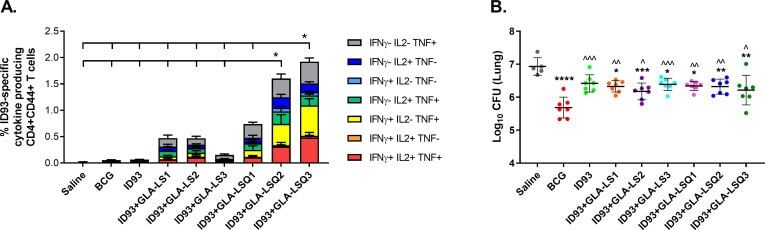
- Submitted by
- Invitrogen Antibodies (provider)
- Main image
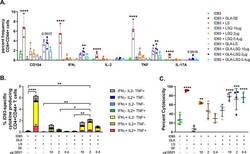
- Experimental details
- 10.1371/journal.pone.0247990.g004 Fig 4 Immunogenicity of C57BL/6 mice four weeks after the final immunization with ID93+GLA-LSQ. Mice were immunized with ID93 combined with GLA-LS containing different QS-21 doses (10, 2 or 0.4 mug). (A) The percent frequency of single-cytokine producing ID93-specific CD4+ T cells. Bars represent the mean of the group, with vertical lines indicating SD. Groups were compared for each cytokine using one-way ANOVA with Bonferroni's multiple comparison test, with * p
- Conjugate
- Biotin
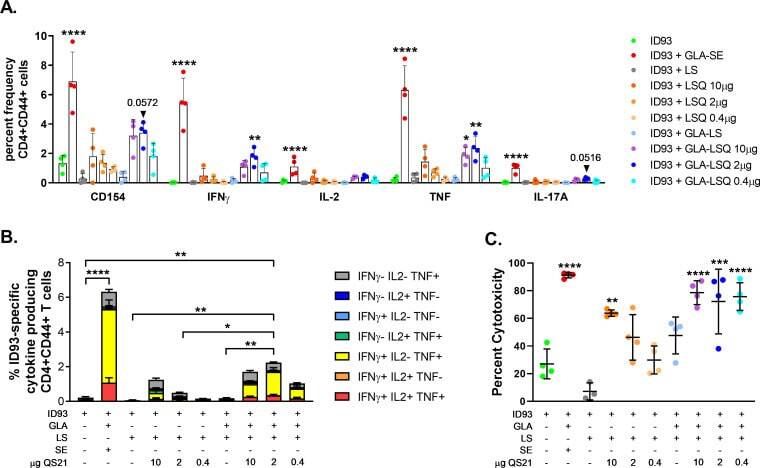
- Submitted by
- Invitrogen Antibodies (provider)
- Main image
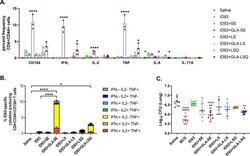
- Experimental details
- 10.1371/journal.pone.0247990.g006 Fig 6 Prophylactic protection with ID93+GLA-SE and ID93+GLA-LSQ in C57BL/6 mice. Mice were immunized with ID93 combined with different adjuvant formulations including SE, LS (liposomes), LSQ (liposomes+QS21), GLA-LS, GLA-LSQ, or GLA-SE. (A) The percent frequency of single-cytokine producing ID93-specific CD4+CD44+ T cells. Bars represent the mean of the group, with vertical line indicating SD. Groups were compared for each cytokine using one-way ANOVA with Bonferroni's multiple comparison test, with * p
- Conjugate
- Biotin
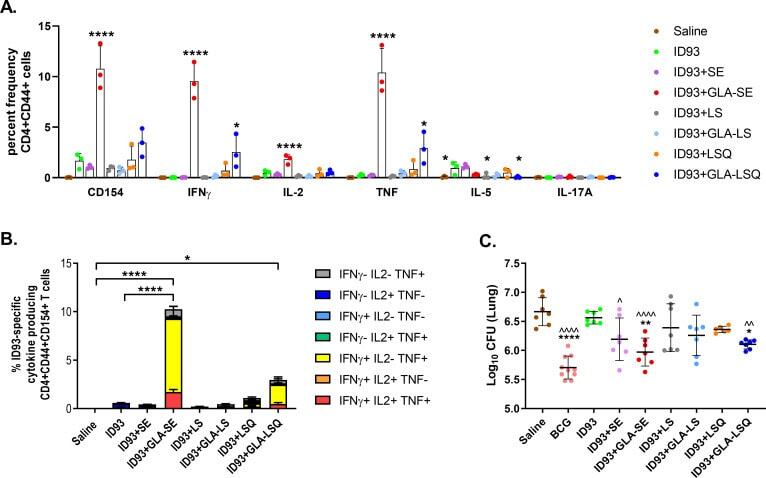
- Submitted by
- Invitrogen Antibodies (provider)
- Main image
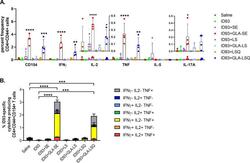
- Experimental details
- 10.1371/journal.pone.0247990.g007 Fig 7 Enhanced TH1 immune responses following infection with Mtb H37Rv within the lungs of C57BL/6 mice immunized with ID93+GLA-SE and ID93+GLA-LSQ. Mice were immunized with ID93 combined with different adjuvant formulations including SE, LS (liposomes), LSQ (liposomes+QS21), GLA-LS, GLA-LSQ, or GLA-SE. Four weeks after the last immunization mice were challenged with a low dose aerosol of Mtb H37Rv. Three weeks after challenge mice were euthanized and lungs collected to assess the immune response. (A) The percent frequency of single-cytokine producing ID93-specific CD4+CD44+ T cells within the lung. Bars represent the mean of the group, with vertical line indicating SD. Groups were compared using one-way ANOVA with Bonferroni's multiple comparison test, * p
- Conjugate
- Biotin
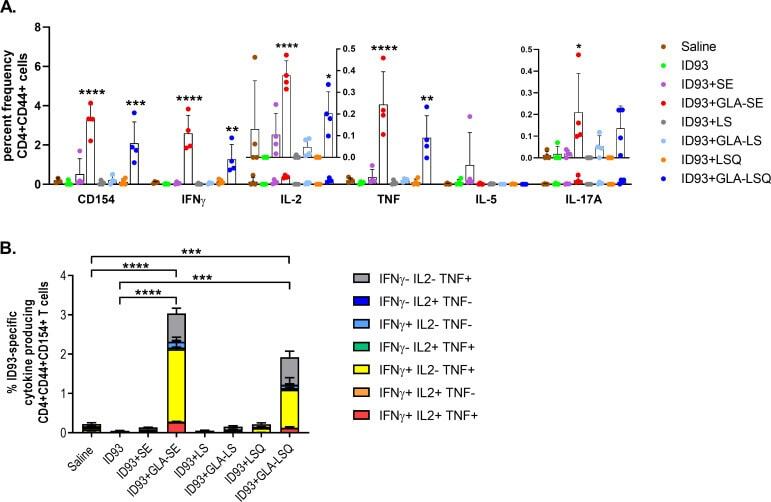
- Submitted by
- Invitrogen Antibodies (provider)
- Main image
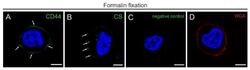
- Experimental details
- Figure 1 Morphology and antigenicity of the cell surface in THP-1 cells after formalin fixation. ( A , B ) CSLM images showing immunofluorescence single labeling for GCX markers: ( A ) CD44 (green pseudocolor) and ( B ) CS (green pseudocolor) with ( C ) the corresponding negative control with omitted primary antibody. Note the CD44-labeling and scattered clusters of CS close to the plasma membrane (arrows). ( D ) WGA staining (red pseudocolor). ( A - D ) DAPI fluorescence stains for nuclear DNA (blue pseudocolor) Scale bar: ( A - D ) 5 um.
- Conjugate
- Biotin
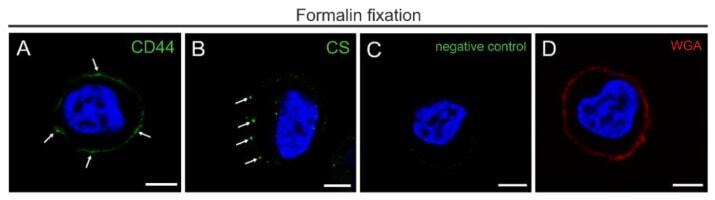
- Submitted by
- Invitrogen Antibodies (provider)
- Main image

- Experimental details
- Figure 2 Flowchart showing the workflow of the combined HPF/FS/rehydration and pre-embedding immunogold labeling method for TEM. Insert on the left side shows well-preserved intra- and pericellular ultrastructure of THP-1 cells after processing for immuno-TEM. Note the dimension of the GCX. The dashed lines mark the border of the nucleus to cytoplasm and cytoplasm to GCX. Insert on the right shows a higher magnification of the GCX structures with immunogold labeling for CD44 (arrowheads). N, nucleus; C, cytoplasm; GCX, glycocalyx. Scale bar: 1000 nm.
- Conjugate
- Biotin
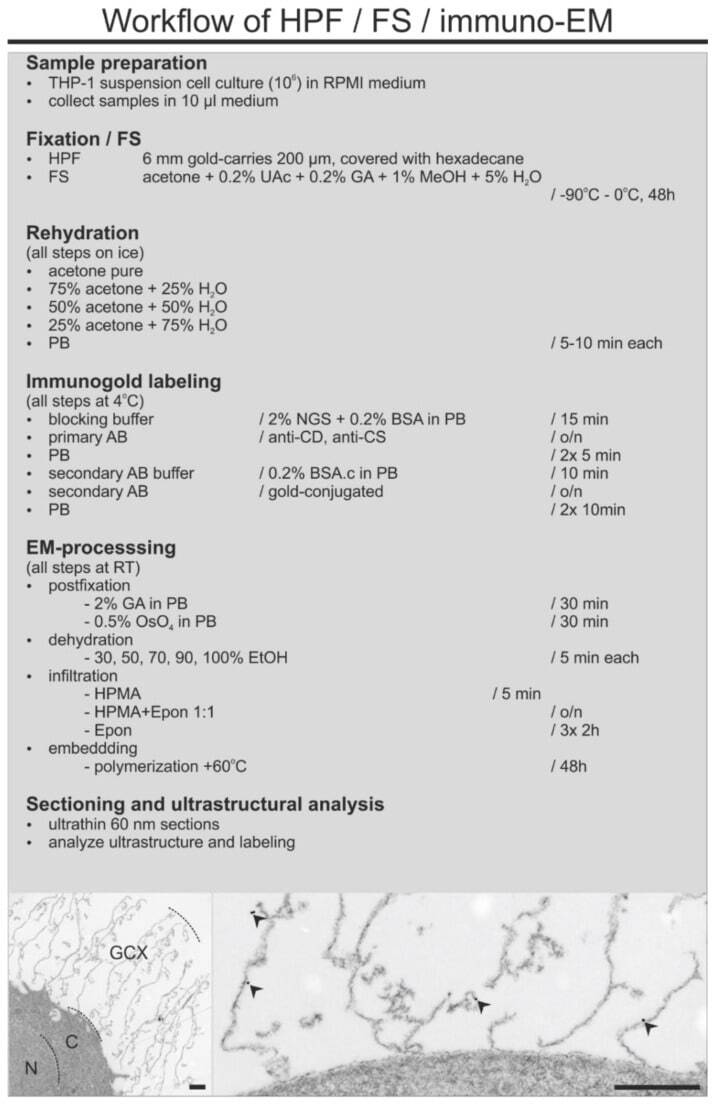
- Submitted by
- Invitrogen Antibodies (provider)
- Main image
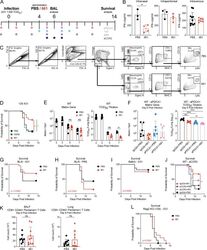
- Experimental details
- Figure S2. Mechanism of action of IRS661. (A) Schematic representation of the experimental setup. Mice were infected intranasally with 1,000 TCID 50 of influenza virus X31 and treated with IRS661 or PBS intranasally (15 nmol in 30 ul) on day 4 after infection. Usually, BALF was isolated on day 6 after infection. Colored dots mark days when mice were treated with alphaPDCA-1 (200-500 ug), 1A8 (150-300 ug), alphaSiglec-H (200-500 ug), or alphaCCR2 (20 ug) depletion antibody i.p. (B) WT 129S7 mice were infected with X31 and treated with IRS661 or PBS intranasally (15 nmol in 30 ul), i.p. (50 nmol in 100 ul), or intravenously (50 nmol in 100 ul) 4 d later. IFN-alpha concentrations were quantified by ELISA in BALF taken on day 5 after infection. n = 3-11 mice per group. (C) Flow cytometry plots representing the gating strategy for cell analysis in Fig. 2 B . Lineage channel includes CD3, CD19, and NKp46. FSC, forward scatter; SSC, side scatter. (D) WT 129S7 mice were infected with 1,000 TCID 50 X31 and treated with IRS661, control ODN 2, or PBS intranasally. Survival was monitored for 14 d. n = 17-18 mice per group. (E and F) Viral loads in lungs of X31-infected mice treated with IRS661 or PBS (E; n = 3-7 mice per group) and/or aPDCA-1 antibody (F; n = 6-7 mice per group) were determined by RT-qPCR or TCID 50 assay at days 2, 3, 5, and 7 (E) or day 6 (F) after infection. (G) WT C57BL/6 mice were infected with 10,000 TCID 50 X31 and treated with IRS661 or PBS intranasally. Survival
- Conjugate
- Biotin
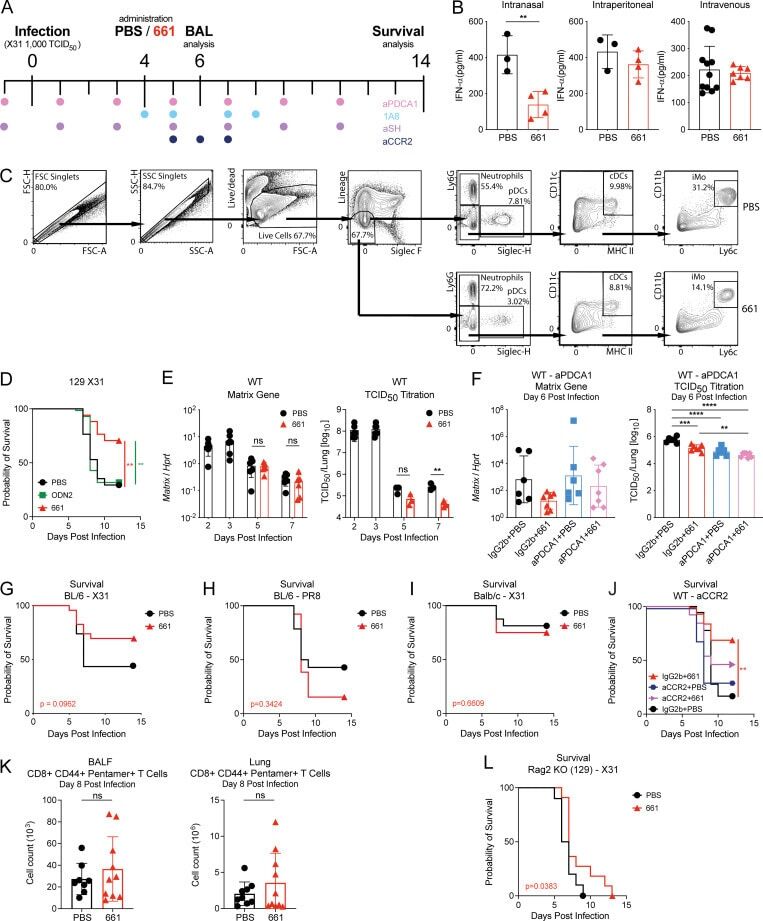
- Submitted by
- Invitrogen Antibodies (provider)
- Main image
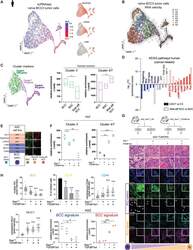
- Experimental details
- Figure 2. Modulation of epithelial TGF-beta and/or Ras/MAPK signaling in BCC-RM pos clones drive BST (A) scRNA-seq projection plots of tumor cells obtained from a nBCC analyzed for SCC (red) versus BCC (blue) enrichment score (left panel) and corresponding BCC-RM TACSTD2 , LYPD3 , and LY6D expression (right panels). scRNA-seq projection plots of tumor cells obtained from an additional nBCC sample are shown in Figure S2A . (B) RNA velocity analysis on tumor cells obtained from the nBCC shown in (A). Note the bidirectional nature of the BCC cluster C3 and SCC clusters C4 and C7. Main directionalities are emphasized using magnified red arrows. (C) Relative enrichment of the top-enriched gene lists obtained from clusters 3, 4, and 7 in human BCC (blue, n = 6), BSC (green, n = 3) and well-differentiated SCC (orange, n = 3) bulk RNA-seq. Left panel shows, at higher magnification, the scRNA-seq projection plot of clusters 3, 7, and 4 obtained from the nBCC shown in (A) and (B). Boxes represent the mean and the distribution of values from minimum to maximum. Markers associated with the indicated clusters are listed in Table S2 . (D) GSEA for cancer-related canonical pathways in clusters 4 and 7 compared to cluster 3 (full bars) and human well-differentiated SCCs compared to BCCs (empty bars). Blue and red bars indicate consistently reduced or enriched pathways, respectively. (E) TACSTD2, LYPD3, LY6D, GLI1, CD44, and MUC1 protein expression indicated by immunofluorescence staining on
- Conjugate
- Biotin

- Submitted by
- Invitrogen Antibodies (provider)
- Main image
- Experimental details
- Figure 4. The AP-1 family member c-FOS drives BST (A) H&E, GLI1, ARL13B (for primary cilia), CD44, and MUC1 staining of ASZ xenografted tumors upon c-FOS induction. (B) Quantification of GLI1, CD44, and MUC1 protein expression in (A) by pixel intensity measurements (n >= 40 cells, measured in n >= 3 fields, across n >= 3 tumors for each condition). Quantification of primary cilia (ARL13B) in (A) by the percentage of ciliated tumor cells (measured in n >= 6 fields, across n >= 3 tumors for each condition). (C) Schematic representation of in vivo intratumoral adenoviral-based induction of c-FOS using Ptch +/- ;K14-Cre-ER;p53 fl/fl ;RFP fl/STOP/fl mice. Lower panels show H&E, GFP, GLI1, and CD44 staining of BCC tumors upon vehicle, AAV6_GFP, or AAV6_GFP_cFos injection. Infection rate was determined as shown in Figures S4F , S4G , and S4I . (D) Quantification of SCC-like foci density shown in (C) (number of fields measured - n >= 10, across n = 2 tumors for each condition). (E) Quantification of GLI1 and CD44 protein expression shown in (C) by pixel intensity measurements (n >= 40 cells, measured in n >= 3 fields, across n = 2 tumors for each condition). (F) Relative enrichment for BCC signature (blue) and SCC signature (red) in RNA-seq data obtained from ASZ upon c-FOS induction (n = 2 biological replicates). RNA-seq profile and GSEA plots are shown in Figures S4K and S4L . (G) Enrichment of TF motifs in the regions with decreased (left) or increased (right) chromatin accessibil
- Conjugate
- Biotin
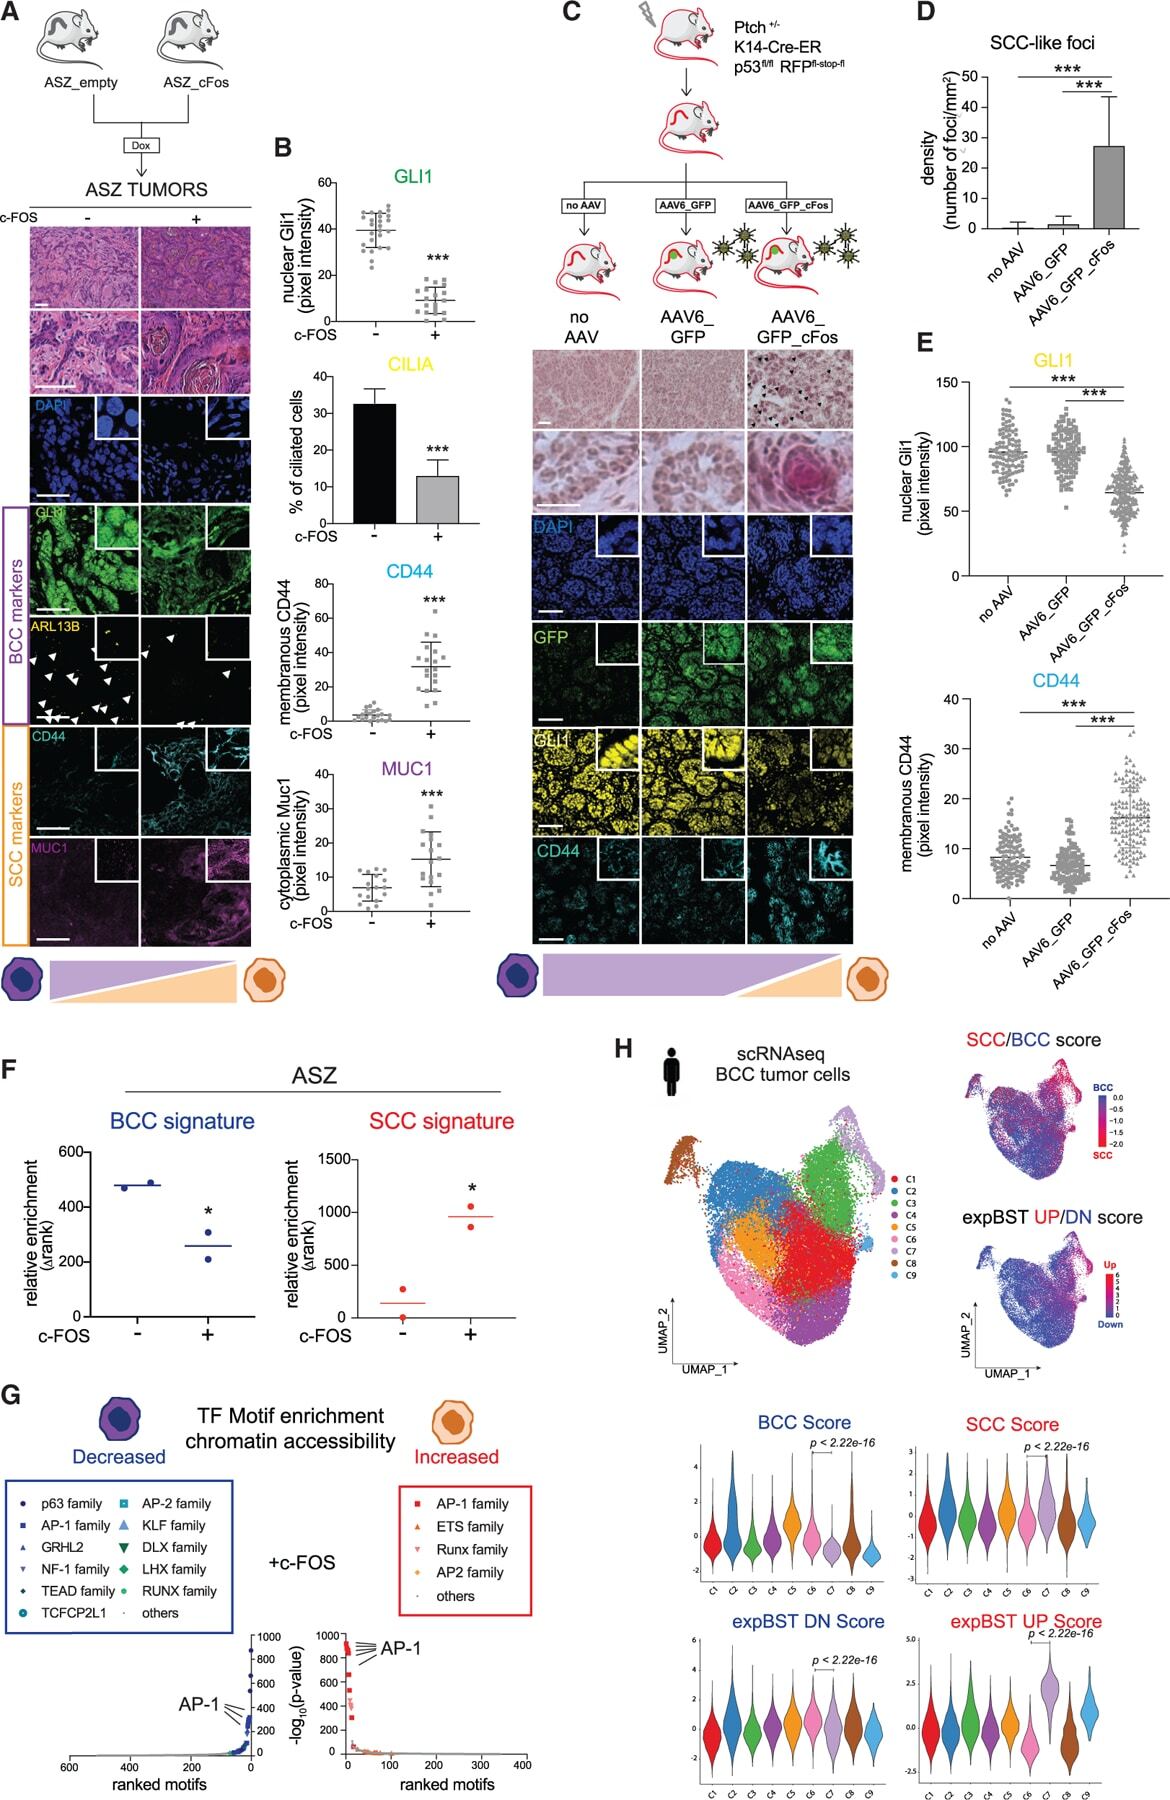
- Submitted by
- Invitrogen Antibodies (provider)
- Main image
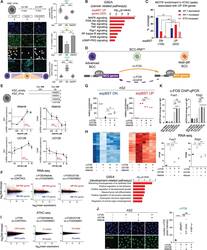
- Experimental details
- Figure 5. EGFR/Ras/MAPK inhibitors partially reverse the transcriptional reprogramming of c-FOS-mediated BST (A) DAPI, GLI1, ARL13B (for primary cilia), and CD44 staining of ASZ cells upon 6 days of c-FOS induction (Dox ON), followed by 6 days of c-FOS removal (Dox ON/OFF). The right panels show the quantification of GLI1 and CD44 protein expression by pixel intensity measurements (n >= 40 cells, measured in n >= 3 fields for each condition) and primary cilia (ARL13B) by the percentage of ciliated tumor cells (measured in n >= 6 fields for each condition). (B) Toplist of cancer-related pathways or biological processes identified using GSEA in expBST UP signature. The x axis is -log 10 (p value) of the enrichment score. (C) Proportion (%) of genes having at least one ATAC peak enriched for the AP-1 or ETS motif, with decreased or increased accessibility in the proximity. p values calculated using proportional Z test. **p < 0.01. (D) Schematic depicting the c-FOS-driven BST model. (E) Dose-response curves of Gli1 and Cd44 expression in c-FOS-induced BST upon afatinib or UO126 treatment (n >= 4 biological replicates). EC 50 (half maximal effective concentrations) are indicated in red dotted lines. The upper panel depicts the experimental design. (F) Scatterplot of genes with differential expression upon c-FOS induction and afatinib or UO126 treatment (n = 2 biological replicates). Genes with expression fold change >= 1.5 and p < 0.05 are marked in red, while genes with expressio
- Conjugate
- Biotin
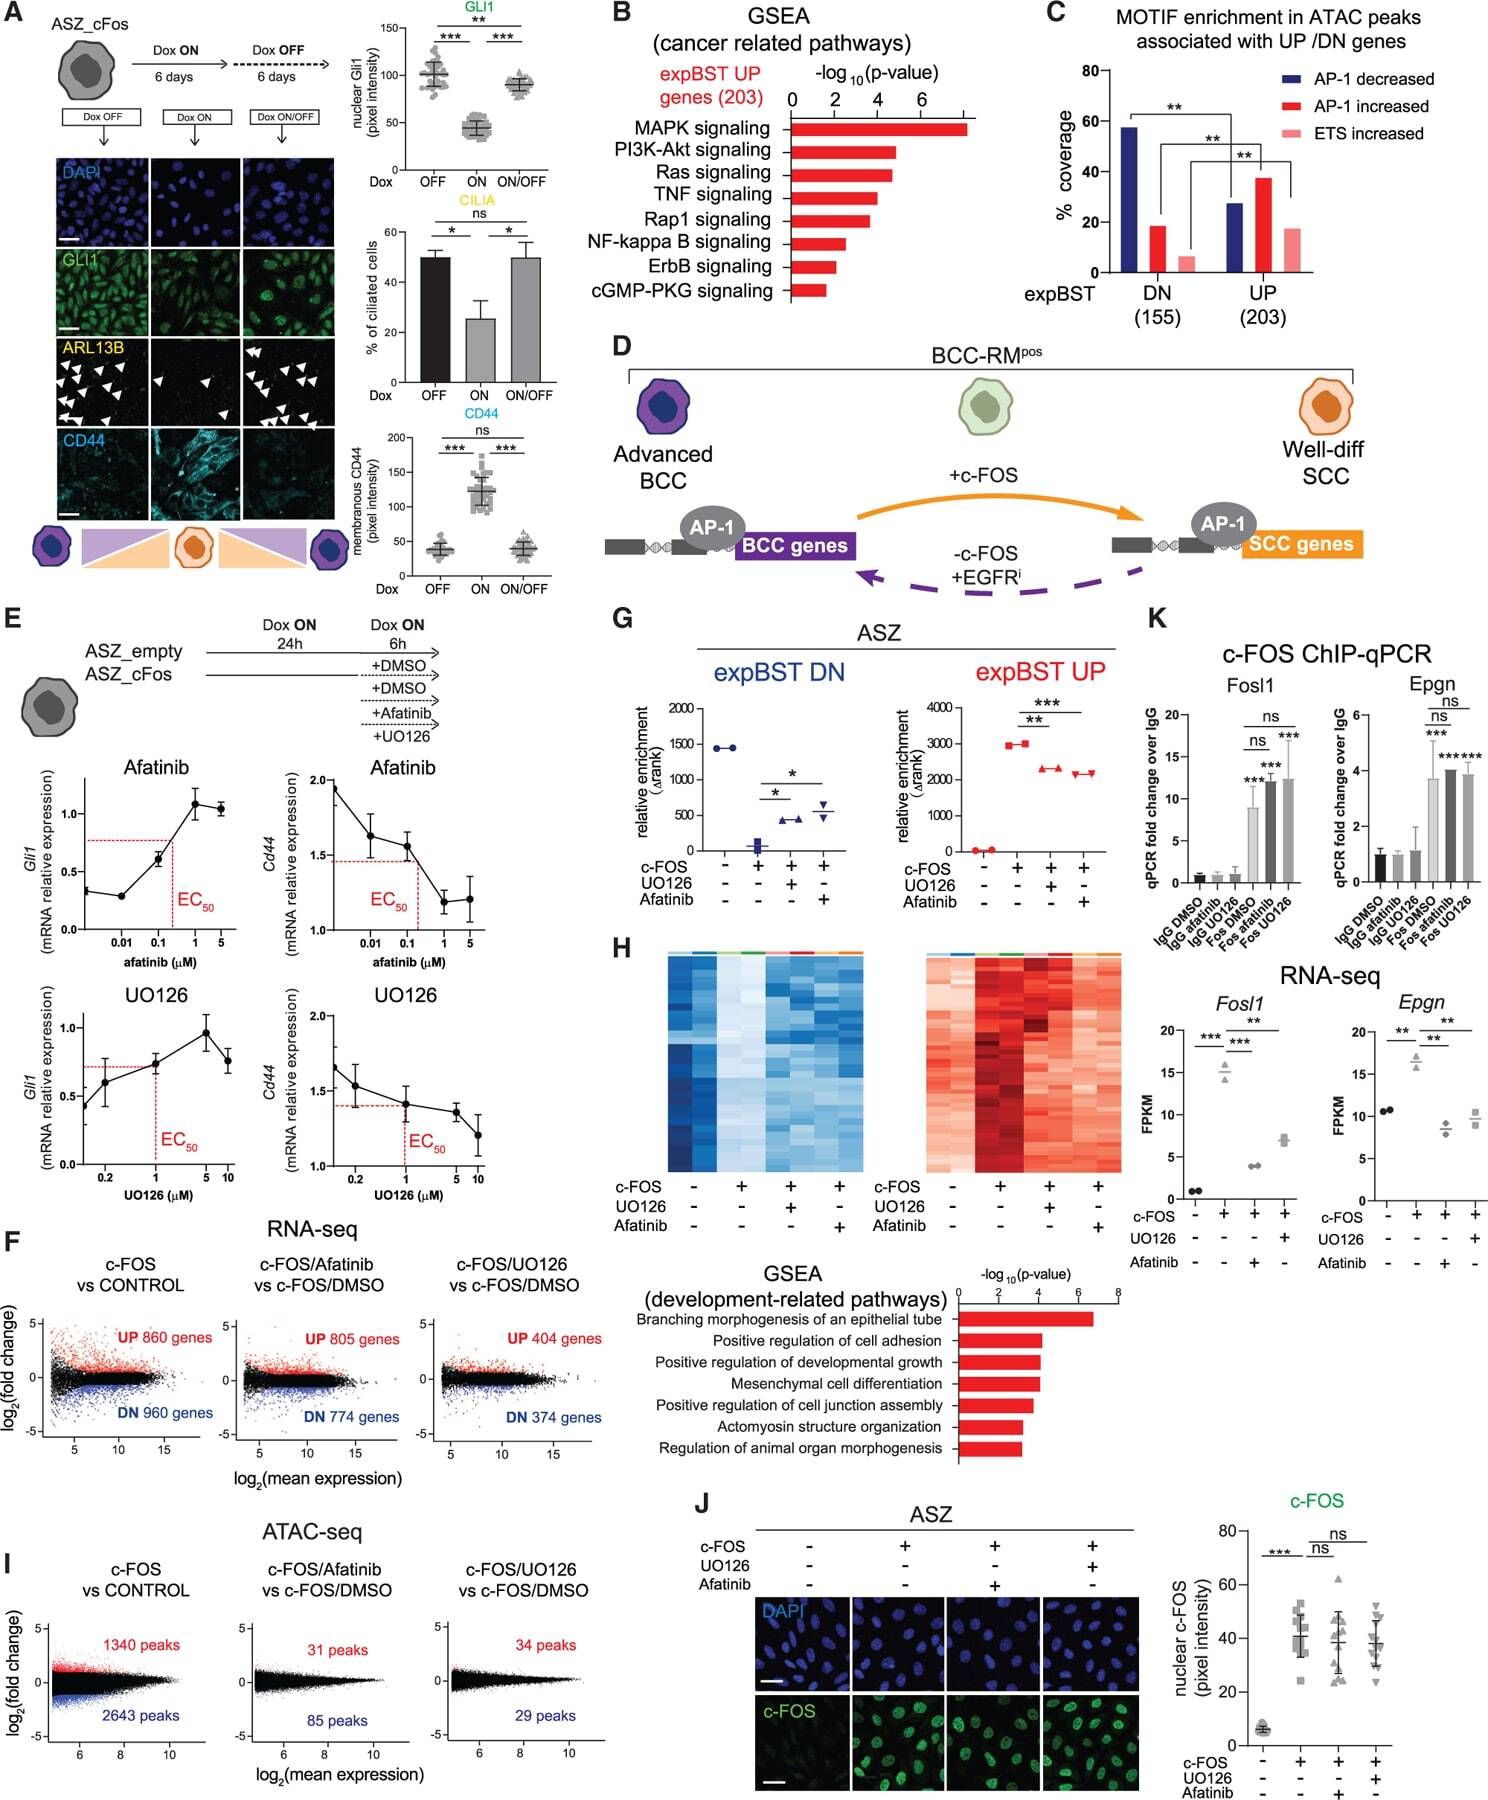
- Submitted by
- Invitrogen Antibodies (provider)
- Main image

- Experimental details
- Figure 6. Targeting EGFR/Ras/MAPK signaling pathway blocks BST (A) H&E, GLI1, ARL13B (for primary cilia), CD44, and MUC1 staining of ASZ xenografted tumors upon c-FOS induction and treatment with afatinib. (B) Quantification of GLI1, CD44, and MUC1 protein expression shown in (A) by pixel intensity measurements (n >= 40 cells, measured in n >= 3 fields, across n >= 3 tumors for each condition). Quantification of primary cilia (ARL13B) shown in (A) by the percentage of ciliated tumor cells (number of fields measured: n >= 6, across n >= 3 tumors for each condition). Horizontal bars and error bars represent the mean +- SD. p values calculated using one-way ANOVA with Tukey's post-test. ns, non-significant. *p < 0.05, ***p < 0.001. (C) GLI1 and CD44 expression fold change upon afatinib compared to DMSO treatment in human tumor explant (lower panels) and related to histopathological diagnosis (BCCs in blue, n = 6; BSCs in green, n = 6; and well-differentiated SCCs in orange, n = 4) and nuclear c-FOS expression (number of fields measured: n >= 2 per tumor). Upper panels show representative H&E, DAPI, and c-FOS staining of the human tumor explants used for the experiment. qRT-PCR error bars represent the SD from two technical replicates per sample. Immunofluorescence error bars represent the SD from individual measurements across one tumor sample. p values calculated using unpaired two-sided Student's t test. ns, non-significant. *p < 0.05. Scale bars in (A) and (C): 100 mum.
- Conjugate
- Biotin
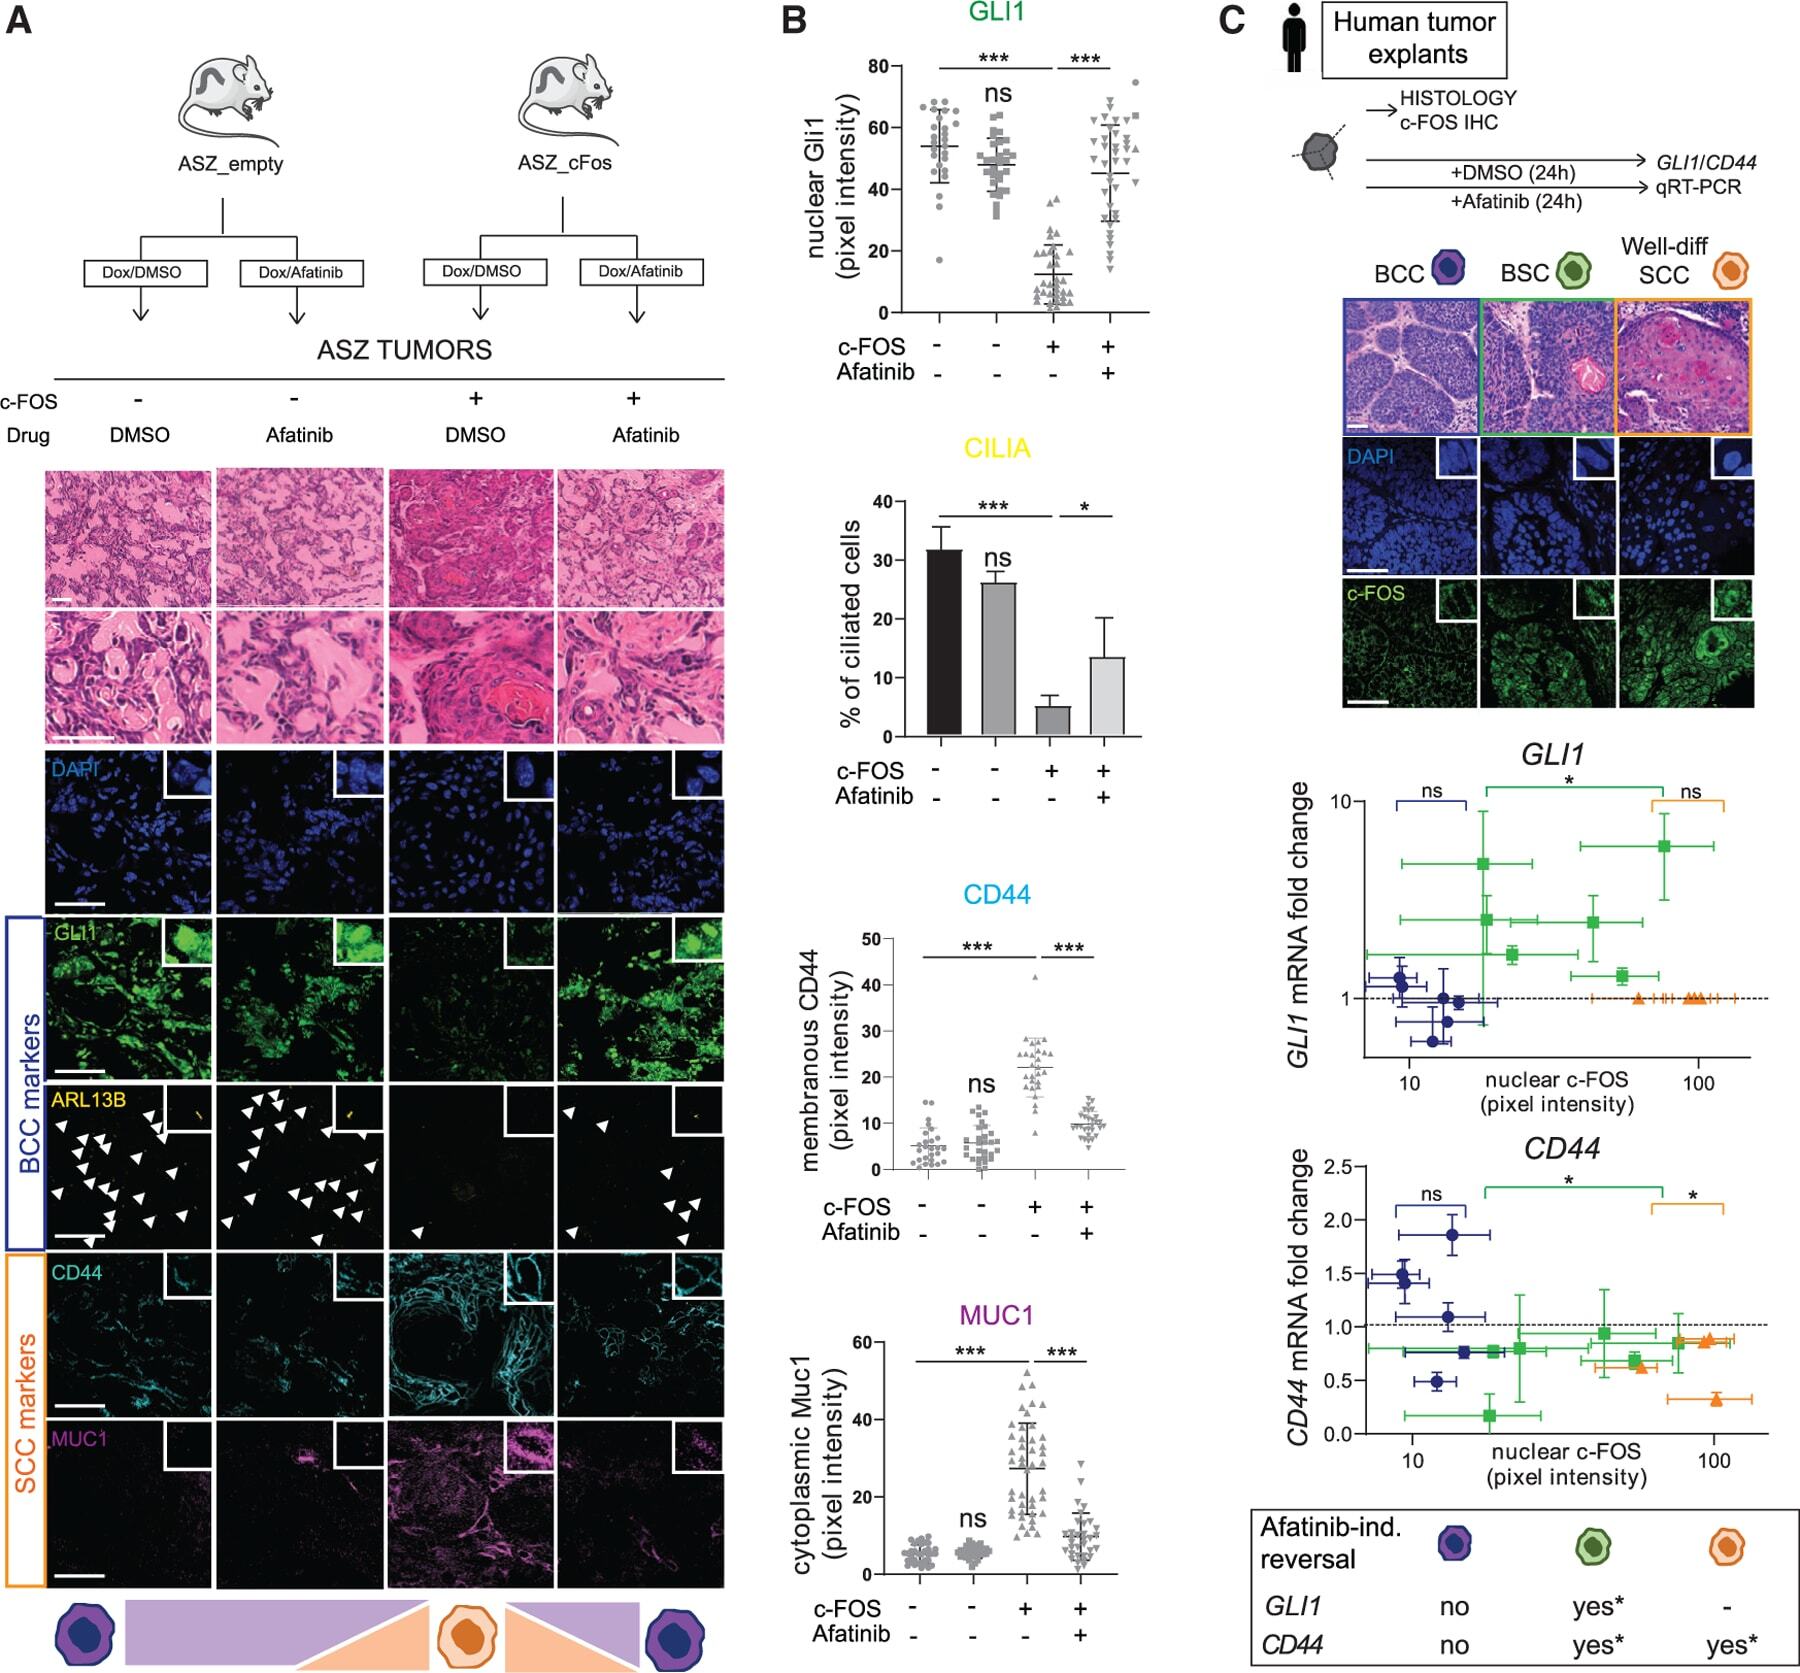
- Submitted by
- Invitrogen Antibodies (provider)
- Main image

- Experimental details
- Fig. 5 QD-Cat-RGD-based RT for promoting DC maturation and antigen presentation in TDLNs and consequently inducing T cell-driven antitumor immunity. a Representative flow cytometric analysis images and relative quantification of co-stimulatory molecules CD80 + CD86 + gating on CD45 + CD11c + cells in TDLNs. b Representative flow cytometric analysis images and relative quantification of MHC-II expression on CD11c + CD45 + cells in the TDLNs. c Representative flow cytometric analysis images and relative quantification of CD3 + T cells gating on CD45 + in tumors. d Representative immunofluorescence images of tumors showing CD8 + T cells and relative quantification of CD8 + CD3 + T cells gating on CD45 + cells in tumors by flow cytometry. Scale bars = 50 mum. The immunofluorescent images were representative of those generated from three mice each group. e Representative flow cytometric analysis images and relative quantification of CD44 + CD62L + Tcm cells gating on CD8 + CD3 + CD45 + cells in the TDLNs. All data are presented as the mean +- s.e.m. ( n = 5 per group) and n represents the number of independent animals. Statistical significance was calculated via one-way ANOVA with Tukey's multiple comparisons test. FMO fluorescence-minus-one. TDLN tumor-draining lymph node. Source data are provided as a Source Data file.
- Conjugate
- Biotin
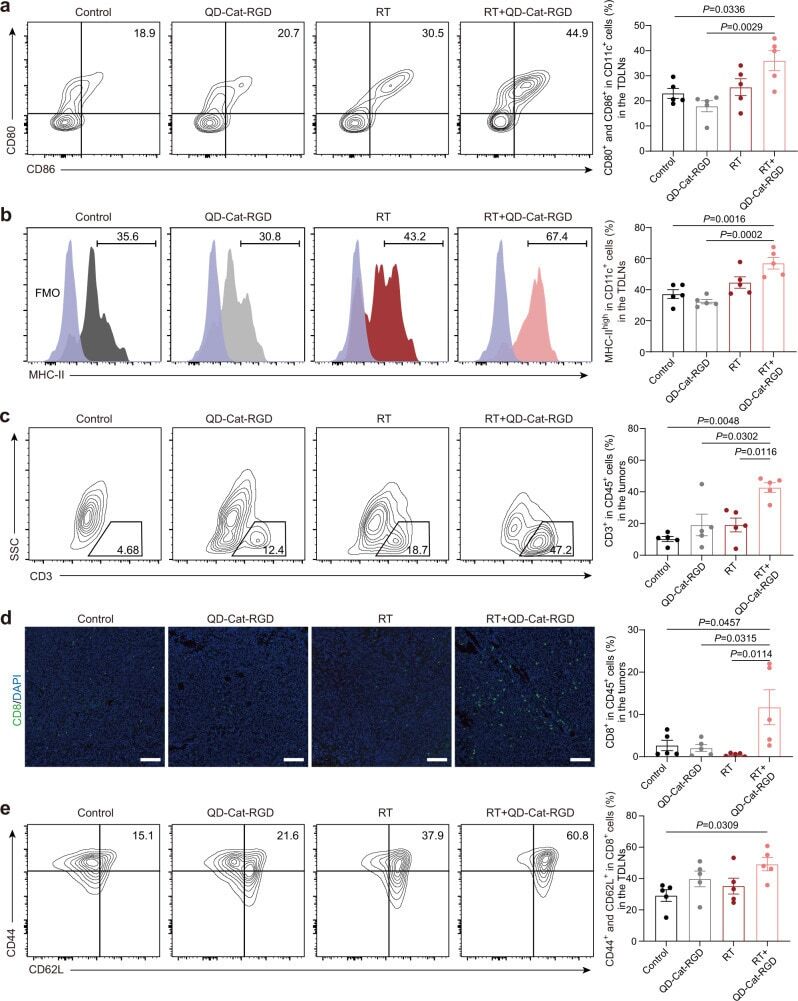
- Submitted by
- Invitrogen Antibodies (provider)
- Main image
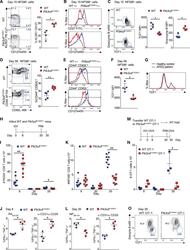
- Experimental details
- Figure 3. Pik3cd E1020K/+ mice fail to develop a robust T CM population (A-F) Viable CD8 + splenocytes from mice infected with LCMV Armstrong (n = 2, 4-5/group/time point). (A-C) NP396-specific CD8 + cells day 15 p.i. (A) CD127 and KLRG1 expression (left: representative staining; right: %KLRG1 + CD127 - ). (B) Representative histogram of CD27 (top) and CD127 (bottom). (C) GzmB and TCF1 staining. Middle: TCF1 MFI; right: GzmB MFI. (D-F) NP396-specific CD8 + cells day 58 p.i. (D) CD44 and CD62L staining. Representative flow (left), % CD44 hi CD62L lo cells (right). (E) CD127 histograms: CD44 hi CD62L lo (top) and CD44 hi CD62L + (bottom). (F) TCF1 MFI. (G) TCF1 staining of allo-reactive CD8 + cells from healthy controls and patients with APDS (n = 2, representative histogram). (H-L) Mice were infected with X31 and challenged with PR8 (n = 2, 3-5 mice/genotype/time point). (H) Infection outline. (I) PA224-specific CD8 + cell numbers. (J) IFN-gamma and TNF-alpha from day 8 cells stimulated with either PA 224-233 (left) or anti-CD3 plus anti-CD28 (right). (K) NP366-specific CD8 + T cell numbers. (L) IFN-gamma and TNF-alpha from day 35 cells stimulated with either NP 366-374 (left) or anti-CD3 plus anti-CD28 (right). (M-O) OT-1 cells were transferred into congenic hosts, infected with influenza X31-OVA and challenged with PR8-OVA (n = 2, 3 mice/genotype/time point). (M) Outline. (N) Viable OT-1 cell numbers. (O) TCF1 and GzmB expression in OT-1 cells on day 35. Representative exper
- Conjugate
- Biotin
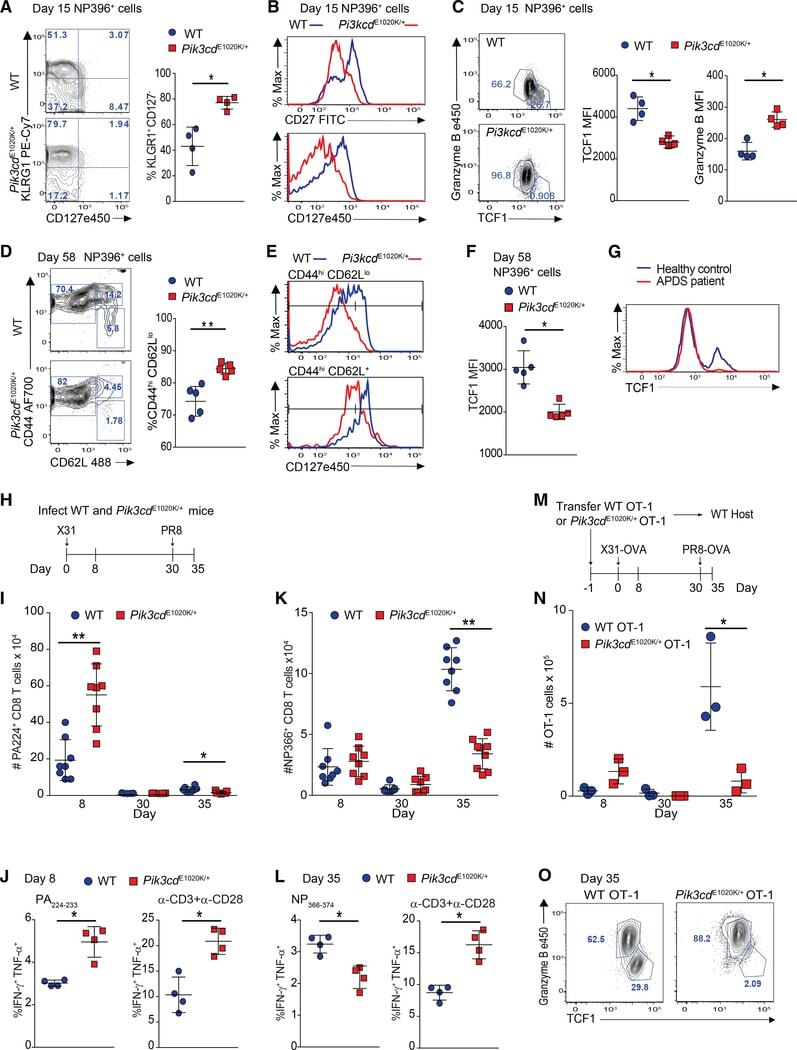
- Submitted by
- Invitrogen Antibodies (provider)
- Main image
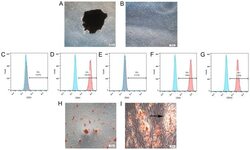
- Experimental details
- Figure 1. Identification and characteristics of hPDLSCs. Morphological characterization of hPDLSCs in (A) primary culture and (B) culture at passage 3. A periodontal membrane fragment is present and shown in A. Flow cytometry analysis of surface markers expressed on hPDLSCs, showing that they were positive for (D) 0CD44, (F) CD90 and (G) CD105, and negative for (C) CD34 and (E) CD45. (H) Following 3 weeks of culture in osteogenic induction medium, the cells were stained with alizarin red. Mineralized nodules are shown. (I) Following 3 weeks of culture in adipogenic induction medium, the cells were stained with Oil Red O. Lipid globules are shown (black arrow). hPDLSCs, human periodontal ligament stem cells; PE, phycoerythrin.
- Conjugate
- Biotin

- Submitted by
- Invitrogen Antibodies (provider)
- Main image
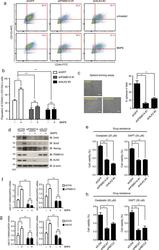
- Experimental details
- Fig. 6 PSMD14 depletion reduces BMP6-mediated colorectal cancer stemness. (a, b) FACS analysis of CD133 + /CD44 + cells in PSMD14 - or ALK2 -depleted HCT116 cells, which were treated with 100 ng/ml BMP6 for 48 h. The proportion of the CD133 + /CD44 + fraction was described with the density plots (a) and a bar graph (b) . shGFP-expressing HCT116 cells were used as a control. (c) Sphere forming assay of PSMD14 - or ALK2 - depleted HCT116 cells. Spheres with a diameter above 50 mum were counted and described in a bar graph. Scale bars, 50 mum. (d) PSMD14 - or ALK2 -depleted HCT116 cells were treated with BMP6. Expression of pluripotent transcription factors were analyzed by immunoblotting with the indicated antibodies. siCON-expressing HCT116 cells were used as a control. (e, h) 2 x 10 4 cells of PSMD14 -, ALK2 -, ABCA7 - or ABCC4 -depleted HCT116 were respectively treated with 20 muM oxaliplatin and 30 muM DAPT and their viabilities were measured at 6 h. shGFP-expressing HCT116 cells were used as a control. (f, g) PSMD14 - or ALK2 -depleted HCT116 cells were treated with BMP6 for 6 h. Expressions of ABCA7 and ABCC4 were measured by quantitative RT-PCR. The data were statistically analyzed by two-way ANOVA followed by Bonferroni's multiple comparison test ( n = 3, *** P < 0.001 compared to the indicated controls. ns; not significant). The bars represent the mean +- s .d. The images in this figure are representative of three independent experiments. In (b), (c), (e) and (h) were
- Conjugate
- Biotin
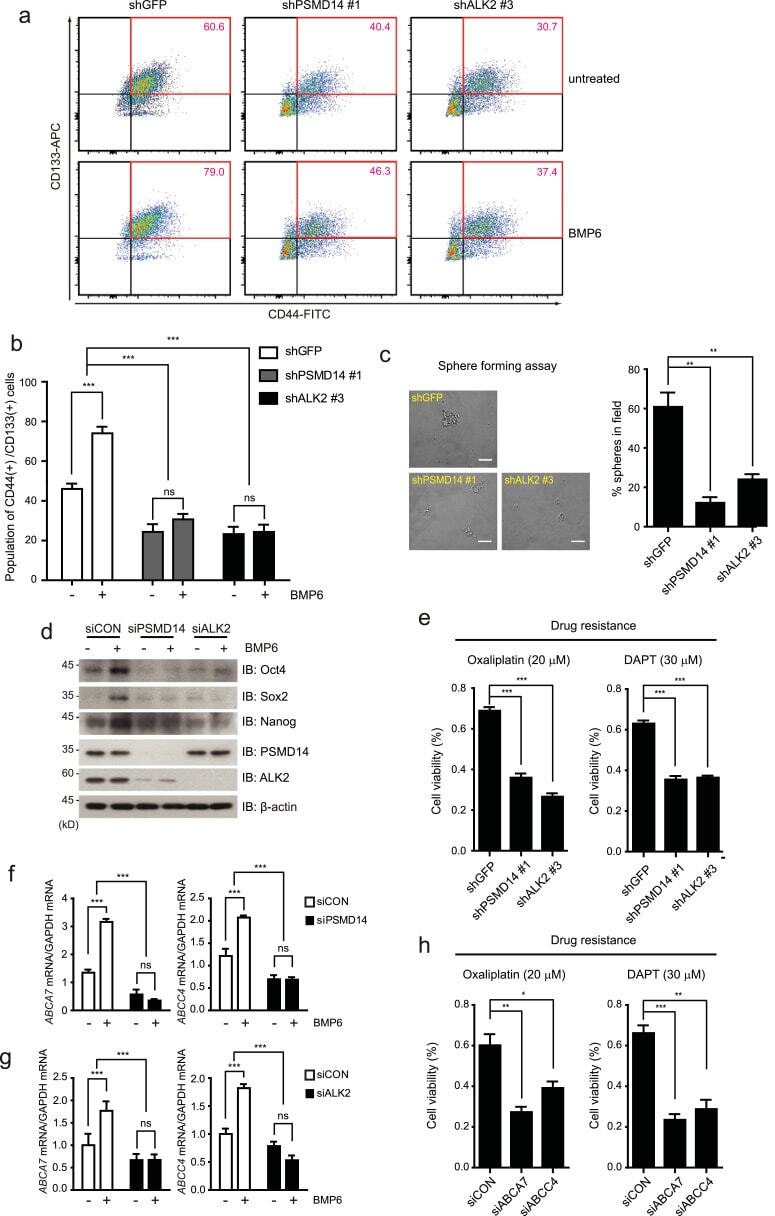
- Submitted by
- Invitrogen Antibodies (provider)
- Main image
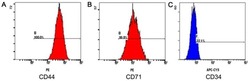
- Experimental details
- Figure 1. Immunophenotyping results of isolated and cultured bone marrow-derived mesenchymal stem cells. Surface markers by flow cytometry for (A) CD44, (B) CD71 and (C) CD34. CD, cluster of differentiation.
- Conjugate
- Biotin

- Submitted by
- Invitrogen Antibodies (provider)
- Main image
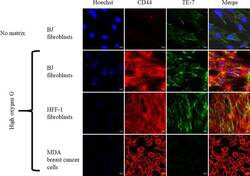
- Experimental details
- 10.1371/journal.pone.0232670.g005 Fig 5 Immunofluorescence staining of adhesion protein CD44 (red) and fibroblast marker TE-7 (green) of BJ cells on HOG film compared to no graphene (no matrix control). Cell nuclei were stained with Hoechst dye (blue). A positive staining for CD44 is an indication of cellular adherence to and movement on the HOG. Positive stain for TE-7 indicates fibroblast cells. HFF-1 fibroblasts were used as positive control for both CD44 and TE-7; MDA cancer cells was used as negative control for TE-7 on HOG. A more intense expression of CD44 was observed on HOG than on the control (with no graphene).
- Conjugate
- Biotin
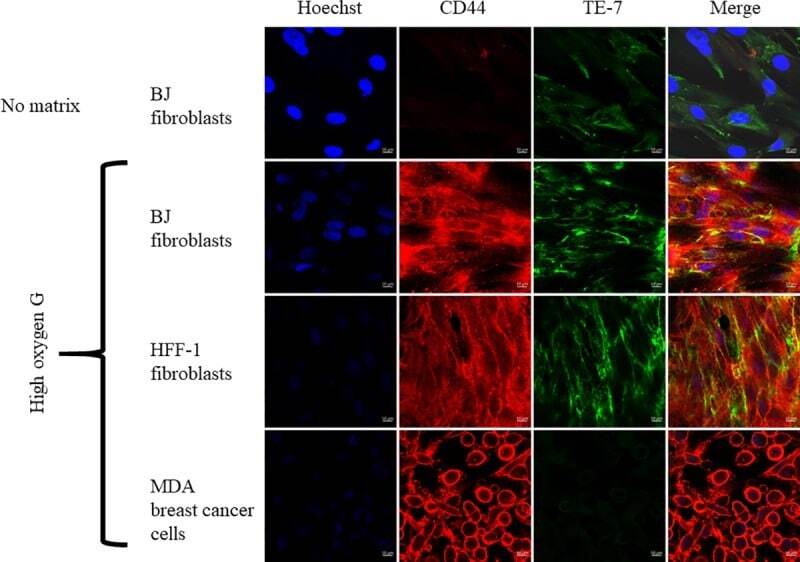
- Submitted by
- Invitrogen Antibodies (provider)
- Main image
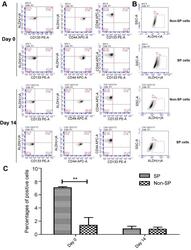
- Experimental details
- Figure 3. Expression of ALDH1, CD133 and CD44 prior to and following induction of differentiation in SP cells. SP or non-SP cells were incubated with anti-ALDH1, anti-CD133 and anti-CD44 antibodies together, and subjected to flow cytometry analysis. (A) Percentage of ALDH1 + , CD133 + or CD44 + cells in non-SP and SP cells prior to (day 0) and following differentiation (day 14). During flow cytometry analysis, Left, cells were analyzed for the expression of ALDH1 and CD133; Middle, cells were analyzed for the expression of ALDH1 and CD44; Right, cells were analyzed for the expression of CD133 and CD44. All these were conducted in the same population of SP or non-SP cells. (B) Percentage of only ALDH1 + cells in the same population of non-SP and SP cells in A prior to (day 0) and following differentiation (day 14). (C) Percentage of ALDH1 + cells in non-SP and SP cells prior to (day 0) and following differentiation (day 14) after three independent experiments. **P
- Conjugate
- Biotin
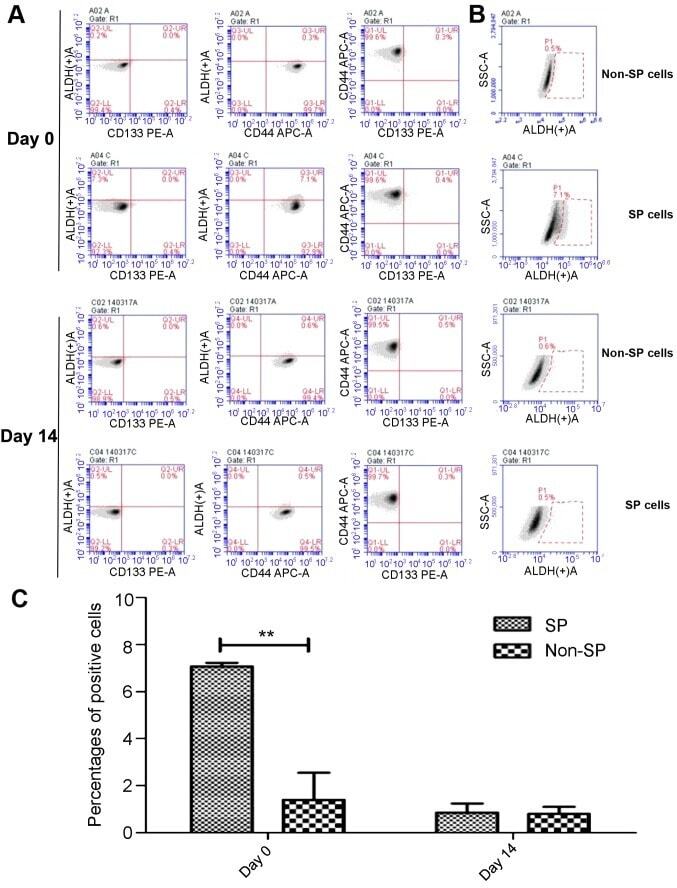
- Submitted by
- Invitrogen Antibodies (provider)
- Main image
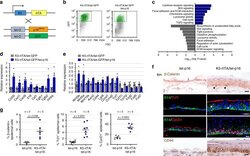
- Experimental details
- Fig. 4 p16 expression activates Wnt-pathway-associated genes. a Diagram of transgenic mouse lines crossed for co-induction of GFP and p16. b FACS plots showing GFP levels and gates used for isolation of GFP + epidermal cells from K5-rtTA/tet-GFP/tet-p16 (right) and control K5-rtTA/tet-GFP (left) mice, after 6 months of induction. Plots show the CD31 - /CD140a - /CD45 - cell fraction only. c Gene sets whose expression was preferentially upregulated (blue) or downregulated (grey) in GFP + cells from p16-expressing mice relative to GFP + cells from control mice. Values indicate -log 10 (adjusted P value) by hypergeometric test. d mRNA levels of genes encoding cytokines and genes associated with the TGFbeta pathway upregulated in p16-expressing GFP + cells, measured by mRNA-seq. Values were normalized to the mean expression levels in GFP + cells from control mice, defined as 1. P < 0.05 for all genes, n = 4 samples per group, each pooled from 3 mice. e Relative mRNA levels of genes associated with the Wnt pathway in the same samples. P < 0.05 for all genes, n = 4 samples per group, each pooled from 3 mice. f Skin sections from K5-rtTA/tet-p16 and control tet-p16 mice treated with dox for 6 months stained for beta-Catenin, Tcf1, Cyclin D1 or CD44. Arrowheads indicate representative positively stained cells. g Percentages of nuclear beta-catenin + , Tcf1 + , and CyclinD1 + IFE cells in control and p16-expressing mice after 6 months of induction, as scored visually from images. P va
- Conjugate
- Biotin
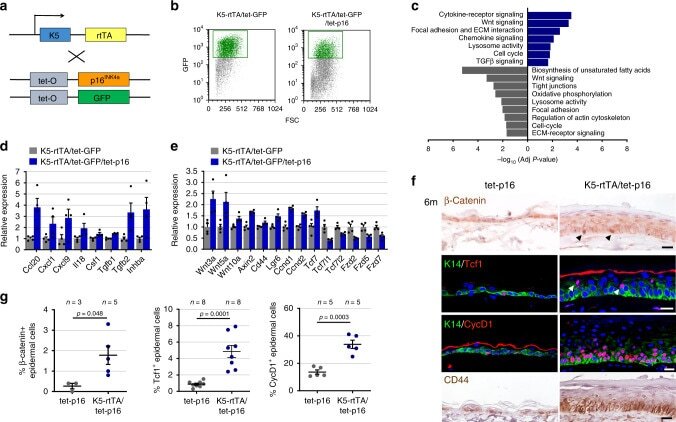
- Submitted by
- Invitrogen Antibodies (provider)
- Main image
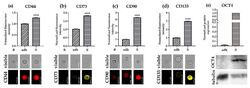
- Experimental details
- Figure 4 Protein expression of stem markers. The protein expression of five different stem markers was assessed in the FaDu adherent cell line and 7-day-old SCESM spheroids by Western blot and flow cytometry. ( a - d ) Protein expression analyzed by flow cytometry. Normalized fluorescence intensities of selected proteins are presented, and corresponding flow cytometry visible light and fluorescent photos are attached. Normalized mean values +- SE ( n >= 5, N >= 2000) are presented (**** p < 0.0001 vs. control (adh)); ( a ) CD44 protein expression; ( b ) CD73 protein expression; ( c ) CD90 protein expression; ( d ) CD133 protein expression; ( e ) OCT4 and tubulin protein expression analyzed by Western blot. Western blot membrane photos showing OCT4 and tubulin and a graph depicting normalized OCT4 protein expression analysis from Western blots are presented. Bars represent normalized mean values +- SE ( n >= 3). B: blank; adh: adherent cell line; S: SCESM.
- Conjugate
- Biotin
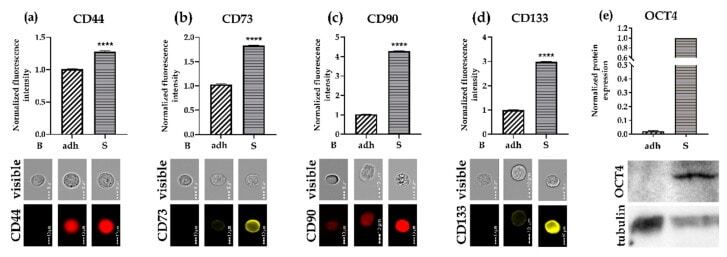
- Submitted by
- Invitrogen Antibodies (provider)
- Main image
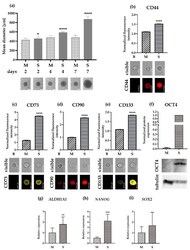
- Experimental details
- Figure 5 Comparative analysis of SCESM spheroids and multi-cellular tumor spheroids (MCTSs). ( a ) Graph representing SCESM spheroid and MCTS mean diameter increase. Spheroids were photographed on days 2, 4, and 7 and representative phase-contrast microscope images of SCESM spheroids and MCTSs on days 2, 4, and 7 are displayed under the graph. Mean values +- SE ( n >= 8) are presented. Scale bars correspond to 400 um; ( b - e ) Protein expression of four different stem markers was assessed in SCESM spheroids and MCTSs by flow cytometry. Normalized fluorescence intensities of selected proteins are presented and corresponding flow cytometry visible light and fluorescent photos are attached ( n >= 5, N >= 2000); (b) CD44 protein expression; ( c ) CD73 protein expression; ( d ) CD90 protein expression; ( e ) CD133 protein expression; ( f ) OCT4 and tubulin protein expressions were assessed in SCESM spheroids and MCTSs by Western blot analysis. Western blot membrane photo showing OCT4 and tubulin and graph depicting normalized OCT4 protein expression analysis from Western blots (using Image Lab software) are presented ( n >= 3); ( g - i ) Relative gene expression of three additional stem markers assessed in 7-day-old MCTSs and SCESM spheroids; Normalized mean values +- SE ( n >= 5) are presented; ( g ) Relative gene expression of ALDH1A1 ; ( h ) Relative gene expression of NANOG ; ( i ) Relative gene expression of SOX2 . (* p < 0.05, **** p < 0.0001 vs. control (MCTS)). B: blank;
- Conjugate
- Biotin
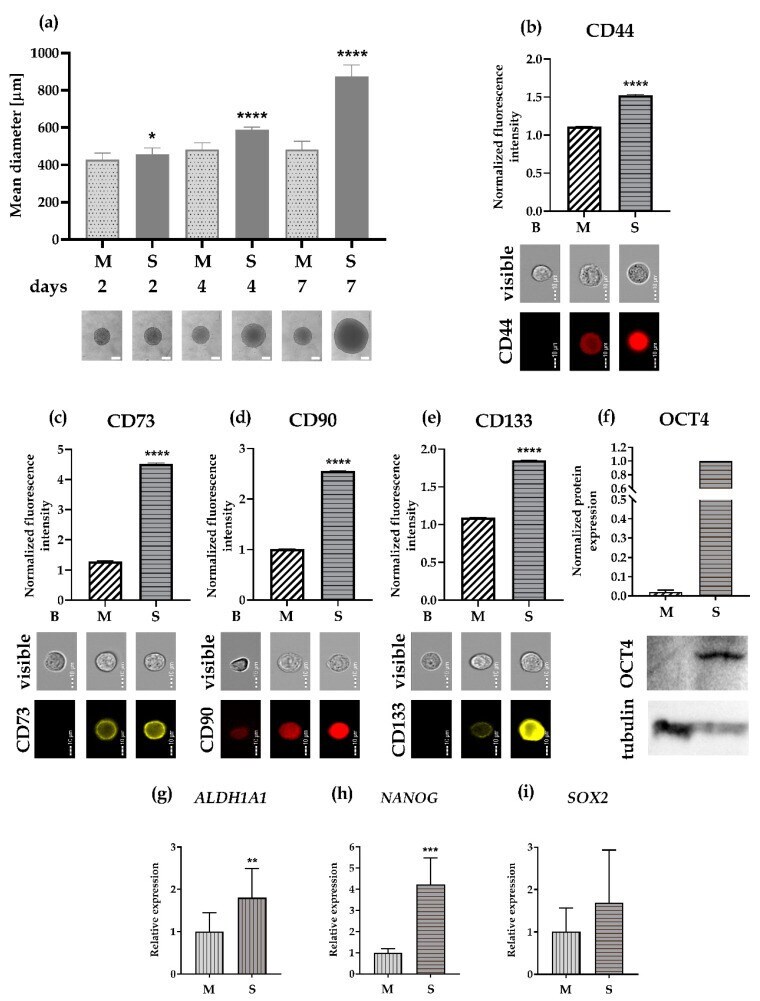
- Submitted by
- Invitrogen Antibodies (provider)
- Main image

- Experimental details
- Figure 4 Diacerein effects on cancer stem cells. A: Quantification of CD44 and representative microphotographs of stained colon sections (magnification 40 x), scale bar: 50 um; B: Representative images of cancer stem cells (CSCs) cultured in serum or stem-selective conditions with or without diacerein (DAR) 100 mM in HT-29 and CACO-2 cells; C: Quantitative reverse transcription polymerase chain reaction (RT-PCR) analysis of CSC markers CD133 and CD44 in parental cells and CSCs ( n = 3) in HT-29 and CACO-2 cells; D: Number of spheres in HT-29 and CACO-2 cells after treatment with interleukin (IL)-1beta (10 ng/mL) for 24 h ( n = 8); E: Quantitative RT-PCR analysis of CD44 and CD133 in parental cells and CSCs; Parental: cells cultivated with Dulbecco's modified Eagle's medium (DMEM) + IL-1beta (10 ng/mL); CSCs: cells cultivated with DMEM + IL-1beta (10 ng/mL, n = 3); F: Cell viability evaluated through MTT assay. Control: Cells cultivated with DMEM; DAR 50 mM, 100 mM, 200 mM and 300 mM: Cells cultivated with DMEM + DAR in different concentrations ( n = 3); G: Quantitative RT-PCR analysis of CD44, CD133 and IL-1beta in parental cells. Control: Cells cultivated with DMEM; DAR 100 mM: Cells cultivated with DMEM + DAR 100 mM ( n = 3); H: Quantitative RT-PCR analysis of CD44, CD133 and IL-1beta in CSCs. Control: Cells cultivated with DMEM; DAR 100 mM: Cells cultivated with DMEM + DAR 100 mM ( n = 3); I: Number of spheres in HT-29 and CACO-2 cells after treatment with DAR 100 mM or ve
- Conjugate
- Biotin
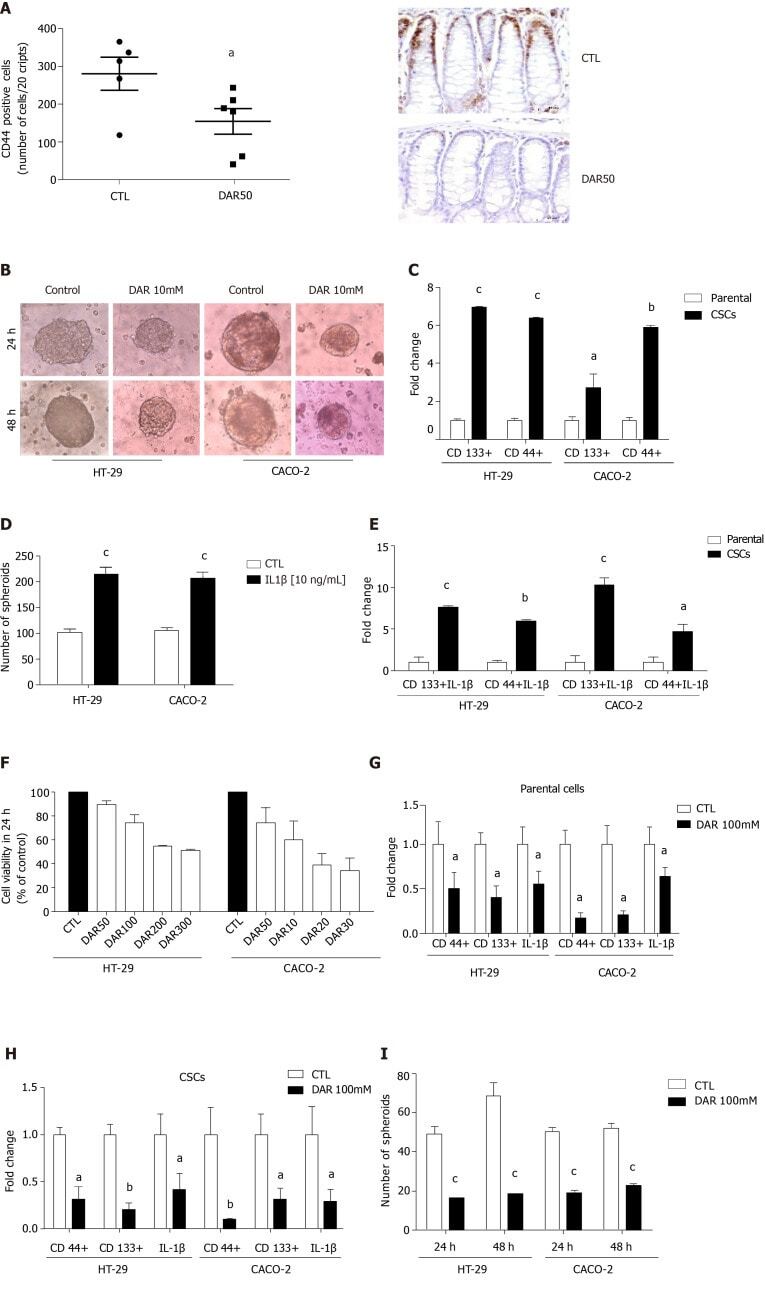
- Submitted by
- Invitrogen Antibodies (provider)
- Main image
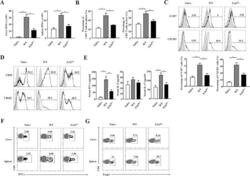
- Experimental details
- Fig. 3 EZH2 deficiency in DCs inhibited the CD4 + T-cell response during bacteria-induced liver injury. Ezh2 D-/- mice and WT mice were injected intravenously with P.ac suspended in PBS. The peripheral blood, liver, or spleen were isolated from naive, Ezh2 D-/- mice and WT mice on day 7. Statistical analyses of the numbers of A MNCs isolated from livers and spleens and B the CD4 + T-cell percentage of MNCs are shown. C The levels of CXCR3 and CCR7 expressed on CD4 + T cells were analyzed by flow cytometry. D The levels of CD44 and CD62L on CD4 + T cells were analyzed by flow cytometry. E The levels of serum IFN-gamma, IL-5, and IL-17 were measured by enzyme-linked immunosorbent assay ( n = 8 mice per group). F The production of the inflammatory cytokine IFN-gamma by CD4 + T cells was assessed by intracellular staining and analyzed by flow cytometry. Representative dot plots are shown. G MNCs isolated from livers and spleens were stained for CD4 and Foxp3 and analyzed by flow cytometry. Data are shown as the mean +- SEM of three independent experiments. * P < 0.05.
- Conjugate
- Biotin

- Submitted by
- Invitrogen Antibodies (provider)
- Main image
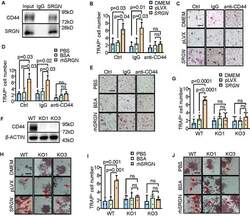
- Experimental details
- Fig. 4 SRGN functions through its receptor CD44. A Co-immunoprecipitation of SRGN and CD44. RAW264.7 and GCTB-19 cells were cocultured in a ratio of 5:1 for 48 h. Cell lysates were immunoprecipitated with an anti-SRGN antibody followed by immunoblotting with anti-CD44 and anti-SRGN antibodies. B , C Osteoclast quantification ( B ) and representative images ( C ) of mouse primary bone marrow with the treatment of hFOB1.19 CM and the CD44 neutralizing antibody (10 ng/mL) in the osteoclastogenesis assay. D , E Osteoclast quantification ( D ) and representative images ( E ) of mouse primary bone marrow with the treatment of human recombinant SRGN protein (rhSRGN) and the CD44 neutralizing antibody (10 ng/mL). F Validation of CD44 knockout (KO) in RAW264.7 cells. G - J Osteoclastogenesis assay of RAW264.7 CD44 -knockout cells with treatment of hFOB1.19 CM ( G , H ) or human recombinant SRGN protein ( I , J ). Shown are the numbers of giant mature osteoclasts ( G , I ) and representative images ( H , J ). Scale bar, 100 mum. P values were obtained by two-tailed unpaired t test ( B , D , G , I ). Bar graphs are shown as mean +- s.d.
- Conjugate
- Biotin
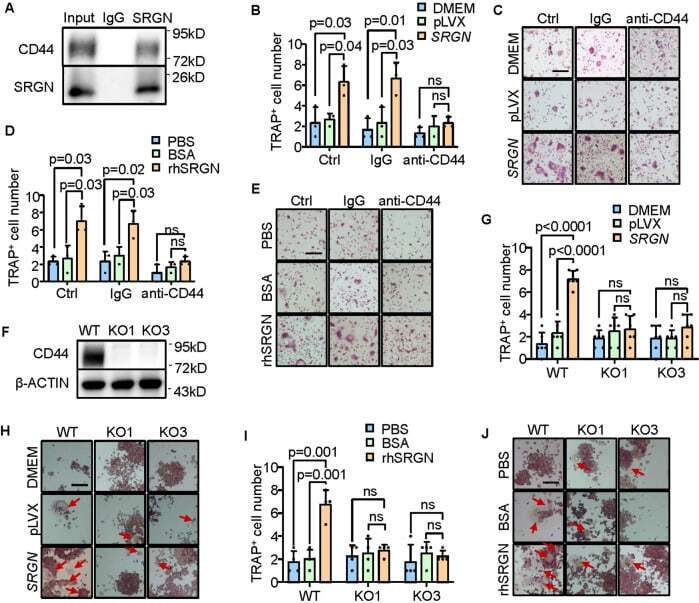
- Submitted by
- Invitrogen Antibodies (provider)
- Main image
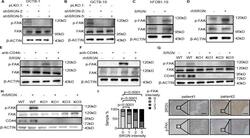
- Experimental details
- Fig. 5 SRGN activates focal adhesion kinase through CD44. A - D Western blot analysis of phosphorylated FAK protein level in RAW264.7 cells after treatment with CM from GCTB-1 ( A ) or GCTB-19 ( B ) with SRGN knockdown, CM from hFOB1.19 with SRGN overexpression ( C ), or human recombinant SRGN protein ( D ). E Western blotting analysis of phosphorylated FAK protein level in RAW264.7 cells after treatment with CM from hFOB1.19 with SRGN overexpression and the CD44 neutralizing antibody. F Western blotting analysis of phosphorylated FAK in RAW264.7 cells after treatment with human recombinant SRGN protein and the CD44 neutralizing antibody. G , H Western blotting analysis of phosphorylated FAK in RAW264.7 CD44 -knockout cells after treatment with CM from hFOB1.19 with SRGN overexpression ( G ) and human recombinant SRGN protein ( H ). I FAK phosphorylation levels in human GCTB samples with different levels of SRGN expression. Protein expression was scored as 0 (negative), 1 (weak), 2 (moderate) and 3 (strong) by immunohistochemistry staining ( n = 71 patients). Scale bar, 100 mum. P values were obtained by chi-squared test ( I ).
- Conjugate
- Biotin
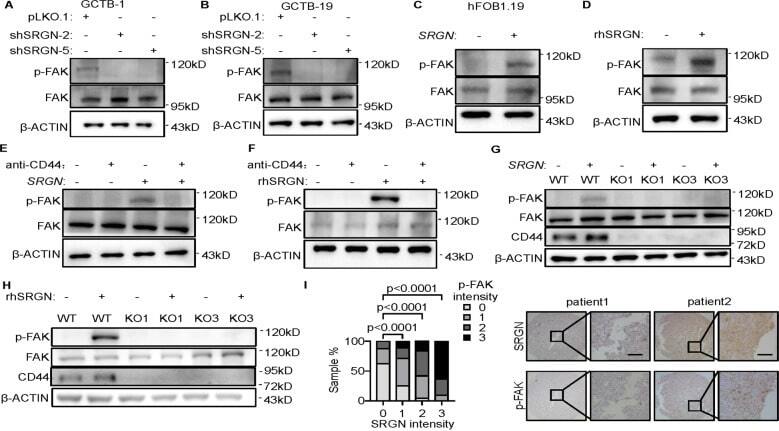
- Submitted by
- Invitrogen Antibodies (provider)
- Main image
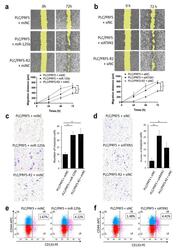
- Experimental details
- Figure 5 Forced expression of miR-125b-5p or knockdown of ATXN1 gene increases migration, invasion capability, and cancer stemness of HCC cell lines. ( a ) Representative image of the wound-healing assay in PLC/PRF5-miNC, PLC/PRF5-miR125b, and PLC/PRF5-R2-miNC cells (upper panel). The average migration distance was calculated from the wound healing area, and the time-dependent distance of migration is depicted in the lower panel (mean +- SD; n = 3). ( b ) Similarly, representative images of the wound-healing assay and time-dependent distance of migration in PLC/PRF5-siNC, PLC/PRF5-siATXN1, and PLC/PRF5-R2-siNC cells are shown in the lower panel (mean +- SD; n = 3). ( c ) Representative images of the invasion assay in PLC/PRF5-miNC, PLC/PRF5-miR125b, and PLC/PRF5-R2-miNC cells (left panel). The number of invading cells was counted, and the average numbers of invading cells are shown (right panel). ( d ) Similarly, representative invasion assay images and quantified invading cells in PLC/PRF5-siNC, PLC/PRF5-siATXN1, and PLC/PRF5-R2-siNC cells are shown. ( e ) Expression of CD44 and CD133 in PLC/PRF5-miNC and PLC/PRF5-miR125b cells was evaluated by two-color flow cytometry using mouse anti-human CD44 monoclonal antibody (APC) and mouse anti-human CD133 monoclonal antibody (PE). The percentage of CD44 + CD133 + cells based on the analysis of 10,000 cells is indicated. ( f ) Expression of CD44 and CD133 in PLC/PRF5-siNC and PLC/PRF5-siATXN1 cells was analyzed by flow cytometry and
- Conjugate
- Biotin
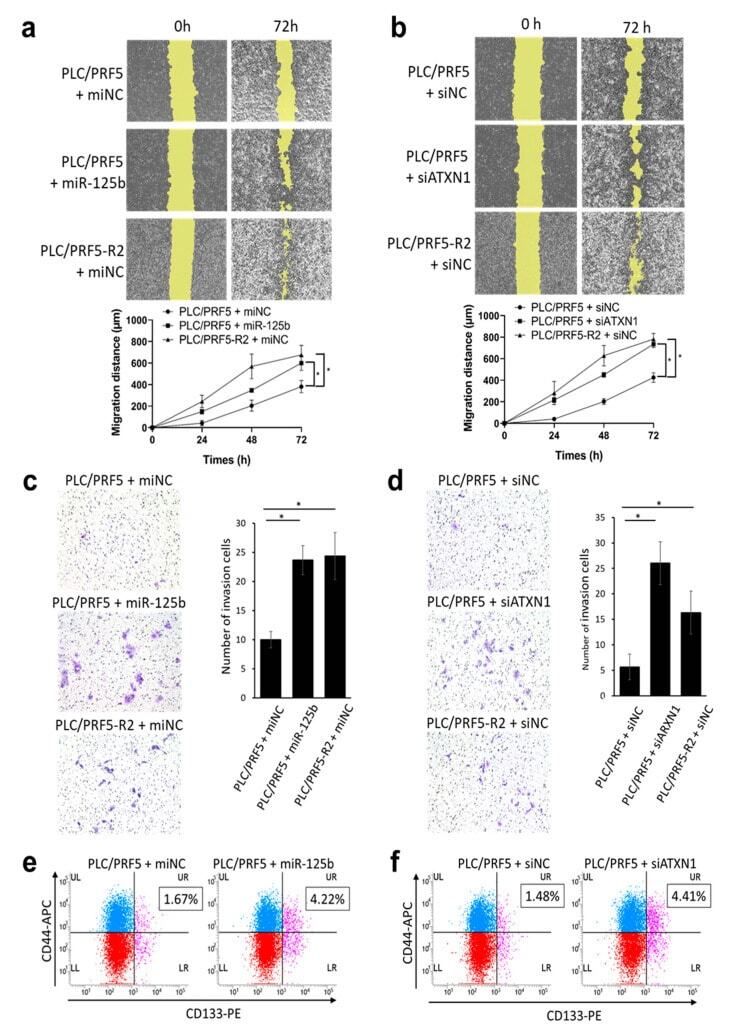
- Submitted by
- Invitrogen Antibodies (provider)
- Main image

- Experimental details
- Figure 1 Homozygous RhoA deletion in Treg cells leads to early, fatal spontaneous inflammatory disorders. (A) Survival outcome of RhoA +/+ Foxp3 YFP-Cre and RhoA Flox/Flox Foxp3 YFP-Cre mice. Results were analyzed with a log-rank (Mantel-Cox) test and expressed as Kaplan-Meier survival curves. (B) Image of lymphadenopathy in RhoA Flox/Flox Foxp3 YFP-Cre mice. Inguinal lymph nodes are shown. (C) Images of H&E staining of the indicated organs from RhoA +/+ Foxp3 YFP-Cre and RhoA Flox/Flox Foxp3 YFP-Cre mice (original magnification X 400). (D) Left, representative flow cytogram of CD44 and CD62L staining in CD4 + and CD8 + cells from the spleen of RhoA +/+ Foxp3 YFP-Cre and RhoA Flox/Flox Foxp3 YFP-Cre mice. The numbers indicate percentages of CD44 + , CD44 + CD62L + , and CD62L + cells. Right, average percentages of CD44 + , CD44 + CD62L + , and CD62L + cells. (E) Left, representative flow cytogram of IL-17, IFN-gamma, and IL-4 staining in CD4 + Foxp3 - cells from the spleen of RhoA +/+ Foxp3 YFP-Cre and RhoA Flox/Flox Foxp3 YFP-Cre mice. The numbers indicate percentages of IL-17 + , IFN-gamma + , and IL-4 + cells. Right, average percentages of IL-17 + , IFN-gamma + , and IL-4 + cells. (F) Left, representative flow cytogram of RORgammaT, T-bet and GATA3 staining in CD4 + Foxp3 - cells from the spleen of RhoA +/+ Foxp3 YFP-Cre and RhoA Flox/Flox Foxp3 YFP-Cre mice. The numbers indicate percentages of RORgammaT + , T-bet + , and GATA3 + cells. Right, average percentages of RORgam
- Conjugate
- Biotin
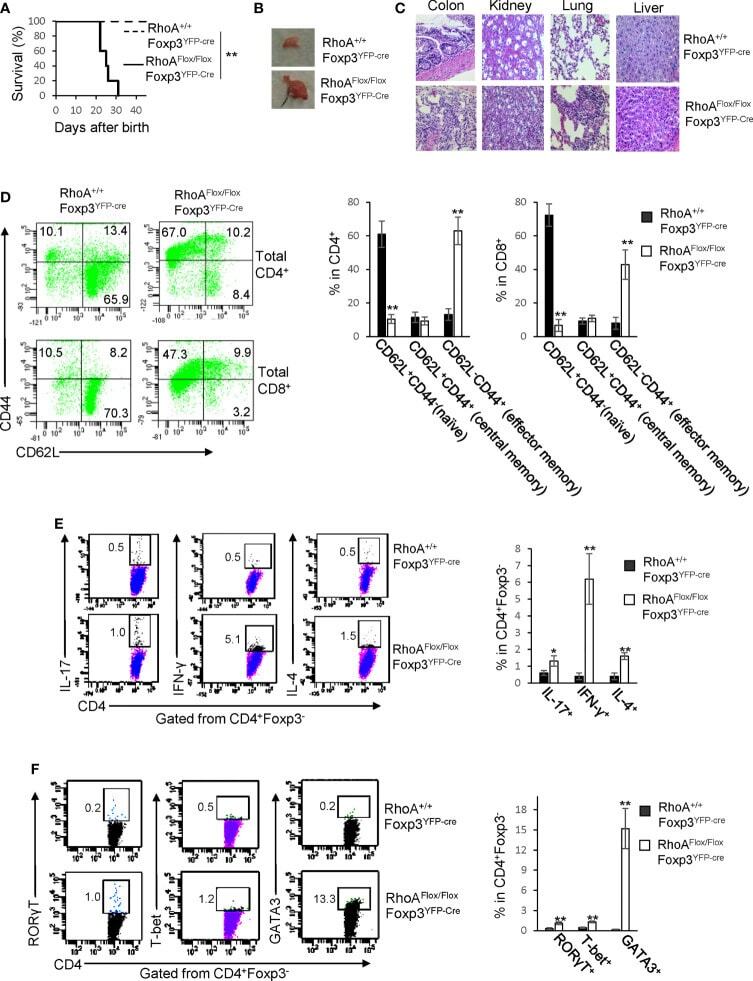
- Submitted by
- Invitrogen Antibodies (provider)
- Main image
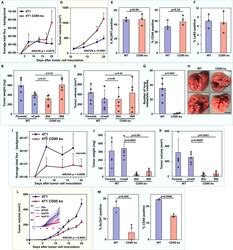
- Experimental details
- Figure 1 Deletion of CD95 in 4T1 cells inhibits tumor growth and cancer stemness in BALB/c mice but not in NSG mice (A) Wild-type (vCas9) or CD95 k.o. 4T1 (mixture of clones #54 and #69) cells (10 5 ) were injected into the fat pad of NSG mice. Bioluminescence of tumors was quantified at the indicated times after injection of cells. (B and C) Equal numbers of WT (Parental or vCas9) or CD95 k.o. (#54 or #69) 4T1 cells were transplanted into the mammary fat pad of NSG mice, and tumor weight (B) and tumor volume (C) were measured after two weeks. (D) Wild-type (mixture of clones #3 and #4) or CD95 k.o. 4T1 (mixture of clones #10 and #12) cells (10 5 ) were injected into the mammary fat pad of NSG mice, and tumor volume was measured using a caliper. (E) ALDH1 activity and CD44 surface staining of single-cell suspensions of tumors isolated from NSG mice. n = 3 for each group. (F) IHC quantification of Ly6G positive cells in the WT and CD95 k.o. tumors monitored in (B). n = 3 biological replicates. (G) Equal numbers of WT (Parental or vCas9) or CD95 k.o. (1:1 mixture of #54 or #69) 4T1 cells were transplanted into the mammary fat pad of NSG mice, and tumor nodules of the primary tumor on the surface of the lungs were counted two weeks after transplantation. (H) The appearance of representative lungs analyzed in (G). Scale bar, 5 mm. (I) Luciferase expressing wild-type (cCas9) or CD95 k.o. 4T1 (mixture of two k.o. clones) cells (10 5 ) were injected into the mammary fat pad of BALB/
- Conjugate
- Biotin
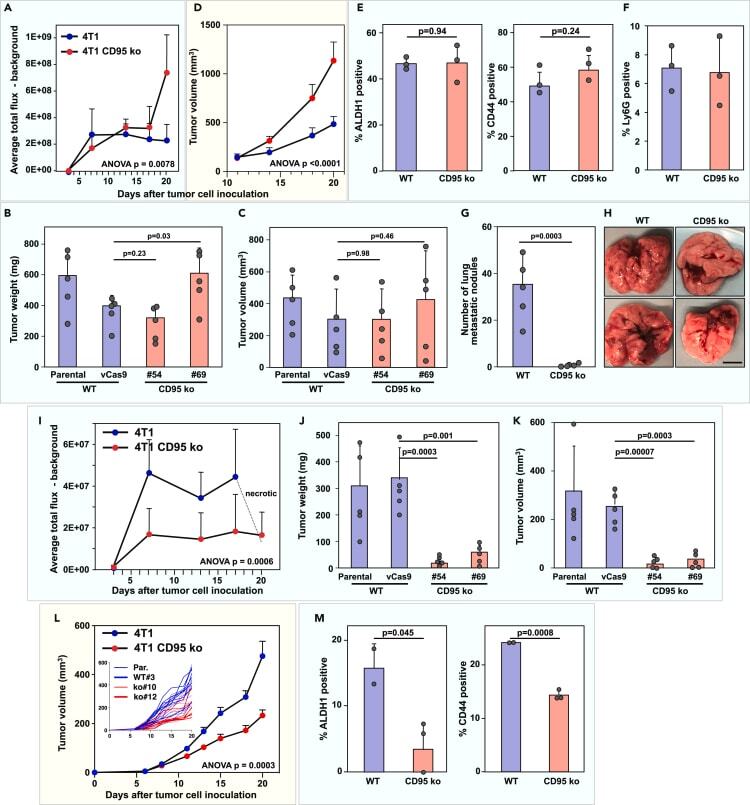
- Submitted by
- Invitrogen Antibodies (provider)
- Main image
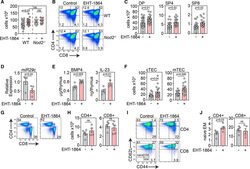
- Experimental details
- Figure 5. Rac1 inhibition enhances thymus regeneration and peripheral CD4 + naive T cell recovery after acute damage 6- to 8-week C57BL/6 WT or Nod2 -/- mice were treated with the Rac1 inhibitor EHT1864 (40 mg/kg i.p. injection) at days 3, 5, and 7 following a sublethal dose of TBI (550 cGy), and the thymus was analyzed on day 14. (A) Total thymic cellularity at day 14 after SL-TBI (WT, n = 20/treatment across 4 independent experiments; KO, n = 9-12 across three independent experiments). (B) Flow plots showing CD4 and CD8 expression at day 14 after SL-TBI (gated on CD45 + cells; plots were concatenated of all samples in each treatment group from one experiment). (C) Total number of DP, SP4, or SP8 thymocytes (n = 20/treatment across 4 independent experiments). (D) Expression of miR29c analyzed by qPCR on whole thymic tissue (n = 5/group). (E) Total thymic amounts of BMP4 and IL-23 assessed by ELISA at day 7 (n = 4-5/group, representative of two independent experiments). (F) Total number of cTECs and mTECs (n = 15/group across three independent experiments). (G) Flow plots showing CD4 and CD8 expression in the spleen at day 56 after SL-TBI (gated on CD45 + CD3 + cells). (H) Total number of CD4 + and CD8 + T cells in the spleen at d56 (n = 5/group). (I) Plots of CD62L and CD44 on CD4 + and CD8 + T cells (gated on either CD45 + CD3 + CD4 + CD8 - or CD45 + CD3 + CD4 - CD8 + ) cells; plots concatenated of all samples in a given experiment). (J) Ratio of number of naive (CD62L hi C
- Conjugate
- Biotin
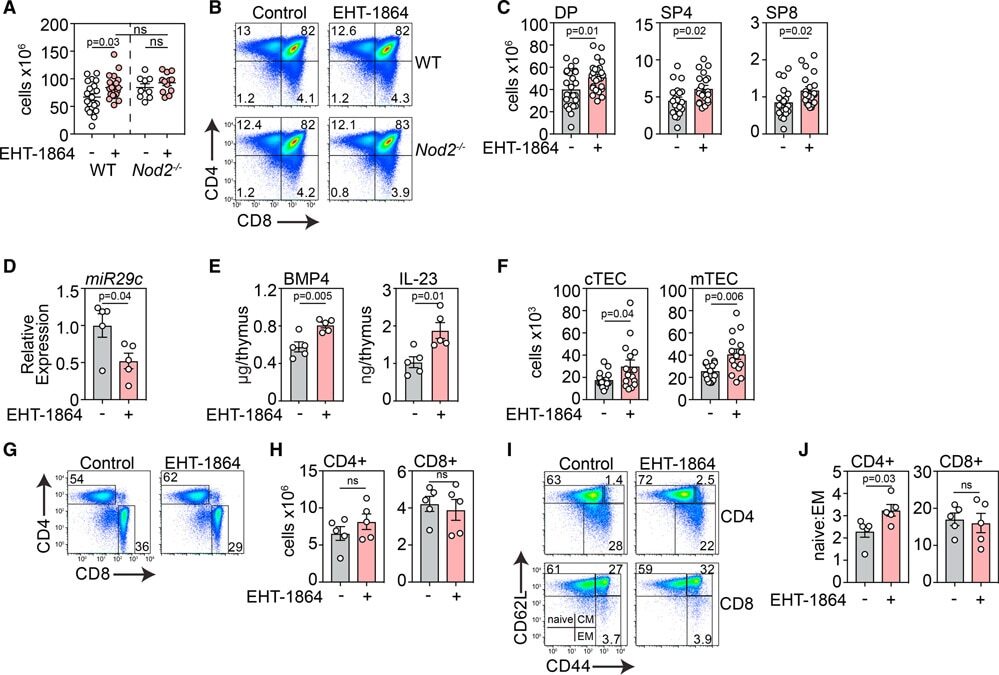
- Submitted by
- Invitrogen Antibodies (provider)
- Main image
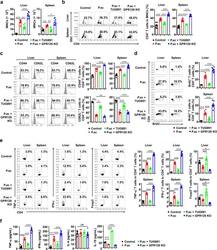
- Experimental details
- Fig. 2 GPR120 reduced CD4 + T cell responses in mice with liver injury. Wild-type (WT) and GPR120 -/- (GPR120 KO) mice were injected with P. acnes (P.ac). Vehicle or TUG891 (10 mg/kg) was administered i.p. to WT mice on days 0, 2, 4, and 6 after P. acnes injection. Livers and spleens were isolated on day 7 ( n = 7 mice per group). a Absolute numbers of total MNCs in livers and spleens were analyzed by flow cytometry. b Percentages of CD4 + T cells in total MNCs in livers and spleens were analyzed by flow cytometry. c The expression levels of CD44 and CD62L in CD4 + T cells in the livers and spleens were analyzed by flow cytometry. d On day 6 after priming, BrdU was injected i.p. into the mice. MNCs were isolated from livers and spleens the next day. Cells were stained for CD4 and BrdU. The frequencies of CD4 + BrdU + T cells in the livers and spleens were determined by flow cytometry. e The percentages of TNF-alpha + , IFN-gamma + , and Foxp3 + cells in CD4 + T cells were assessed by intracellular staining and flow cytometry. f The levels of serum TNF-alpha, IFN-gamma, IL-4 and IL-10 were measured by enzyme-linked immunosorbent assay. The results are representative of three to six independent experiments and presented as the mean +- SEM. Significant differences were analyzed by One-way ANOVA. * p < 0.05, ** p < 0.01, *** p < 0.001, ns no significance.
- Conjugate
- Biotin
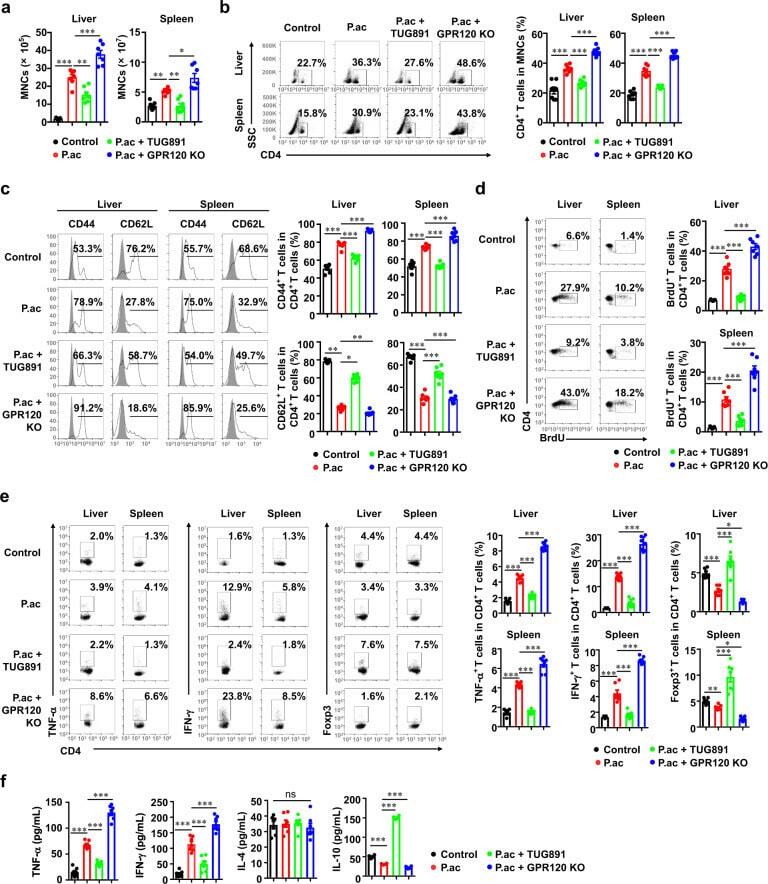
- Submitted by
- Invitrogen Antibodies (provider)
- Main image
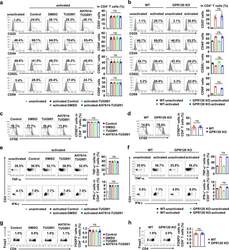
- Experimental details
- Fig. 3 GPR120 had no effects on the activation, proliferation, and differentiation of CD4 + T cells in vitro. T cells were isolated from the spleens of wild-type (WT) mice and GPR120 -/- (GPR120 KO) mice. T cells were cultured (2 x 10 5 cells/well) in the presence of anti-CD3 and anti-CD28 antibodies. T cells from WT mice were treated with DMSO, TUG891 (20 muM) with or without AH7614 (20 muM). a , b The expression levels of CD25, CD44, CD62L, and CD69 on CD4 + T cells were analyzed by flow cytometry. c , d Frequencies of the proliferating (CFSE low ) CD4 + T cell proliferation in response to the indicated treatments were measured by flow cytometry. e , f CD4 + T cells were stained for the surface marker CD4 and intracellular expression of TNF-alpha and IFN-gamma on day 5 and analyzed by flow cytometry. g , h CD4 + T cells were stained for the surface marker CD4 and intracellular expression of Foxp3 on day 5 and analyzed by flow cytometry. The results are representative of three independent experiments and presented as the mean +- SEM. Significant differences were analyzed by One-way ANOVA. ns no significance.
- Conjugate
- Biotin
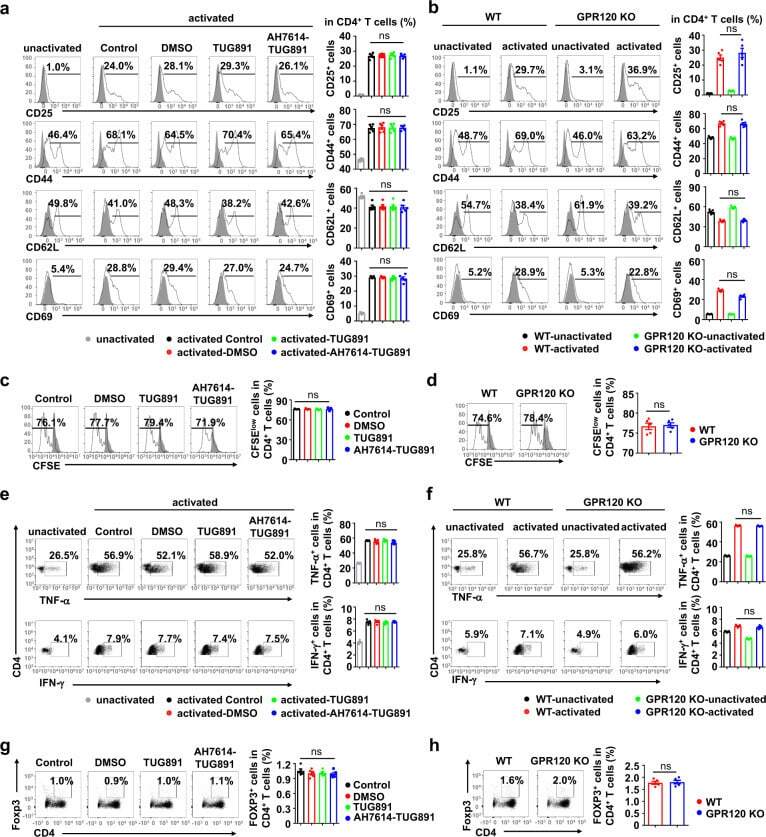
- Submitted by
- Invitrogen Antibodies (provider)
- Main image

- Experimental details
- Figure 5 TNF superfamily members CD153 and CD30 are specifically expressed in SAT cells and ABCs, respectively, inside of TLTs in aged injured kidneys. ( A ) Dot plot of ligand-receptor interactions related to TNF superfamily members between 6 CD4 + T cell subpopulations and 3 B cell subpopulations identified by scRNA-Seq (see Figure 3 ). ( B ) Violin plots showing the expression of Tnfsf8 and Tnfrsf8 in all CD45 + cells. The putative identities of each cluster are specified in the box. DN, double-negative. ( C ) UMAP plot of Tnfsf8 and Tnfrsf8 in CD45 + cells in Figure 2B and enlargement of those of Cd4 , Tnfsf8 , Spp1 , Sostdc1 , Il21 , and Il10 , and those of Cd19 , Cr2 , Tbx21 , and Tnfrsf8 . ( D ) Representative FACS plots of CD153 expression on T cells, B cells, macrophages, dendritic cells, CD4 + T cells, CD8 + T cells, CD44 hi CD4 + T cells, and PD-1 + CD4 + T cells ( n = 3/group). ( E ) Representative FACS plots of CD30 expression on T cells, B cells, macrophages, and dendritic cells ( n = 2/group). ( F ) Plasma soluble CD30 (sCD30) levels of young and aged mice with or without (not treated, NT) ischemic reperfusion injury (IRI) induction ( n = 3/group, samples were collected 45 days after IRI). Data are presented as mean +- SD. Statistical significance was determined by 1-way ANOVA with Bonferroni's post hoc analysis. *** P < 0.001. ( G ) Violin plots showing the expression of Adam10 and Adam17 among 3 B cell subsets identified by scRNA-Seq. ( H ) Representative ISH
- Conjugate
- Biotin
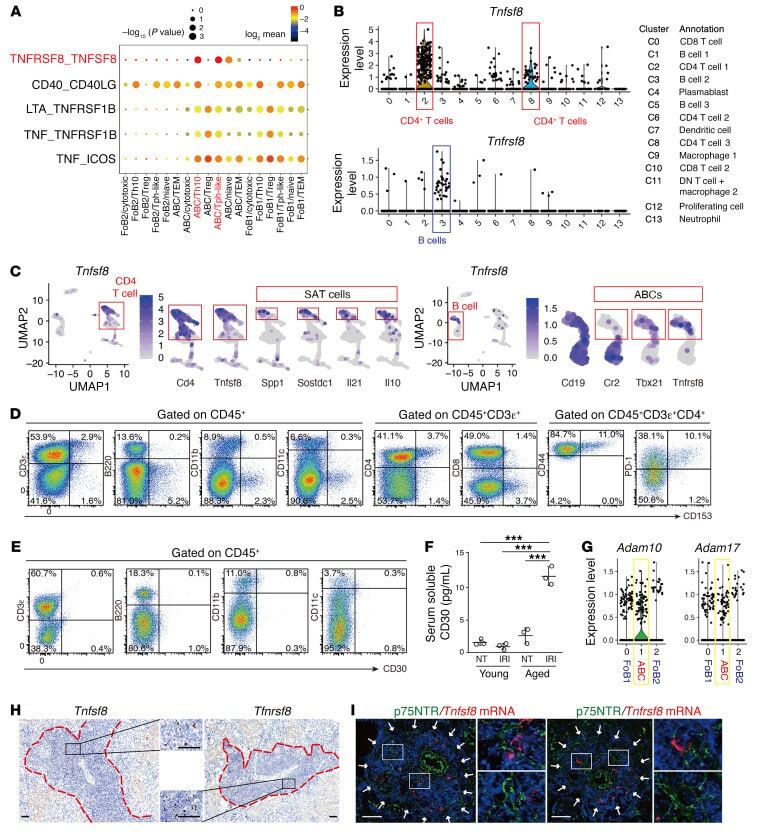
- Submitted by
- Invitrogen Antibodies (provider)
- Main image
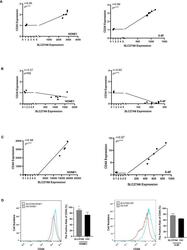
- Experimental details
- Figure 7 SLC27A6 expression positively correlates with CD24 and CD44 expression level in NPC cells. (A) Positive correlation between the mRNA expression of SLC27A6 and CD24 in NPC cells (HONE1, R=0.95; 5-8F, R=0.99) by qRT-PCR. (B) No significant difference was shown between the SLC27A6 and CD34 mRNA expression in HONE1 (left panel), while a negative correlation was seen in 5-8F (right panel). (C) Positive correlation between the mRNA expression of SLC27A6 and CD44 in NPC cells (HONE1, R=0.98; 5-8F, R=0.97) by qRT-PCR. (D) The CD44 expression levels in HONE1 (left panel) and 5-8F (right panel) stably transfected cells were measured by flow cytometry. NS, no significance > 0.05; * P < 0.05; ** P < 0.01; *** P < 0.001.
- Conjugate
- Biotin
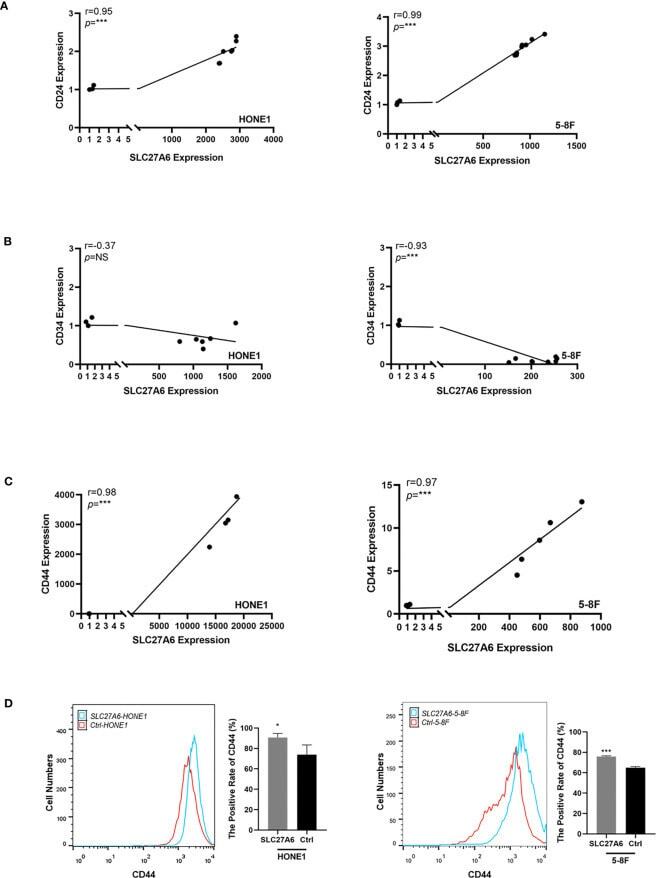
- Submitted by
- Invitrogen Antibodies (provider)
- Main image
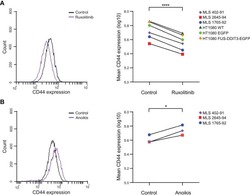
- Experimental details
- Figure 5 CD44 protein expression analyzed by flow cytometry. (A) CD44 regulation by ruxolitinib treatment. The CD44 expression profiles of ruxolitinib-treated myxoid liposarcoma (MLS) 402-91 cells compared with control cells treated with DMSO are shown as an example (left panel). Mean CD44 expressions in ruxolitinib-treated MLS (402-91, 2645-94, and 1765-92) and fibrosarcoma [HT1080 wild-type (WT), HT1080 EGFP, and HT1080 FUS-DDIT3-EGFP] cells are shown (right panel). **** p < 0.0001, paired Student's t -test. (B) CD44 regulation by anoikis resistance. The CD44 expression profiles of anoikis-resistant MLS 402-91 cells in comparison to control cell cultures in monolayer are shown as example (left panel). Mean CD44 expressions in anoikis-resistant cells compared with control cells for MLS (402-91, 2645-94, and 1765-92) cells are shown (right panel). * p < 0.05, paired Student's t -test.
- Conjugate
- Biotin
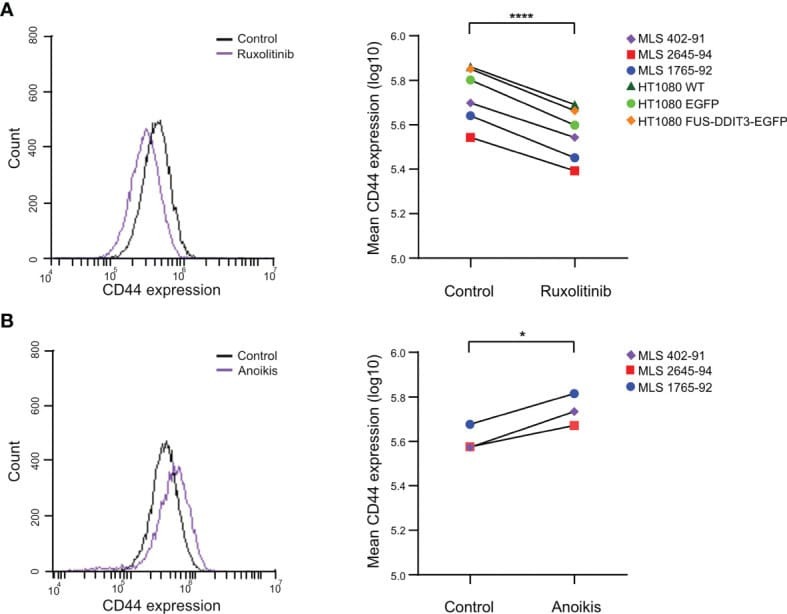
- Submitted by
- Invitrogen Antibodies (provider)
- Main image
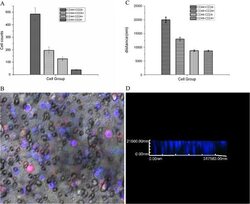
- Experimental details
- Figure 3 Invasion assay of these four subsets of MCF7 cells. A , Cell number quantification of invasion. B , Confocal images of these four subsets of MCF7 cells (Green: CD44 + /CD24 -/low ; Red: CD44 - /CD24 + ; Yellow: CD44 + /CD24 + ; and Blue: CD44 - /CD24 - ). C , Quantification of tumor cell migration distance. D , Images of cell migration distance.
- Conjugate
- Biotin

- Submitted by
- Invitrogen Antibodies (provider)
- Main image
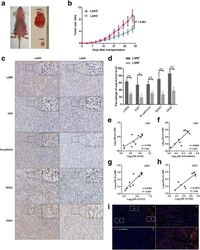
- Experimental details
- Stemness properties of LGR5 + U251 cells in vivo. a Xenografts produced by LGR5 + and LGR5 - U251 cells. b The subcutaneous xenografts growth curve generated by LGR5 + and LGR5 - U251 cells in BALB/c-nu mice (two-way ANOVA, P < 0.001). Data are shown as the mean +- SD (LGR5 + U251: n = 5, LGR5 - U251: n = 5). c IHC staining of LGR5, Ki67, N-cadherin, CD44 and SOX2 expression in LGR5 + xenografts and LGR5 - xenografts (magnification x 200). d The percentage of positive expression of LGR5, Ki67, N-cadherin, CD44 and SOX2 in LGR5 + xenografts and LGR5 - xenografts ( n = 5, Student t test). Error bars represent the mean +- SD. e The correlation between the levels of LGR5 and Ki67 by Spearman correlation analysis ( P < 0.01, r = 0.7794, n = 10). f The correlation between the levels of LGR5 and N-cadherin by Spearman correlation analysis ( P < 0.01, r = 0.8424, n = 10). g The correlation between the levels of LGR5 and SOX2 by Spearman correlation analysis ( P < 0.001, r = 0.8788, n = 10). h The correlation between the levels of LGR5 and CD44 by Spearman correlation analysis ( P < 0.05, r = 0.6970, n = 10). i Double-staining of LGR5 and N-cadherin in U251 subcutaneous xenografts. The xenografts edge (3 and 4) showed many positive cells expressed both LGR5 and N-cadherin, while there was few positive cells in inside xenografts (section "" Methods ""). Scale bar = 100 mum. *, P < 0.05; **, P < 0.01; ***, P < 0.001
- Conjugate
- Biotin
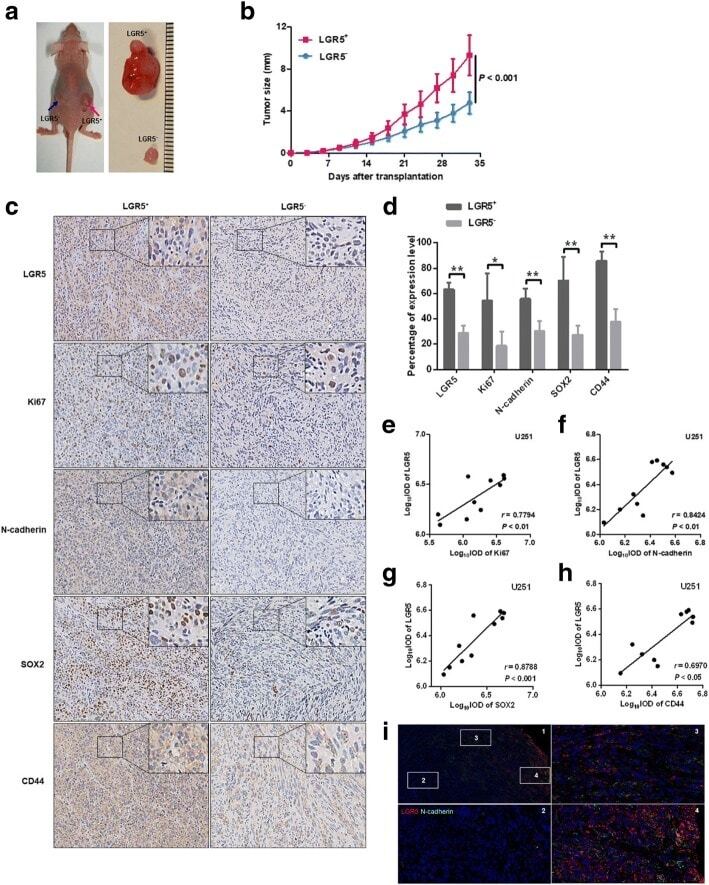
- Submitted by
- Invitrogen Antibodies (provider)
- Main image
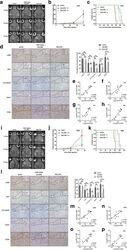
- Experimental details
- Effect of LGR5 on intracranial tumor growth and overall survival time of xenograft mice. a T2W images of intracranial tumor in coronal views scanned using 7.0 T MRI on days 12, 25 and 39 after U251-GSCs injection. b The intracranial tumor growth curve of the shLGR5 ( n = 5), Wnt-C59 ( n = 5) and shCtrl ( n = 5) U251-GSCs. Error bars represent the mean +- SD ( n = 5, two-way ANOVA). c Overall survival time (OS) of xenograft mice in the shLGR5 ( n = 5), Wnt-C59 ( n = 5) and shCtrl ( n = 5) U251-GSCs analyzed by Log-rank test. d IHC staining and quantitative analyses of LGR5, Ki67, Active-beta-catenin, SOX2 and CD44 (magnification x 200). e Spearman correlation analysis of LGR5 and Active-beta-catenin between shLGR5 and shCtrl U251-GSCs ( P < 0.001, r = 0.8940, n = 10). f Spearman correlation analysis of LGR5 and Ki67 between shLGR5 and shCtrl U251-GSCs ( P < 0.01, r = 0.7803, n = 10). g Spearman correlation analysis of LGR5 and SOX2 between shLGR5 and shCtrl U251-GSCs ( P < 0.01, r = 0.8182, n = 10). h Spearman correlation analysis of LGR5 and CD44 between shLGR5 and shCtrl U251-GSCs ( P < 0.01, r = 0.8788, n = 10). i T2W images of intracranial tumor in coronal views scanned using 7.0 T MRI on days 10, 20 and 36 after 8591-GSCs injection. j The intracranial tumor growth curve of the shLGR5 ( n = 5), Wnt-C59 ( n = 5) and shCtrl ( n = 5) 8591-GSCs. Error bars represent the mean +- SD ( n = 5, two-way ANOVA). k Overall survival time (OS) of xenograft mice in the shLGR5 ( n = 5), W
- Conjugate
- Biotin
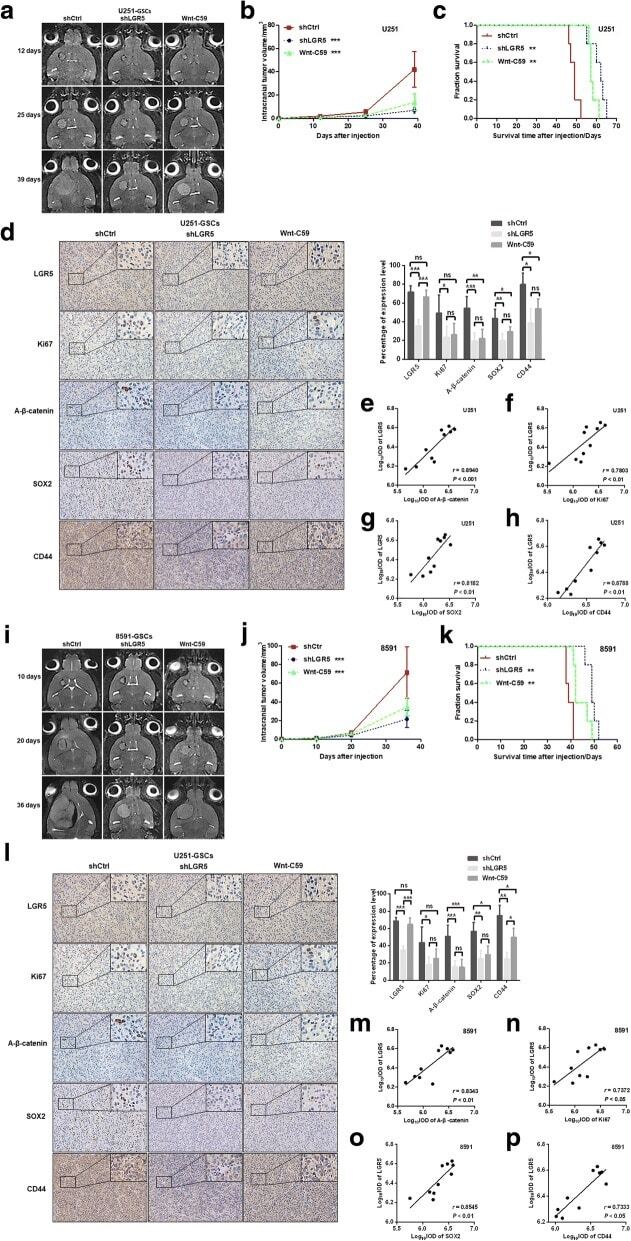
- Submitted by
- Invitrogen Antibodies (provider)
- Main image

- Experimental details
- 5 FIGURE (A) FACS analysis for CD44 or Sca-1-positive subpopulations in primary #1 cells after Wnt small-molecule inhibitors for 24 h. CWP291, 1 uM CWP232291; BC21, 10 uM BC21; CCT, 20 uM CCT031374; PKF, 2 uM PKF 118-774; Cisplatin, 1 uM cisplatin. Right, representative FACS images showing reduced CD44 or Sca-1-positive cells in primary #1 cells after CWP232291 treatment. (B) Sphere-forming assay showing reduced tumorsphere formation from primary #1 cells after the treatment for 7 days with Wnt inhibitors. The spheres greater than 100 mm of diameter were enumerated. Right, representative images of tumor spheres after the treatment with Wnt inhibitors. (C) CWP232291 inhibited primary (with CWP232291) and second sphere formation (without CWP232291) in primary #1 and SW620. (D) Representative images of tumorspheres from primary #1 cells of (C). (E) Representative IF images for CD133, Lgr-5, and Sca-1, putative mouse intestinal cancer stem cell markers, in vehicle- or CWP232291-treated allografts of SCID mice. SCID mice injected with primary #1 cell were treated with 100 mg/kg CWP232291 twice a week for 8 weeks. Bottom, IF scoring for CD133, Lgr-5, and Sca-1-positive tumor cells in vehicle- ( n = 3) or CWP232291-treated ( n = 3) allografts. Bar = 100 um. (F) FACS analysis for CD133 in CWP232291- or vehicle-treated allografts. Single cell suspensions were obtained from allografts after dispase digestion. FACS, fluorescence-activated cell sorting; IF, immunofluorescence. * p < 0.05
- Conjugate
- Biotin
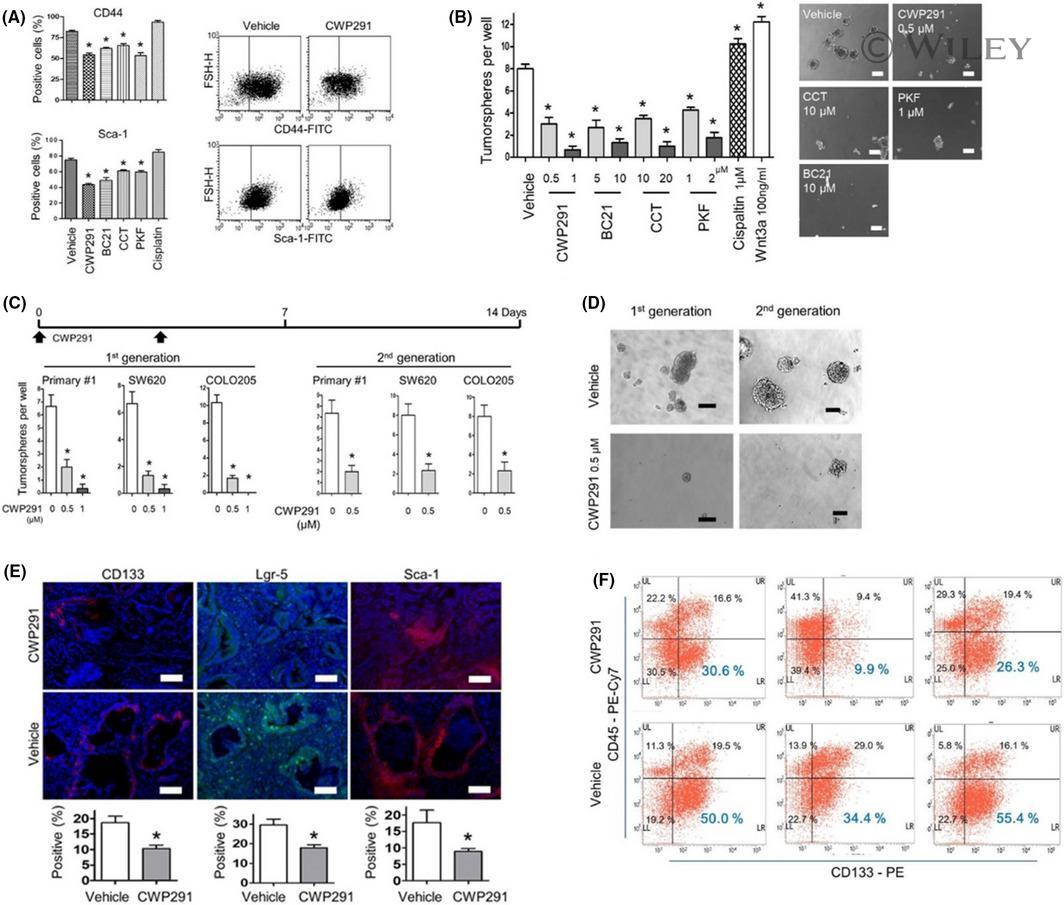
- Submitted by
- Invitrogen Antibodies (provider)
- Main image
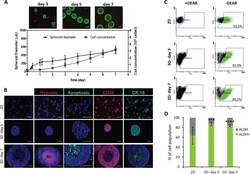
- Experimental details
- Figure 2. Characterization of HT29 3D cell culture. A: Aggregation and spheroid growth process on stirred culture system and live/dead assessment (FDA - green; PI - red, respectively) at days 3, 5, and 7 of culture. Diameter distribution of colon cancer spheroids along the culture time; data are mean +- SD of four independent experiments. Scale bar = 300 mm. B: Phenotypic characterization of HT29 spheroids and 2D culture, namely, detection of hypoxic regions (pimonidazole - Hypoxyprobe), apoptosis (NuncView), CD44 and cytokeratin 18 (CK18) along culture time (days 3 and 7 of culture, corresponding to average aggregate diameter of 300 and 500 um, respectively). Cell nuclei were stained with DAPI. Analyses were performed on cryosections (10 mm thickness). Scale bar = 100 mm. C: Flow cytometry analysis of HT29 cells: percentage of ALDH + cells of 2D cell culture and HT29 spheroids collected at days 3 and 7. The left side shows the dot-blot of Aldefluor assay with inhibitor (DEAB) and the right side shows the dot-blot without inhibitor. The ALDH + cell population is identified in green. D: Percentage of ALDH + cells determined on 2D and 3D cell culture. Data are mean +- SD of at least 5 independent experiments performed in triplicates: Asterisks indicate significant differences relative to 2D culture (*** P < 0.001, **** P < 0.0001) by one-way ANOVA analysis with Tukey's post multiple comparison tests.
- Conjugate
- Biotin
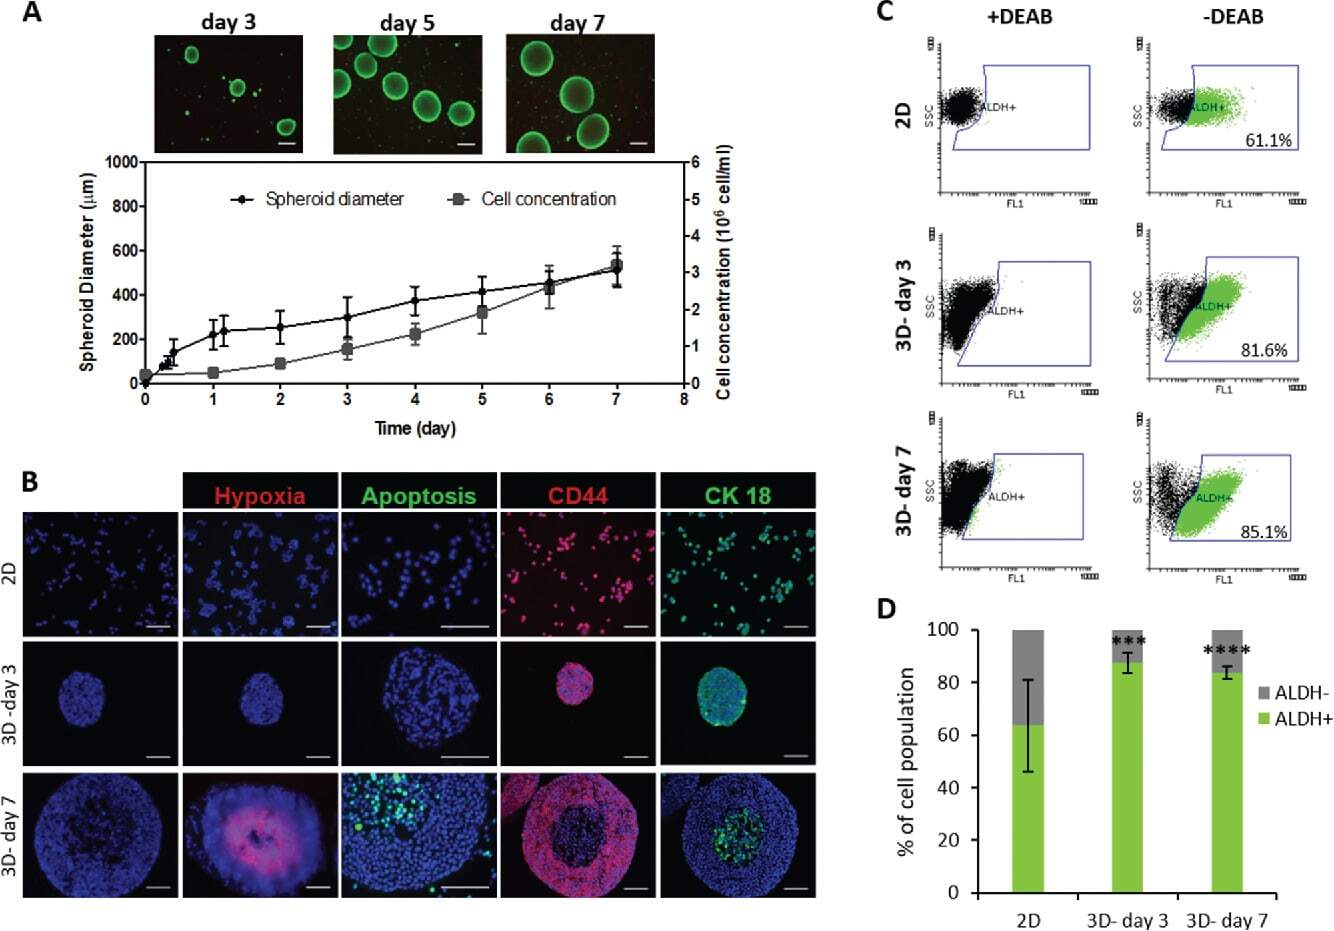
- Submitted by
- Invitrogen Antibodies (provider)
- Main image
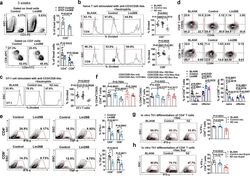
- Experimental details
- Fig. 4 N2-converted neutrophils inhibit T cell proliferation, activation and Th1 differentiation. a Representative flow cytometry plots and percentage of the indicated T cell subsets in the pre-metastatic lung ( n = 6 mice in each group). b CFSE-labeled CD4 + or CD8 + splenocytes were stimulated with anti-CD3/CD28 antibodies and mixed without (BLANK) or with neutrophils purified from lungs of tumor-bearing mice. The percentage of proliferating T cells is shown ( n = 6 culturing experiments). c CFSE-labeled OT-1 splenocytes (CD8 + ) were mixed with OVA 257-264 -pulsed bone marrow-derived DCs and neutrophils as in panel b. The percentage of proliferating T cells is shown ( n = 6 culturing experiments). d CD4 + and CD8 + T cells in the pre-metastatic lung were subjected to CD44 and CD62L staining. Representative contour plots and summary data were shown ( n = 6 mice in each group). e The expression of IFN-gamma and TNF-alpha were analyzed in CD4 + and CD8 + T cells in the pre-metastatic lung ( n = 6 mice in each group). f CD4 + and CD8 + T cells were purified from naive mice's spleen stimulated with anti-CD3/CD28 antibodies and mixed with the indicated neutrophils. Twenty-four hours later, the cell fraction adopting a CD44 + CD62L - phenotype was determined by flow cytometry ( n = 6 culturing experiments). g Naive CD4 + T cells were stimulated under Th1-stimulating conditions in the presence of the indicated lung neutrophils. Four days later, the cells were re-stimulated with PM
- Conjugate
- Biotin
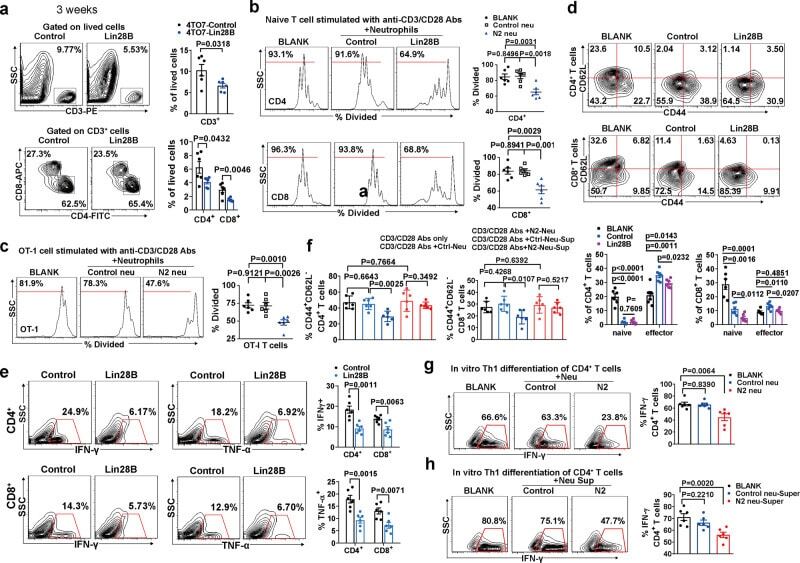
- Submitted by
- Invitrogen Antibodies (provider)
- Main image
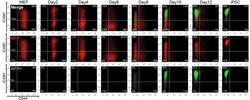
- Experimental details
- Figure 1 FACS analysis during 2deg reprogramming of MEF with CD44/ICAM1 double staining Loss of CD44 expression was rapidly followed by ICAM1 upregulation and Nanog-GFP expression. By day 12 the majority of cells displayed an ICAM + /CD44 - ESC-like profile. Red; Nanog-GFP - cells, Green; Nanog-GFP + cells.
- Conjugate
- Biotin
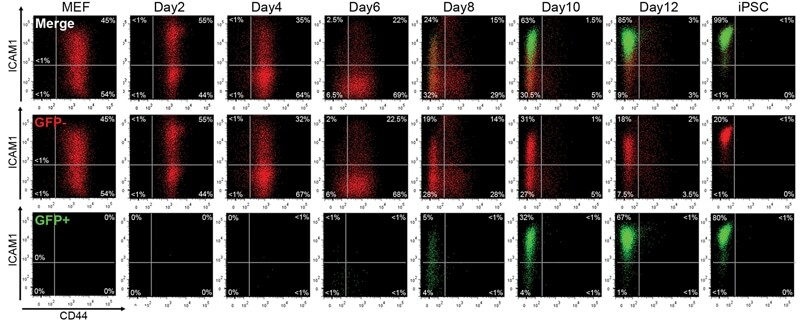
- Submitted by
- Invitrogen Antibodies (provider)
- Main image
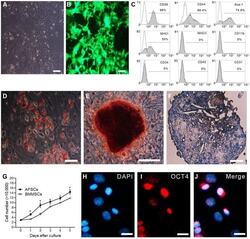
- Experimental details
- Figure 1 Characterization of EGFP-AFSCs in culture. (A) Amniotic fluid stem cells (AFSCs) (third passage) exhibit fibroblast-like morphology and adhere to the surface of plastic cell culture dishes. (B) Harvested AFSCs express enhanced green fluorescence protein (EGFP). (C) Immunophenotypes of AFSCs at their third passage expressed markers of mesenchymal stem cells (MSCs) but not those of hematopoietic and endothelial cells. The black histograms indicate the respective isotype control. (D) Oil Red O staining after 14 days of culture in adipogenic medium showed adipogenic differentiation potential of AFSCs. (E) Alizarin Red S (ARS) staining after 21 days of culture in osteogenic medium showed osteogenic differentiation potential of AFSCs. (F) Toluidine blue O staining after 21 days culture in induction chrondrogenic medium showed chondrogenic differentiation potential of AFSCs. Scale bars = 100 um. (G) Proliferation ability of EGFP-AFSCs (third passage) was better than that of bone marrow MSCs (BMMSCs) (third passage) (n = 3). Data represent the mean +- standard error of mean (S.E.M.) * P
- Conjugate
- Biotin

- Submitted by
- Invitrogen Antibodies (provider)
- Main image
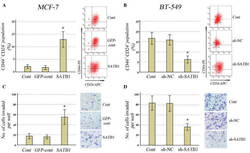
- Experimental details
- Figure 2 Effects of SATB1 expression on the CD44 + /CD24 - population and invasive properties of human breast cancer cell lines. Populations of CD44 + /CD24 - in (A) MCF-7 cells with SATB1 overexpression and (B) BT-549 cells with SATB1 knockdown, with representative images from the CD44/CD24 flow cytometric analysis. Invasiveness in (C) MCF-7 cells with SATB1 overexpression and (D) BT-549 cells with SATB1 knockdown, and representative images taken from the invasion assays (magnification, x20). All data are presented as the mean +- standard deviation of two independent experiments in triplicate; * P
- Conjugate
- Biotin
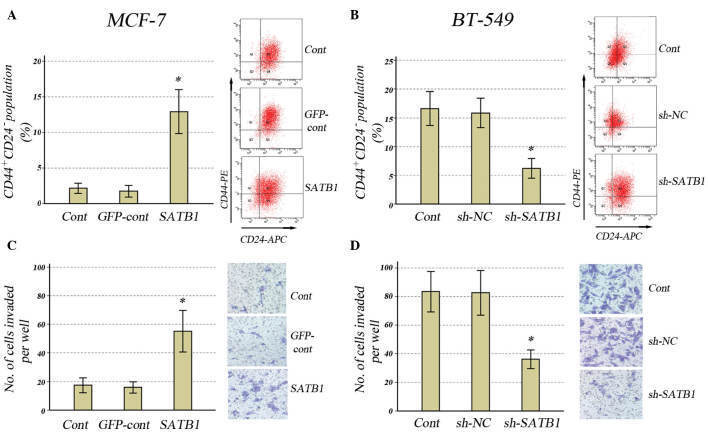
- Submitted by
- Invitrogen Antibodies (provider)
- Main image
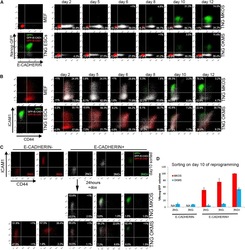
- Experimental details
- Figure 3 Inefficient Reprogramming Progression of OKMS Reprogramming Intermediates (A) E-CAD and Nanog -GFP expression changes during TNG MKOS/OKMS reprogramming. Red indicates E-CAD - Nanog -GFP - , white indicates E-CAD + Nanog -GFP - , and green indicates E-CAD + Nanog -GFP + . (B) CD44 and ICAM1 expression changes during TNG MKOS/OKMS reprogramming with E-CAD, Nanog -GFP expression color codes in (A). (C) Flow cytometry analysis of sorted day-10 E-CAD -/+ 2NG- ( Nanog -GFP - CD44 - ICAM1 - ), 3NG - ( Nanog -GFP - CD44 - ICAM1 + ), and 3NG + ( Nanog -GFP + CD44 - ICAM1 + ) cells after a 24-hr culture. dox, doxycycline. (D) E-CAD -/+ 2NG - , 3NG - , and 3NG + ( Nanog -GFP + CD44 - ICAM1 + ) cells on day 10 were seeded at clonal density, and Nanog -GFP + iPSC colonies were counted after 10 days of further culture. The graph depicts the relative Nanog -GFP + CFA compared to that of MKOS 3NG + cells. Error bars represent SD; n = 3 independent experiments.
- Conjugate
- Biotin
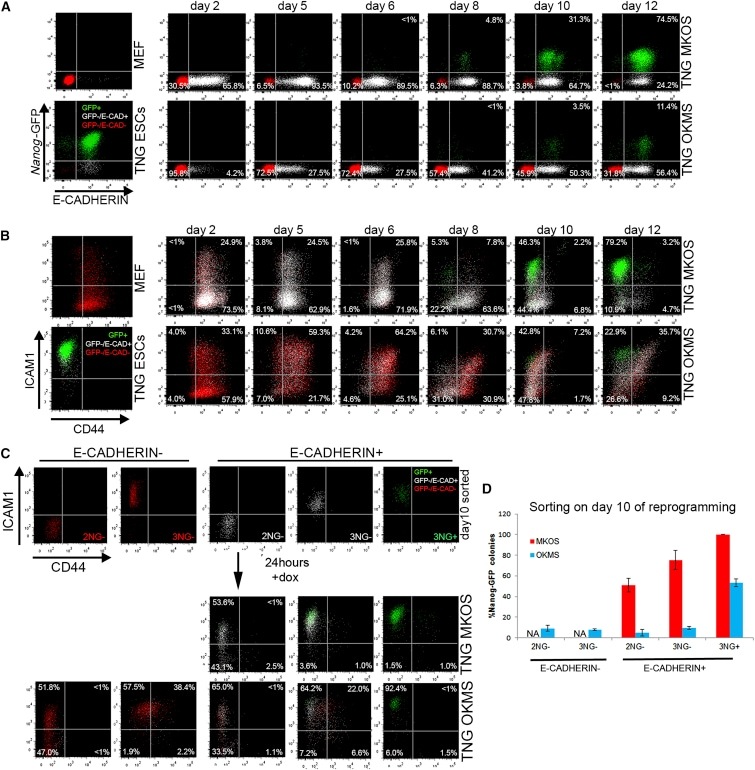
- Submitted by
- Invitrogen Antibodies (provider)
- Main image
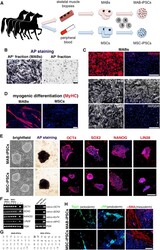
- Experimental details
- Figure 1 Generation of Equine MAB- and MSC-iPSCs in Isogenic Conditions (A) Schematic experimental plan. (B) AP activity staining on AP + (positive signal) and AP - (background signal) cell fractions from the skeletal muscle. (C) Immunofluorescence staining for pericytic markers and related isotypes of equine MABs (AP + cells). (D) MyHC immunofluorescence staining of equine MABs and MSCs after serum starvation. Myogenic differentiation is apparent as multinucleated myotubes. (E) Panel of pluripotency characterization for equine iPSCs. (F) (Left) RT-PCR with specifically cross-reacting (equine-human) primers (eq-, negative equine control, parental cells; hu+, human positive control, H9 ESCs; rt-, negative control of reverse transcription). (Right) RT-PCR for expression of retroviral (retrov-) reprogramming factors (ct+, positive control, fibroblasts freshly transduced with the reprogramming retroviruses). (G) Euploid karyograms of equine iPSCs at passage 3. (H) Immunofluorescence analysis for markers of ectodermal (TUJ1 + ), endodermal (alphaFP + ), and mesodermal (alphaSMA + ) derivative cells after spontaneous iPSC differentiation. All results shown were obtained from cell clones from all three donors (n = 3 independent experiments/cell type). Scale bars, 100 mum.
- Conjugate
- Biotin
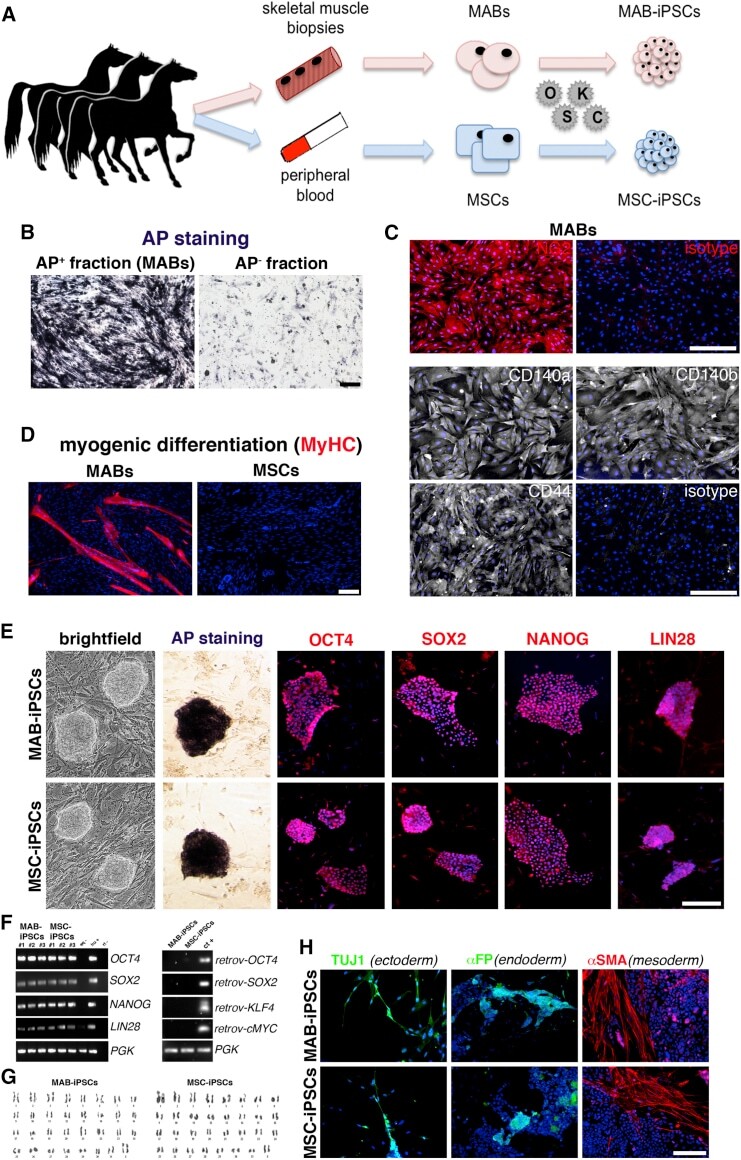
- Submitted by
- Invitrogen Antibodies (provider)
- Main image
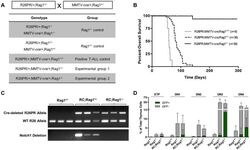
- Experimental details
- Fig. 3. RAG recombination-impaired R26PR;cre mice do not develop leukemia or carry Notch1 deletions. (A) Breeding scheme and genotype grouping of Rag1 mutant mouse lines. (B) Overall survival of R26PR;MMTV-cre; Rag1 +/+ ( n =8), R26PR;MMTV-cre; Rag1 +/- ( n =38), and R26PR;MMTV-cre; Rag1 -/- ( n =39) mice. (C) PCR-based verification of R26PR allele status following exposure to Cre recombinase (upper) and PCR-based detection of Notch1 deletion status in R26PR;MMTV-cre mice with or without Rag1 (lower). RC, R26PR;MMTV-cre. (D) Flow cytometric analyses of early thymocyte development in the thymi of Rag1 +/- ( n =13), Rag1 -/- ( n =15), and R26PR;MMTV-cre; Rag1 -/- ( n =14) mice. Thymocytes were stained for CD4, CD8, c-kit, CD44, and CD25, then double negative (DN; CD4 - CD8 - ) cells were separated into stages according the expression of c-kit, CD44, and CD25. ETPs, CD4 - CD8 - CD44 + CD25 - c-kit + ; DN1, CD4 - CD8 - CD44 + CD25 - ; DN2, CD4 - CD8 - CD44 + CD25 + ; DN3, CD4 - CD8 - CD44 - CD25 + ; DN4, CD4 - CD8 - CD44 - CD25 - . GFP-positive and -negative cells are displayed as green and gray bars, respectively, and mean+-s.d. is shown for all graphs. RC, R26PR;MMTV-cre.
- Conjugate
- Biotin
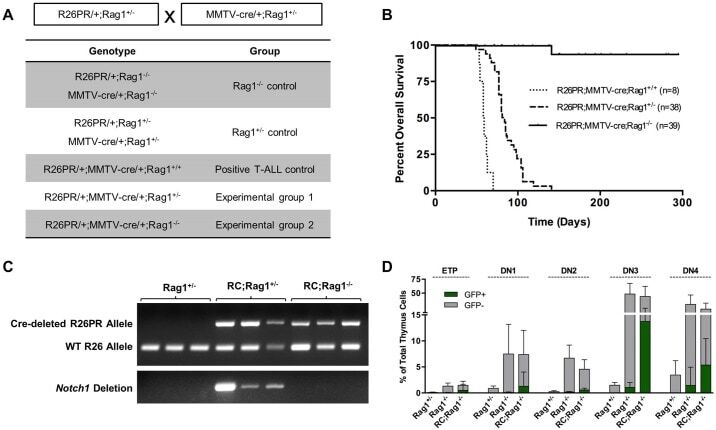
- Submitted by
- Invitrogen Antibodies (provider)
- Main image

- Experimental details
- Fig. 1 Traditional phenotyping of clinical-grade adipose-derived mesenchymal stromal cells (AMSCs) expanded in human platelet lysate. a Clinical-grade AMSCs grown in human platelet lysate were expanded ex vivo and immunophenotyped using flow cytometry according to the release criteria presented in this table. b Representative flow cytometry scatter plots show AMSCs are a homogeneous population of cells and exhibit surface expression of standard cell surface markers, including CD105, CD44, CD73, and CD90, and are negative for HLA-DR. c Analysis of the flow cytometry release criteria across clinical-grade AMSCs from 15 donors demonstrated minimal variability in the population frequency (% Gated) of the surface markers. All AMSC donor cells were >85 % positive for CD90, CD105, CD73, CD44, and HLA-ABC, and were
- Conjugate
- Biotin
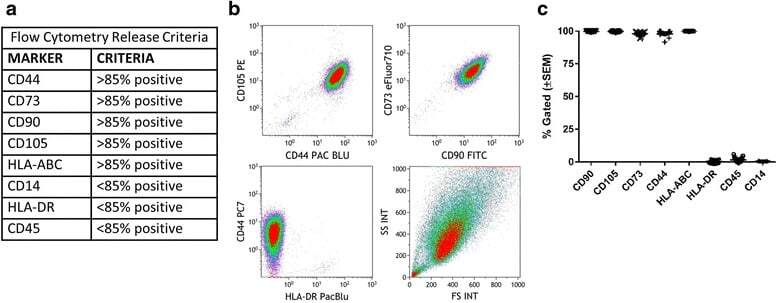
- Submitted by
- Invitrogen Antibodies (provider)
- Main image
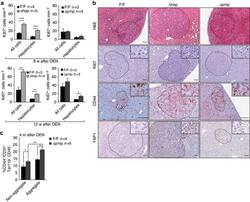
- Experimental details
- Figure 2 RAF1 ablation increases the number of cancer progenitor cells. ( a ) Quantification of Ki67+ liver cells 8 (top panel) or 12 weeks (bottom panel) after DEN treatment. ( b ) Foci of altered hepatocytes (FAH) in F/F and Deltahep or Deltap/np livers isolated 12 weeks after DEN injection. Sections were stained with H&E or with the indicated antibodies. FAH are delimited by dotted circles ( n =3 per genotype). Scale bars, 50 mum. ( c ) Percentage of cancer progenitor cells (CD44+/CD31-Ter119-CD45-) present in non-aggregate and aggregate fractions of F/F and Deltap/np livers, as determined by FACS analysis. Data are represented as mean+-s.e.m., * P
- Conjugate
- Biotin
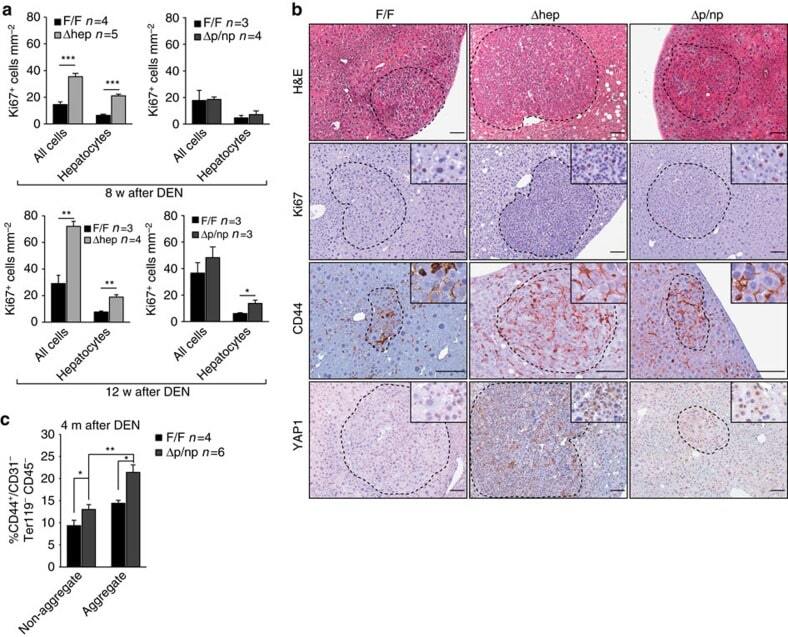
- Submitted by
- Invitrogen Antibodies (provider)
- Main image
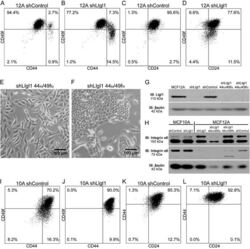
- Experimental details
- Figure 2 Llgl1 regulates expression of cell lineage markers A. - D. , I. - L. Cells were incubated with the indicated cell lineage marker and sorted by FACS. A. - D. MCF12A shControl vs shLlgl1 (under normal growth conditions) were incubated with anti-CD49f-PE, anti-CD44-APC, and/or anti-CD24-FITC. E. and F. MCF12A shLlgl1 were sorted based on CD44/CD49f expression, CD444 hi /CD49f lo (E) and CD44 lo /CD49f hi (F). G. Protein lysates were isolated and analyzed by immunoblot using anti-Llgl1 and anti-betaactin antibodies. H. Protein lysates were analyzed by immunoblot using anti-Integrin alpha6 and anti-betaactin. (I-L) MCF10A shControl vs shLlgl1 (under normal growth conditions) were incubated with anti-CD49f-PE, anti-CD44-APC, and/or anti-CD24-FITC.
- Conjugate
- Biotin
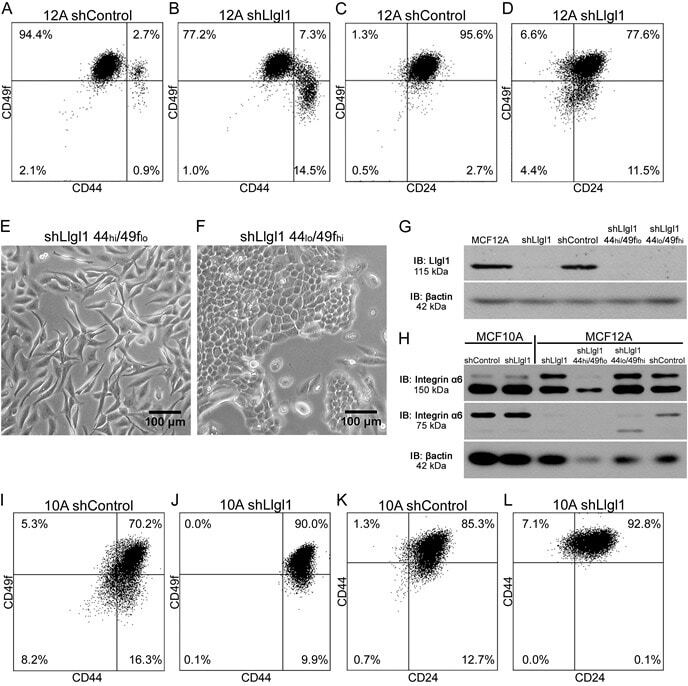
- Submitted by
- Invitrogen Antibodies (provider)
- Main image
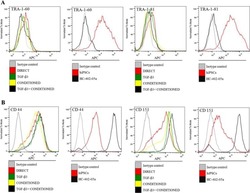
- Experimental details
- Fig. 4 The lack of pluripotency markers TRA-1-60 and TRA-1-81 in the differentiated human-induced pluripotent stem cells (hiPSCs) was confirmed using flow cytometry ( a ). The chondrogenic markers CD44 and CD151 were observed in these cells
- Conjugate
- Biotin
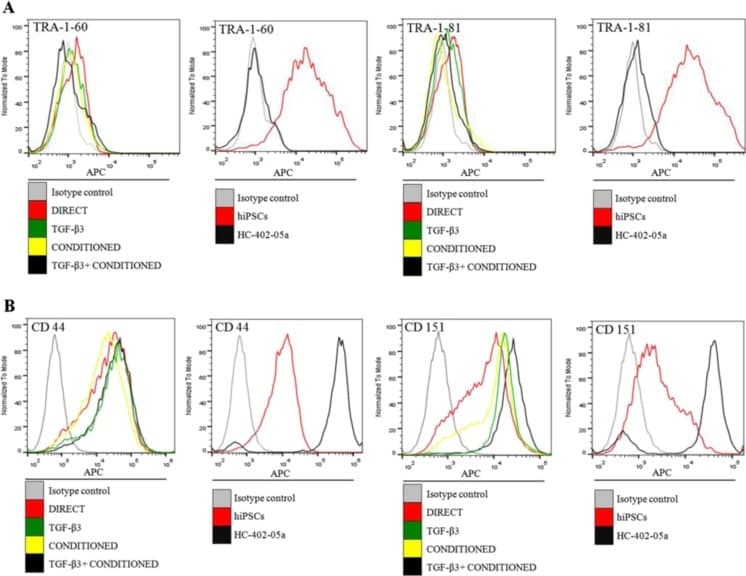
- Submitted by
- Invitrogen Antibodies (provider)
- Main image
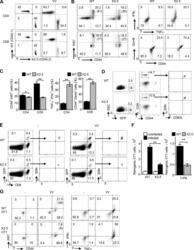
- Experimental details
- Figure 4. Egr2 and 3 function is cell intrinsic. (A-C) Irradiated WT mice were adoptively transferred with an equal number of BM cells from WT and CD2-Egr2/3 -/- (K2-3) mice. 8 wk after transfer, mice were infected with OVA-VV WR and analyzed 7 d after infection. (A) Splenic cells from chimeric mice were stained with CD45.1, CD45.2, CD4, and CD8, and the proportion of WT (CD45.1) and K2-3 (CD45.2) CD4 and CD8 cells was determined by flow cytometry. (B and C) Gated WT (CD45.1) and K2-3 (CD45.2) CD4 and CD8 cells were analyzed for expression of the activation marker CD44 and the proliferation marker Ki67 (left) and TNF and IFNgamma for CD4 cells and granzyme B for CD8 cells (right). The percentages of Ki67 + cells among the CD44 high population are indicated in parentheses in B. (D-G) WT and K2-3 OT1 retrogenic T cells were analyzed in recipient mice before and after infection. (D) GFP + CD8 + CD44 lo cells were isolated from WT and K2-3 OT1 retrogenic mice (left and middle) and confirmed as CD62L + Kb-SIINFEKL-tetramer + cells (right). 3 x 10 5 to 5 x 10 5 WT or Egr2/3 -/- retrogenic-OT1 cells were adoptively transferred to separate naive WT mice. 1 d after transfer, mice were infected with OVA-VV WR and analyzed 7 d after infection. (E and F) Retrogenic-OT1 GFP + CD8 + Kb-SIINFEKL-tetramer + cells among spleen and lymph node cells from recipient mice were identified (E), and the numbers of WT and K2-3 retrogenic-OT1 cells in spleen and lymph nodes (left) and lung (right) were
- Conjugate
- Biotin
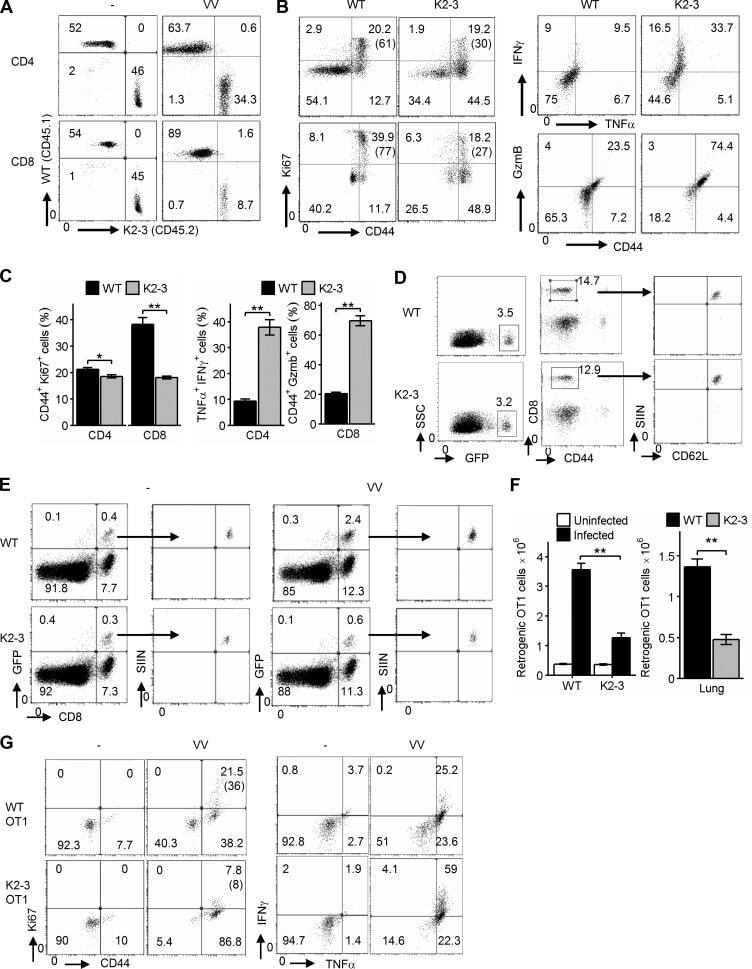
- Submitted by
- Invitrogen Antibodies (provider)
- Main image
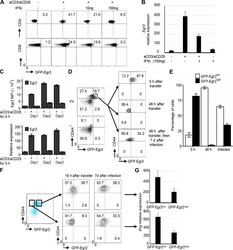
- Experimental details
- Figure 9. Egr2 and 3 expression is repeatedly temporally regulated by TCR signaling in activated T cells. (A and B) Naive CD4 and CD8 T cells were stimulated with the indicated stimuli for 16 h before analysis of GFP-Egr2 expression (A) or Egr3 expression by RT-PCR (B). (C) Naive CD4 T cells were repeatedly stimulated with 2 ug/ml anti-CD3 and 2 ug/ml CD28 for 5 h with 19-h intervals over a 3-d period. Egr2 MFI was analyzed by flow cytometry, and Egr3 expression was analyzed by RT-PCR, before and after each interval. (D and E) CD44 high GFP-Egr2 high CD45.2 + CD8 T cells from GFP-Egr2 knock-in mice 7 d after infection were sorted and adoptively transferred into CD45.1 + WT mice. Recipient mice were infected with OVA-VV WR i.n. 48 h after transfer. Recipients were analyzed for Egr2 expression 5 or 48 h after transfer or 7 d after viral infection, as indicated. (F and G) CD44 high GFP-Egr2 high CD8 + and CD44 high GFP-Egr2 low CD8 + cells were isolated from CD45.2 + GFP-Egr2 knock-in mice after infection with OVA-VV WR for 7 d and then adoptively transferred into CD45.1 + WT mice. (F) GFP-Egr2 expression was examined 16 h after transfer or 7 d after OVA-VV WR infection. (G) IFNgamma expression by CD44 high GFP-Egr2 high CD8 + cells and CD44 high GFP-Egr2 low CD8 + cells isolated from infected recipient mice was analyzed by RT-PCR. Data in B and G are means +- SD, and data in C and E are means +- SEM. Data in A-C are representative of three independent experiments. Data in D-G a
- Conjugate
- Biotin
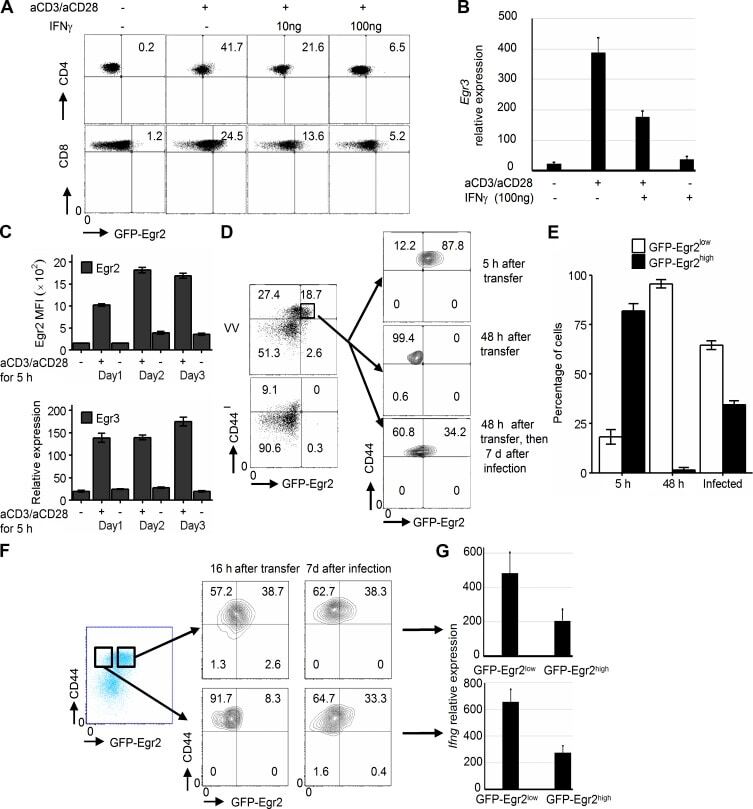
- Submitted by
- Invitrogen Antibodies (provider)
- Main image
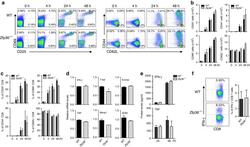
- Experimental details
- Fig. 2 Zfp36 -/- CD8 + T-cells have no intrinsic defect in IFN-gamma production. a Naive CD8 T-cells from WT and Zfp36 -/- mice were stimulated by plate-coated alpha-CD3/CD28 Abs (1 mug/ml). CD69, CD25, CD44 and CD62L surface expression were detected by FACS at different time points as indicated. b , c Quantitative data represent means +- s.d. of numbers b and percentages c of CD69 + , CD25 + , CD44 + and CD62L + CD8 T-cells as in a from three independent experiments. d Purified naive CD8 T-cells from WT and Zfp36 -/- mice were stimulated by plate-coated alpha-CD3/CD28 Abs (1 mug/ml) for 72 h. Then the expression of IFN-gamma, T-bet, Eomes, TNF, Blimp-1 and ZEB2 mRNAs were detected by qRT-PCR. The qRT-PCR data were normalized relative to GAPDH mRNA levels and further normalized to the results from WT group. Results of three independent experiments shown are means +- s.e.m. e IFN-gamma and TNF levels in cell supernatants as in a were detected by ELISA. Quantitative data shown are means +- s.d. from three independent experiments. f Naive CD8 + T-cells from WT and Zfp36 -/- mice were stimulated by plate-coated alpha-CD3/CD28 Abs (1 mug/ml) for 3 days, rested for 3 days, and then stimulated by PMA and Ionomycin in the presence of GolGistop for 4 h. IFN-gamma was detected by FACS gated on CD8 T-cells. Quantitative data shown are means +- s.d. from three independent experiments. Data are analyzed with unpaired students' t -test as in b - f , * p < 0.05
- Conjugate
- Biotin
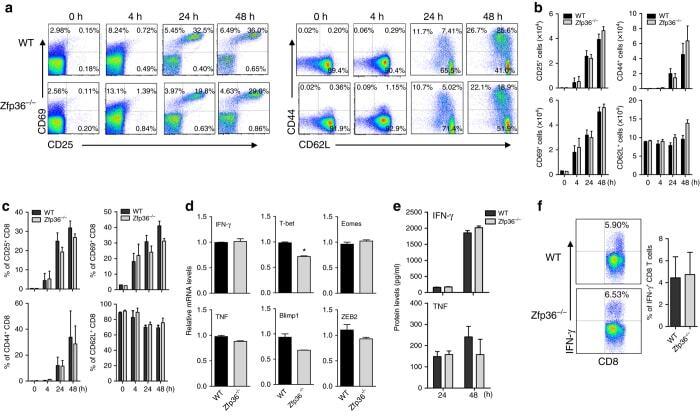
- Submitted by
- Invitrogen Antibodies (provider)
- Main image

- Experimental details
- Fig. 3 cGVHD is associated with expansion of PSGL-1 lo CD4 + T cells. BALB/c recipients were irradiated (850 cGy) and given 2.5 x 10 6 TCD-BM or 2.5 x 10 6 TCD-BM plus 1 x 10 6 splenocytes from C57BL/6 donors. a , b Twenty-one, 30, and 45 days after HCT, spleen and lung were harvested. Splenocytes and mononuclear cells isolated from lung were stained for CD4, CD44, PSGL-1, and CD62L. Gated CD4 + CD44 hi are shown as PSGL-1 versus CD62L. PSGL-1 low and CD62L low cells were gated as extrafollicular CD4 + T cells. Percentages of PSGL-1 lo CD62L lo cells among CD4 + CD44 hi cells are shown as mean +- SE ( n = 8). c Twenty-one days after HCT, splenocytes from no-GVHD or cGVHD recipients given wild-type C57BL/6 transplants were harvested and stained for CD4, CD44, PSGL-1, and CD62L. CD44 hi CD62L lo PSGL-1 lo CD4 + T cells were sorted and used for RNA isolation and RNA-Seq microarray analysis. Heat maps of RNA expression of CXCR4, CXCR5, and CCR7 are shown as mean centered log 2 expression. RNA-Seq microarray measurements were performed on duplicate samples from no-GVHD group and cGVHD group. Each sample represents splenocytes from eight recipients. d Twenty-one days after HCT, sorted CD4 + CD44 hi PSGL-1 lo CD62L lo cells were stimulated with PMA and ionomycin for 24 h. Stimulated cells were stained and are shown as CD4 versus IFN-gamma, IL-13, IL-17, or IL-21. Percentages of CD4 + IFN-gamma + , CD4 + IL-13 + , CD4 + IL-17 + , or CD4 + IL-21 + cells among CD4 + T cells are shown a
- Conjugate
- Biotin
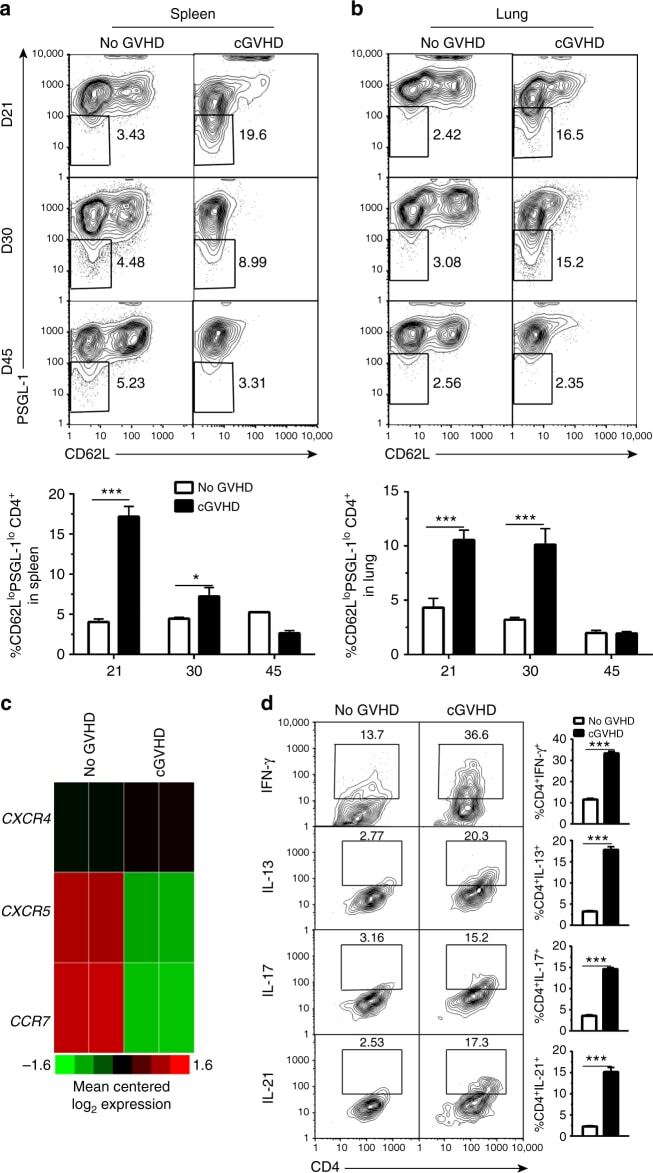
- Submitted by
- Invitrogen Antibodies (provider)
- Main image
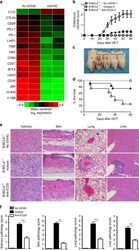
- Experimental details
- Fig. 4 Anti-ICOS treatment ameliorates cGVHD in recipients without GC formation. a As described in Fig. 3 , 21 days after HCT, splenocytes from no-GVHD or cGVHD recipients given wild-type C57BL/6 donor cells were harvested and stained for CD4, CD44, PSGL-1, and CD62L. CD44 hi CD62L lo PSGL-1 lo CD4 + T cells were sorted and used for RNA isolation and RNA-Seq microarray analysis. Heat maps of RNA expression levels of costimulatory and coinhibitory markers are shown as mean centered log 2 expression. RNA-Seq microarray measurements were performed on duplicate samples from no-GVHD group and cGVHD group. Each sample represents splenocytes from eight recipients. b - f BALB/c recipients were irradiated (850 cGy) and given either 2.5 x 10 6 TCD-BM ( n = 8) or 2.5 x 10 6 TCD-BM plus 1 x 10 6 splenocytes ( n = 12) from B-BCL6 -/- C57BL/6 donors. Recipients given 2.5 x 10 6 TCD-BM plus 1 x 10 6 splenocytes were treated with anti-ICOS or isotype control of rat IgG2b, 200 ug/mouse i.p., starting on day 0 and repeated every other day until day 45 after HCT. Chronic GVHD was monitored. b Cutaneous cGVHD score (Group 3 versus Group 2: P < 0.001 two-way ANOVA). c Picture taken on day 60 after HCT(1-no-GVHD, 2-isotype, 3-anti-ICOS). d Survival curve (Group 3 versus Group 2: P < 0.05, log-rank test). e H&E staining of salivary gland, skin, lung, and liver. f Pathology scores of cGVHD for salivary gland, skin, lung, and liver are shown as mean +- SE ( n = 6). ** P < 0.01, unpaired two-tailed St
- Conjugate
- Biotin
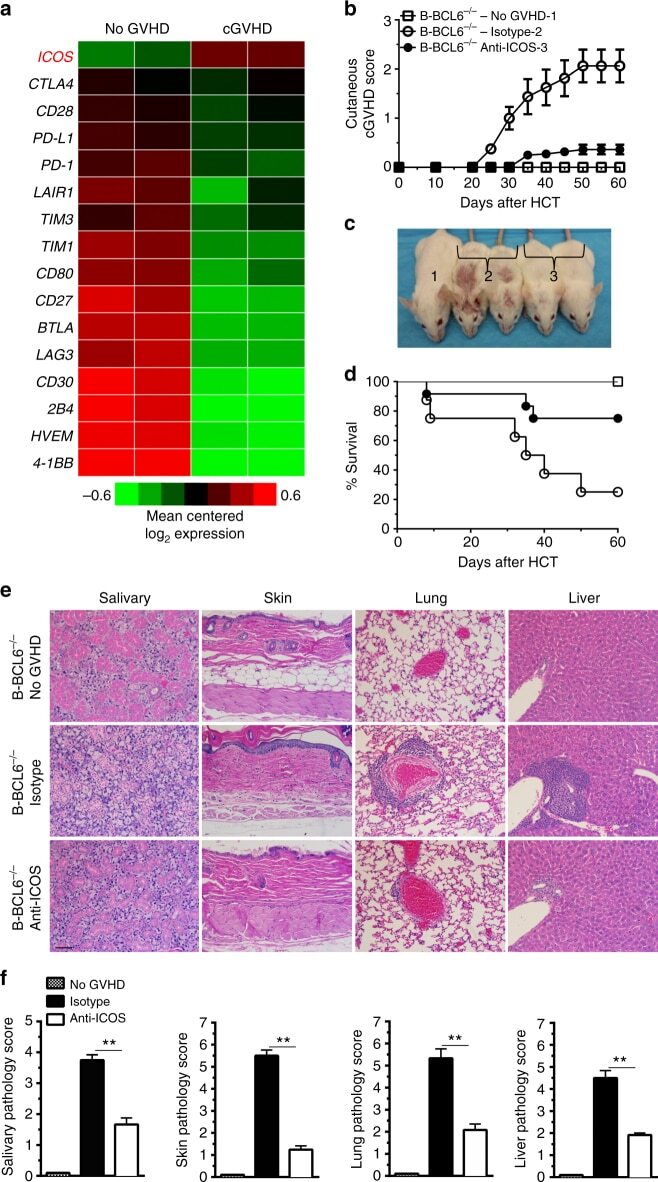
- Submitted by
- Invitrogen Antibodies (provider)
- Main image
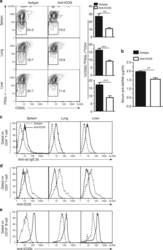
- Experimental details
- Fig. 5 Anti-ICOS treatment reduces PSGL-1 lo CD4 + T-cell expansion. As described in Fig. 4 , BALB/c recipients were irradiated (850 cGy) and given 2.5 x 10 6 TCD-BM plus 1 x 10 6 splenocytes. Recipients were treated with anti-ICOS or control rat IgG2b (200 ug/mouse i.p.) every other day from day 0 to day 45 after HCT. a Twenty-one days after HCT, mononuclear cells from spleen, lung, and liver were stained for CD4, CD44, PSGL-1, and CD62L. Gated CD4 + CD44 hi cells are shown as PSGL-1 versus CD62L ( n = 8). b Serum anti-dsDNA was measured at 45 days after HCT. c - e Twenty-one days after HCT, mononuclear cells from spleen, lung, and liver were stained with CD4, anti-rat IgG2b, or anti-ICOS, or stained with anti-CD19 and anti-ICOSL. Gated CD4 + T cells are shown as anti-rat IgG2b ( c ) or anti-ICOS ( d ) staining. e Gated CD19 + B cells are shown as ICOSL staining. One representative of four experiments is shown. ** P < 0.01, *** P < 0.001, unpaired two-tailed Student's t test
- Conjugate
- Biotin

- Submitted by
- Invitrogen Antibodies (provider)
- Main image
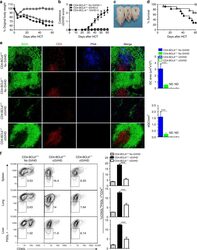
- Experimental details
- Fig. 6 BCL6 deficiency in donor CD4 + T cells prevents expansion of PSGL-1 lo CD4 + T cells and cutaneous cGVHD. BALB/c recipients were irradiated (850 cGy) and given 2.5 x 10 6 TCD-BM alone or 2.5 x 10 6 TCD-BM plus 1 x 10 6 splenocytes from either WT or B-BCL6 -/- C57BL/6 donors ( n = 12). cGVHD was monitored. a Percent body weight changes. b Cutaneous cGVHD scores (Group 3 versus Group 2: P < 0.001 two-way ANOVA). c Picture taken at day 60 after HCT (1 and 2-CD4-BCL6 +/+ no GVHD and GVHD, 3-CD4-BCL6 -/- GVHD). d Survival curve. e Sixty days after transplantation, spleens were harvested, and germinal centers were identified by immunofluorescent staining of B220, CD3, and PNA. GC area and numbers were measured and are shown as mean +- SE ( n = 4). f Twenty-one days after HCT, mononuclear cells from spleen, lung, and liver were stained for CD4, CD44, PSGL-1, and CD62L. Gated CD4 + CD44 hi cells are shown as PSGL-1 versus CD62L. Percentages of CD62L lo PSGL-1 lo cells among CD4 + CD44 hi are shown as mean +- SE ( n = 8). *** P < 0.001, unpaired two-tailed Student's t test. CD4-BCL6 +/+ no-GVHD = CD4-BCL6 +/+ TCD-BM; CD4-BCL6 -/- no-GVHD = CD4-BCL6 -/- TCD-BM; CD4-BCL6 +/+ cGVHD = CD4-BCL6 +/+ TCD-BM + CD4-BCL6 +/+ splenocytes; CD4-BCL6 -/- cGVHD = CD4-BCL6 -/- TCD-BM + CD4-BCL6 -/- splenocytes. Scale bar , 50 um
- Conjugate
- Biotin

- Submitted by
- Invitrogen Antibodies (provider)
- Main image
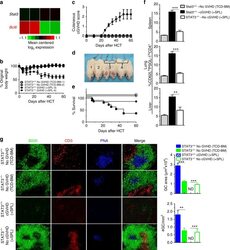
- Experimental details
- Fig. 7 Stat3 deficiency in donor CD4 + T cells prevents expansion of PSGL-1 lo CD4 + T cells and systemic cGVHD. a Twenty-one days after HCT, splenocytes from no-GVHD or cGVHD recipients given wild-type C57BL/6 donors were harvested and stained for CD4, CD44, PSGL-1, and CD62L. CD44 hi CD62L lo PSGL-1 lo CD4 + T cells were sorted and used for RNA isolation and RNA-Seq microarray analysis. Heat maps of RNA expression of transcription factor in extrafollicular T cells are shown as mean centered log 2 expression. RNA-Seq microarray measurements were performed on duplicate samples from no-GVHD and cGVHD groups. Each sample represents splenocytes from eight recipients. b - g BALB/c recipients were irradiated (850 cGy) and given 2.5 x 10 6 TCD-BM alone or 2.5 x 10 6 TCD-BM plus 1 x 10 6 splenocytes ( n = 12) from either WT or CD4-STAT3 -/- C57BL/6 donors. b Percent body weight changes (Group 3 versus Group 4: P < 0.001, two-way ANOVA). c Cutaneous cGVHD scores (Group 3 versus Group 4: P < 0.001, two-way ANOVA). d Picture taken on day 60 after HCT (1 and 3-Stat3 +/+ -no GVHD and cGVHD, 2 and 4-Stat3 -/- -no GVHD and cGVHD). e Survival curve (Group 3 versus Group 4: P < 0.05, log-rank test). f Twenty-one days after HCT, mononuclear cells from spleen, lung, and liver were stained with CD4, CD44, PSGL-1, and CD62L. Percentages of CD62L lo PSGL-1 lo cells among CD4 + CD44 hi are shown as mean +- SE ( n = 6). g Sixty days after transplantation, spleens were harvested and germinal centers
- Conjugate
- Biotin
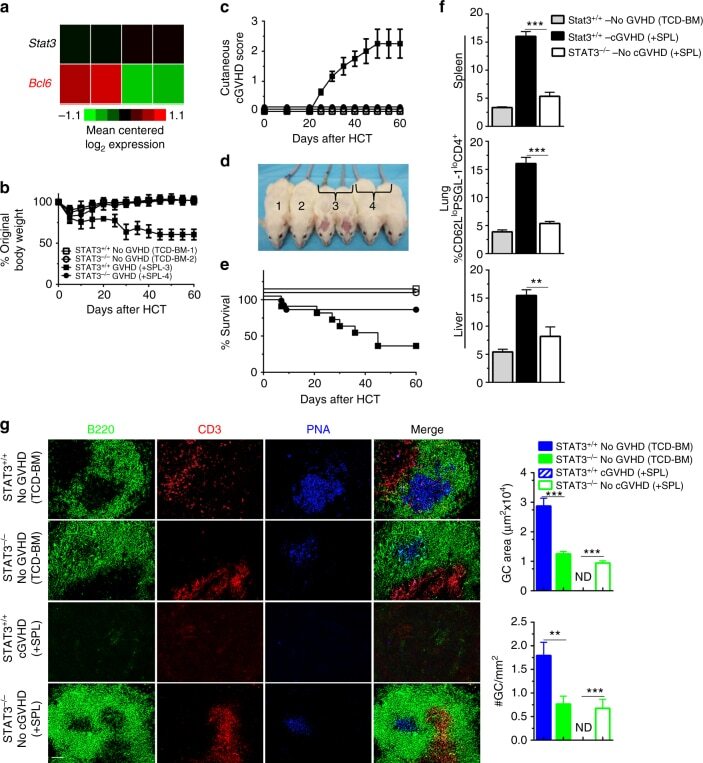
- Submitted by
- Invitrogen Antibodies (provider)
- Main image

- Experimental details
- Fig. 8 Thymus recovery in recipients given Stat3 -/- transplants is associated with reduced PSGL-1 lo CD4 + T-cell infiltration in the thymus. BALB/c recipients were conditioned with 850 cGy TBI and given 2.5 x 10 6 TCD-BM plus 1 x 10 6 splenocytes from either WT or CD4-Stat3 -/- C57BL/6 donors. a , b 10 days ( a ) and 30 days ( b ) after HCT, thymus specimens were harvested and stained with CK8 for the cortex and UEA-1 for the medulla epithelial cells. Percentage of CD4 + CD8 + thymocytes was measured with flow cytometry. c Ten days after HCT, spleen and thymus were harvested and stained for CD4, CD44, PSGL-1, and CD62L. Gated CD4 + CD44 hi are shown as PSGL-1 versus CD62L. PSGL-1 lo CD62L lo CD4 + CD44 hi cells were identified as extrafollicular PSGL1 lo CD4 + T cells. Percentages of PSGL-1 lo CD4 + T cells among CD4 + CD44 hi cells are shown as mean +- SE ( n = 6). d CCR9 and FasL expression on splenic PSGL-1 1o CD4 + T cells were measured by flow cytometry and one representative histogram is shown ( n = 6). Scale bar , 50 um
- Conjugate
- Biotin
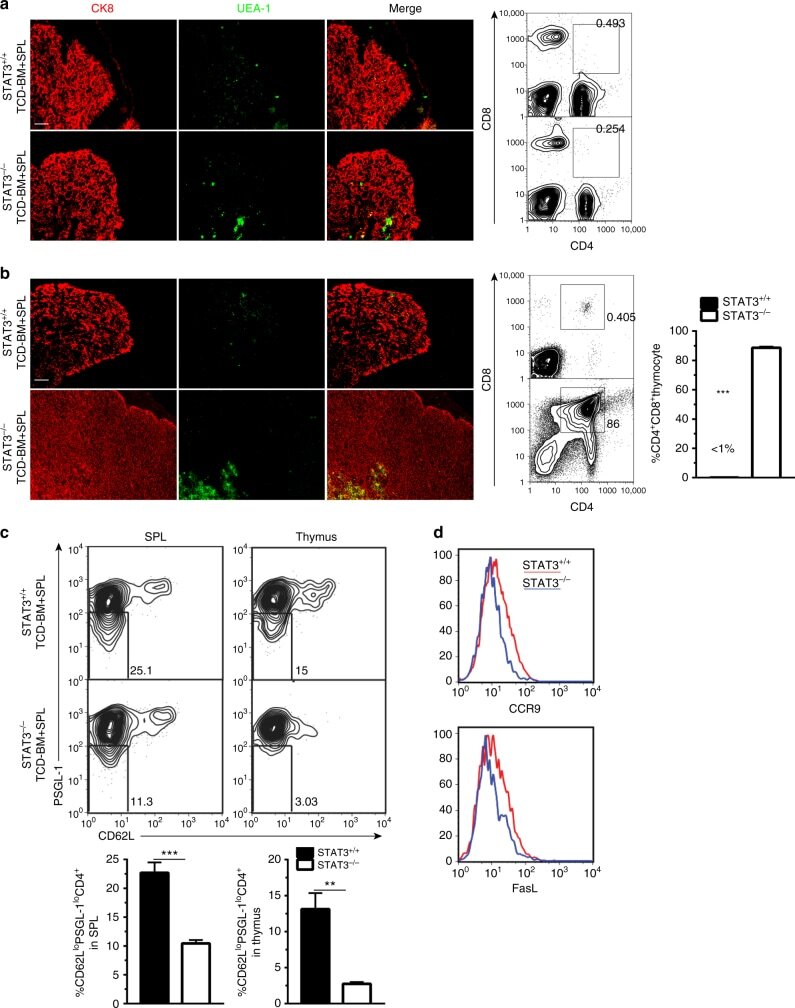
- Submitted by
- Invitrogen Antibodies (provider)
- Main image
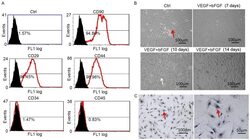
- Experimental details
- Figure 1. VEGF and bFGF promote the differentiation of MSCs into EC-like cells. (A) Expression of MSC surface markers was confirmed using flow cytometry. (B) Morphological features of isolated MSCs and MSC-derived EC-like cells following induction as observed under an inverted microscope. The red and white arrows indicate spindle-shaped and polygon-shaped cells, respectively. Magnification, x20. (C) Factor VIII expression was detected in MSC-derived EC-like cells via immunohistochemistry and light microscopy with brown staining indicating the positive signal. VEGF, vascular endothelial growth factor; bFGF, basic fibroblast growth factor; MSCs, mesenchymal stem cells; EC, endothelial cell; Ctrl, control; CD, cluster of differentiation.
- Conjugate
- Biotin
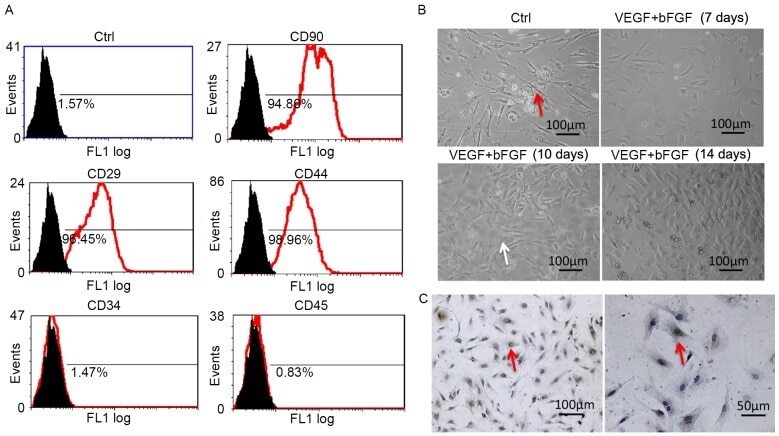
- Submitted by
- Invitrogen Antibodies (provider)
- Main image
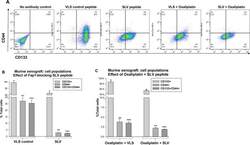
- Experimental details
- Figure 5 Fap1-inhibition decreases abundance of CD133 + CD44 + cells in in a murine xenograft model of colon cancer with or without oxaliplatin Tumors from the mice described above were analyzed for cell population distribution after various treatments. (A) Histograms from flow cytometry demonstrate decreased abundance of CD133 + CD44 + cells after treatment with SLV peptide with or without oxaliplatin. A representative histograms for each cohort is shown. (B) Treatment with SLV peptide decreases relative abundance of CD133 + CD44 + cells in xenograft tumors. Tumors were simultaneously harvested from mice treated with SLV peptide versus VLS control (when control group tumors were >2,000 mm 3 ) and analyzed for CD133 and CD44 expression by flow cytometry. Significant differences indicated by * , ** , or *** . (p2,000 mm 3 ) and analyzed for CD133 and CD44 expression by flow cytometry. Significant differences indicated by * , ** , or *** . (p
- Conjugate
- Biotin
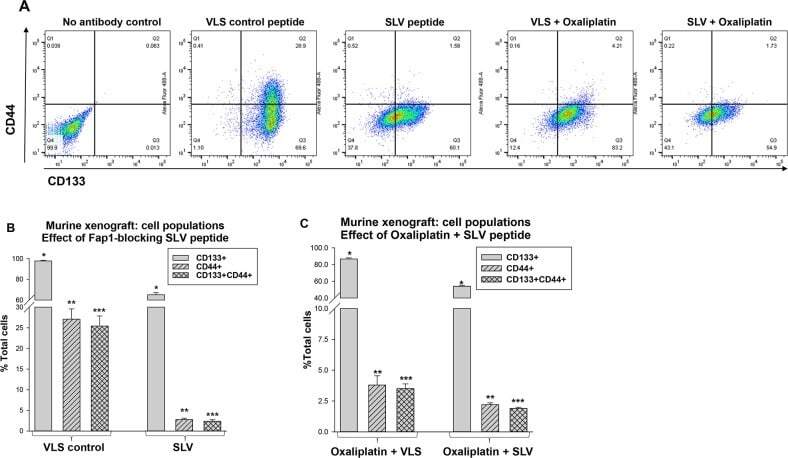
- Submitted by
- Invitrogen Antibodies (provider)
- Main image
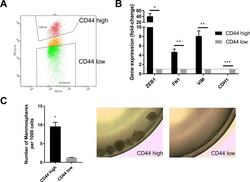
- Experimental details
- Figure 1--figure supplement 1. CD44 status serves as a marker for the mesenchymal and stem-like cell state in human mammary epithelial cells. ( A ) HMLER cells were stained with CD44-PE-CY7 antibody. CD44 high and low cell populations were sorted by flow cytometry. The gating for CD44 high and low cells is shown. ( B ) qPCR analysis of the expression of mesenchymal ( ZEB1 , FN1 and VIM ) and epithelial ( CDH1 ) markers in CD44 high and low HMLER cells. n = 4. *, p
- Conjugate
- Biotin

- Submitted by
- Invitrogen Antibodies (provider)
- Main image
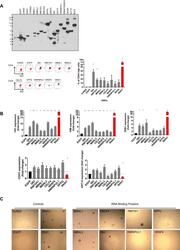
- Experimental details
- Figure 2--figure supplement 1. Functional validation of candidate RNA-binding proteins in cellular assays. ( A ) Validation of individual candidate ORFs by CD44 status. (Upper) Immunoblot analysis of ORF expression. The ORFs were tagged with a V5 epitope in the lentiviral expression vector (the TGFBR2 ORF contains a termination codon before the V5 tag). The expression of the indicated ORFs were analyzed using a V5 antibody. (Lower left) Flow cytometry plots of CD44 staining. The y-axis shows CD44 staining while the x-axis shows side scatter (SSC). (Lower right) Quantification of the percentage of CD44 high cells. n = 3, *, p
- Conjugate
- Biotin
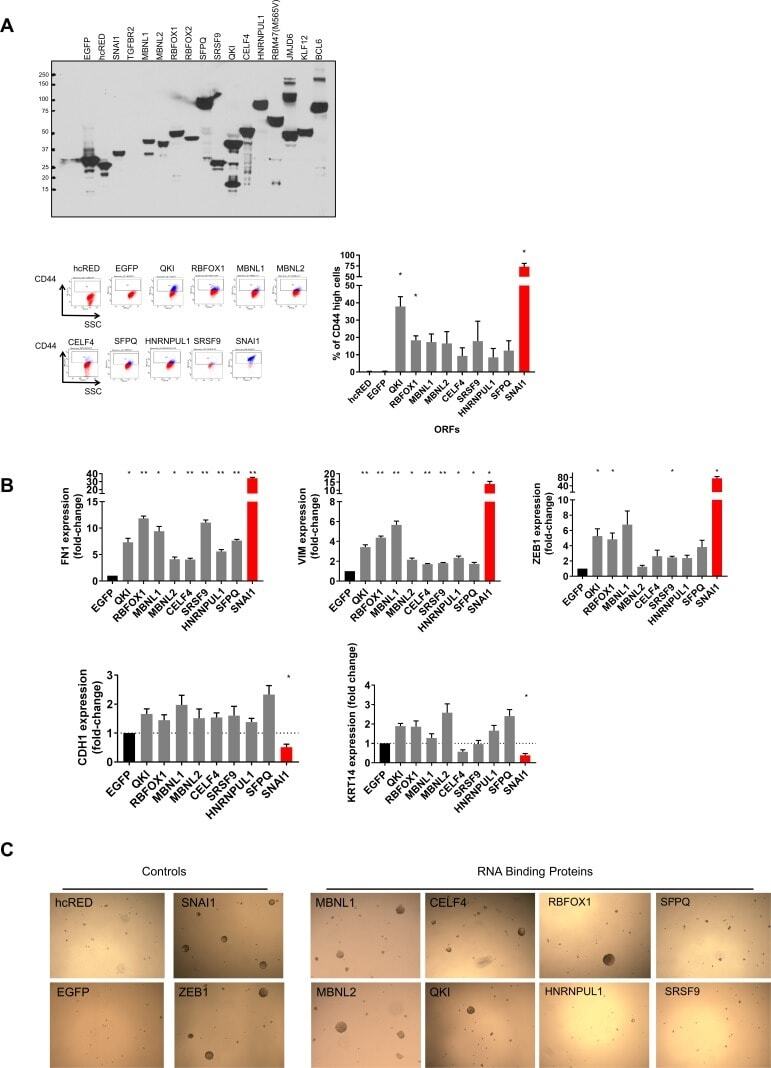
- Submitted by
- Invitrogen Antibodies (provider)
- Main image
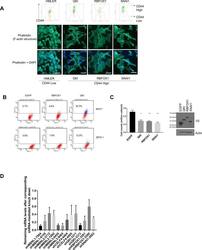
- Experimental details
- Figure 2--figure supplement 3. QKI and RBFOX1 promote an intermediate mesenchymal cell state. ( A ) Cell morphologies of the CD44-high cells induced by QKI, RBFOX1 and SNAI1. (Upper) HMLER cells expressing QKI, RBFOX1 or SNAI1 were subjected to cell sorting for CD44 high populations by FACS. (Lower) CD44-high cells induced by QKI, RBFOX1 or SNAI1 were stained for actin structures by Phalloidin. Representative pictures were shown for each cell lines. ( B ) Levels of CD44 as measured by flow cytometry in multiple cell lines including MCF7 and ZR75-1 with ectopic expression of EGFP, RBFOX1 or QKI. ( C ) The impact of QKI and RBFOX1 overexpression in cell proliferation. 10,000 HME cells expressing EGFP, QKI, RBFOX1 and SNAI1 were plated in six-well plates and cell numbers were counted after 6 days of propagation. (Left) Relative cell number quantification. (Right) Immunoblot showing the expression of the indicated V5-tagged ORFs. n = 5; *p
- Conjugate
- Biotin
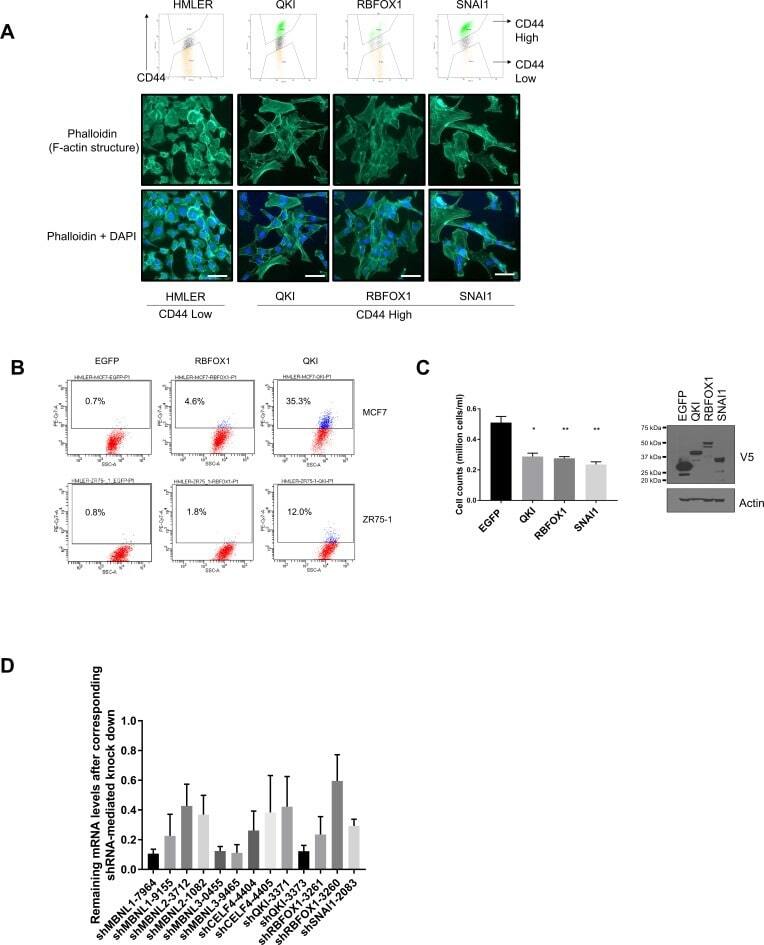
- Submitted by
- Invitrogen Antibodies (provider)
- Main image
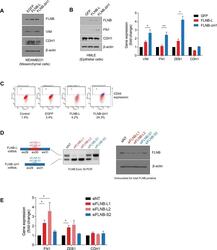
- Experimental details
- Figure 6--figure supplement 1. FLNB regulates EMT. ( A ) Protein levels of VIM (mesenchymal marker) and CDH1 (epithelial marker) after the ectopic expression of control GFP, FLNB-L or FLNB-DeltaH1 in a mesenchymal cell line, MDA-MB-231 cells, as quantified by immunoblotting. ( B ) EMT makers were quantified by immunoblotting (left) or qPCR (right) after the ectopic expression of control GFP, FLNB-L or FLNB-DeltaH1 in an epithelial cell line, HMLE cells. n = 4, *, p
- Conjugate
- Biotin
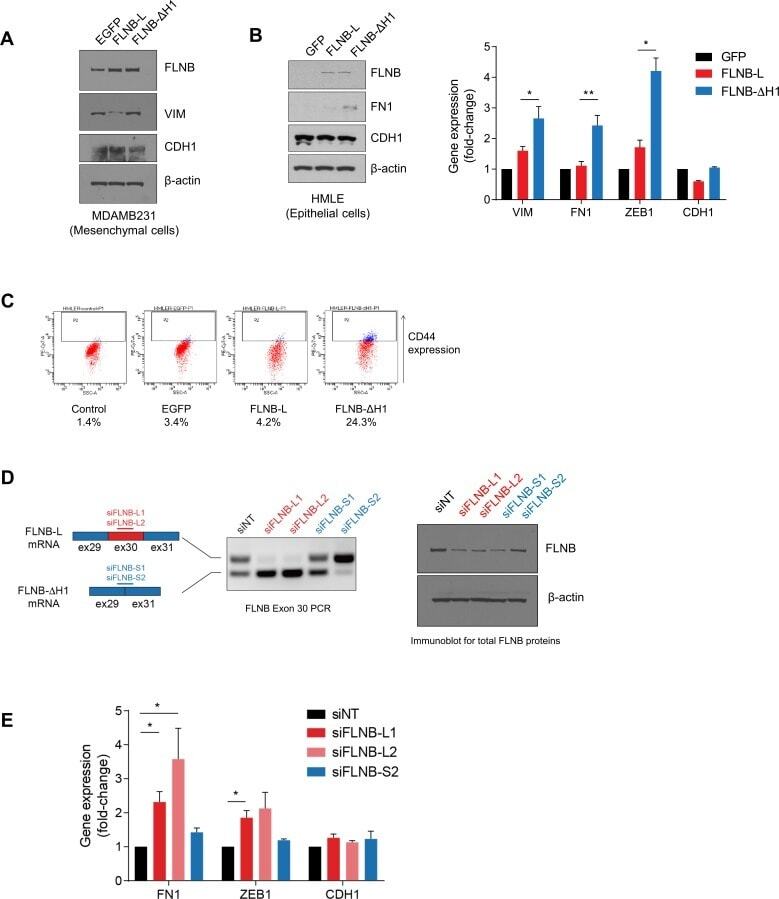
- Submitted by
- Invitrogen Antibodies (provider)
- Main image
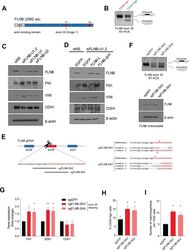
- Experimental details
- Figure 6. FLNB isoform switching promotes the mesenchymal cell state. ( A ) Schematic of FLNB (Filamin B) protein domain structure, which contains an N-terminal actin-binding domain (ABD, shown in yellow), 24 filamin repeats (shown in blue) and two hinge domains (H1 and H2, shown in red). The exon 30 of FLNB encodes the first hinge domain ( H1 ). ( B ) CD44-high and CD44-low HMLER cells were sorted and FLNB AS was analyzed by RT-PCR with primers flanking FLNB exon 30. The CD44-high HMLER cells were spontaneously generated. ( C ) The expression of FLNB was suppressed by siRNAs against FLNB 3'UTR region (FLNB-U1, U2 and UTR1,2) in HMLE cells. FLNB-U1,2 is a pool of FLNB-U1 and FLNB-U2 siRNAs. Protein levels of FN1, VIM (mesenchymal markers), CDH1 (epithelial marker) and FLNB after FLNB suppression was quantified by immunoblotting. ( D ) The expression of FLNB was rescued by FLNB-L (FLNB long isoform) or FLNB-DeltaH1 (FLNB lacking H1 domain) after endogenous FLNB depletion by siRNA targeting the UTR of FLNB (FLNB-U1,2). Protein levels of FN1, VIM (mesenchymal markers), CDH1 (epithelial marker) and FLNB were quantified by immunoblotting. ( E ) Schematic of CRISPR/Cas9-mediated targeting of the FLNB intron 29 - exon 30 junction. (Left) Guide RNAs were designed to target the junction of FLNB intron 29 (in lower-case black letters) and exon 30 (in capital red letters). (Right) Examples of modifications to the junction induced by sgRNAs sgFLNB-SK2 and sgFLNB-SK4 are shown. ( F ) FLNB
- Conjugate
- Biotin
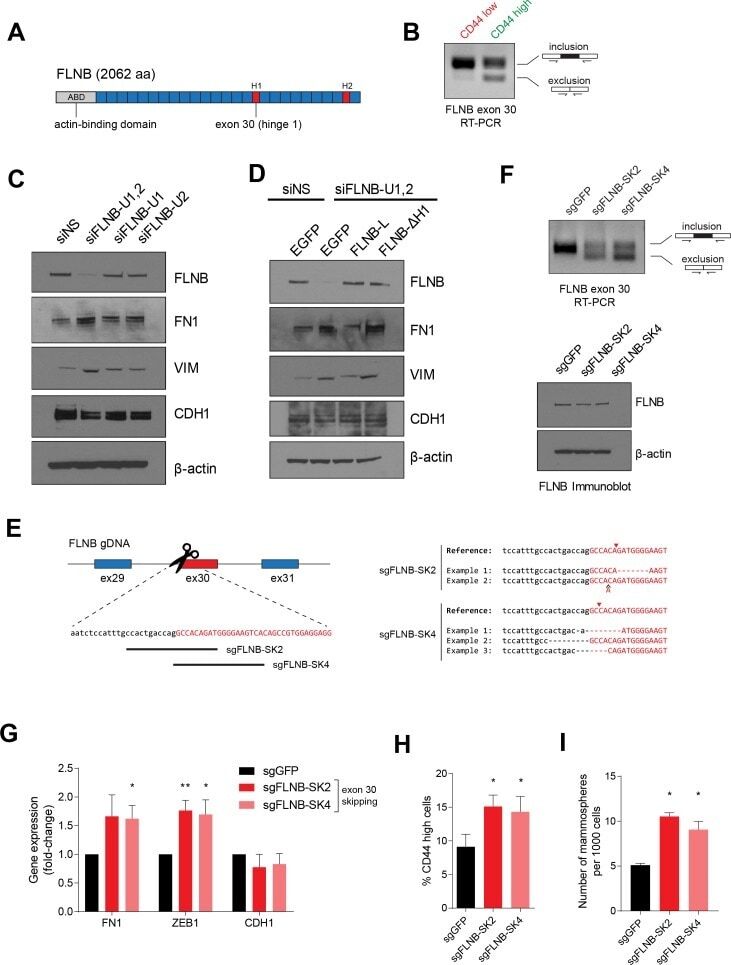
- Submitted by
- Invitrogen Antibodies (provider)
- Main image
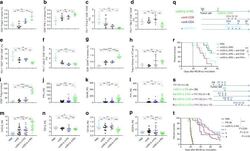
- Experimental details
- Fig. 3 Immune status change in the tumour microenvironment post-virus treatments. B6 mice were inoculated i.p. with 5 x 10 5 MC38-luc cells and treated with PBS, vvDD, vvDD-IL-2-FG, or vvDD-IL-2-RG at 2 x 10 8 PFU per mouse 9 days post-tumour inoculation. Tumour-bearing mice were sacrificed 5 days post-treatment and primary tumours were collected and analysed by flow cytometry to determine CD4 + Foxp3 - ( a ) and CD8 + IFN-gamma + T cells ( b ), exhausted CD8 + T cell ( c-f ), memory-phenotype T cells (CD8 + CD44 hi ) ( g ), regulatory T cells (CD4 + Foxp3 + ) ( h ), CD8/Treg ( i ), or by RT-qPCR to determine IFN-gamma, granzyme B, perforin, CXCL9, TGF-beta, CD105, and VEGF ( j-p ). Four to five mice were used for each treatment group and data are representative of two independent experiments ( a - i ) or combined from three independent experiments ( j-m ) or two independent experiments ( n-p ). In a separate experiment, B6 mice were i.p. inoculated with 5 x 10 5 MC38-luc cells and treated with vvDD-IL-2-RG or PBS 9 days post-tumour inoculation. Anti-CD8 Ab (250 ug per injection), anti-CD4 Ab (150 ug per injection), anti-IFN-gamma Ab (200 ug per injection) (nine mice per group) ( q ), or PK136 (300 ug per injection) ( s ), were i.p. injected into mice to deplete CD8 + T cells, CD4 + T cells or neutralise circulating IFN-gamma, or NK1.1 + cells, and a log-rank (Mantel-Cox) test was used to compare survival rates ( r , t ), respectively. * P
- Conjugate
- Biotin
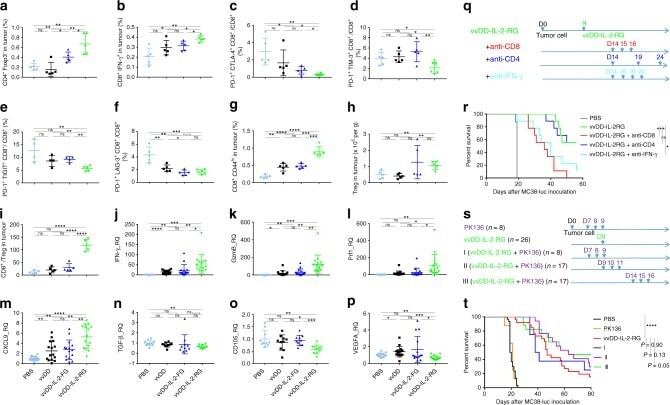
- Submitted by
- Invitrogen Antibodies (provider)
- Main image

- Experimental details
- Figure 1. Characterization of PDLSCs. (A) PDL cell clusters exhibited radiating or whirlpool-like morphology. The central structure in this image is a fragment of PDL tissue. Scale bar, 200 mum (B) CD146 + PDLSCs were small, round, fusiform and triangular. Scale bar, 100 mum. (C) PDLSCs were positive for the stem cell markers CD44, CD90 and CD105, but negative for CD34 and CD45, as detected by flow cytometry. PDL, periodontal ligament; PDLSCs, PDL stem cells.
- Conjugate
- Biotin
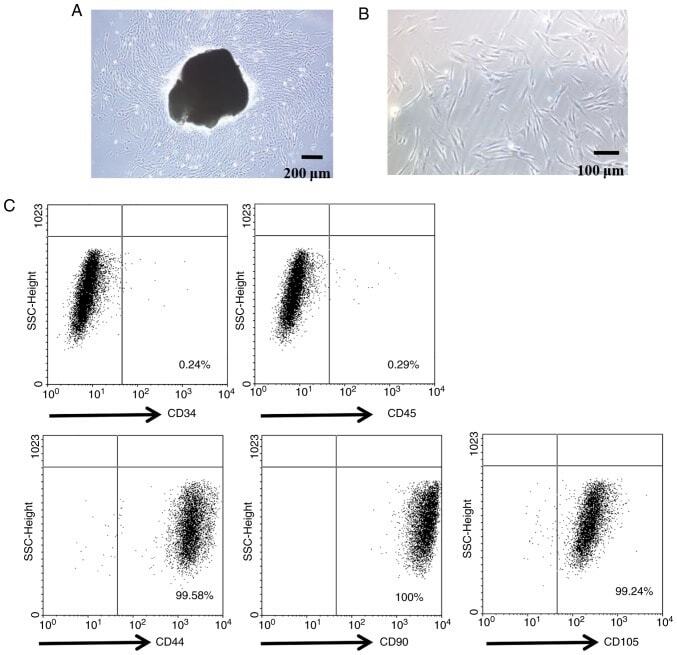
- Submitted by
- Invitrogen Antibodies (provider)
- Main image
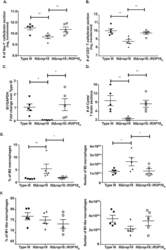
- Experimental details
- Fig 9 The infection with IIIDelta rop16 :: ROP16 III parasites restores type III-like CNS response with higher CNS macrophages/microglia and T cells. Mice were inoculated with type III, IIIDelta rop16 , or IIIDelta rop16 : ROP16 parasites. Brains were harvested at 21 dpi and analyzed as in Figs 1(A), 1(B) , 2(C), 2(D) or 3(E) and 3(F) . A. Quantification of the number of Iba-1 + cells (macrophages/microglia). B. Quantification of the number of CD3 + T cells. Bars, mean +- SEM. N = 12 fields of view/section, 3 sections/mouse, 4-5 mice/infected group. For each mouse, the number of cells/section was averaged to create a single point. C. Quantification of CNS Toxoplasma burden by qPCR for the Toxoplasma -specific B1 gene. D. Quantification of Toxoplasma cyst burden in brain sections stained with DBA. E. CNS mononuclear cells evaluated for the presence of M2 macrophages. F. CNS mononuclear cells evaluated for the presence of M1-like macrophages. Bars, mean +- SEM. N = 12 fields of view/section, 3 sections/mouse, 4-5 mice/infected group. *p
- Conjugate
- Biotin
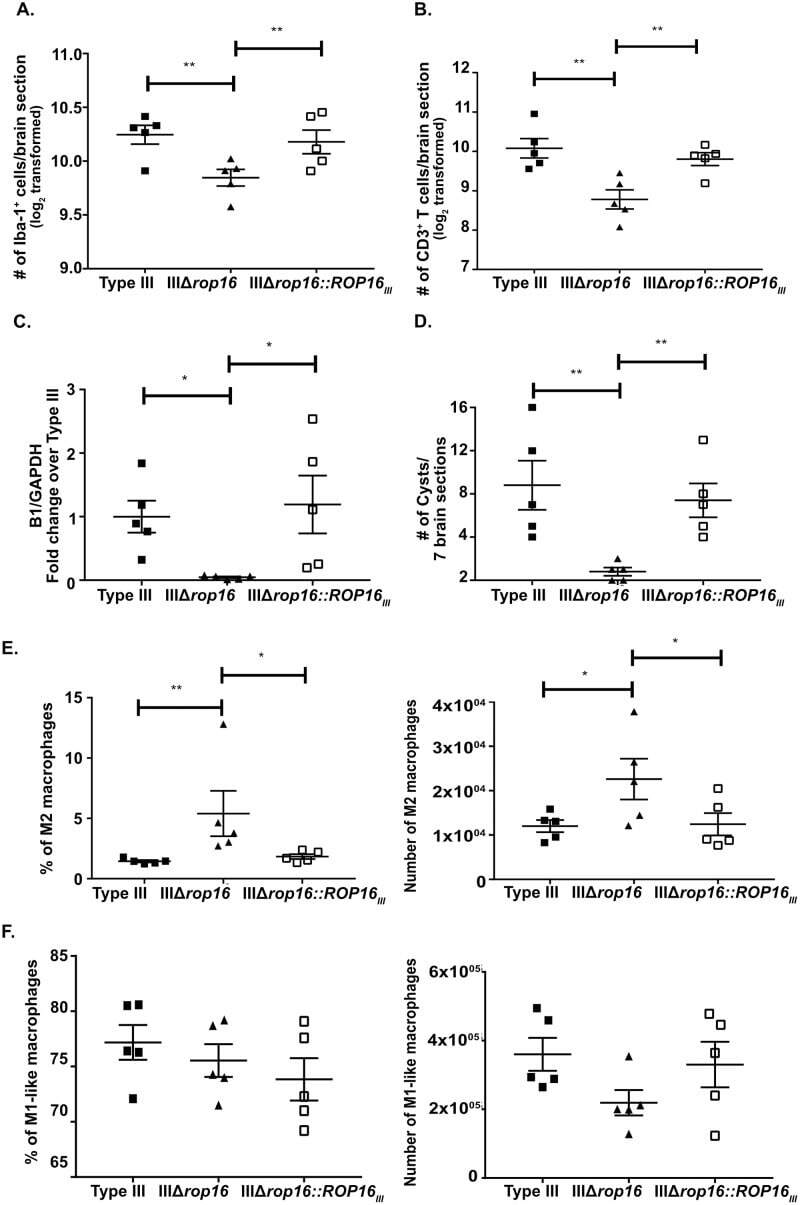
- Submitted by
- Invitrogen Antibodies (provider)
- Main image
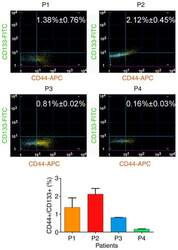
- Experimental details
- Figure 1 Proportion of CD44 + /CD133 + cancer stem cells in ovarian cancer tissues of each patient by flow cytometry.
- Conjugate
- Biotin
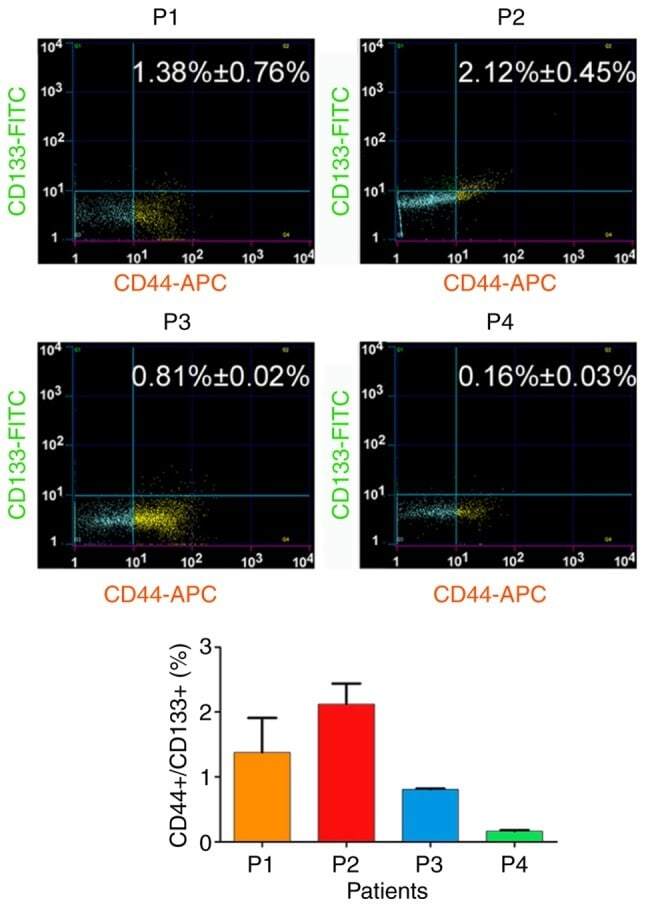
- Submitted by
- Invitrogen Antibodies (provider)
- Main image
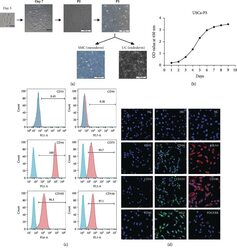
- Experimental details
- Figure 1 Growth characteristics of USCs. (a) The morphology of USCs by passage and differentiation. Single, small, compact rice grain-like cells were observed on the third day after initial seeding, and they formed a colony on the seventh day. The cells were considered to be at P0 when the confluence reached 70-80% and were passaged to the next generation. The USCs maintained the rice grain-like morphology after several passages, and USCs from the P3 generation were induced to differentiate into SMCs and UCs. The cells showed an elongated and spindle-shaped morphology after SMC differentiation and a cobblestone-shaped morphology after UC differentiation. Scale bar: 50 mu m, 100 mu m, and 200 mu m. (b) The growth curve of USCs from the P3 generation. (c) Detection of surface markers in USCs using flow cytometry. USCs did not express hematopoietic stem cell markers (CD31: 0.45%, CD34: 0.28%) but expressed MSC markers (CD44: 100%, CD73: 97.1%, and CD105: 96.3%) and pericyte markers (CD146: 95.7%). (d) Detection of surface markers in USCs using IF. USCs did not express hematopoietic stem cell markers (CD31, CD34, and CD45) but did express MSC markers (CD44 and CD133), the ESC marker SSEA4, and pericyte markers (CD146, PDGFRB, and NG2). NC: negative control; PDGFRB: platelet-derived growth factor beta-receptor; NG2: neural/glial antigen 2. Scale bar: 25 mu m.
- Conjugate
- Biotin
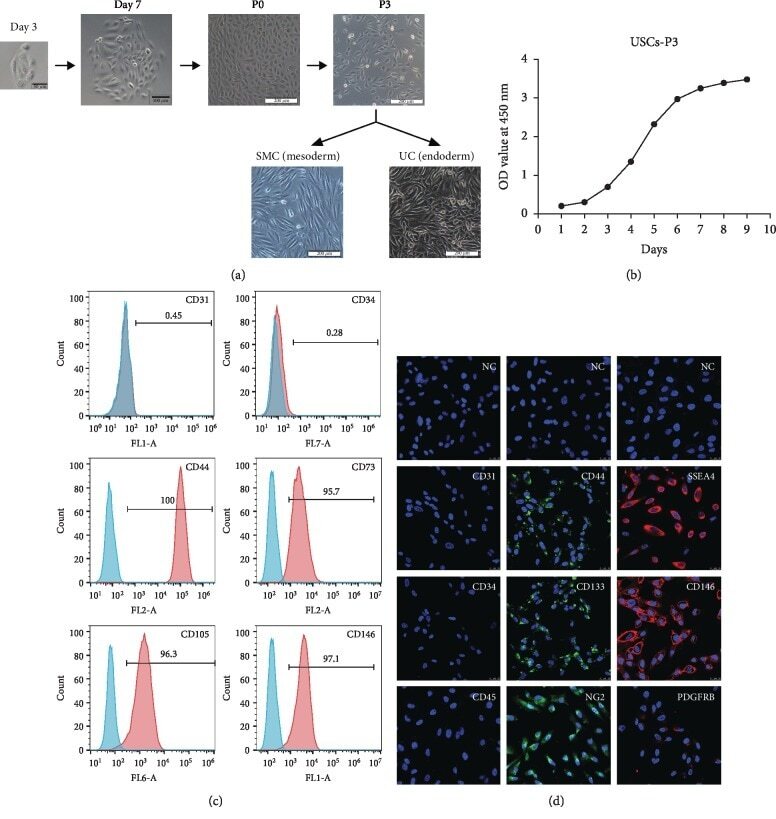
- Submitted by
- Invitrogen Antibodies (provider)
- Main image
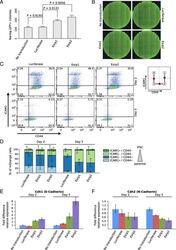
- Experimental details
- Fig. 3 ESRPs enhance reprogramming efficiency of TNG-MKOS-MEFs. ( a ) Number of Nanog-GFP+ colonies counted on day 15 of reprogramming with/without overexpression of either Esrp1 , Esrp2 or Renilla luciferase expression controls. Error bars show standard deviations and P values are based on two-tailed paired t-tests (n = 3). See Additional file 16 for raw data. ( b ) Representative images of one entire culture dish per condition. Images were taken by a Celigo Imaging cytometer. ( c ) Changes in CD44 and ICAM1 protein levels, measured by flow cytometry during the initial stages of TNG-MKOS-MEF reprogramming (day 2 and day 5). TNG-MKOS-MEFs ectopically expressed either Renilla luciferase (left), Esrp1 (middle) or Esrp2 (right). The gates define cells in different reprogramming stages as previously described [ 36 ]. The expected shift of cells along the reprogramming time course is indicated in the schematic diagram on the right. Data from a representative experiment (of n = 3 experiments) are shown. ( d ) Mean percentages of cells in each gate, with standard deviation computed from the three independent experiments. Gates are labeled ICAM1 + / CD44 + , ICAM - / CD44 + , ICAM1 - / CD44 - , ICAM1 + / CD44 - and correspond to the ones in ( c ), clockwise, starting from the top right. An arrow next to the legend indicates the order in which sub-populations appear in a typical reprogramming experiment. See Additional file 16 for raw data. ( e and f ) qRT-PCR me
- Conjugate
- Biotin

- Submitted by
- Invitrogen Antibodies (provider)
- Main image
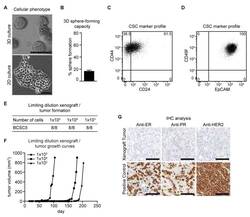
- Experimental details
- Figure 1 Characterization of BCSC5 in vitro and in vivo. ( A ) Representative pictures of BCSC5 cultured in 3D and 2D conditions, scale bar 100 mum. ( B ) Sphere-forming capacity of BCSC5 cells in an anchorage-independent growth assay ( n = 3). Data represent means + SEM. ( C , D ) Expression patterns of CD24 and CD44 ( C ) as well as EpCAM and CD49f ( D ) in BCSC5 cells analyzed by flow cytometry. ( E ) Tumor formation in limiting dilution xenografts of BCSC5. ( F ) Representative growth curves for limiting dilution assay of BCSC5 xenografts in immunocompromised NOD/SCID mice. ( G ) Immunohistochemical (IHC) analysis of ER, PR, and HER2 on sections of the BCSC5 xenograft tumors, scale bar 100 mum.
- Conjugate
- Biotin
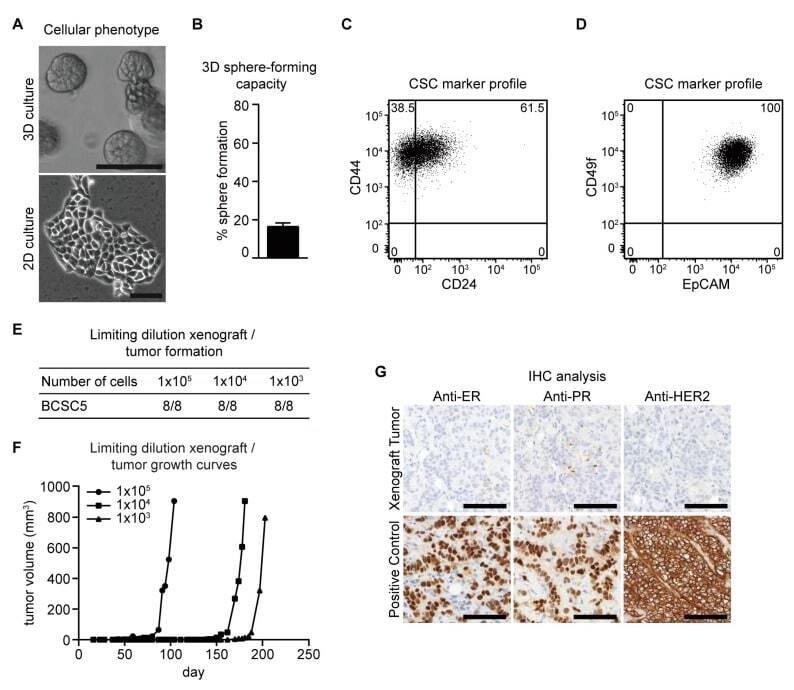
- Submitted by
- Invitrogen Antibodies (provider)
- Main image
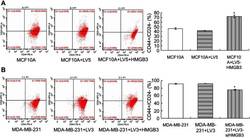
- Experimental details
- Figure 5 CD44 + /CD24 - levels detection in MCF10A and MDA-MB-231 cells with flow cytometry assay. ( A ). CD44 + /CD24 - evaluation in HMGB3-treated MCF10A cells. ( B ). CD44 + /CD24 - evaluation in siHMGB3-treated MDA-MB-231 cells. * p
- Conjugate
- Biotin
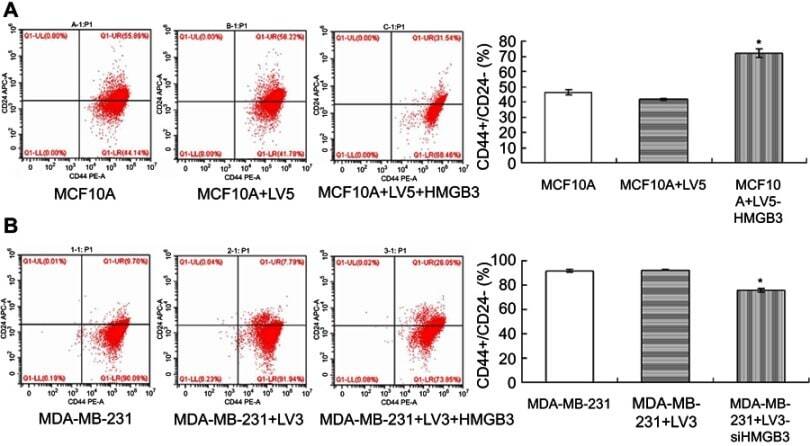
- Submitted by
- Invitrogen Antibodies (provider)
- Main image
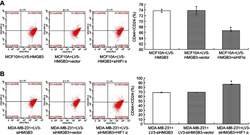
- Experimental details
- Figure 10 Determination for CD44 + /CD24 - levels in HMGB3/siHIF1alpha-treated MCF10A cells and siHMGB3/HIF1alpha-treated MDA-MB-231 cells using flow cytometry assay. ( A ). CD44 + /CD24 - evaluation in HMGB3/siHIF1alpha-treated MCF10A cells. ( B ). CD44 + /CD24 - evaluation in siHMGB3/HIF1alpha-treated MDA-MB-231 cells. * p
- Conjugate
- Biotin
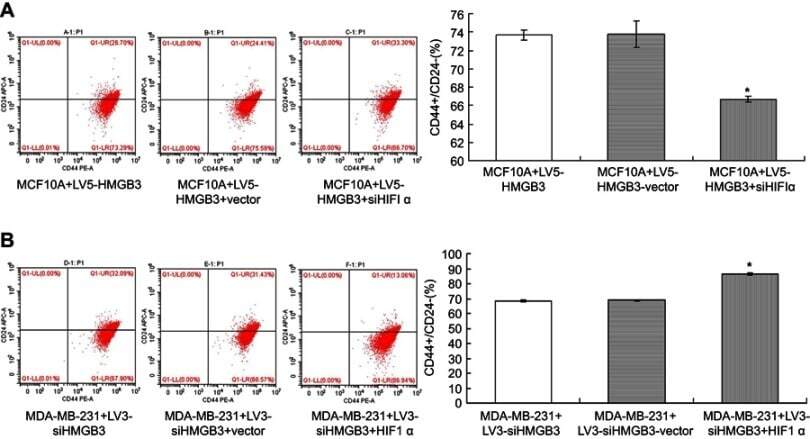
- Submitted by
- Invitrogen Antibodies (provider)
- Main image

- Experimental details
- Figure 3 SOCS3 treatment decreases CD44 high CD62L low effector memory CD8+ T cells, resulting in the reduction of IFN-gamma production (A) CD8+ T cells were isolated from SDLNs of SOCS3-treated C3H/HeJ AA mice and were used to assay the level of CD44 and CD62L. Flow cytometry data showed that 15.8% of CD8+ T cells from SDLNs were CD44 high CD62L low in C3H/HeJ AA mice, whereas SOCS3 treatment markedly decreases CD44 high CD62L low effector memory CD8+ T cells. Data are representative of three independent experiments. Isotype-matched, directly conjugated primary Abs were additionally used to confirm Ab specificity for all markers (data not shown). (B) Percentage of CD44 high CD62L low effector memory CD8+ T cells was quantitated by flow cytometric analysis. Data are mean +- SD of three independent experiments. (C) CD8+ T cells were isolated from skins of SOCS3-treated C3H/HeJ AA mice and were used to assay the percentage of IFN-gamma-producing CD8+ T cells. (D) Percentage of IFN-gamma-producing CD8+ T cells was quantitated by flow cytometric analysis. Data are mean +- SD of three independent experiments. (E and F) IFN-gamma level in SOCS3-treated AA skin was evaluated by immunofluorescent microscopy. Data are mean +- SD of three independent experiments. (G) IFN-gamma mRNA level in the skin of grafted recipients was assayed after treatment with SOCS3 or IgG control (n = 6 mice/group). SOCS3-treated group possessed a lower ability to produce IFN-gamma compare
- Conjugate
- Biotin
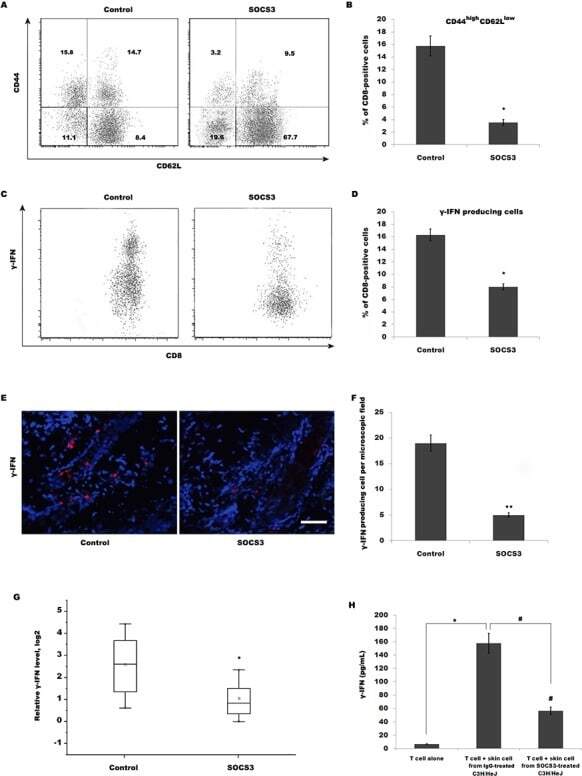
- Submitted by
- Invitrogen Antibodies (provider)
- Main image
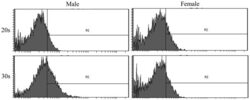
- Experimental details
- Figure 6. Evaluation of CD44 surface marker expression on day 16 following adipogenic media-induced differentiation. Flow cytometric profile of CD44 expression in bone marrow-derived stem cells isolated from male and female participants in their 20s and 30s.
- Conjugate
- Biotin
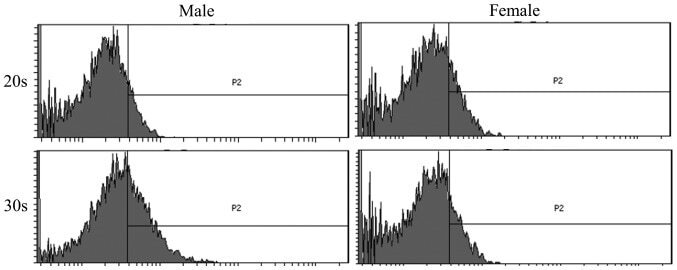
- Submitted by
- Invitrogen Antibodies (provider)
- Main image
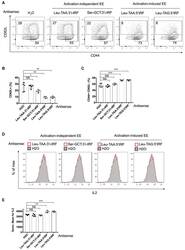
- Experimental details
- Figure 7. Transfection of Antisense Oligos against tRFs that Are Associated with MVBs in an Activation-Induced Manner Enhances T Cell Activation (A) Representative flow cytometric analysis of CD44 and CD62L expression on the surface of CD4 + T cells transfected with antisense oligos complementary to tRFs or water vehicle (H 2 O) control. (B and C) Quantified frequency of CD62L + (B) and CD44 + and CD62L + (C) cells. (D) Representative flow cytometric analysis of IL-2 intracellular staining of live CD4 + T cells restimulated with PMA and ionomycin. (E) Geometric mean fluorescence intensity of IL-2 staining. Data are representative of at least three independent experiments. Statistical significance is measured using a one-tailed t test: *p < 0.05, **p < 0.01, and ***p < 0.001. Error bars indicate standard deviation of the mean. See also Figure S7 .
- Conjugate
- Biotin
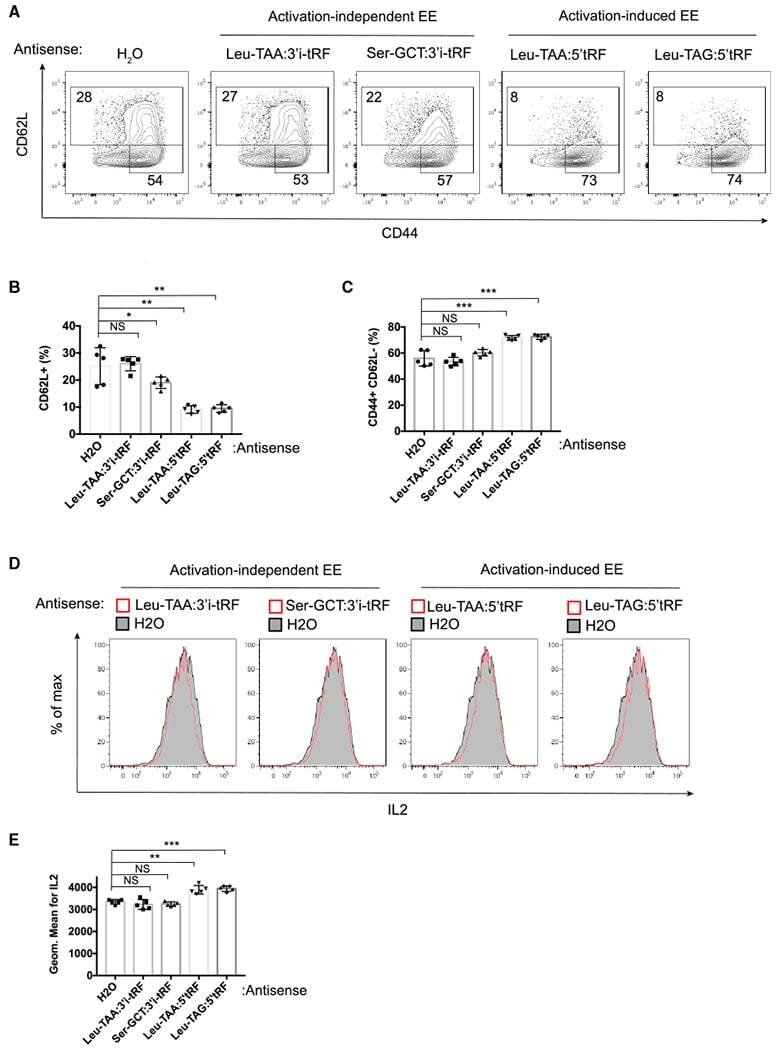
- Submitted by
- Invitrogen Antibodies (provider)
- Main image
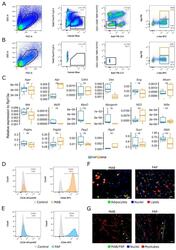
- Experimental details
- Figure 3 Isolation and characterization of interstitial stem cells from murine skeletal muscle. Gating strategy for FACS (fluorescent activated cell sorting) isolation of murine MABs (mesoangioblasts) and FAPs (fibro/adipogenic progenitors) ( A ) and control gates ( B ). ( C ) qPCR analysis of characteristic genes; values shown as relative expression to Rpl13a . n = 4-6. ( D , E ) Flow cytometry analysis of characteristic markers. MAB in orange ( D ), FAP in blue ( E ) and unstained control samples in grey. ( F ) Microscopy images of adipogenic differentiation; nuclei are stained with Hoechst (blue), lipids are stained with Oil Red O (red) and adipocytes are stained with Perilipin (green). ( G ) Microscopy images of myogenic differentiation from the co-culture of mouse MAB or FAP and satellite cells; Myotubes are stained with MyHC (red), MAB or FAP are stained with GFP (green) and nuclei are stained with Hoechst (blue). In ( E , F ), scale bar, 50 um. * p
- Conjugate
- Biotin
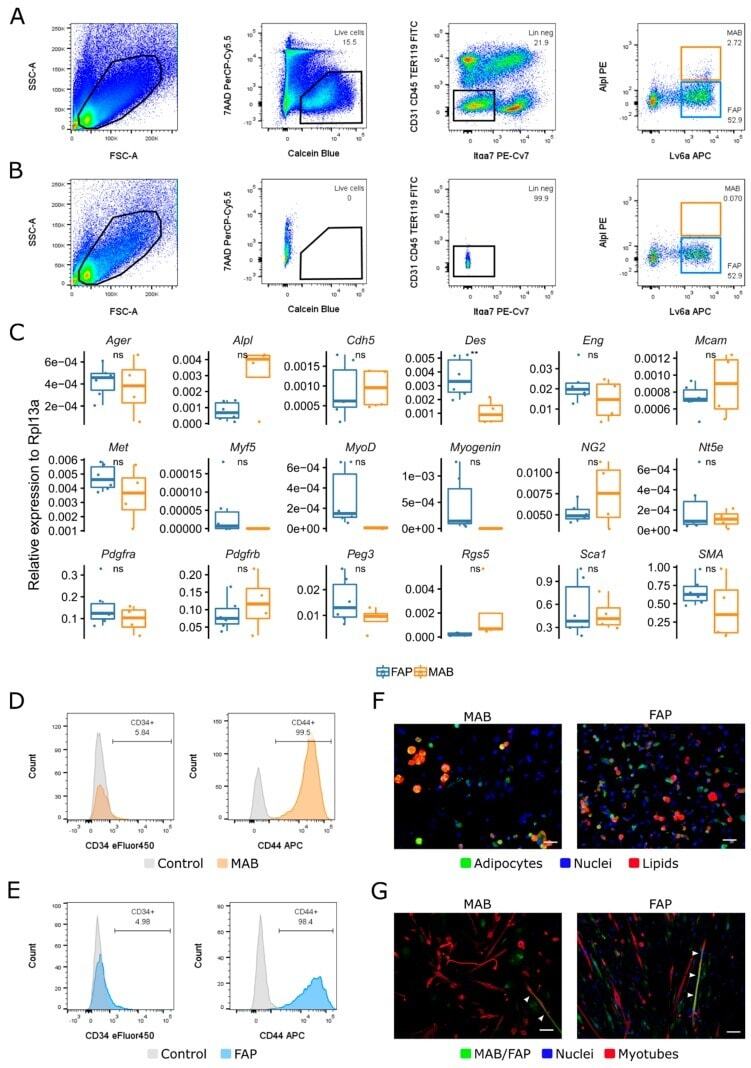
- Submitted by
- Invitrogen Antibodies (provider)
- Main image
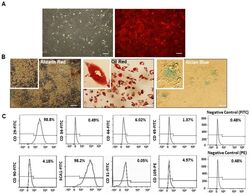
- Experimental details
- Figure 1 Characterization of bone marrow-derived mesenchymal stem cells (MSC) isolated from mTmG mice. ( A ) Plastic adherent cells were ex vivo expanded until passage 10, maintaining red fluorescent (RFP) expression throughout. ( B ) MSCs differentiated into osteogenic (alizarin red staining), adipogenic (oil red staining), and chondrogenic (alcian blue staining) lineages. Scale bars represent 200 um. ( C ) Flow cytometry analysis for immunophenotyping showed that MSCs, in passages 7-8, were positive for CD 29 (98.8%), SCA-1 (98.2%), CD 44 (6.02%), CD 90 (4.18%), and CD 105 (4.97%), and negative for CD34 (0.49%), CD 45 (1.37%), and CD 31 (0.05%).
- Conjugate
- Biotin
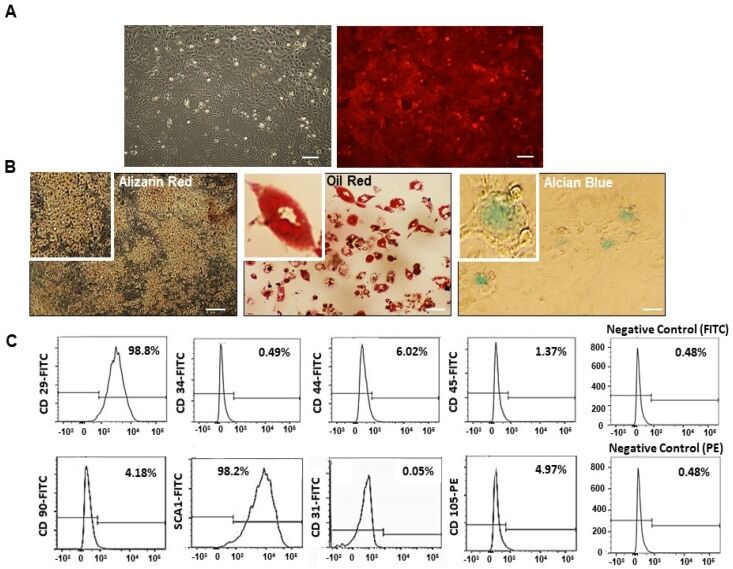
- Submitted by
- Invitrogen Antibodies (provider)
- Main image
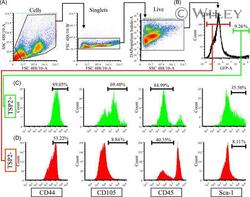
- Experimental details
- 7 Figure Fracture callus TSP2 positive cells express a MSC immunophenotype. Transverse femoral fractures were induced in TSP2-GFP reporter mice. Calluses from six mice were harvested 7 days post-fracture, pooled, and digested in trypsin, collagenase A, and hyaluronidase. Cells were labeled with anti-mouse directly conjugated MSC antibodies (CD44, CD105, CD45, and Sca-1) and DAPI before flow cytometry. A, Cells were gated by size and granularity using an SSC-A/FSC-A color density plot. Single cells were sub-gated by FSC-W/FSC-A and dead (DAPI+) cells were discriminated by sub-gating on a DAPI-A/SSC-A. B, Included cells were gated by GFP-A as either T2GFP-neg (red) or T2GFP-pos (green). C, Representative histograms of cell surface markers in T2GFP-pos cells. D, Representative histograms of cell surface markers in T2GFP-neg cells. Histograms were gated for positive selection of CD44, CD105, and Sca-1 and negative selection of CD45 to match the known MSC immunophenotype of CD44+/CD105+/CD45-/Sca-1+. Flow cytometry was repeated two times with an n = 2 per experiment. MSC, mesenchymal progenitor cells; TSP2, thrombospondin-2 [Color figure can be viewed at wileyonlinelibrary.com ]
- Conjugate
- Biotin