Explore
 Validate
 Learn
Learn Western blot
 Immunohistochemistry
Antibody data
- Antibody Data
- Antigen structure
- References [1]
- Comments [0]
- Validations
- Immunohistochemistry [1]
- Other assay [5]
Submit
Validation data
Reference
Comment
Report error
- Product number
- PA5-28547 - Provider product page

- Provider
- Invitrogen Antibodies
- Product name
- DCBLD2 Polyclonal Antibody
- Antibody type
- Polyclonal
- Antigen
- Recombinant full-length protein
- Description
- Recommended positive controls: HeLa, HepG2. Predicted reactivity: Mouse (87%), Rat (87%), Chicken (83%), Bovine (90%). Store product as a concentrated solution. Centrifuge briefly prior to opening the vial.
- Reactivity
- Human
- Host
- Rabbit
- Isotype
- IgG
- Vial size
- 100 μL
- Concentration
- 1 mg/mL
- Storage
- Store at 4°C short term. For long term storage, store at -20°C, avoiding freeze/thaw cycles.
Submitted references DCBLD2 Mediates Epithelial-Mesenchymal Transition-Induced Metastasis by Cisplatin in Lung Adenocarcinoma.
Chen X, Lv Y, Xu K, Wang X, Zhao Y, Li J, Qin X, Shi Y, Wang L, Chang A, Huang C, Xiang R
Cancers 2021 Mar 19;13(6)
Cancers 2021 Mar 19;13(6)
No comments: Submit comment
Supportive validation
- Submitted by
- Invitrogen Antibodies (provider)
- Main image
- Experimental details
- Immunohistochemical analysis of paraffin-embedded human colon carcinoma, using DCBLD2 (Product # PA5-28547) antibody at 1:500 dilution. Antigen Retrieval: EDTA based buffer, pH 8.0, 15 min.

Supportive validation
- Submitted by
- Invitrogen Antibodies (provider)
- Main image
- Experimental details
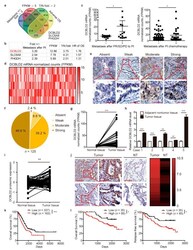
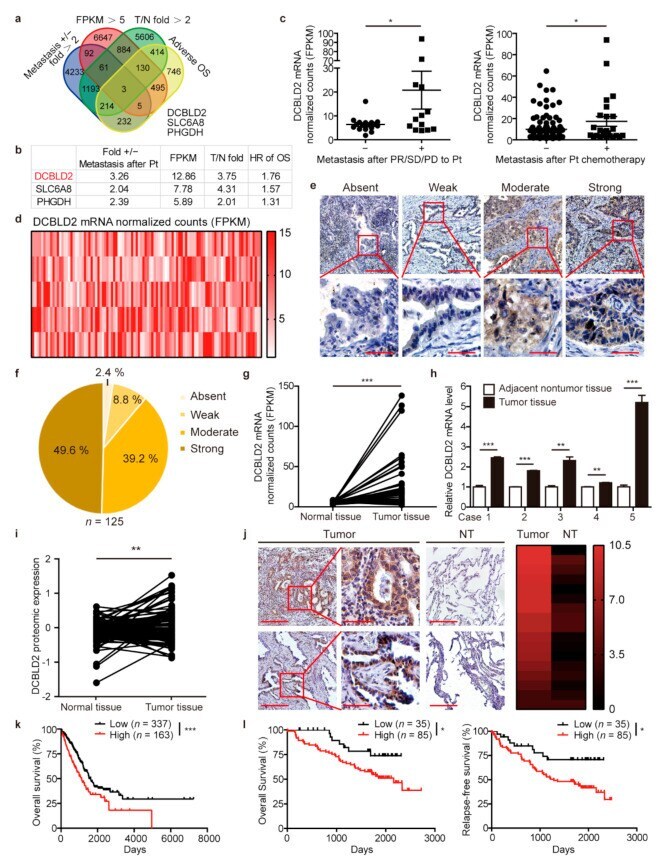
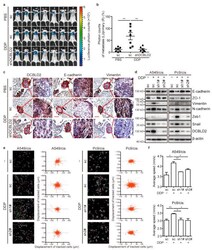
- Figure 2 DCBLD2 is a candidate gene involved in cisplatin-induced metastasis. ( a ) Screening strategy for key genes related to distant metastasis after platinum-based chemotherapy. ( b ) Ranking of the 3 identified candidate genes according to the 4 criteria. ( c ) Differential expression of DCBLD2 at the transcriptional level in LUAD patients from the TCGA database with or without distant metastasis when responding to platinum agents with a partial response, stable disease, or progressive disease (left). DCBLD2 expression in LUAD patients with distant metastasis who received platinum agents (right). * p < 0.05, t -test. ( d ) The heat map of DCBLD2 expression in mRNA normalized count (log 2) in LUAD tissues from the TCGA database ( n = 515). ( e , f ) Representative images ( e ) and distribution ( f ) of DCBLD2 expression in LUAD tissues by IHC assay ( n = 125). Scale bar: 200 mum (top), 50 mum (bottom). ( g ) Transcriptional analysis of the differential expression of DCBLD2 in paired LUAD tissues and normal tissues from the TCGA database ( n = 57), p = 0.0003, paired t -test. ( h ) DCBLD2 expression at the mRNA level in LUAD tissues and adjacent nontumor tissues by RT-PCR ( n = 5). ** p < 0.01, *** p < 0.001, t -test. ( i ) Differential expression of DCBLD2 at the protein level in LUAD tissues and paired normal tissues from the CPTAC database ( n = 102), ** p < 0.01, paired t -test. ( j ) Representative images of DCBLD2 expression in LUAD tissues and paired nontumor tissue
- Submitted by
- Invitrogen Antibodies (provider)
- Main image
- Experimental details
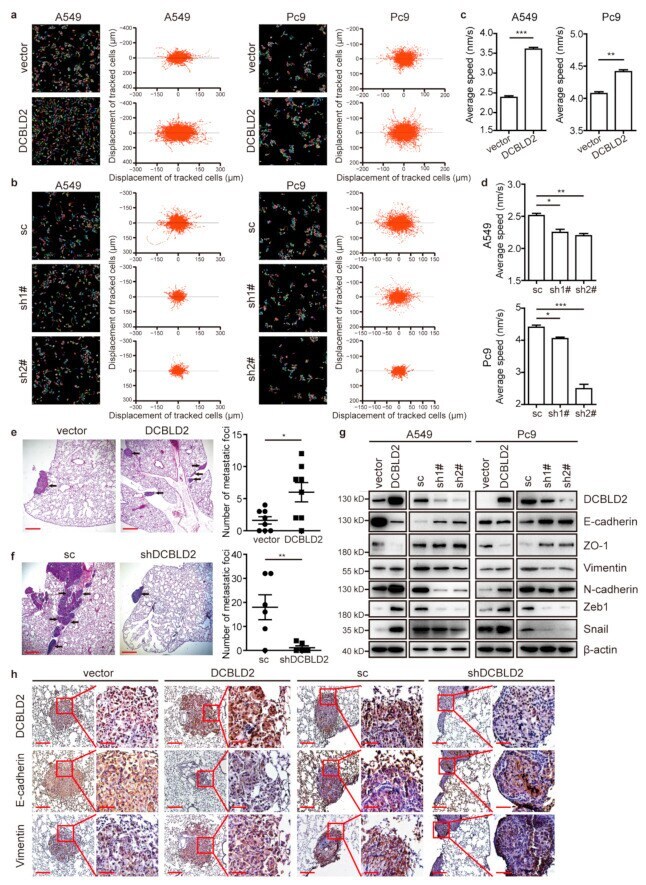
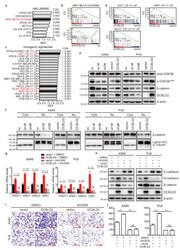
- Figure 3 DCBLD2 induces migration and metastasis in LUAD. ( a - d ) Dynamic imaging analyses of cell migration in A549 and Pc9 cells. Cell migration was measured over 16 h by HCS. Representative images (left panel) and single-cell ultimate displacement (right panel) of A549 and Pc9 cells are shown in ( a , b ). The average speed was measured by Harmony software in ( c , d ). ( e ) A total of 1 x 10 6 empty vector or DCBLD2-overexpressing cells were inoculated into the right lungs of BALB/c nude mice ( n = 8 per group) to establish an orthotopic tumor xenograft model. Six weeks after inoculation, mice were sacrificed. The metastatic foci in the left lung were subjected to HE staining (left panel), and statistical analysis of the number of metastatic foci in the left lung is shown in the right panel. Scale bar: 400 mum. ( f ) A total of 1 x 10 6 scramble control or shDCBLD2 A549 cells were inoculated in the right lung of BALB/c nude mice ( n = 6 per group) to establish an orthotopic tumor xenograft model. Eight weeks after inoculation, mice were sacrificed. The metastatic foci in the left lung were subjected to HE staining (left panel), and statistical analysis of the number of metastatic foci in the left lung is shown in the right panel. Scale bar: 400 mum. ( g ) Western blot analysis of EMT markers in A549 and Pc9 cells. DCBLD2 was overexpressed or knocked down in cells, and western blot analysis of the expression of EMT-related proteins was performed. ( h ) Representative IH
- Submitted by
- Invitrogen Antibodies (provider)
- Main image
- Experimental details
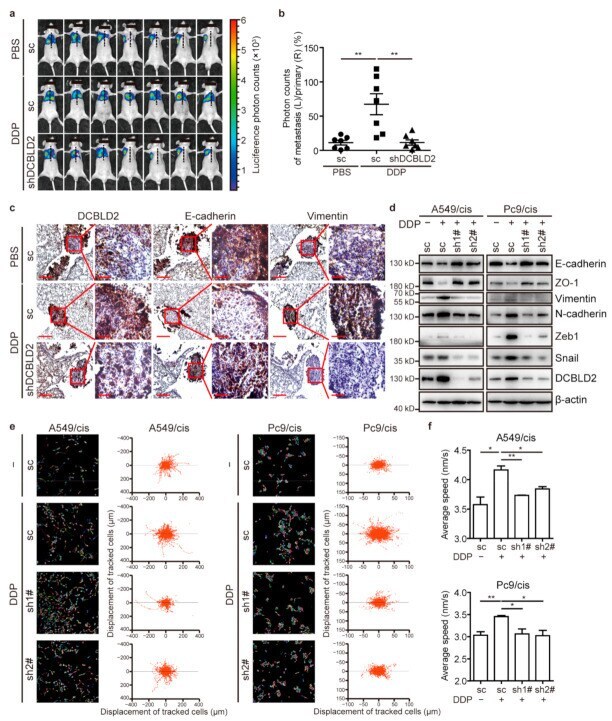
- Figure 4 DCBLD2 mediates cisplatin-induced EMT and tumor metastasis. ( a , b ) A total of 1 x 10 6 Pc9/cis-luciferase cells transfected with shDCBLD2 or scramble control were inoculated into the right lungs of BALB/c nude mice ( n = 7 per group). On day 7, mice were intraperitoneally injected with 4.0 mg/kg cisplatin or an equivalent volume of PBS every 7 days. Thirty-five days after inoculation, mice underwent a bioluminescence test and were sacrificed. The primary tumors in the right lung and the metastatic foci in the left lung were subjected to HE staining or IHC staining. Bioluminescence imaging is shown in ( a ), and quantitation of bioluminescence signals is shown in ( b ). ( c ) Representative IHC images of E-cadherin and Vimentin expression in paraffin-embedded serial sections of the primary lesion (right lung) of orthotopically implanted mice from Figure 3 A. Scale bar: 200 mum (left) and 50 mum (right). ( d ) Western blot assay to confirm the effect of DCBLD2 on EMT in cisplatin treatment. Cells with stable DCBLD2 knockdown or scramble control were cultured in the presence or absence of 2 mug/mL cisplatin for 24 h. ( e , f ) Dynamic imaging analyses of cell migration in stable DCBLD2 knockdown cells and scramble control cells pretreated with 2 mug/mL cisplatin or vehicle control for 24 h. Cell migration was measured over 16 h by HCS. Representative images recording the single-cell motion track (left panel) and single-cell ultimate displacement (right panel) are sho
- Submitted by
- Invitrogen Antibodies (provider)
- Main image
- Experimental details
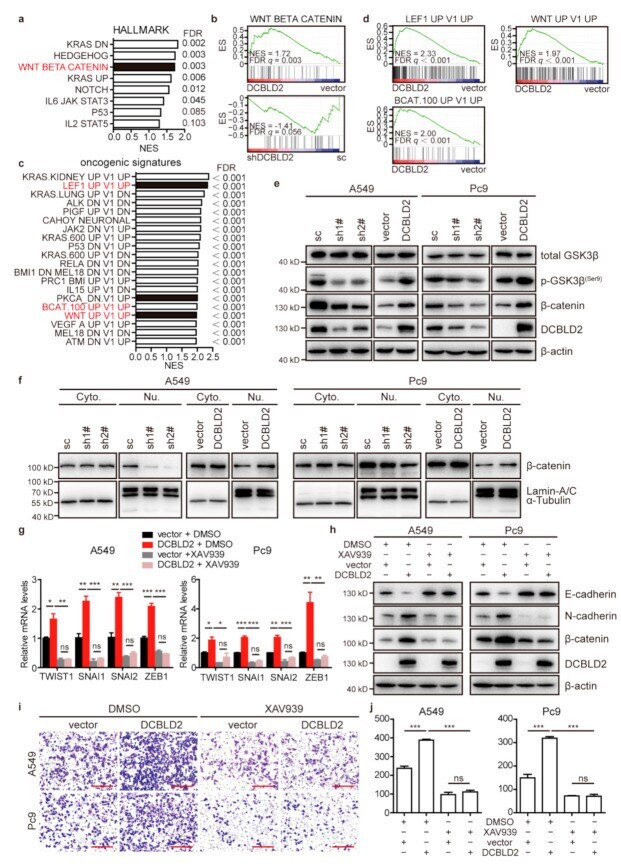
- Figure 5 The Wnt/beta-catenin signaling pathway mediates DCBLD2-induced metastasis in LUAD. ( a , b ) Hallmark enrichment classification of signaling pathways of differentially expressed genes in empty vector and DCBLD2-overxpressing A549 cells by GSEA. ( c , d ) Oncogenic signature enrichment classification of differential genes by GSEA. ( e ) The expression of various Wnt/beta-catenin signaling pathway proteins was evaluated by western blot assay in A549 and Pc9 cells. ( f ) Western blot assay of beta-catenin expression in A549 and Pc9 cells after nuclear-cytoplasmic fractionation. alpha-Tubulin and Lamin A/C were used as cytoplasmic and nuclear loading controls, respectively. ( g ) RT-PCR assays of the expression of EMT TFs in empty vector and DCBLD2-transfected cells after treatment with 20 muM XAV939 or DMSO for 48 h. ( h ) Western blot assay of the expression of E-cadherin and N-cadherin in empty vector and DCBLD2-transfected cells treated with 20 muM XAV939 or DMSO for 48 h. ( i , j ) Transwell assay showing the effect of beta-catenin on DCBLD2-induced cell migration. Empty vector and DCBLD2-transfected cells were pretreated with 20 muM XAV939 or DMSO for 48 h and then subjected to Transwell assays. Images of the cells on the underside of the membrane of wells are shown in (i) after culture for 8 h in the presence of a chemoattractant. Scale bar: 200 mum. Quantification of migrated cells is depicted in (j). * p < 0.05, ** p < 0.01, *** p < 0.001, t -test.
- Submitted by
- Invitrogen Antibodies (provider)
- Main image
- Experimental details
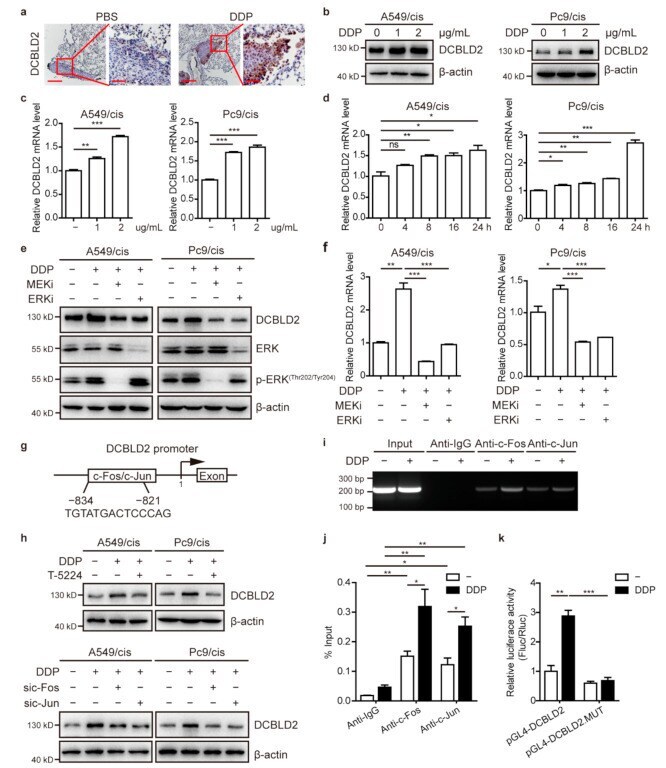
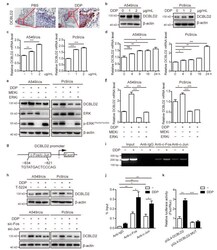
- Figure 6 Cisplatin upregulates DCBLD2 expression by the ERK/AP-1 signaling pathway. ( a ) Representative IHC images of DCBLD2 expression in primary tumor tissues from Figure 1 a. Scale bar: 200 mum (left), 50 mum (right). ( b , c ) Western blot assays ( b ) and RT-PCR assays ( c ) of DCBLD2 expression in A549/cis and Pc9/cis cells cultured in the absence or presence of either 1 or 2 mug/mL cisplatin for 24 h. ( d ) RT-PCR assays of DCBLD2 expression in A549/cis and Pc9/cis cells treated with 2 mug/mL cisplatin for 4, 8, 16, or 24 h. ( e , f ) Western blot assays ( e ) and RT-PCR assays ( f ) were performed to detect the expression of DCBLD2 in A549/cis and Pc9/cis cells with or without pretreatment with MEK/ERK inhibitors for 12 h and cultured in 2 mug/mL cisplatin for another 24 h. ( g ) Schematic of the binding sites of the TF AP-1 (c-Fos/c-Jun heterodimer) in the DCBLD2 promoter. ( h ) Western blot assay was performed to detect the effect of AP-1 on DCBLD2 expression in A549/cis and Pc9/cis cells. Upper panel: A549/cis and Pc9/cis cells were cultured in the presence or absence of T-5224 for 12 h before they were treated with 2 mug/mL cisplatin for another 24 h and then subjected to western blot assay. Lower panel: cells with or without c-Fos or c-Jun siRNA treatment for 8 h were then cultured with 2 mug/mL cisplatin for another 24 h and subjected to western blot assay. ( i , j ) The regulation of DCBLD2 expression by AP-1 was analyzed by ChIP PCR ( i ) and qPCR ( j ) in A5